samayaluca dune field, south of juarez, chihuahua global climate change
TRANSCRIPT

Samayaluca Dune Field, south of Juarez, Chihuahua
Global Climate Change

NMSU Rainfall
-1
0
1
2
3
4
5
6
7
8
9
10
1 20 39 58 77 96 115 134 153 172 191 210 229 248 267 286 305 324 343 362
Days since Jan 1
Cumulative Rainfall (Inches)
2006200520042003
Climate vs. Weather

0
20
40
60
80
100
120
2006 2005 2004 2003 Average
# Days
over 100over 95over 90

0
20
40
60
80
100
120
1 20 39 58 77 96 115 134 153 172 191 210 229 248 267 286 305 324 343 362
Max Temp. (°F)
Days since Jan 1
2006200520042003
Temp
Days since Jan 1

Climate System: 5 parts
• Atmosphere• Ocean• Cryosphere (ice)• Lithosphere• Sun and internal earth heating

Climate System
• Atmosphere– Nitrogen N2 78%
– Oxygen O2 21%
– Argon Ar 0.93%
– Carbon dioxide CO2 0.035%
– Other minor gases 0.035%

Ocean influences climateTransfers of heat from tropics to polar regions
(i.e., Gulf Stream)

Cryosphere: ICE
• Melting ice increases ocean volume
• Sea level was 130 m (425 feet) lower during last ice age (18,000 years ago)
• Ice reflects solar energy: albedo

What is albedo?
• Reflectance of land surface• Earth reflects about 31% of solar energy

Lithosphere
• Mountains influence weather• Arrangement of continents affects ocean
currrents• Volcanism affects composition of
atmosphere

Solar energy input to Earth’s surface is342 W/m2.
Heat flowing out of Earth’sdeep interior is only 0.06 W/m2.


Greenhouse Gases
• CO2, H20 and methane (CH4):
• Absorb and re-radiate radiation• Insulates and raises Earth temperature

Earth Temperature
Normal: 14o C (57o F)
Without greenhouse gases: -19o C (-2o F)


Feedback enhances warming
• Positive Feedback: – Amplifies changes in the system.
– Temperature increase decreases Earth’s albedo by reducing snow and ice cover

Climate Change
Understanding Natural Climate Variability:
Use the geologic record to understand Earth Climate in the past
(Uniformitarianism)

Long-term change can be assessed from ice cores, which record annual cycles of ice formation from snow.
* Cycles can be counted back like tree rings to create a long term record.
* Ice layers trap atmospheric gas, contain isotopic record of temperature change.

Milankovitch cyclesRelated to variations in:
1. Eccentricity2. Tilt of axis3. Precession (wobble)

High eccentricity increases contrast between summer and winter.

Earth’s tilt axis changes over time

Precession


1941

2004

Columbia glacier

Greenland

Greenland


What causes sea level rise?
Melting ice
Hotter oceans are larger volume

Barrier Islands
Sea Level Rise


Sea-Level Rise

1 meter rise 2 meter rise
4 meter rise 8 meter rise

GEOLOGIC RESERVOIRS
Fossilorganiccarbon
Rockcarbonates
Fossil-fuel
burning(5.3 Gt/yr)
OCEAN
Cement production (0.1 Gt/yr)
Land-use change:
deforestation,agriculture(1.7 Gt/yr)
Land uptakeBy new plantgrowth(1.9 Gt/yr)
Ocean uptake by air-sea gas
exchange(1.9 Gt/yr)
Terrestrial biosphere
LAND
ATMOSPHERE
The influence of Carbon on climate change

GEOLOGIC RESERVOIRS
Fossilorganiccarbon
Rockcarbonates
Fossil-fuel
burning(5.3 Gt/yr)
OCEAN
Cement production (0.1 Gt/yr)
Land-use change:
deforestation,agriculture(1.7 Gt/yr)
Land uptakeBy new plantgrowth(1.9 Gt/yr)
Ocean uptake by air-sea gas
exchange(1.9 Gt/yr)
Terrestrial biosphere
LAND
ATMOSPHERE
Human activities releasea total of 7.1 Gt of carbon into the atmosphere each year.
New plant growth andair-sea gas exchangeremove 3.8 Gt/yr,…
…yielding a netatmosphericincrease of3.3 Gt/yr.

Tem
pera
ture
rela
tive t
o p
resen
t clim
ate
(°C
)
Thousands of years before presentR
ela
tive c
arb
on
dio
xid
e a
nd
meth
an
e c
on
cen
trati
on
s
High
Low
Key:TemperatureCO2
Methane
There is a decline in both temperature and greenhouse gas concentrations during glacial periods… …and a rapid
rise duringdeglaciation.
Climate has been relatively warm andstable during the last 10,000 years.

East Antarctic ice core data
Glacial epoch
Interglacial epoch

Is Human-induced climate change
possible?

Years
Temperature
CO2 concentration
The 20th-century is clearly anomalous when compared with the last millennium.
Nort
hern
Hem
isp
here
tem
pera
ture
an
om
aly
(°C
)
CO
2 c
on
cen
trati
on
(p
pm
)

Years
Temperature
CO2
concentration
Glo
bal te
mp
era
ture
an
om
aly
(°C
)
A recent warming trend correlateswith the increase in CO2.
CO
2 c
on
cen
trati
on
(p
pm
)

Atmospheric CO2 Projections Under 3 Alternate Scenarios….
2000 2020 2040 2060 2080 2100
Year

….and Estimated Average Surface Temperatures for Those Scenarios
Uncertainty envelope due to lack of knowledge of climate system
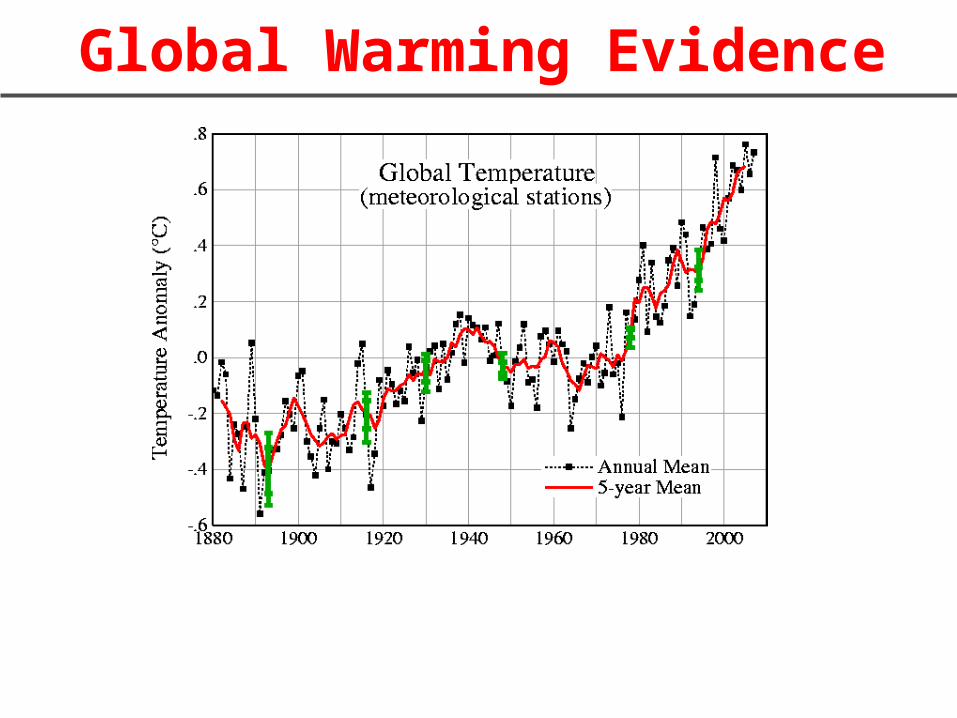
Global Warming Evidence

Global Warming Evidence

Is Global Warming Real?
• 20 years of data:

Is Global Warming Real?
• 130 years of data:

Why is Global Warming ignored?
• Not enough evidence?• Better things to spend money on?• Cutting emissions will hurt the economy

• The EFECTS of climate change might be distant and uncertain
• The COSTS of curbing greenhouse gases are immediate and substantial!

Global Warming
• Small steps can reduce carbon emissions
• These are affordable and multiplied by 100,000,000s of people can be significant

• CO2 is a small part of the atmosphere
• Small increases have huge effects• Greenhouse gases keep earth hot• Natural changes in climate occur• Recent changes correlate to human activity• Changes in lifestyle can avoid catastrophe

Keeling Curve