salzer electronics limited result update presentation q2 ... on - q2fy171.pdf · disclaimer this...
TRANSCRIPT

Salzer Electronics Limited
Result Update PresentationQ2 & H1 FY17

Disclaimer
This presentation has been prepared by Salzer Electronics Limited (the “Company”) solely for information purposes and does not constitute any offer, recommendation or
invitation to purchase or subscribe for any securities, and shall not form the basis or be relied on in connection with any contract or binding commitment what so ever. No
offering of securities of the Company will be made except by means of a statutory offering document containing detailed information about the Company.
This Presentation has been prepared by the Company based on information and data which the Company considers reliable, but the Company makes no representation or
warranty, express or implied, whatsoever, and no reliance shall be placed on, the truth, accuracy, completeness, fairness and reasonableness of the contents of this
Presentation. This Presentation may not be all inclusive and may not contain all of the information that you may consider material. Any liability in respect of the contents
of, or any omission from, this Presentation is expressly excluded.
Certain matters discussed in this Presentation may contain statements regarding the Company’s market opportunity and business prospects that are individually and
collectively forward-looking statements. Such forward-looking statements are not guarantees of future performance and are subject to known and unknown risks,
uncertainties and assumptions that are difficult to predict. These risks and uncertainties include, but are not limited to, the performance of the Indian economy and of the
economies of various international markets, the performance of the industry in India and world-wide, competition, the company’s ability to successfully implement its
strategy, the Company’s future levels of growth and expansion, technological implementation, changes and advancements, changes in revenue, income or cash flows, the
Company’s market preferences and its exposure to market risks, as well as other risks. The Company’s actual results, levels of activity, performance or achievements could
differ materially and adversely from results expressed in or implied by this Presentation. The Company assumes no obligation to update any forward-looking information
contained in this Presentation. Any forward-looking statements and projections made by third parties included in this Presentation are not adopted by the Company and
the Company is not responsible for such third party statements and projections.

Table of Contents
1
2
3
4
Joint Managing Director’s Message
Quarterly Financial Performance
Half Yearly Financial Performance
Business Overview

Joint Managing Director’s Message
“We have witnessed robust growth across all the key business of Industrial Switchgears, Copper Business and Building Segment. In our Energy Management Business revenues have come in purely from Operations & Maintenance. This business has a higher margin as compared to other business segments and will continue to give us Operations & Maintenance revenues in the coming quarters. Currently there are no new orders in this segment but we are very optimistic about the growth prospects of this business.
I am happy to inform that this quarter we have been able to increase revenue share from our high margin Industrial Switchgears business. Contribution from higher margin products in this business has increased leading to better margins overall. We have also seen a good growth in the margins sequentially and expect this trend to continue.
Going forward, we will continue to focus on adding new, niche and high margin products, enter new geography and offer total and customised electrical solutions to our existing and new customers.”
Commenting on the results, Mr. R. Doraiswamy, Joint Managing Director, said :

Quarterly Financial Highlights
5

Key Highlights – Q2 FY17 Vs. Q2 FY16
6
4.7%EBITDARs 11.4 crore
7.2%Profit After TaxRs 5.0 crore
12.5%RevenueRs 91.1 crore
Growth driven by all three key business of Industrial Switchgears, Building Segment and Copper Business
Only O&M revenues from Energy Management Business since it is in the final phase of Invoicing

Quarterly Financial Highlights
Rs. in Crore Q2 FY17 Q2 FY16 YoY % Q1 FY17 QoQ %
Total Income from Operations 91.1 81.0 12.5% 90.1 1.0%
Raw Materials 64.7 55.6 65.2
Employee Cost 4.6 4.5 4.3
Other Cost 10.4 10.0 9.8
Total Expenditure 79.7 70.1 79.3
EBITDA 11.4 10.8 4.7% 10.8 4.6%
EBIDTA margin (%) 12.5% 13.4% (90)bps 12.0% 50 bps
Interest 3.6 2.7 3.4
Depreciation 2.4 2.0 2.3
Other Income 1.5 0.2 0.6
Profit Before Tax 6.9 6.3 5.8
Tax 1.9 1.7 1.2
Profit After Tax 5.0 4.6 7.2% 4.6 7.9%
PAT Margin (%) 5.5% 5.7% (20) bps 5.1% 40 bps
Sequential increase in EBIDTA margins on account of higher margins in Industrial Switchgears business YoY decline in EBIDTA margins on account only O&M revenues from EMS business
7

Segment-wise Breakup of Revenues – Q2 FY17 vs. Q2 FY16
Products Q2 FY17Contribution
(%)Q1 FY17 Q4 FY16 Q3 FY16 Q2 FY16
Contribution(%)
YoY (%)
Industrial Switch Gears 46.6 50.3% 41.8 42.5 43.8 44.5 55.0% 4.7%
Copper Business 33.2 35.9% 43.7 42.1 32.9 26.7 33.0% 24.5%
Energy Management 5.8 6.2% 1.9 9.4 9.8 6.5 8.0% -11.4%
Building Segment 7.0 7.5% 3.4 4.3 4.1 3.2 4.0% 117.5%
Grand Total 92.5 90.7 98.3 90.2 80.9
8

Revenue Breakup – Q2 FY17 vs. Q1 FY17
As per Business Segment
9
Industrial Switchgears
50.3%
Copper Business
35.9%
Energy Managemet
6.2%
Building Segment
7.5%
Industrial Switchgears
46.0%
Copper Business
48.1%
Energy Managemet
2.1%
Building Segment
3.8%
Q1 FY17Q2 FY17

Revenue Breakup – Q2 FY17 vs. Q1 FY17
As per Geography
10
India 82.4%
Europe 3.3%
North & South
America 2.4%
Asia Including Australia
10.4%
M.E/Africa 1.4%
India 82.4%
Europe 4.3%
North & South
America 3.9%
Asia Including Australia
7.3%
M.E/Africa 2.1%
Q1 FY17Q2 FY17
Recent Developments
11
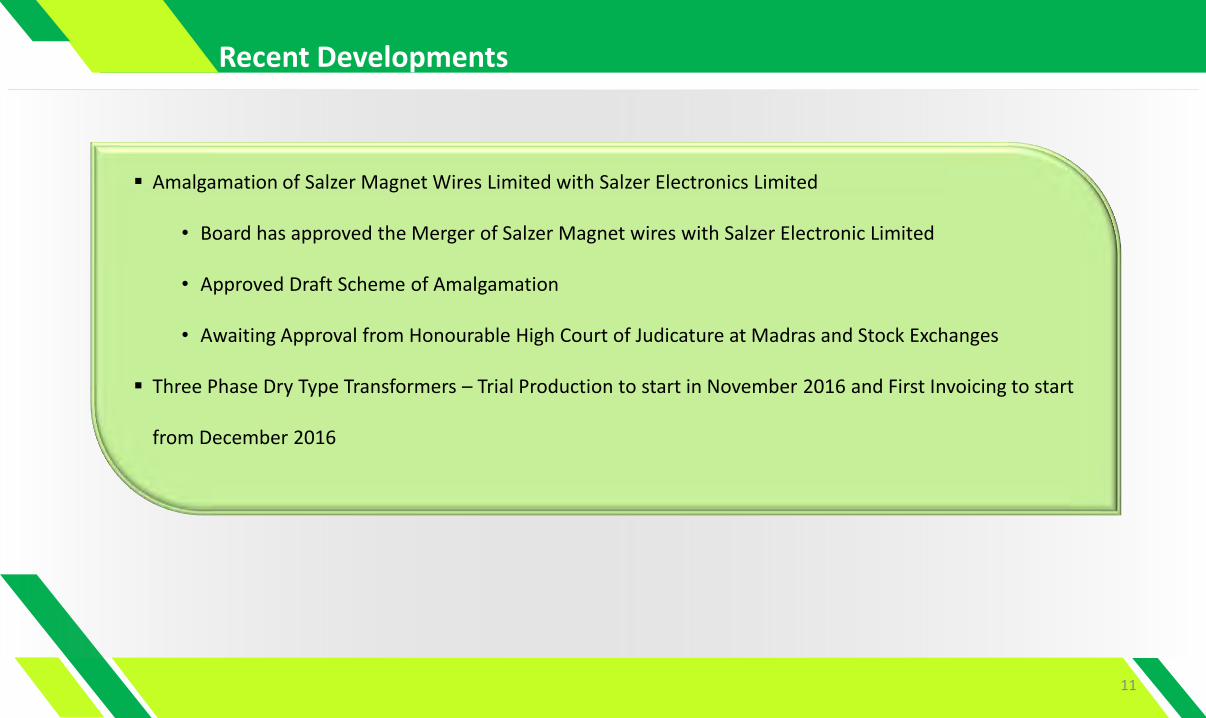
Amalgamation of Salzer Magnet Wires Limited with Salzer Electronics Limited
• Board has approved the Merger of Salzer Magnet wires with Salzer Electronic Limited
• Approved Draft Scheme of Amalgamation
• Awaiting Approval from Honourable High Court of Judicature at Madras and Stock Exchanges
Three Phase Dry Type Transformers – Trial Production to start in November 2016 and First Invoicing to start
from December 2016

Half Yearly Financial Highlights
12

Key Highlights – H1 FY17 Vs. H1 FY16
13
(4.5)%EBITDARs 22.2 crore
(1.1)%Profit After TaxRs 9.6 crore
5.3%RevenueRs 181.2 crore
Growth driven by all three key business of Industrial Switchgears, Building Segment and Copper Business
Only O&M revenues from Energy Management Business
Decline in EBIDTA on account of lower contribution from higher margin EMS business

Half Yearly Financial Highlights
Rs. in Crore H1 FY17 H1 FY16 YoY %
Total Income from Operations 181.2 172.1 5.3%
Raw Materials 129.9 120.0
Employee Cost 8.9 8.5
Other Cost 20.2 20.4
Total Expenditure 159.0 148.9
EBITDA 22.2 23.2 (4.5)%
EBIDTA margin (%) 12.3% 13.5% (120) bps
Interest 6.9 6.9
Depreciation 4.8 4.0
Other Income 2.1 0.7
Profit Before Tax 12.6 13.1
Tax 3.1 3.4
Profit After Tax 9.6 9.7 (1.1)%
PAT Margin (%) 5.3% 5.6% (30) bps
14

Rs. in Crore Sep -16 Sep-15
Shareholder’s Funds 204.2 189.8
Share Capital 13.9 13.5
Money Against Warrants 0.0 3.9
Reserves & Surplus 190.4 172.4
Share application money allotment 3.0 0.0
Non-Current Liabilities 21.8 21.6
Long Term Borrowings 17.1 18.2
Defer Tax Liabilities 4.3 2.6
Other Long-Term Liabilities 0.0 0.0
Long Term Provision 0.5 0.6
Current Liabilities 167.4 155.7
Short Term Borrowings 94.1 82.6
Trade Payables 29.6 29.5
Other Current Liabilities 41.0 40.9
Short-Term Provisions 2.7 2.8
Total Equities & Liabilities 396.5 367.1
Rs. in Crore Sep -16 Sep -15
Non-Current Assets 142.2 100.1
Fixed Assets 115.9 94.4
Non-Current Investments 5.3 4.9
Long-Term Loans & Advances 1.1 0.9
Other Non-Current Assets 19.9 0.0
Current Assets 254.3 267.0
Current Investments 5.5 21.0
Inventories 77.9 70.9
Trade Receivables 97.9 107.0
Cash & Cash Equivalents 13.5 19.4
Short-Term Loans & Advances 50.3 39.0
Other Current Assets 9.3 9.6
Total Assets 396.5 367.1
Balance Sheet Highlights- September 16
15

Annual Financial Highlights
Rs. in Crore FY16 FY15 YoY %
Total Income from Operations 361.1 283.3 27.5%
Raw Materials 256.6 195.9
Employee Cost 17.7 15.5
Other Cost 44.0 36.4
Total Expenditure 318.2 247.9
EBITDA 42.9 35.5 21.0%
EBIDTA margin (%) 11.9% 12.5% (60) bps
Interest 13.1 12.3
Depreciation 8.3 7.1
Other Income 2.8 1.0
Profit Before Tax 24.2 17.0
Tax 7.2 5.0
Profit After Tax 17.0 11.9 42.2%
PAT Margin (%) 4.7% 4.2% 50 bps
16

Rs. in Crore Mar -16 Mar -15
Shareholder’s Funds 195.4 107.1
Share Capital 13.6 10.3
Money Against Warrants 4.1 -
Reserves & Surplus 177.6 96.8
Non-Current Liabilities 22.3 22.8
Long Term Borrowings 17.7 17.6
Defer Tax Liabilities 3.9 1.9
Other Long-Term Liabilities 0.0 2.5
Current Liabilities 157.6 144.3
Short Term Borrowings 81.3 75.0
Trade Payables 32.9 27.1
Other Current Liabilities 35.5 36.7
Short-Term Provisions 7.9 5.5
Total Equities & Liabilities 375.4 275.1
Rs. in Crore Mar -16 Mar -15
Non-Current Assets 136.0 89.2
Fixed Assets 110.4 83.4
Non-Current Investments 5.5 4.9
Long-Term Loans & Advances 0.9 0.7
Other Non-Current Assets 19.3 0.2
Current Assets 239.4 186.0
Current Investments 12.0 0.8
Inventories 66.7 66.1
Trade Receivables 99.8 77.9
Cash & Cash Equivalents 12.5 9.0
Short-Term Loans & Advances 38.8 22.9
Other Current Assets 9.5 9.3
Total Assets 375.4 275.1
Balance Sheet Highlights
17

18
Business Overview
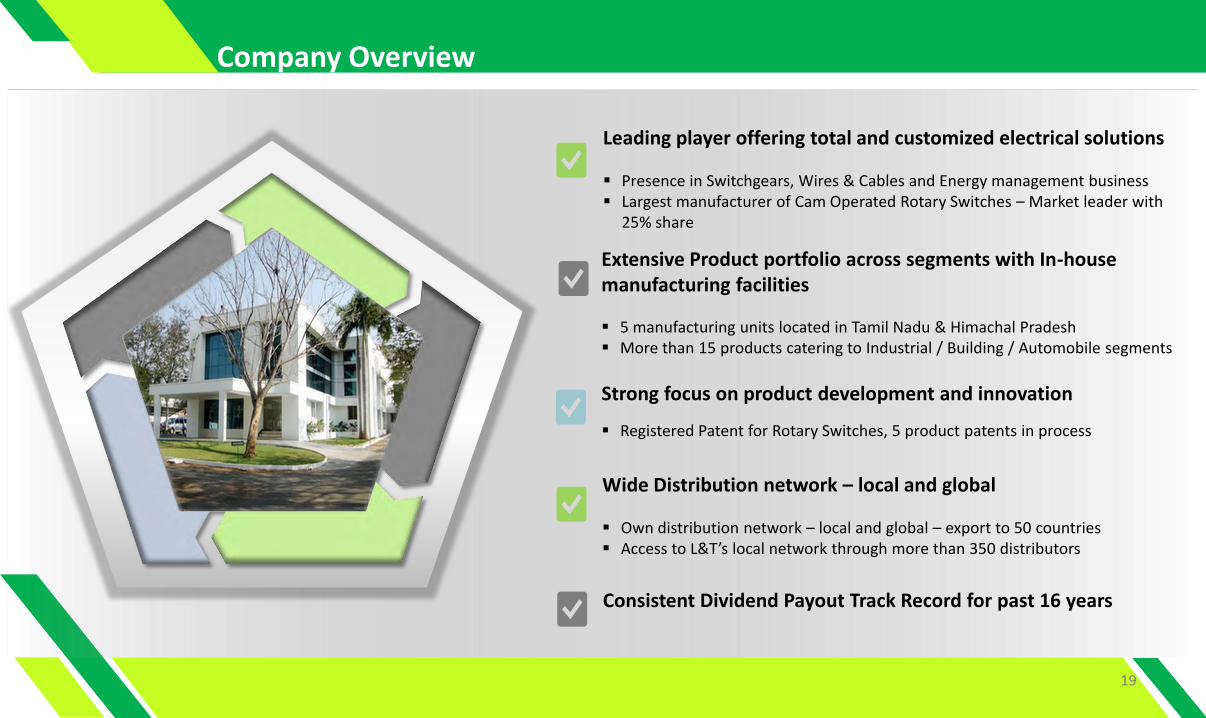
Company Overview
Leading player offering total and customized electrical solutions
Presence in Switchgears, Wires & Cables and Energy management business Largest manufacturer of Cam Operated Rotary Switches – Market leader with
25% share
Extensive Product portfolio across segments with In-house manufacturing facilities
5 manufacturing units located in Tamil Nadu & Himachal Pradesh More than 15 products catering to Industrial / Building / Automobile segments
Strong focus on product development and innovation
Registered Patent for Rotary Switches, 5 product patents in process
Wide Distribution network – local and global
Own distribution network – local and global – export to 50 countries Access to L&T’s local network through more than 350 distributors
Consistent Dividend Payout Track Record for past 16 years
19

From a Single Product Company…
… to manufacturing multiple products across sectors
1985
1991-95
2001-06
Established to manufacture of CAM
operated Rotary Switches
Technical collaboration with Plitron for
manufacture of Toroidal Transformers
1st Indian company to bring technology to India
Unit I (Coimbatore) –manufacture contactors,
relays, panels, energy savers
Starting of long term association with L&T
Unit III - manufacture modular switches
Started Wire & Cable manufacturing for L&T
Foray into tailor made products and branding
for large customers
Specialized panels for OEMs
2010-14
Leading player offering total and customized electrical solutions
More than 15 different products
2,000 employees 5 manufacturing units
20

Business Overview
Building segment Business
Modular Switches Wires & Cables MCB’s (Under Development) Changeovers
Copper Business
Wires & Cables Flexible Bus Bars Enamelled Wires Bunched Conductors Tinned Copper Wires
Industrial Switch Gear Business
Transformers Terminal Blocks Rotary Switches Isolators General Purpose relays Wiring Ducts MPCB’s Contactors & OLR’s Control Panels
Energy ManagementBusiness
Energy Savers Street Light Controllers
21

Key Business Strengths
Wide Product Suite
Amongst few players in India, to offer total & customized electrical solutions
Wide product basket – 15 products developed in-house Largest manufacturer and market leader in CAM operated rotary
switchesComplete Backward Integration
In-house manufacturing facilities with process capabilities ensures better product development and customization
Well developed R&D enables continual product innovation
Advanced Engineering Capabilities
Strong engineering capabilities backed by in-house manufacturing and R&D team
Technical collaboration with Plitron for Toroidal transformers – 1st company to bring technology to India, Joint Venture with C3Controls for contactors and relays
Resulting in all products been international certified and universal acceptance
Strong Customer Relationships
Strong customer relationships across the world Preferred supplier to GE, Schneider and only approved supplier of
Nuclear Power Corporation Largest supplier of rotary and load break switches to Indian
Railways Wide Distribution Network
Wide distribution network – international and domestic Tie up with L&T – access to over 350 dealers in India; own network for
modular switches with 50 stockist in 4 southern & western states Direct network across 50 countries with 40 international distributors
22

23
Wide Product SuiteProducts Features
Rotary Switches
6A to 400 Amps > 2500 ranges UL & CB Tested
Isolators (Dis-connectors)
16 to 250 Amps UL 50 rated Enclosed mounting Changeover Switches DC – PV Isolators CB Tested
Contactors
16 to 250 Amps UL 50 rated Enclosed mounting Changeover Switches DC – PV Isolators CB Tested
Terminals 2.5 to 95 sq mm Screw-less Terminals All Accessories UL Listed
Wiring Ducts More than 75 sizes India’s largest RoHS and Halogen Free Ducts
UL and CSA Listed
Toroidal Transformers
15va to 60 Kva 1 and 3 Phase Custom built Assemblies Wide CT Range UL Listed
23

24
Products Features
Control Relays
Wire Harnesses
Wires & Cables
Flexible Bus Bars
Enamelled Wires
MPCBs
Plug-in, PCB and Solder type 1 Amp to 100 Amps
Two Frames 0.1 amps to 63 Amps Type F Co-ordinated UL Listed
Upto 1000 Amps Only Manufacturer in India UL LIsted
From 0.5- 240 Sq mm Single & Multi Core FR, FRLS, Halogen Free UL Listed
0.3 to 3 mm (9-29 AWG) Upto 200 Deg Cent UL Listed
Wide Product Suite
24

In-house manufacturing and R&D enables superior customization of products
CT’s
Terminal Socket
Coils / Inductors
Panels
Wide Product Suite- Customised for OEM’s
25

Future Growth Drivers
Growth and expansion of existing product segments
Margin improvement through Increase sales of high margin products – existing and new Increase exports – fast growing markets of US, Africa and Middle East
Venture into new project/ product development
Venture into new project/ product development
26

27
Future Growth Drivers- Expansion in Existing Product Range
Toroidal Transformer
Contactors & Overload Relays
Railway Business
Tie up with C3 Controls, US – leading player in electrical switch gears in US Product developed and under validation with UL Will target US and Asia as key markets Rs. 4 cr business already done in this financial year
Innovated ‘Fuse Change over system’ for railway signalling division Designed new product – Track Feed Battery System’ for changing over battery chargers in
railway track feeding system
Collaboration with Plitron Manufacturing, Canada Developed inductors & chokes using aluminium wires which finds application in large UPS New customers – other UPS manufacturers
Product developed and Invoicing started Very good potential for this product in Australasia region Our switches – best available in market, exporting good volume to Europe & US Due to lower costs – can compete with good quality high cost European & low price
Chinese manufacturers
DC Load Break Switches (PV)
27

28
Future Growth Drivers- Proposed New Projects/ Product Development
High tech product with application in large MW UPS, renewable energy business,
railways, power generation and marine industry
Expected CAGR of 35% over next 5 years
Technical alliance signed with Trafomodern an Austrian company - one of leading
manufacturers of transformers in Europe
Widely used in electronic units for power conditioning, power factor correction,
motor starter application, smoothing, filtering, bypassing etc
Increasing need across industries as it saves energy
IEEMA estimates market to grow at 30% CAGR from Rs 750 Cr
Three Phase Dry Type Transformer
Capacitors
28

29
Future Growth Drivers- Energy Management Business
Only manufacturer in India: Energy savers Street light controllers
CRISIL rated Grade I ESCO Operator for street lighting
Significant opportunity in power starved country
Successfully implemented for: Madurai Corporation Coimbatore Corporation Navi Mumbai Corporation Tirupur Corporation Erode Corporation Vellore Corporation
In talks with other states to incorporate energy savers and street light controllers
29

30
For further information, please contact:
Company : Investor Relations Advisors :
Salzer Electronics Ltd.CIN: L03210TZ1985PLC001535
www.salzergroup.net
Bridge Investor Relations Pvt. Ltd.CIN: U74900MH2016PTC273679
Mr. Rahul [email protected]
www.bridge-ir.com