salt reduction - madison metropolitan sewerage district · 20% 50% 31% reduction (739 lbs /40,000...
TRANSCRIPT

Salt Reduction
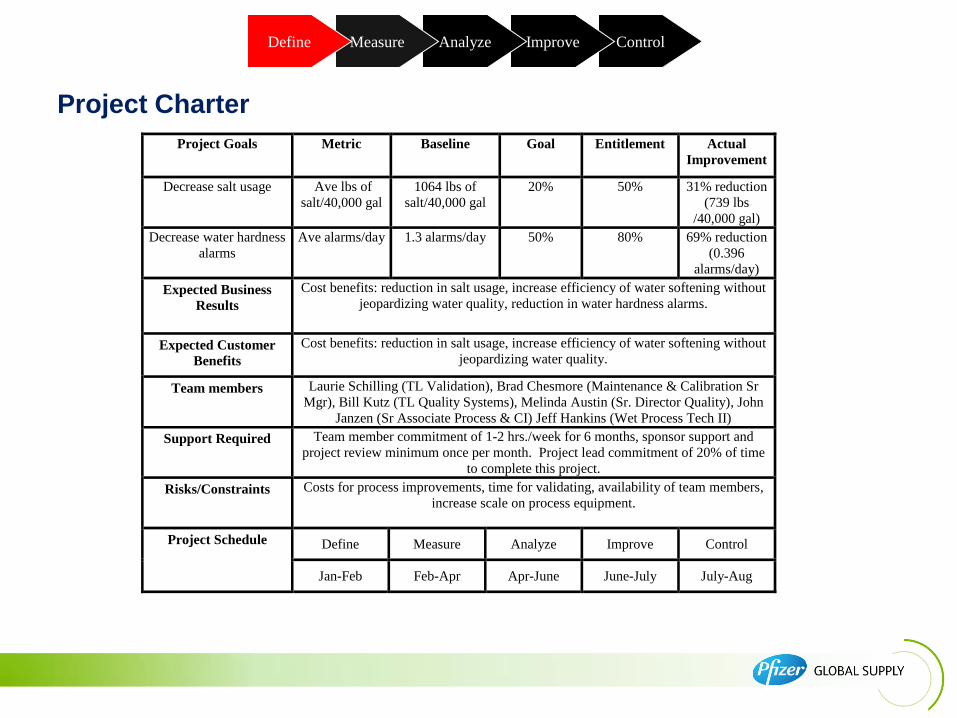
Project Charter
Project Goals Metric Baseline
Goal Entitlement Actual
Improvement
Decrease salt usage Ave lbs of
salt/40,000 gal
1064 lbs of
salt/40,000 gal
20% 50% 31% reduction
(739 lbs
/40,000 gal)
Decrease water hardness
alarms
Ave alarms/day 1.3 alarms/day 50% 80% 69% reduction
(0.396
alarms/day)
Expected Business
Results
Cost benefits: reduction in salt usage, increase efficiency of water softening without
jeopardizing water quality, reduction in water hardness alarms.
Expected Customer
Benefits
Cost benefits: reduction in salt usage, increase efficiency of water softening without
jeopardizing water quality.
Team members Laurie Schilling (TL Validation), Brad Chesmore (Maintenance & Calibration Sr
Mgr), Bill Kutz (TL Quality Systems), Melinda Austin (Sr. Director Quality), John
Janzen (Sr Associate Process & CI) Jeff Hankins (Wet Process Tech II)
Support Required Team member commitment of 1-2 hrs./week for 6 months, sponsor support and
project review minimum once per month. Project lead commitment of 20% of time
to complete this project.
Risks/Constraints Costs for process improvements, time for validating, availability of team members,
increase scale on process equipment.
Project Schedule Define Measure Analyze Improve Control
Jan-Feb Feb-Apr Apr-June June-July July-Aug
Control Improve Analyze Measure Define

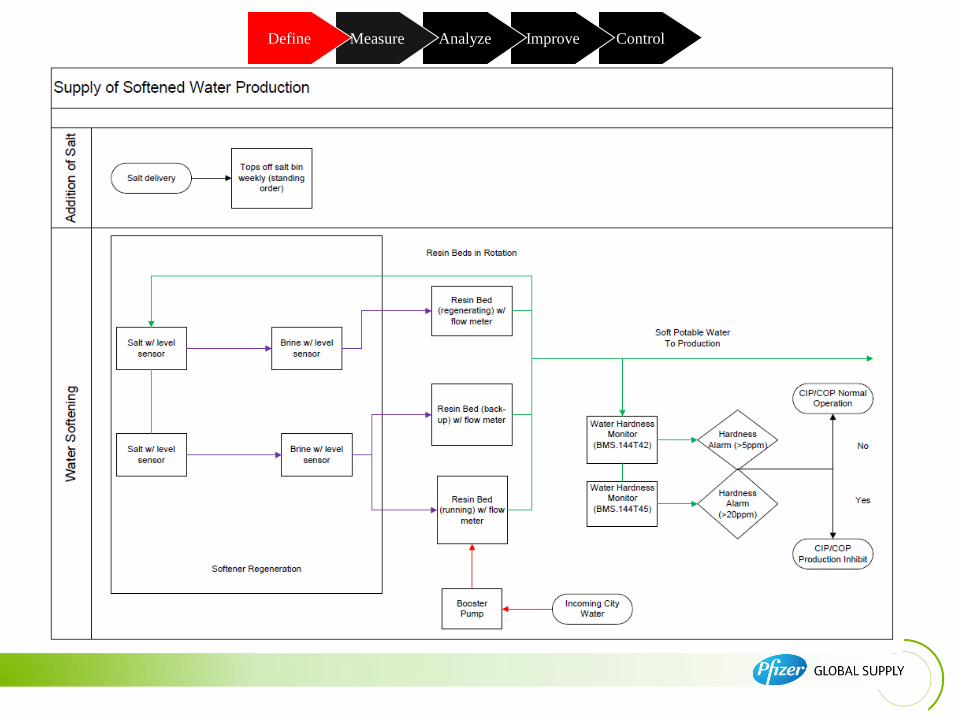
Customers
Soft water
provided to plant
Outputs Process Inputs Suppliers
Start Stop
City of Madison
Equipment (Salt Bins &
Brine Tanks, Resin
Beds)
Total Water
Salt Usage
Softened Water
Water
supply
Water to
Production Brine
tanks Salt bins
Resin
beds
Incoming Water
Hardness
Quality
Water
Hardness
Monitor
Alarms
Maintenance
Monitoring Setpoints
set by
Production/Quality
Production
Regenerations set
by Maintenance
SOP-, General
Maint. & Monitoring-
Water Systems
Waste (Brine)
Engineering
Nalco
Salt Usage
SIPOC
Control Improve Analyze Measure Define
Control Improve Analyze Measure Define
Control Improve Analyze Measure Define
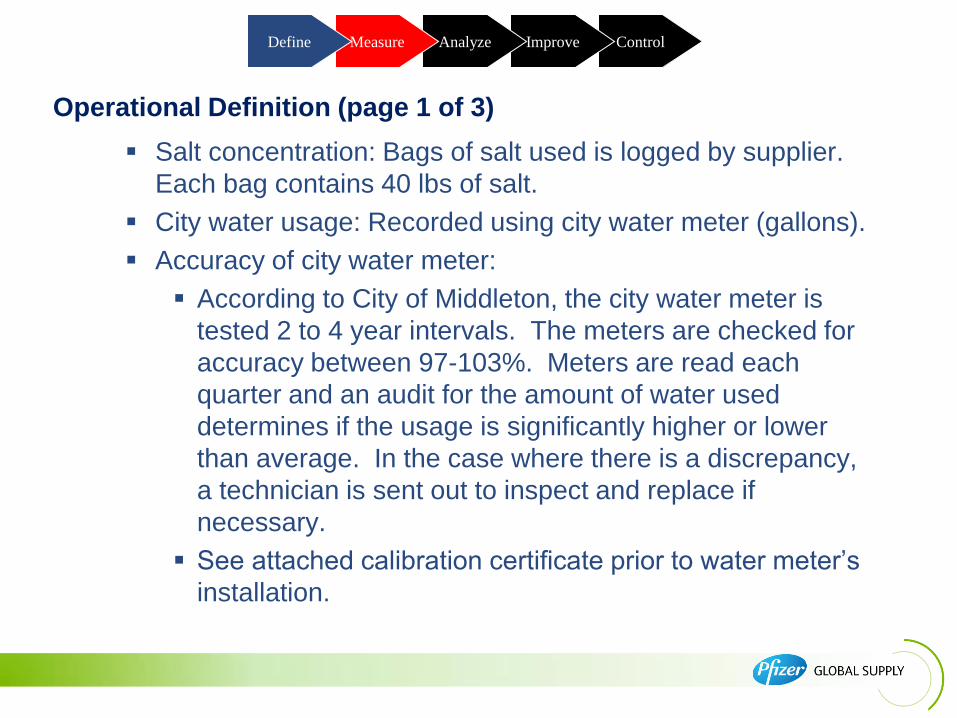
Salt concentration: Bags of salt used is logged by supplier.
Each bag contains 40 lbs of salt.
City water usage: Recorded using city water meter (gallons).
Accuracy of city water meter:
According to City of Middleton, the city water meter is
tested 2 to 4 year intervals. The meters are checked for
accuracy between 97-103%. Meters are read each
quarter and an audit for the amount of water used
determines if the usage is significantly higher or lower
than average. In the case where there is a discrepancy,
a technician is sent out to inspect and replace if
necessary.
See attached calibration certificate prior to water meter’s
installation.
Operational Definition (page 1 of 3)
Control Improve Analyze Measure Define
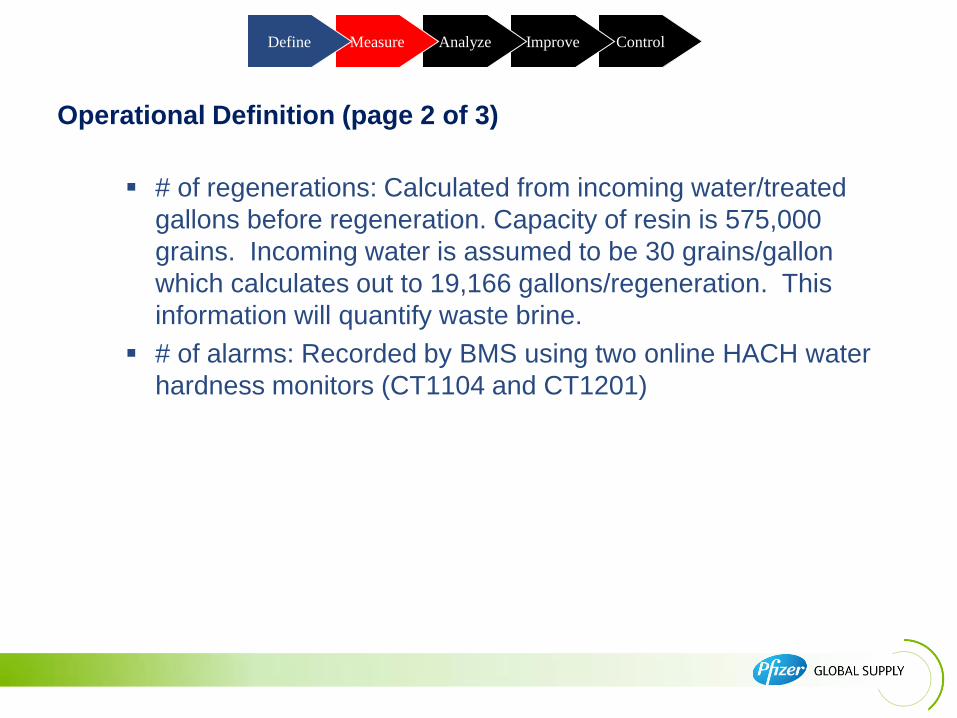
# of regenerations: Calculated from incoming water/treated
gallons before regeneration. Capacity of resin is 575,000
grains. Incoming water is assumed to be 30 grains/gallon
which calculates out to 19,166 gallons/regeneration. This
information will quantify waste brine.
# of alarms: Recorded by BMS using two online HACH water
hardness monitors (CT1104 and CT1201)
Operational Definition (page 2 of 3)

Control Improve Analyze Measure Define
• Online water hardness monitors
• Calibration of monitors performed monthly using two
standards, 0ppm and 10,000ppm. Water hardness
monitors are currently set to alarm at 5ppm and 20ppm.
• Conducted study where high standard was diluted to
level above alarm limits 5 and 20ppm.
• Two test solutions were prepared with a hardness level
of 10ppm and 30ppm. 10ppm solution was injected into
the monitor with the 5ppm alarm limit and the 30ppm
solution was injected into the monitor with the 20ppm
alarm limit.
• 5ppm water hardness monitor alarmed at 10ppm.
20ppm water hardness monitor alarmed at 30ppm.
• Noted it took 5-10 minutes after removal of test solutions
before alarms cleared themselves. Currently alarm delay
set to only 2 minutes.
Operational Definition (page 3 of 3)
Control Improve Analyze Measure Define
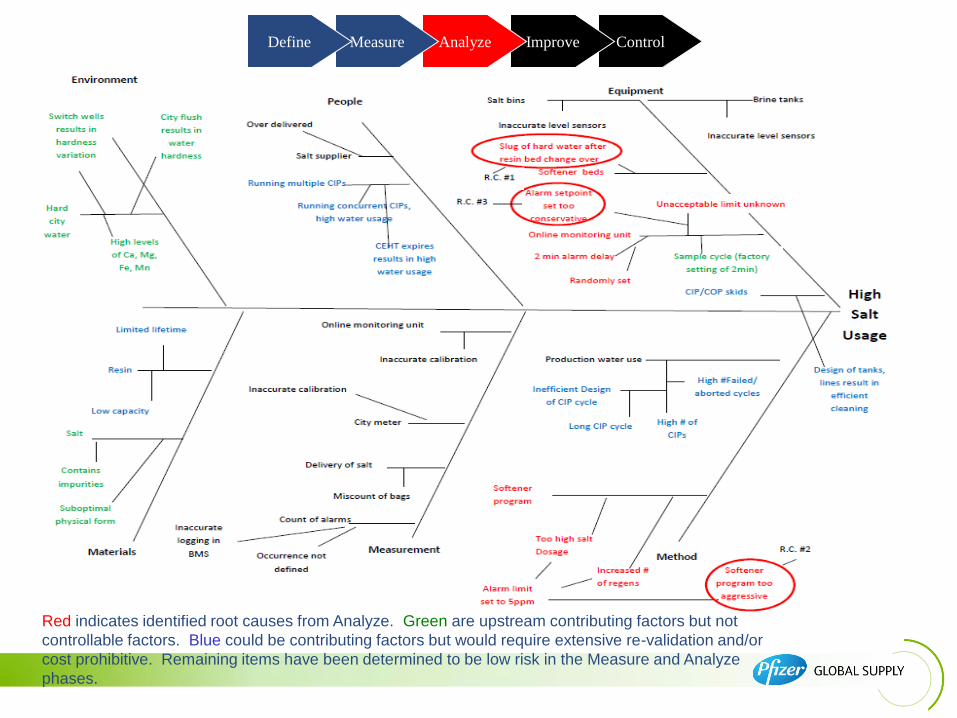
Cause and Effect Analysis (High Salt Usage)
Red indicates identified root causes from Analyze. Green are upstream contributing factors but not
controllable factors. Blue could be contributing factors but would require extensive re-validation and/or
cost prohibitive. Remaining items have been determined to be low risk in the Measure and Analyze
phases.

Control Improve Analyze Measure Define
Causal Tree for Alarms
RC #1
Results from Causal Tree indicate the potential cause for water hardness alarms was due to a slug of hard
water between resin bed change overs and the time necessary to remove the slug. Root cause #3, alarm
setpoint set too low will be addressed in slide #35.
RC #3
Root Cause #1: Slug of Hard Water After Resin Bed Change Over
Control Improve Analyze Measure Define
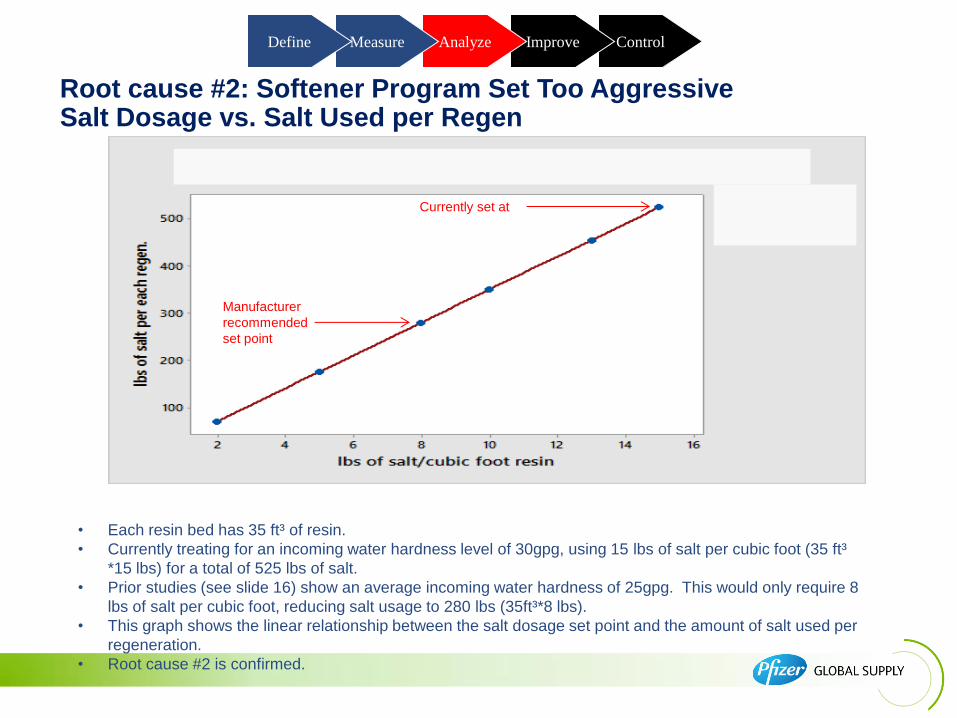
• Each resin bed has 35 ft³ of resin.
• Currently treating for an incoming water hardness level of 30gpg, using 15 lbs of salt per cubic foot (35 ft³
*15 lbs) for a total of 525 lbs of salt.
• Prior studies (see slide 16) show an average incoming water hardness of 25gpg. This would only require 8
lbs of salt per cubic foot, reducing salt usage to 280 lbs (35ft³*8 lbs).
• This graph shows the linear relationship between the salt dosage set point and the amount of salt used per
regeneration.
• Root cause #2 is confirmed.
Currently set at
Manufacturer
recommended
set point
Root cause #2: Softener Program Set Too Aggressive Salt Dosage vs. Salt Used per Regen

Control Improve Analyze Measure Define
• Study Y2016031, Determining Scale Forming Water Hardness Level, concluded that at a low concentration of CIP
100, no hard water scale was observed at ≤ 11gpg or 188ppm.
• The alarm hardness set point on the water hardness monitor is currently set to <1 gpg or 5ppm.
• Root cause #3, alarm setpoint set too conservatively is confirmed.
Initial Hardness
(gpg)
CIP 100 (mS) Final Hardness
(gpg)
Precipitate
(Yes / No)
5 5.2 4 No
6 5.2 6 No
7 5.2 7 No
9 5.0 9 No
11 5.1 10 No
12 5.0 12 Yes
13 5.1 13 Yes
14 5.1 13 Yes
Root cause #3: Alarm Setpoint Set Too Conservatively Water Hardness Level Test Results

Control Improve Analyze Measure Define
Summary of Analyze Phase
1. Slug of hard water after resin bed change over
• Investigation of hard water alarm events determined a slug of hard water caused by resin bed switchovers was the main contributing factor.
2. Softener program too aggressive
• Salt Dosage
• Currently using an average of 1785 lbs of salt a day. (3.4 regens* 525 lbs).
• Based on the manufacturer’s recommendation, this could be reduced to 952 lbs of salt a day (3.4 regens * 280 lbs).
• Grains of hardness treated
• Currently producing 19,166 gallons of water before regeneration.
• This could be increased to 23,000 gallons of water.
3. Alarm setpoint set too conservatively
• Because the alarm set point on the water hardness monitor is set to 5ppm, softeners are set to produce soft water not exceeding 1 gpg.
• Study shows 11gpg or 188ppm is acceptable.

Plan for Improvement Phase
RC ID Root Cause Description Solution ID and Solution Description
1 Slug of hard water after
resin bed change over
1a: Increase alarm delay from 2 to 10 minutes
1b: Shorten sample line to water hardness monitor
2 Softener program set too
aggressively
2a: Decrease salt dosage from 15 to 8 lbs
2b: Decrease grains treated from 30 to 25 gpg
3 Alarm setpoint set too
conservatively
3a. Raise alarm setpoint from 5 to 100ppm
Control Improve Analyze Measure Define
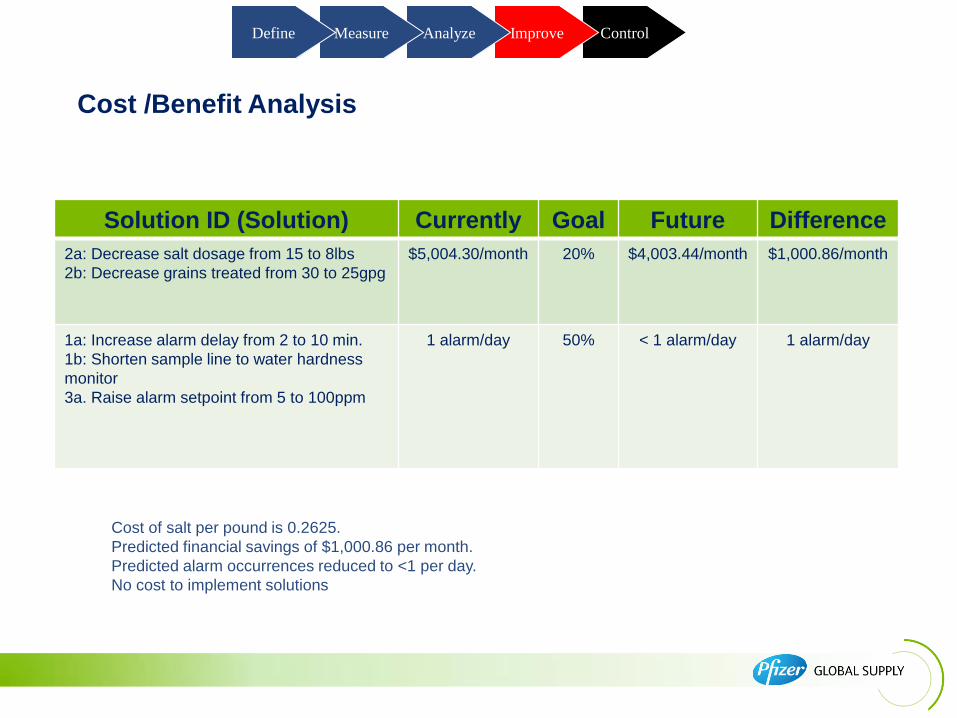
Cost /Benefit Analysis
Control Improve Analyze Measure Define
Solution ID (Solution) Currently Goal Future Difference
2a: Decrease salt dosage from 15 to 8lbs
2b: Decrease grains treated from 30 to 25gpg
$5,004.30/month 20% $4,003.44/month $1,000.86/month
1a: Increase alarm delay from 2 to 10 min.
1b: Shorten sample line to water hardness
monitor
3a. Raise alarm setpoint from 5 to 100ppm
1 alarm/day 50% < 1 alarm/day 1 alarm/day
Cost of salt per pound is 0.2625.
Predicted financial savings of $1,000.86 per month.
Predicted alarm occurrences reduced to <1 per day.
No cost to implement solutions
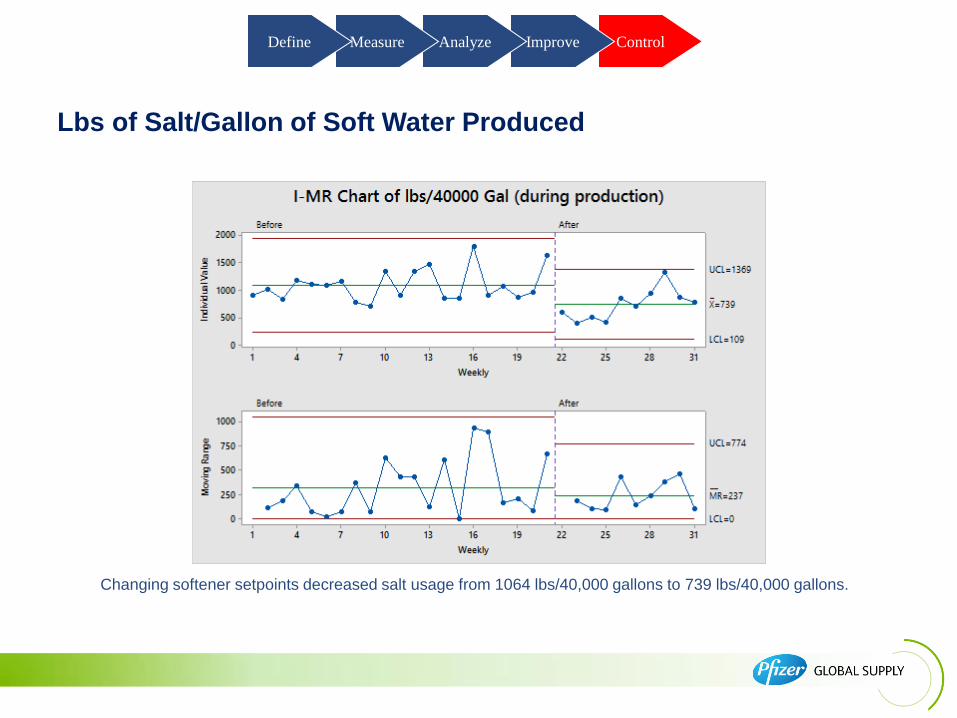
Lbs of Salt/Gallon of Soft Water Produced
Control Improve Analyze Measure Define
Changing softener setpoints decreased salt usage from 1064 lbs/40,000 gallons to 739 lbs/40,000 gallons.
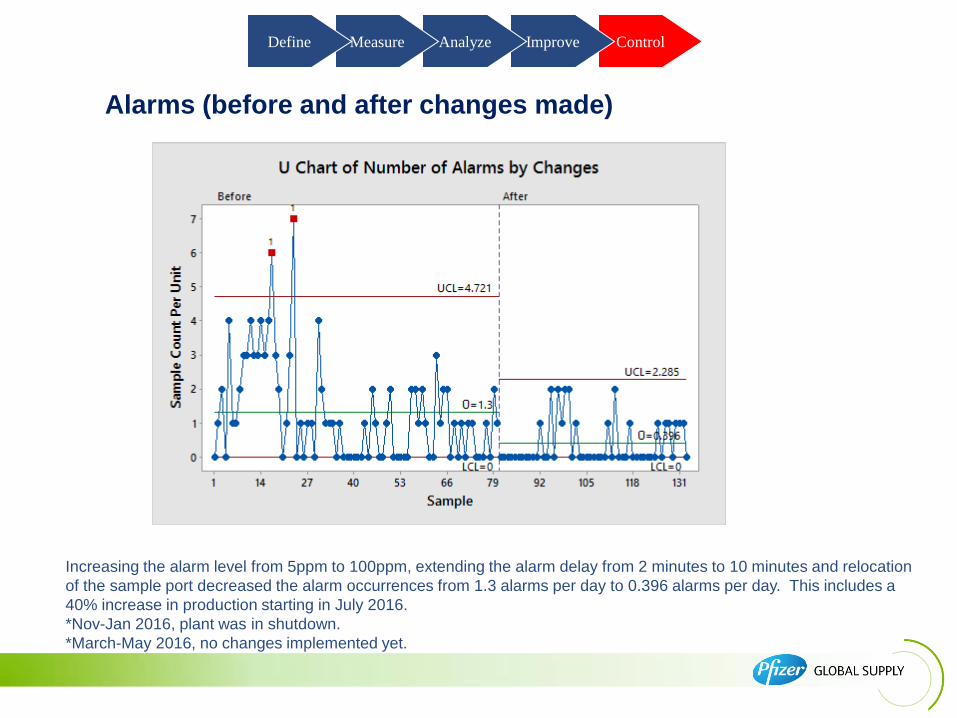
Alarms (before and after changes made)
Control Improve Analyze Measure Define
Increasing the alarm level from 5ppm to 100ppm, extending the alarm delay from 2 minutes to 10 minutes and relocation
of the sample port decreased the alarm occurrences from 1.3 alarms per day to 0.396 alarms per day. This includes a
40% increase in production starting in July 2016.
*Nov-Jan 2016, plant was in shutdown.
*March-May 2016, no changes implemented yet.
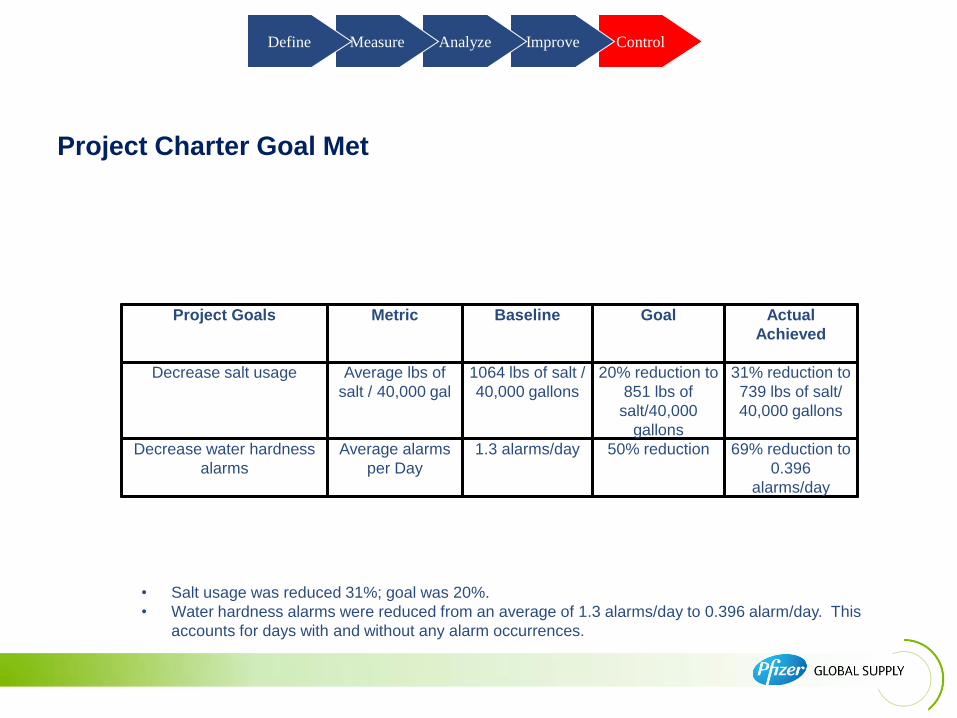
Project Charter Goal Met
Control Improve Analyze Measure Define
Project Goals Metric Baseline Goal Actual
Achieved
Decrease salt usage Average lbs of
salt / 40,000 gal
1064 lbs of salt /
40,000 gallons
20% reduction to
851 lbs of
salt/40,000
gallons
31% reduction to
739 lbs of salt/
40,000 gallons
Decrease water hardness
alarms
Average alarms
per Day
1.3 alarms/day 50% reduction 69% reduction to
0.396
alarms/day
• Salt usage was reduced 31%; goal was 20%.
• Water hardness alarms were reduced from an average of 1.3 alarms/day to 0.396 alarm/day. This
accounts for days with and without any alarm occurrences.

Brine Recovery System
An Additional Salt Use Reduction Project

Regeneration-Initial Step

Regeneration-Recovery Step
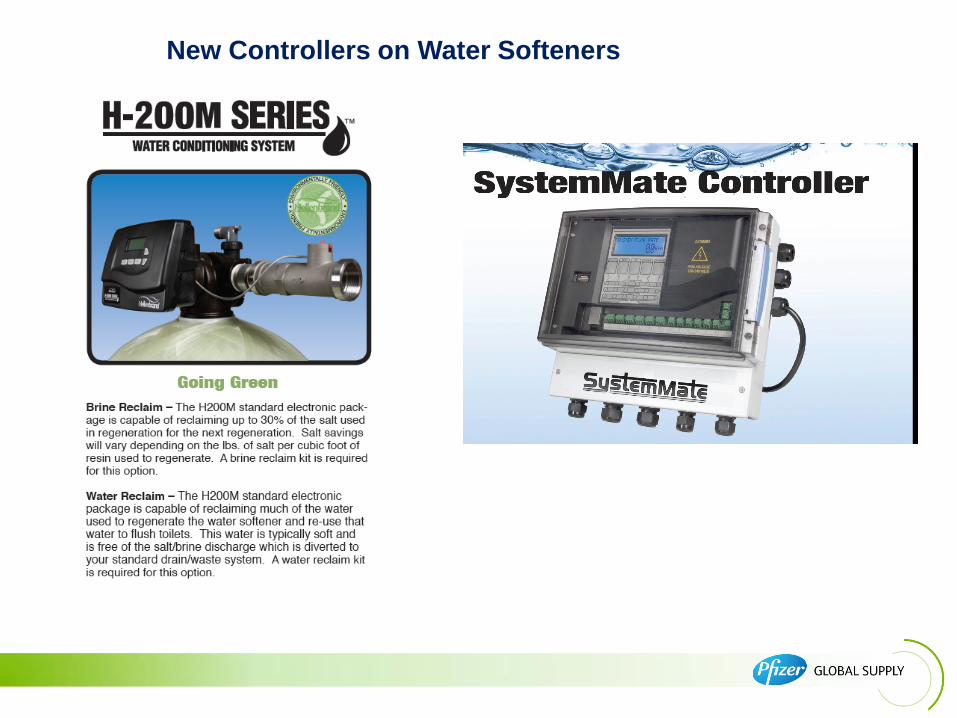
New Controllers on Water Softeners
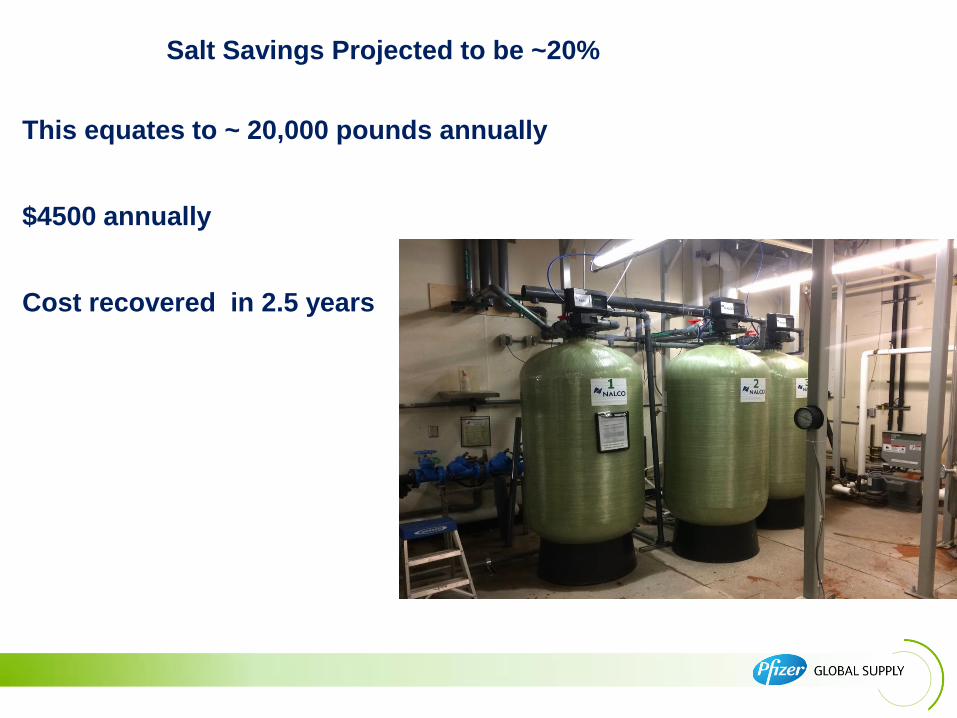
Salt Savings Projected to be ~20%
This equates to ~ 20,000 pounds annually $4500 annually Cost recovered in 2.5 years