salsea-merge workshop on digital scale reading methodology, 4 workshop report.pdf · workshop on...
TRANSCRIPT

SALSEA-Merge
Workshop on Digital Scale Reading Methodology,
Trondheim, Norway, 8th to 10th September 2008
1

2
Contents Introduction ............................................................................................................................................ 3
Participants ............................................................................................................................................. 3
Background ............................................................................................................................................. 3
Methods .................................................................................................................................................. 4
Mounting of scales .............................................................................................................................. 5
Image processing ................................................................................................................................ 5
Image analysis ..................................................................................................................................... 6
Storing the data .................................................................................................................................. 6
Data analysis ........................................................................................................................................... 9
Obtaining monthly growth rates of post‐smolts ................................................................................ 9
Determination of growth indices from scale readings ....................................................................... 9
Priority of data and distribution of work .......................................................................................... 10
Scale image library ................................................................................................................................ 11
References ............................................................................................................................................ 12
Appendix 1. Agenda for the Workshop................................................................................................. 13
Appendix 2. Scale rolling procedure used by Kevin Friedlands laboratory .......................................... 14
Appendix 3. Scale Image Analysis Procedure used by Kevin Friedlands laboratory ............................. 18

3
Introduction As a part of the SALSEA-Merge project, scales of post-smolts of Atlantic salmon collected at the cruises as well as historical scale material of adult salmon from several rivers will be analysed by a new scale reading technique, developed in American laboratories. Recent developments in digital analysis hardware and software have resulted in a significant advance in this area. Analyses will be conducted in four leading European laboratories, and appropriate equipment and software are about to be installed in these laboratories. The first requirement in analysing these scale collections and comparing results between countries is to ensure the use of standardized scale analysis procedures between laboratories. The objectives of this workshop was to train on the proper use of scale analysis while following agreed-upon standardized procedures, and to ensure that results from scale analysis equipment in the four laboratories is comparable. Kevin Friedland, who is an expert in this field, was invited to the workshop to demonstrate the use of the new equipment, and to train researchers from the four laboratories.
Participants Kevin Friedland USA Niall O’Maoileidigh Ireland Kate Thomas Ireland Ciar O’Toole Ireland Jaakko Erkinaro Finland Jorma Kuusela Finland Teuvo Niva Finland Jari Haantie Finland Sigurður Már Einarsson Iceland Carlos Garcia de Leaniz UK Jens Christian Holst Norway Peder Fiske Norway Gunnel Østborg Norway Jan Gunnar Jensås Norway Arne Johan Jensen Norway (chairman)
Background Scales are used to determine the age at which Atlantic salmon leave their river of origin (smolt age), and also to estimate the time it spent at sea. The difference in spacing between the circuli (growth rings) indicate growth rate. Wider spacings develop during summer growth, while more densely set circuli develop during the winter. Smolt age of Atlantic salmon from northern rivers is generally higher than in rivers farther to the south. Salmon from the west, mid and north Norway, as well as Icelandic and Russian salmon usually stay 3-5 years in fresh water before they smolt, while those originating from south Norway and
4
southwest Sweden are two or more years. Smolts from UK, Ireland, France, Spain and Portugal are usually one or two years of age. Thus, smolt age determined from scales of post smolt and adult Atlantic salmon caught at sea may contribute significantly in revealing the origin of the fish, for example the age structure of the salmon post smolts from the trawl captures in the Norwegian Sea strongly suggests that most of these fish are of southern origin (Holm et al. 2004). Traditionally salmon scales were only used to estimate age and annual growth rate. Recent developments in digital analysis have resulted in substantial advances in the area. With this novel equipment, the number of circuli established each year and the spacing between the circuli are recorded. These data will assist greatly in analysing growth patterns of salmon caught at sea, as well as in analysing archival material. The rate of growth can be accurately estimated, and growth checks and other growth anomalies can be temporally assigned. Hence, growth rate can now be estimated over short periods of time – weeks in summer periods, months in winter periods (Peyronnet 2006). This technique has been used for identification of the continent of origin in the commercial West Greenland salmon fishery and also to assess marine growth patterns from Irish salmon (Reddin & Friedland 1999, Peyronnet 2006). Taking advantage of new digital technology, four leading European laboratories will, as a part of the SALSEA-Merge project, establish inter-calibration protocols to standardize and improve the accuracy of scale reading and imaging techniques. This collaboration will provide fine scale temporal estimates of growth rate and pattern and identify growth anomalies, relating these to associated oceanographic conditions. New information will be available on the different growth patterns, occurring between stocks from different parts of Europe, and these may be traced to particular oceanic areas or particular times of the year. The information from historical material is expected to deliver unique insights into changes over time in the species’ use of this ecosystem, and in the probable link between marine growth and survival between areas, with contrasting history of abundance and survival. Growth data from scales collected at sea, in addition to growth data derived from historical scale samples, will be held in a common database, and a common European digital scale image library will be established.
Methods When using the new digital scale reading methodology, data on growth rate are obtained through four successive operations:
1. Mounting of scales 2. Image prosessing 3. Image analysis 4. Storing the data
All these four steps were discussed during this workshop.

5
Mounting of scales Before image processing, impressions of some scales (about five) of each adult salmon are pressed onto a cellulose acetate slide. A scale rolling procedure, developed at Kevin Friedlands laboratory, is presented in Appendix 2. Results are improved by placing slide with scales in x-ray film, holding film securely to keep scales in place. Post-smolt scales are small, and hence more difficult to mount than scale of adult salmon. Therefore, the workshop recommended that the best way to analyse scales of post-smolts is to take images of unmounted scales placed between two object glass plates. It is important that the scale samples are being collected from the proper location on the fish. Scales closest to the lateral line between the dorsal and the pelvic fin are laid down first, and therefore will contain the most complete history of the fish’s growth (Warner & Havey 1961, Martynov 1983, Anon 1984). In extreme climates, like some rivers in northern Norway, no scales are laid down the first summer, and hence, these fish will lack their first annulus in their scales (Jensen & Johnsen 1982). In post-smolt catches by trawl, some of the fish lack most of their scales, including on the part of their body where scales preferably are collected for growth analysis. These scales should be analysed with caution.
Image processing During the workshop, a Nikon digital camera (DS-Ri1, 12.7 Mega Pixels with pixel shift), connected to a Camera control unit (DS-U2), and mounted to a Wild M420 macroscope, was used to record images of scale impressions.
Experiences from Friedlands laboratory are that digital scale images should have as high resolution as possible, preferably about 12 megapixles, and therefore the highest resolution available on the camera (4076 x 3116 pixles) was used as a standard (Fig. 1). By using this high resolution, growth of both the freshwater and marine part of the scale may be analysed from one single scale image. The workshop recommended that at the start of each working day, and also after every adjustment of the equipment, the white balance (Fig. 1) should be adjusted.
The workshop recommended each laboratory to use as few magnifications as possible, because Friedland reported that in the past he has experienced that there have been errors applying wrong calibration if they switch between a number of magnifications.
Routinely, the camera should be directly connected to the imaging analysis softvare (Image Pro Plus, version 6.3), analysed for growth, and then stored as compressed TIF files (see Appendix 3). However, because the camera used at the workshop was a brand new model, a driver from the camera to the software was still not developed. Therefore, during the

workshop, images were captured and stored in a proper folder, and imported to the image software for growth analyses.
Fig. 1. Camera control, with the preferred resolution and other settings.
Image analysis Images of salmon scales were imported to the image analysis program (Image Pro Plus, version 6.3© software), and the proper calibration selected. Then a transect was drawn along the 360° axis from the focus of the scale to the edge of the scale to record the freshwater and marine growth zones (Fig. 2). The edge of the freshwater growth was identified by the increased circuli spacing representing sea entry. The interval between circuli were automatically measured for the marine zone (caliper window) and an aggregate length was recorded for the freshwater zone (measurement window). All measurements were temporarily stored in an excel spreadsheet, before they were manually moved to their final location in another sheet, as described in the next paragraph. More details about this method are given in Appendix 3.
Storing the data Data on freshwater growth as well as detailed marine growth obtained from the Image-Pro Plus program will be stored in proper excel spreadsheets, together with some essential information about each individual. Because the essential information differ between post-smolts and adult salmon, the workshop decided to store these two types of data in different spreadsheets with some different design (Fig. 3).
6

7
Fig. 2. Image of a salmon scale, with length measurement of the freshwater zone (L1) obtained by the Measurement window, and detailed growth data (A1-A40) obtained from the marine zone by the Caliper window of the Image-Pro Plus program. Essential information to be stored for each individual of adult salmon are (see Fig. 3a):
River (name of river) Locality (name or number of location within the river) Year of capture Reference number (archive number used at the laboratory) Image name (xxx.TIF) (file name of the image, to be linked to the file) Catch date Smolt year Length (mm) Weight (g) Sex Smolt age Sea age

Essential information to be stored for each post-smolt (see Fig. 3b):
Cruise number Reference number (identical to the number in the cruise protocol) Image name (xxx.TIF) (file name of the image, to be linked to the file) Capture date Latitude Longitude Year of capture Origin (information from tagging or from genetical analysis) Type (wild, stocked, escaped from aquaculture) Length (mm) Weight (g) Sex Smolt age
The workshop decided that a common database, with files similar to those described in Fig. 3, and with accompanying scale image files, will be located on a server at NINA. Data will be sent in batches to NINA for installing in the database. a)
b)
Fig. 3. Design of excel spreadsheets where growth data from salmon scales are to be stored. A) adult salmon from rivers, b) post-smolts collected at cruises.
8

Data analysis
Obtaining monthly growth rates of postsmolts Monthly growth rates will be obtained in the same way as described in McCarthy et al. (2008). Circuli spacings will be used to quantify marine growth, with narrow spacings indicating periods of decreased growth and wider spacings representing periods with increased growth. A sum value of all circuli spacings from the first marine circuli to the winter annulus represents the total post-smolt growth for each individual. To extract the post-smolt growth indices for each individual, the minimum circuli spacing will be identified as representative of the winter annulus for each sample. A five-point moving window will be used to reduce the effect of spurious circuli values and the minimum values extracted and located by column on the data matrix. The first 10 circuli spacings of the marine zone should be excluded as minimum values, owing to the propensity of small spacings during the early portion of the marine phase to be falsely identified as winter annuli. The location of the winter annulus will subsequently be used to mark the end of the post-smolt growth period for each individual. A sum value of summing of all circuli spacings from the first marine circulus to the winter annulus represents the total post-smolt growth for each individual. In order to more closely examine growth during the post-smolt period, the total post-smolt growth will be portioned into monthly increments. To do this we will use the total number of circuli pair present in the post-smolt period for each individual and divide by the approximate length in months of the post-smolt year, from smolting to first winter, to determine the number of circuli each individual deposits in one month. The sums of these circuli spacings will be tabulated for each individual to represent total growth during each putative month of the post-smolt year. During the workshop, Friedland demonstrated a spreadsheet where monthly growth rates in large datasets could be estimated simultaneously instead of analysing each salmon individually. He presented this spreadsheet in detail, and allowed the SALSEA-Merge project to use it.
Determination of growth indices from scale readings During the workshop, the objectives of WP4 were discussed. The session was opened by two contributions on earlier experiences with similar studies. First, Niall O’Maoileidigh presented results from the study on detailed post-smolt growth analyses from Burrishole River in Ireland, and then Kevin Friedland shared his wide experience from both European and North American studies with the group. Following the discussion, these objectives were designated as most relevant for the SALSEA-Merge project:
• Study regional variation in post-smolt growth
9

• Identify critical periods influencing survival of post-smolts in different areas during their first year at sea
• Relate marine growth to survival • Different growth patterns may be traced to particular oceanic areas or particular times
of the year • Study relationships between environmental factors, biological factors and post-smolt
growth
Priority of data and distribution of work During the project period, scales of post-smolts collected at the cruises as well as scales of adult salmon from some selected rivers will be analysed for growth with the scale image analysis tecnique. In the SALSEA-Merge proposal, we indicated that up to 15,000 scale samples from approximately 15 salmon stocks will be analysed. If three scales are analysed per hour, there are resources within the project to analyse 4,000 samples of adult salmon for each of the IFL, FGFRI and NINA laboratories, and 3,000 for the MI laboratory, in addition to scales (or otoliths if scales are missing) of post-smolts from the cruises. In May, the WP4 leader sent a request to each partner, asking for time series on scales of adult salmon available for growth analysis. These series were presented at the workshop, and the following priority list was composed (Fig. 4): IFL, Iceland: River Nordura (1988-2008) River Hofsa (1987-2008) FGFRI, Finland: Teno River (1972-2008) (Neiden River [1972-2008]) MI, Ireland: Burrishoole River Other (not yet decided) NINA, Norway: Repparfjord River (1932-2008) Drammen River (2004-2008)* Namsen River (1977-2008) *About 100 samples per year in the period 1983-2003 are already analysed The workshop recommended that up to 50 samples of each sea age group from each time series should be analysed annually.
10

The workshop recommended the following work distribution for analysing scales (and otoliths if scales are missing) of post-smolts from the cruises: Cruise No. 1 MI, Ireland Cruise No. 2 FGFRI, Finland Cruise No. 3 NINA, Norway IFL, Iceland will analyse approximately 500 samples of post-smolts collected at cruises from before 2008.
11
Fig. 4. Location of the prioritized rivers.
Scale image library One of the deliverables from the SALSEA-Merge project is a digital scale image library. Growth data from scales collected at sea during the cruises (WP2), as well as data from historical scale samples from selected salmon stocks in several countries will be stored in a common database, establishing this library. In Fig. 5, a proposal for which information to be given for each scale image.

12
Fig. 5. Example of information to be given for each scale image in the digital scale image library.
References Anon. 1984. ICES, Atlantic salmon scale reading. Report of the Atlantic salmon scale reading workshop. Aberdeen, Scotland, 23-28 April, 1984. Jensen, A.J. & Johnsen, B.O. 1982. Difficulties in ageing Atlantic salmon (Salmo salar) and brown trout (Salmo trutta) from cold rivers due to lack of scales as yearlings. Canadian Journal of Fisheries and Aquatic Sciences 39, 321-325. Holm, M., Hansen, L.P., Holst, J.C. and Jacobsen, J.A. 2004. Atlantic salmon. In The Norwegian Sea Ecosystem, pp 315 - 356. Ed. by H.R. Skjoldal. Tapir Academic Press, Trondheim. 559 pp. Martynov, V.G. 1983. On variability of scale characteristics in Atlantic salmon (Salmo salar L.). ICES Working paper C.M. 1983/M:5. McCarthy, J.L., Friedland, K.D. & Hansen, L.P. 2008. Monthly indices of the post-smolt growth of Atlantic salmon from the Drammen River, Norway. Journal of Fish Biology 72, 1572-1588. Peyronnet, A.J. 2006. Effects of climate and ocean conditions on the marine survival of Irish salmon (Salmo salar, L). Ph. D. thesis. University of Massachusetts Amherst. 132 pp. Reddin, D.G., and K. D. Friedland. 1999. A history of identification to continent of origin of Atlantic salmon (Salmo salar L.) at west Greenland. Fisheries Research 43, 221-235. Warner, K. & Havey, K. 1961. Body-scale relationships in landlocked salmon, Salmo salar. Transactions of the American Fisheries Society 90, 457-461.
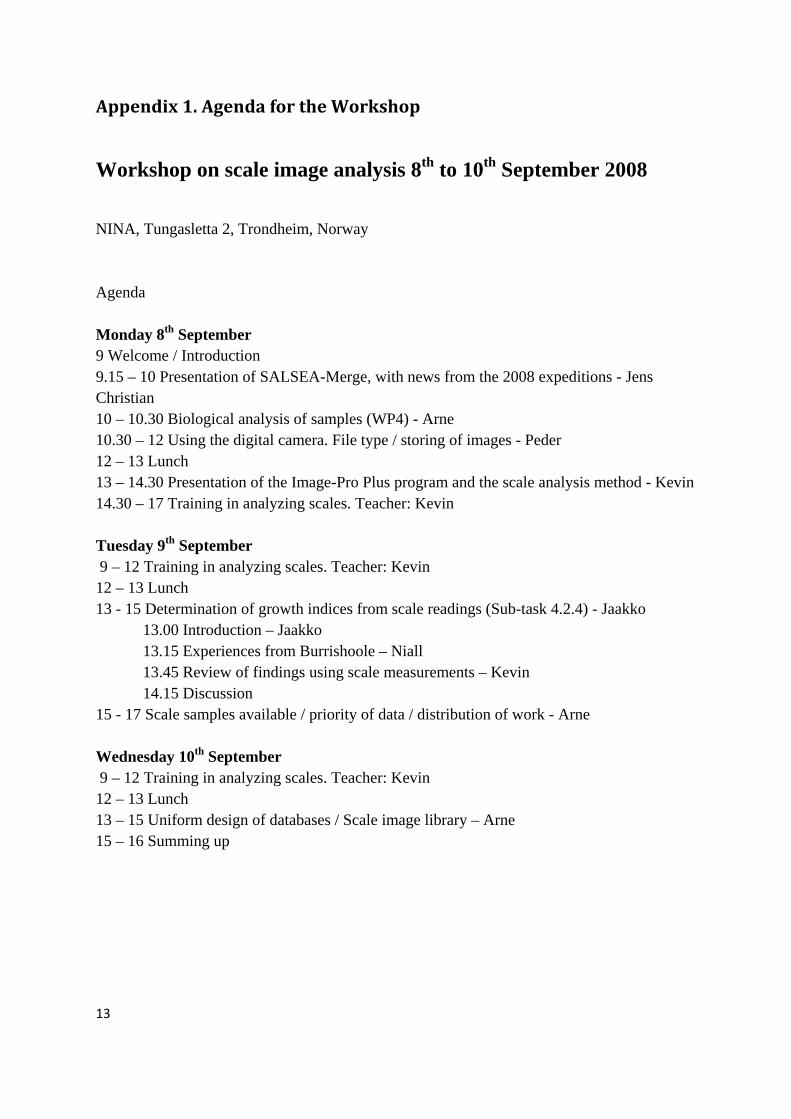
Appendix 1. Agenda for the Workshop Workshop on scale image analysis 8th to 10th September 2008
NINA, Tungasletta 2, Trondheim, Norway Agenda Monday 8th September 9 Welcome / Introduction 9.15 – 10 Presentation of SALSEA-Merge, with news from the 2008 expeditions - Jens Christian 10 – 10.30 Biological analysis of samples (WP4) - Arne 10.30 – 12 Using the digital camera. File type / storing of images - Peder 12 – 13 Lunch 13 – 14.30 Presentation of the Image-Pro Plus program and the scale analysis method - Kevin 14.30 – 17 Training in analyzing scales. Teacher: Kevin Tuesday 9th September 9 – 12 Training in analyzing scales. Teacher: Kevin 12 – 13 Lunch 13 - 15 Determination of growth indices from scale readings (Sub-task 4.2.4) - Jaakko
13.00 Introduction – Jaakko 13.15 Experiences from Burrishoole – Niall 13.45 Review of findings using scale measurements – Kevin 14.15 Discussion
15 - 17 Scale samples available / priority of data / distribution of work - Arne Wednesday 10th September 9 – 12 Training in analyzing scales. Teacher: Kevin 12 – 13 Lunch 13 – 15 Uniform design of databases / Scale image library – Arne 15 – 16 Summing up
13

Appendix 2. Scale rolling procedure used by Kevin Friedlands laboratory
Scale Rolling Procedure
1. Using the dissecting microscope, determine suitability of scales: a. Suitability determined by level of regeneration at focus of scales. If regeneration is
over 2/3 of the freshwater zone the scale is not used. If scale appears incomplete do not use
b. Scale containing spawning marks should be rolled. 2. Arrange scales on slide. Do not put scales too close to narrow end of slide, i.e. leave at least
approx. ¼ inch on each end as if scales are too close to edge it will affect image.
3. Scales are oriented with shiny side up. The more dull side is ridge with circuli and must be in direct contact with slide to get impression. Ridged side can be identified using forceps, however, this must be done very carefully to avoid damaging the scale.
14

4. Place slide with scales in x‐ray film, holding film securely to keep scales in place. Scales may jump or shift owing to static. Re‐orient scales if shifting occurs and ensure correct side remains up.
5. As slide is passed through roller hold on to side going in. Hold slide on other end as slide passes through. Roller should be kept at high tension, however, it should not be too difficult to pass slide through as this may cause some distortion to slide.
15

16

6. Carefully remove scales from slide and return to envelope. 7. Impressions should be visible on acetate slide. Check slide on image processing system to
ensure quality of impressions. 8. Scales can be rolled again if impression is not deep enough or wrong side of scale was put
up. 9. If acetate slide is to be kept, place in stamped labeled envelope. If slide is being returned
with scales place in envelope containing the scales.
17

Appendix 3. Scale Image Analysis Procedure used by Kevin Friedlands laboratory
Scale Image Analysis Procedure
1. Open Image Pro Program 2. Hit the camera icon to activate the camera 3. Ensure microscope is turned on 4. Hit preview button in camera tool bar 5. Place slide on stage 6. Select suitable scale using the microscope 7. Hit the preview button 8. Focus the scale and center in preview window 9. Click the snap button in camera tool bar 10. Move preview window to the side 11. Go to the Measure Menu and select Measurements
12. Go to the Measure Option and select Caliper
18

13. In the caliper window, go to the input/output submenu and load the appropriate cps file.
19

14. Return to the image and hit the best‐fit equalization button.
15. The picture can be further adjusted by selecting the appropriate toolbar and changing settings accordingly. (Please note that the program will save the original picture only, i.e. none of the changes made to light/contrast will be saved).
16. Zoom into the area you want to measure, using the magnifying glass icon. 17. To measure freshwater growth go to the Measurement window and click the create a line
feature button (\). Measure from center of zone to just beyond the last circuli of the freshwater zone along the 360o axis (See picture below).
20
18. To measure seawater growth go to the Caliper window and click the create a line feature button (\). Measure from end of freshwater zone to the edge of the scale along the 360o axis (See picture below).

21
360o Axis
Marine Zone
Freshwater Zone
19. Zoom in on the seawater zone to ensure that no circuli have been missed by the program. To add or delete any ‘A‐dashes’, in the caliper window select the red dash button and under the add menu highlight ‘valley’. Double ‘A‐dashes’ appear a bolder red.

20. To send data to Excel spreadsheet, select destination file (sheet 2 in correct Excel file) in the DDE Options in both Measurements and Caliper windows. In the Measurements window click the Export button followed by the Send Data button in the caliper window.
22

23
21. Go to the Excel document, on sheet 2 the ‘Value’ box is the freshwater measurement. Copy this and paste in the appropriate box on sheet 1.
22. The column with the ‘A’ values is the seawater zone. Copy the intercirculi spacing values and paste in sheet 1 by Paste Special → Transpose → Ok
23. Save the Excel document. 24. In Image Pro, save the image in the appropriate folder on the hard drive. In File menu →
Save as → Document Name → Compression: LZW & Differencing → Ok