salivary glucose concentration and daily variation in the
TRANSCRIPT

Salivary glucose concentration and daily variationin the oral fluid of healthy patients
Antonella Polimeni, MD, DDS1
Marco Tremolati, DDS, MS, PhDC2
Luigi Falciola, MD, PhD3
Valentina Pifferi, MD3
Gaetano Ierardo, DDS1
Giampietro Farronato, MD, DDS2
1 Department of Oral and Maxillo-facial Sciences,
“Sapienza” University of Rome, Italy2 Department of Biomedical, Surgical and Dental
Sciences, University of Milan, Italy3 Department of Chemistry, University of Milan and
Sensors Group of the Italian Chemical Society, Italy
Corresponding author:
Giampietro Farronato
Department of Biomedical, Surgical and Dental Sci-
ences, University of Milan
Via Commenda, 10
20122 Milano, Italy
E-mail: [email protected]
Summary
Aim. The aim of this study was to determine the
concentration and the variations of salivary glu-
cose in healthy patients who were sampled at five
different intervals during the day.
Materials and methods. Samples of un-stimulated
saliva have been collected from 21 healthy patients
using the drooling technique and they were divid-
ed into two categories. In the first category, pa-
tients were asked not to toothbrush their teeth in
the 8 hours prior to collection of the salivary sam-
ple. Patients in the second category were instead
asked to toothbrush 90 minutes before the collec-
tion of the first sample of saliva. The glucose con-
centration was measured in all patients via an en-
zymatic spectrophotometry. Patients have been se-
lected following a strict inclusion criteria, which in-
cluded <5% of plaque presence e according to the
plaque Index and a total absence of oral disease
that could possibly interfere with sample taking or
oral fluid analysis. The average age of patients was
22,4±2,6 years old of which 45% were female and
55% were male. Samples were collected five times
between 8 am and 12 pm, before and after break-
fast. Data was statistically analyzed using the
Skewness/Kurtosis Test, Shapiro-Wilk Test,
Kruskal Wallis Test and Linear Regression Model,
considering values of p<0,05 to be significant.
Results. The average rate of un-stimulated sali-
vary flow was 0,53±0,21 ml/min. There were no
significant differences between salivary glucose
values and salivary flow in female and male pa-
tients. However, we observed a typical trend
which recurred for each patient and resembled a
“pseudo-glycemic curve”.
Conclusions. The collected data suggests that
glucose concentration results did not show sta-
tistically significant differences (p>0,078) which
could however be due to the little number of pa-
tients assessed, nonetheless there is a trend, re-
calling a “pseudo-glycemic curve” not referable
to changes in flow rates, probably due to glucose
catabolism and shunt.
Key words: salivary glucose, saliva, oral hygiene,
oral fluid, spectrophotometry.
Introduction
Oral fluid is an organic fluid, easy to collect and to
preserve, which may give us plenty of information
about the presence of systemic and local diseases
via non-invasive sampling methods. It is constituted
by a complex chemical milieu of teeth and oral soft
tissues, consisting mainly on water, essential elec-
trolytes, glycoproteins, antimicrobial enzymes and nu-
merous other important constituents like glucose (1,
2). In the last decade the concentration of many bio-
markers present in saliva has acquired increasing im-
portance possibly showing the presence of systemic
illness and reflecting the metabolic, nutritional, im-
munological, hormonal, emotional and neurological
state of the patient (3-5).
Many articles have been written regarding the role
and presence of glucose in oral fluids such as saliva
and gingival crevicular fluid (GCF) in diabetic pa-
tients. However, little efforts have been made to as-
sess healthy patients. Above all, there are no articles
that describe repeated sample taking at different in-
tervals of the day (10-14).
Glucose is a small molecule (180 DA) that diffuses
through blood vessel membranes and passes through
blood serum into GCF and salivary ducts to finally
reach the oral cavity (15). Several studies assert that
salivary glucose levels are not related to glycaemia,
even if the oral fluid of diabetic patients presents higher
levels of glucose than those in healthy controls (14-17).
Sampling oral fluid is easy, non-invasive for patients
and safe for clinicians, However, several authors do
not agree on the results obtained from such analyses,
Annali di Stomatologia 2014; V (1): 1-6 1
Original article
© C
IC Ed
izion
i Int
erna
ziona
li
due to the different available protocols in sampling
procedures and the different analytical techniques.
Ramsaier et al. and Kinney et al. report using one of
the most repeatable and simple procedures to sam-
ple oral fluid: the drooling technique (2, 18).
Many authors sampled oral fluid in a specific range of
time and patients were instructed not to brush their
teeth, eat, drink or smoke 2-3 hours before the time of
saliva sample collection, but none of them have as-
sessed a plaque index score and/or oral health evalua-
tion. This is essential as plaque residuals may play an
important role in salivary glucose concentration (19-21).
Based on these premises, the goal of the present study
is to evaluate the presence and therefore compare sali-
vary glucose concentration in healthy young individuals
with excellent oral care. We also intend to analyze un-
stimulated oral fluid samples taken at different times
before and after a standardized breakfast, comparing
two different protocols; with tooth brushing (90 min be-
fore first sample taking) and without tooth brushing (8
hours from the last domiciliary oral hygiene care).
Materials and methods
Thirty-seven patients who mantained all permanent
teeth and had no salivary dysfunctions were included
in the study. Patients were trained for 6 months on
how to carry out effective oral domiciliary hygiene
care. They were monitored until they reached a
Plaque Index score, which was less than 5% accord-
ing to the Silness and Loe index. Of the thirty-seven
patients assessed, only twenty-one of them have
managed to reach a 5% plaque level within the 6
months. Hence, these patients have been included in
the study only one diabetic patient was included in
the study under his specific request.
The patients selected were between 20 to 25 years
old (average 22,4 ± 2,6 years). Of these, 45% were
female and 55% were males. All patients were in
good systemic and periodontal health, as assessed
from both their medical history and oral and periodon-
tal examination.
Exclusion criteria for the study were: familiarity with or
suspected diabetes, presence of metabolic diseases,
use of pharmacological drugs during the month prior to
sample collection, presence of gingivitis or periodontal
disease, incorrect or unusual nutritional habits, pres-
ence of xerostomia or reduced salivary flow.
A single clinician (M.T.) evaluated all patients, using
a recent medical history and clinical findings. M.T
was also responsible for instructing the patients on
correct oral hygiene care and collecting repeated
samples. The information recorded was: age, gender,
number of teeth and the plaque Index score accord-
ing to Silness and Loe.
After an additional evaluation, patients received de-
tailed information about the study procedures. All pa-
tients have been asked not to brush their teeth, drink
or eat within 8 hours prior to the first sample collec-
tion (at 8 am). They were also asked to take with
them their toothbrush and toothpaste in order to
demonstrate and explain to them the correct oral hy-
giene techniques.
Salivary samples were always collected between 8
am and 12 pm. Un-stimulated whole saliva from each
participant was collected at each study visit via pas-
sive drooling into a sterile plastic tube.
The first sample was taken after 8 hours from tooth
brushing (from 8:00 am to 8:30 am) or after 90 minutes
(following two different Protocols). After the first oral flu-
id sample collection, patients were asked to eat a stan-
dardized breakfast (selected by us). After breakfast, pa-
tients were asked to brush their teeth as they would
normally. One hour after tooth brushing the second oral
fluid sample was collected. Other three samples were
taken respectively after 90, 120 and 180 minutes.
One hundred and twenty five total samples were col-
lected and statistically normalized using the Skew-
ness/Kurtosis and Shapiro-Wilk Normality Tests, and
then analyzed with the Kruskal Wallis Test and Linear
Regression Model. Values where p<0,05 were con-
sidered to be significant.
Reagents and solutions
Glucose oxidase/peroxidase, o-dianisidine dihy-
drochloride and sodium fluoride were purchased by
Aldrich; Sodium azide, D(+)-glucose monohydrate
and sulphuric acid (95-97%) were Merck reagents.
Artificial saliva was prepared, according to the litera-
ture (22) by dissolving in water the following
reagents: 0.9 gL-1 KCl (Aldrich), 0.66 gL-1 KH2PO4
(Baker), 0.08 gL-1 MgCl2 6H2O (Carlo Erba), 0.49 gL-1
KHCO3 (Merck), 0.37 gL-1 NaNO3 (Merck), 0.12 gL-1
CaCO3 (Merck), 0.64 gL-1 NH4Cl (Merck), 0.20 gL-1
Urea (Merck), 2.00 gL-1 Mucin (Aldrich). All the solu-
tions were prepared with Millipore Milli-Q ultrapure
water (resistivity > 18 MΩ cm-1).
Standard solutions of D(+)-glucose monohydrate
were prepared for the calibration plot, diluting a 100
ppm solution.
5 mg of o-dianisidine dihydrochloride were dissolved in
1 mL of water and 0.8 mL of this solution were added to
a Glucose oxidase/peroxidase solution, prepared dis-
solving the content of a capsule in 39.2 mL of water.
Solutions of 0.01 M NaF and 0.01 M NaN3 were used
as glycostatic and bacteriostatic agents respectively,
and a 12 N H2SO4 solution was used to stop the en-
zymatic reaction.
Determination method
The method used for the determination of glucose in
saliva samples is an optimization of the GAGO-20
Sigma Aldrich Technical Bulletin. It is a spectrophoto-
metric enzymatic technique based on the transforma-
tion of glucose to gluconic acid mediated by glucose
oxidase and the consequent production of H2O2. Hy-
drogen peroxide reacts with o-dianisidine in the pres-
Annali di Stomatologia 2014; V (1): 1-62
A. Polimeni et al.
© C
IC Ed
izion
i Int
erna
ziona
li
ence of peroxidase, producing a colored product,
whose absorbance, proportional to glucose concen-
tration, is measured at 427 nm.
2 mL of the solution containing glucose oxidase/per-
oxidase and o-dianisidine were added to each sam-
ple to be analyzed; after 30 min at 37° C in a thermo-
stating bath and 2 mL of 12 N H2SO4 were used to
stop the enzymatic reaction. The absorbance spec-
trum was measured in the range 380-800 nm, mea-
suring the maximum at 427 nm.
Calibration plot
The calibration plot was obtained using calibration
solutions gathered by mixing 0.25 mL of 0.01 M NaF,
0.25 mL of 0.01 M NaN3, 0.25 mL of artificial saliva
and 0.25 mL of standard glucose solutions in the con-
centration range of 0 to 40 ppm. Each of these sam-
ples was treated with the procedure explained before,
measuring and correcting the absorbance with the
blank value.
Protocols
Two protocols were established to evaluate the glu-
cose measurements and behavior in human saliva:
• Protocol 1 (12 healthy patients): the first sample
was collected after 8 hours from tooth brushing,
before breakfast (shown by the red continuous
vertical line in Fig. 1) and subsequent morning
tooth brushing (shown by the green dashed verti-
cal line in Fig. 1). Saliva was then collected at 60,
90, 120, 180 minutes from breakfast and morning
tooth brushing.
• Protocol 2 (9 healthy patients + 1 diabetic pa-
tient): the first sample was collected in the mor-
ning after 8 hours from tooth brushing, (shown by
the green dashed vertical line in Fig. 2). The pa-
tients were then asked to have breakfast (shown
by the red continuous vertical line in Fig. 2). Sali-
va was then collected at 60, 90, 120, 180 minutes
from breakfast.
For both protocols the standardized breakfast con-
sisted in a sweetened coffee or tea (with 2 tea-
spoons of sugar corresponding to 8,4 g) and an
empty croissant.
The collection procedure of saliva involved taking
two samples of 0.5 mL to which 0.25 mL of 0.01 M
NaF and 0.25 mL of 0.01 M NaN3 were added as
glycostatic and bacteriostatic agents. The first sam-
ple was mixed with 2 mL of the solution containing
glucose oxidase/peroxidase and o-dianisidine whilst
the second sample was mixed with 2 mL of water
(blank). Both samples were treated as described in
the method section. The measurements of glucose
concentration in the samples were obtained sub-
tracting the blank absorbance and using the calibra-
tion plot. The blank subtraction is essential to par-
tially eliminate the contribution to the absorbance
caused by the different opacity of the saliva sam-
ples, which comes from different patients. In such
way, the measurement can only be referred to the
glucose content.
Results
This study involved 21 non-diabetic patients; 11
(52,4%) male and 10 (47,6%) female patients aged
between 20 to 25 years. The average age was 22,4 ±
2,6 years. For the whole oral fluid sample the aver-
age flow rate was 0,53 ± 0,21 ml/min. A statistically
significant correlation between salivary glucose and
un-stimulated salivary flow rate was found (P=0,001).
Calibration plot
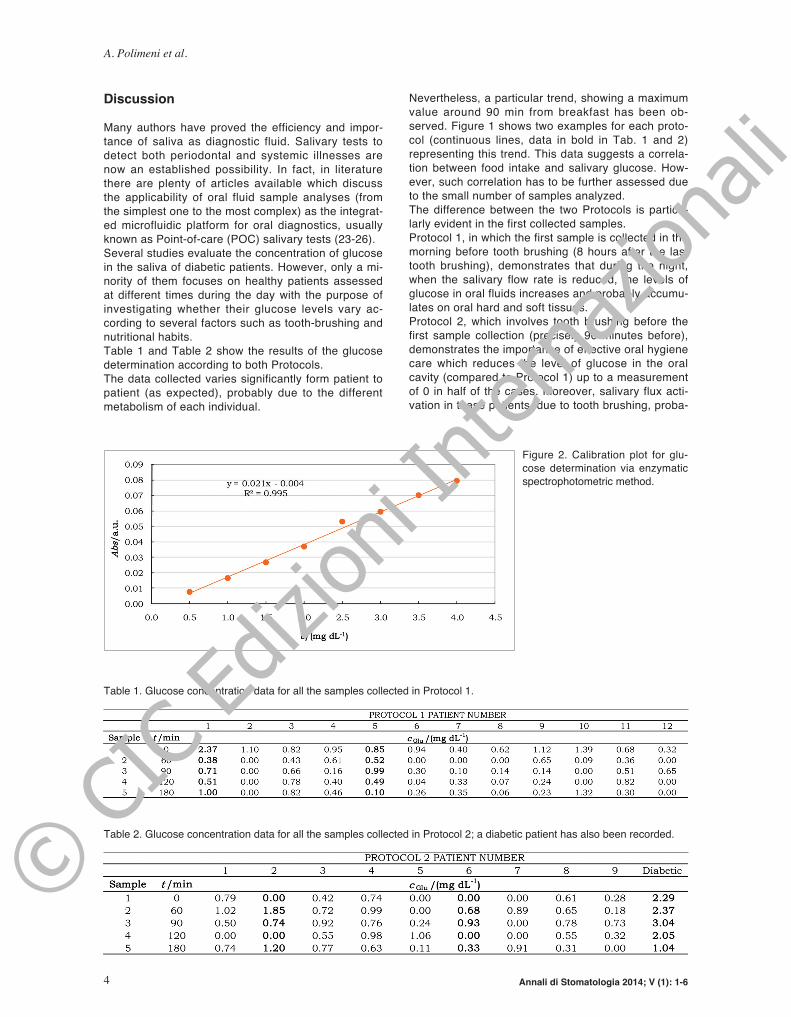
The calibration plot (Fig. 2) of the analytical method-
ology chosen for this study was obtained in the range
of 0-4 mg dL-1 with a positive correlation. The limit of
detection was calculated at 0.011 mg dL-1 of glucose
and the limit of quantification at 0.0325 mg dL-1 of
glucose. These results show that the method used is
applicable to analyze the glucose content in human
saliva.
Annali di Stomatologia 2014; V (1): 1-6 3
Salivary glucose concentration and daily variation in the oral fluid of healthy patients
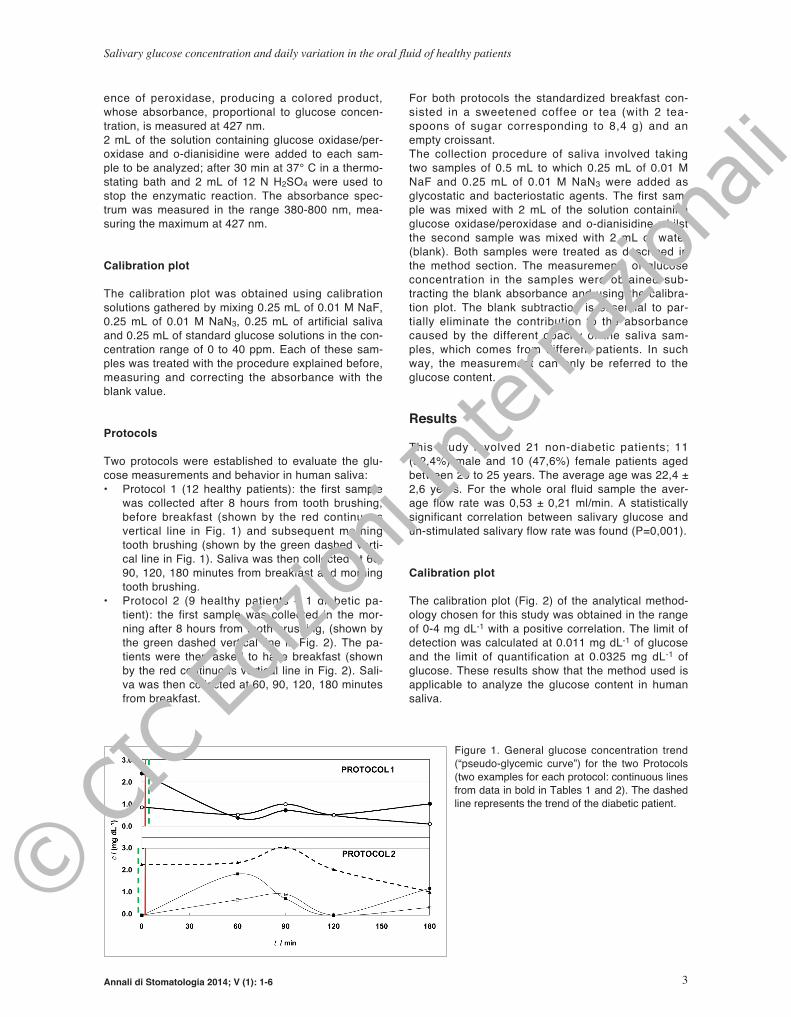
Figure 1. General glucose concentration trend
(“pseudo-glycemic curve”) for the two Protocols
(two examples for each protocol: continuous lines
from data in bold in Tables 1 and 2). The dashed
line represents the trend of the diabetic patient.
© C
IC Ed
izion
i Int
erna
ziona
li
Discussion
Many authors have proved the efficiency and impor-
tance of saliva as diagnostic fluid. Salivary tests to
detect both periodontal and systemic illnesses are
now an established possibility. In fact, in literature
there are plenty of articles available which discuss
the applicability of oral fluid sample analyses (from
the simplest one to the most complex) as the integrat-
ed microfluidic platform for oral diagnostics, usually
known as Point-of-care (POC) salivary tests (23-26).
Several studies evaluate the concentration of glucose
in the saliva of diabetic patients. However, only a mi-
nority of them focuses on healthy patients assessed
at different times during the day with the purpose of
investigating whether their glucose levels vary ac-
cording to several factors such as tooth-brushing and
nutritional habits.
Table 1 and Table 2 show the results of the glucose
determination according to both Protocols.
The data collected varies significantly form patient to
patient (as expected), probably due to the different
metabolism of each individual.
Nevertheless, a particular trend, showing a maximum
value around 90 min from breakfast has been ob-
served. Figure 1 shows two examples for each proto-
col (continuous lines, data in bold in Tab. 1 and 2)
representing this trend. This data suggests a correla-
tion between food intake and salivary glucose. How-
ever, such correlation has to be further assessed due
to the small number of samples analyzed.
The difference between the two Protocols is particu-
larly evident in the first collected samples.
Protocol 1, in which the first sample is collected in the
morning before tooth brushing (8 hours after the last
tooth brushing), demonstrates that during the night,
when the salivary flow rate is reduced, the levels of
glucose in oral fluids increases and probably accumu-
lates on oral hard and soft tissues.
Protocol 2, which involves tooth brushing before the
first sample collection (precisely 90 minutes before),
demonstrates the importance of effective oral hygiene
care which reduces the level of glucose in the oral
cavity (compared to Protocol 1) up to a measurement
of 0 in half of the cases. Moreover, salivary flux acti-
vation in these patients, due to tooth brushing, proba-
Annali di Stomatologia 2014; V (1): 1-64
A. Polimeni et al.
Table 1. Glucose concentration data for all the samples collected in Protocol 1.
P
Table 2. Glucose concentration data for all the samples collected in Protocol 2; a diabetic patient has also been recorded.
P
Figure 2. Calibration plot for glu-
cose determination via enzymatic
spectrophotometric method.
© C
IC Ed
izion
i Int
erna
ziona
li
bly plays a role in the salivary glucose concentration
observed.
The dashed line in Figure 2 - Protocol 2, shows the
behavior of glucose in the diabetic patient. The trend
of the “pseudo-glycemic curve” is the same already
discussed, but shifted at higher values, demonstrat-
ing how it may be possible to use salivary glucose
concentration in the monitoring of diabetic patients.
Regarding the concentration of salivary glucose, the
average collected from all patients involved in this
study was lower than the measurement obtained by
Soares et al. (27), which was 5,94 mg/dL and Di Gioia
et al. (28) which was 5,57 mg/dL. Agha-hosseini et al.
observed an average salivary glucose measurement of
13,6 mg/dL. As proposed by Soares et al. (27), one
possible explanation of salivary glucose differences ob-
tained in these studies may be the various study de-
signs as well as the diversity of the methods used and
selection criteria of the sample collection (13, 29). This
data suggests that domiciliary oral hygiene techniques
of each patient should always be assessed before oral
fluid sample taking or, if possible, previously set.
In accordance to the results obtained from this study, the
majority of authors observe a statistically significant cor-
relation between flow rate and salivary glucose concen-
tration. These suggest a pivotal role of flow rate, not only
for the assessment of glucose concentration but also for
the identification of biomarkers levels in the diagnosis or
screening of systemic and local diseases (27-29).
Conclusions
Based on the results obtained from the samples stud-
ied, it is possible to determine that salivary glucose is
present even when plaque levels and oral health sta-
tus are strictly controlled. However, further studies
are required to prove a correlation between glucose
intake and salivary glucose as the number of patients
and samples collected in our study were limited.
Moreover, an alternative, complementary, more rapid,
precise and accurate analytical methodology (capa-
ble of following glucose concentration in saliva possi-
bly on-site), is to be designed. In this context, electro
analytical techniques, capable of monitoring small
quantities of organic compounds in situ (30-31), could
be an interesting alternative.
Acknowledgements
Authors thank Colgate-Palmolive Company for finan-
cially supporting the study.
References
1. Castagnola M, Picciotti PM, Messana I, Fanali C, Fiorita A,
Cabras T, Calò L, Pisano E, Passali GC, Iavarone F,
Paludetti G, Scarano E. Potential applications of human sali-
va as diagnostic fluid. Acta Otorhinolaryngol Ital.
2011;31:347-357.
2. Kinney JS, Morelli T, Braun T, Ramseier CA, Herr AE, Sug-
ai JV, Shelburne CE, Rayburn LA, Singh AK, Giannobile WV.
Saliva/pathogen biomarker signatures and periodontal dis-
ease progression. J Dent Res. 2011; 90:752-758.
3. Pohjamo L, Knuuttila M, Tervonen T, Haukipuro K. Caries
prevalence related to the control of diabetes. Proc Finn Dent
Soc. 1988;84:247-52.
4. Arcella D, Ottolenghi L, Polimeni A, Leclercq C. The rela-
tionship between frequency of carbohydrates intake and den-
tal caries: a cross-sectional study in Italian teenagers.
Public Health Nutr. 2002;5(4):553-60.
5. Farronato G. Odontostomatologia per l’Igienista Dentale, Basi
anatomo-cliniche e protocolli operativi. Piccin-Nuova Libraria
2007.
6. Farronato G, Regaldo G, Mascardi A. Azione enzimatica
dell’Alfa-Amilasi sulla placca batterica. Dent Cadm.
1987;7:59-63.
7. Farronato G, Venerando B, de Colle C, Tonon M. Azione di
una destranasi sulla placca batterica in soggetti sottoposti
a chirutgia ortognatodontica. Prevenzione e Assistenza Den-
tale 1992: 5.
8. Farronato G, Venerando B, Biagi R, De Colle C, Passuello
F, Tonon M. Azione di una destranasi sulla placca batteri-
ca in soggetti handicappati: sperimentazione clinica. Pre-
venzione e Assistenza Dentale. 1992:3.
9. Polimeni A., Gallottini L., Dolci M. La secrezione salivare e
le sue alterazioni. Roma. Euroma, Editrice Univ. La Goliardica
1995.
10. Twetman S, Johansson I, Birkhed D, Nederfors T. Caries in-
cidence in young type 1 diabetes mellitus patients in rela-
tion to metabolic control and caries-associated risk factors.
Caries Res. 2002;36:31-5.
11. Karjalainen KM, Knuuttila ML, Käär ML. Salivary factors in
children and adolescents with insulin-dependent diabetes mel-
litus. Pediatr Dent. 1996;18:306-11.
12. Ben-Aryeh H, Serouya R, Kanter Y, Szargel R, Laufer D. Oral
health and salivary composition in diabetic patients. J Dia-
betes Complicat. 1993;7:57-62.
13. Moore PA, Guggenheimer J, Etzel KR, Weyant RJ, Orchard
T. Type 1 diabetes mellitus, xerostomia, and salivary flow
rates. Oral Surg Oral Med Oral Pathol Oral Radiol Endod.
2001;92:281-91.
14. Jurysta C, Bulur N, Oguzhan B, Satman I, Yilmaz TM,
Malaisse WJ, Sener A. Salivary glucose concentration and
excretion in normal and diabetic subjects. J Biomed
Biotechnol 2009; Article ID 430426, 6 pages.
doi:10.1155/2009/430426
15. Ben-Aryeh H, Cohen M, Kanter Y, Szargel R, Laufer D. Sali-
vary composition in diabetic patients. J Diabetes Complicat.
1988; 2: 96-99.
16. Amer S, Yousuf M, Siddqiui PQ, Alam J. Salivary glucose
concentrations in patients with diabetes mellitus-a minimally
invasive technique for monitoring blood glucose levels. Pak
J Pharm Sci. 2001;14:33-37.
17. Chávez EM, Borrell LN, Taylor GW, Ship JA. A longitudinal
analysis of salivary flow in control subjects and older adults
with type 2 diabetes. Oral Surg Oral Med Oral Pathol Oral
Radiol Endod. 2001 Feb;91(2):166-73.
18. Ramseier CA, Kinney JS, Herr AE, Braun T, Sugai J, Shel-
burne CA, Rayburn LA, Tran HM, Singh AK, Giannobile WV.
Identification of Pathogen and Host-Response Markers
Correlated With Periodontal Disease. J Periodontol.
2009;80:436-446.
19. Mandel ID, Wotman S. The salivary secretions in health and
disease. Oral Sci Rev. 1976;8:25-47.
Annali di Stomatologia 2014; V (1): 1-6 5
Salivary glucose concentration and daily variation in the oral fluid of healthy patients
© C
IC Ed
izion
i Int
erna
ziona
li
20. Loe H, Silness J. Periodontal disease in pregnancy. I.
Prevalence and severity. Acta Odontol Scand. 1963;21:533-
551.
21. Silness J, Loe H. Periodontal disease in pregnancy. II. Cor-
relation between oral hygiene and periodontal condition. Acta
Odontol Scand. 1964; 22:121-135.
22. Roger P, Delettre J, Bouix M, Béal C. Characterization of
Streptococcus salivarius growth and maintenance in artifi-
cial saliva. J Appl Microbiol. 2011 Sep;111(3):631-41.
23. Giannobile WV. Salivary diagnostics for periodontal diseases.
J Am Dent Assoc. 2012;143:6-11.
24. Herr AE, Hatch AV, Giannobile WV, Throckmorton DJ, Tran
HM, Brennan JS, Singh AK. Integrated microfluidic platform
for oral diagnostics. Ann N Y Acad Sci. 2007;1098:362-74.
25. Kinney JS, Ramseier CA, Giannobile WV. Oral fluid-based
biomarkers of alveolar bone loss in periodontitis. Ann N Y
Acad Sci. 2007;1098:230-51.
26. Taba M Jr, Kinney J, Kim AS, Giannobile WV. Diagnostic bio-
markers for oral and periodontal diseases. Dent Clin North
Am. 2005;49:551-71.
27. Soares MSM, Batista-Filho MMV, Pimentel MJ, Passos IA, Chi-
menos-Kus̈tner E. Determination of salivary glucose in healthy
adults. Med Oral Patol Oral Cir Bucal. 2009;14:510-3.
28. Di Gioia ML, Leggio A, Le Pera A, Liguori A, Napoli A, Si-
ciliano C, et al. Quantitative analysis of human salivary glu-
cose by gas chromatography-mass spectrometry. J Chro-
matogr B Analyt Technol Biomed Life Sci. 2004;801:
355-8.
29. Carda C, Mosquera-Lloreda N, Salom L, Gomez de Ferraris
ME, Peydró A. Structural and functional salivary disorders
in type 2 diabetic patients. Med Oral Patol Oral Cir Bucal.
2006;11:E309-14.
30. Falciola L, Pifferi V, Mascheroni E. Platinum-Based and Car-
bon-Based Screen Printed Electrodes for the Determination
of Benzidine by Differential Pulse Voltammetry. Electro-
analysis. 2012; 24-4:767-75.
31. Falciola L, Pifferi V, Possenti ML, Carrara V. Square Wave
Voltammetric detection of furan on platinum and platinum-
based Screen Printed Electrodes. J Electroanal Chem. 2012;
664:100-4.
Annali di Stomatologia 2014; V (1): 1-66
A. Polimeni et al.
© C
IC Ed
izion
i Int
erna
ziona
li