salinity hort 301 – plant physiology december 3, 2007 taiz and zeiger, chapter 26 (p. 92-698), web...
Post on 22-Dec-2015
214 views
TRANSCRIPT

SalinityHORT 301 – Plant Physiology
December 3, 2007Taiz and Zeiger, Chapter 26 (p. 92-698), Web Topics 26.5 & 26.6
Class Notes
Salt stress – soil and water salinity
Genetic variation for salt tolerance
Salinity causes hyperosmotic stress and ionic disequilibrium
NaCl uptake into roots and transport in plants
Osmotic adjustment and ion compartmentalization
Ion homeostasis transport proteins
Salt stress signaling

Salt stress - caused by concentrations greater than that required for optimum growth of a typical crop plant, 1500 ppm or 25 mM Na+
Sodic vs saline – synonyms for most plant biologists
Oceans are the principal sources of salt - 99.991% of water on earth is in oceans, Na+ is 460 mM and Cl- is 540 mM
NaCl is the primary cause of soil and water salinity, there are soils where Na2SO4 and CaCl2 constitute soil salinity
Biogeochemical cycling of salt – water droplets containing salt (ocean) are carried by wind over land where these evaporate and deposit salt onto the soil and increase the salt content
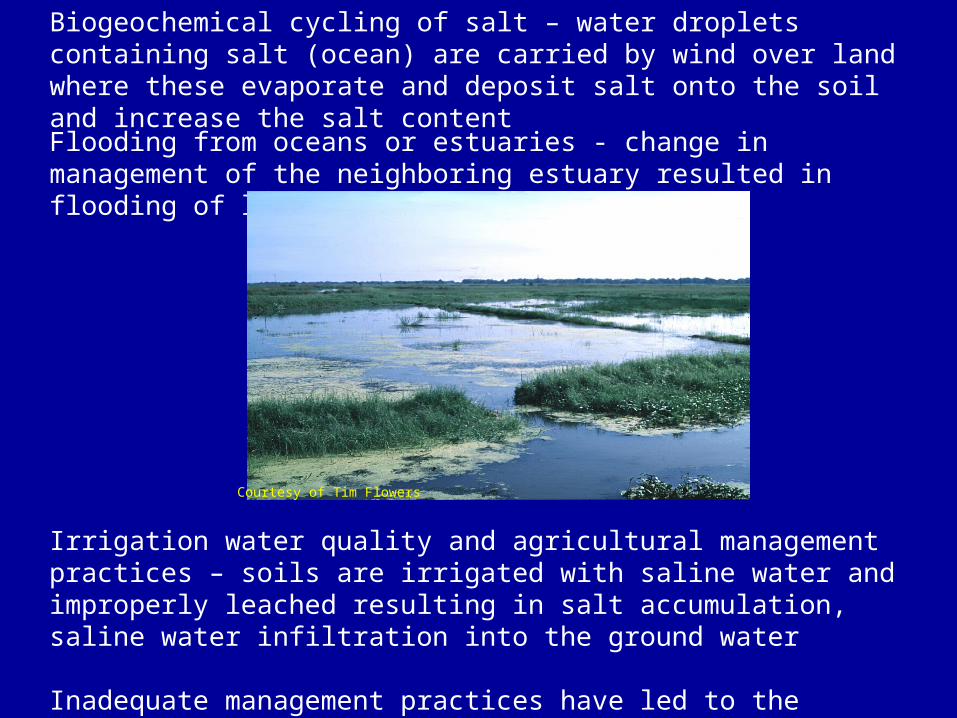
Flooding from oceans or estuaries - change in management of the neighboring estuary resulted in flooding of land used for rice production
Courtesy of Tim Flowers
Irrigation water quality and agricultural management practices – soils are irrigated with saline water and improperly leached resulting in salt accumulation, saline water infiltration into the ground water
Inadequate management practices have led to the destruction of some very fertile soils, e.g., Fertile Crescent in Mesopotamia (Middle East)

Salinity Impact on Crop Production Worldwide
World Land Surface Area 150 x 106 km2
Salt affected 9 x 10⁶ km2 (6%)
Cultivated Land 15 x 106 km2
*Salt affected 2 x 10⁶ km2 (13%)
Irrigated Land 2.4 x 10⁶ km2
*Salt affected 1.2 x 10⁶ km2 (50%)*Problem is increasing
Negative Impacts of Salinity on AgricultureReduced yields on land that is presently cultivated Limited expansion into new areas
Salinity is considered to be the greatest constraint to sustainable irrigation

Genetic variation for salt tolerance - glycophytes (sweet plants) are salt intolerant
Halophytes (salt plants) - “native flora in a saline environment”
Widely distributed amongst angiosperms indicating polyphyletic (multiple progenitors) or halophytes are primitive genetic remnants of different families
Halophytes exist in 1/3 of the angiosperm families, ½ of the 500 halophytic species belong to 20 families, monocots - 45 genera in the Poaceae family and dicots - 44% of the halophytic genera are in the Chenopodiaceae (e.g. Atriplex, Salicornia and Suaeda)

Plant classifications based on salt stress tolerance
26.14 The growth of different species subjected to salinity relative to that of unsalinized controls
Halophytes – grow at 200 to 500 mM NaCl
Euhalophytes (IA) - or facultative halophytes, genotypes that require salt for optimum growth; e.g. Suaeda maritima, Atriplex nummularia

Miohalophytes (IB) - capable of growth at high salt but growth is inhibited by salt, e.g. Atriplex hastata, Spartina townsendii, sugar beet
Halophytes and some glycophytes (II) - substantial growth reduction at 200 mM NaCl, crop plants like cotton, barley, tomato, common bean and soybean
Very salt sensitive glycophytes (III) - e.g. fruit trees, avocado, stone fruits 26.14 The growth of different species subjected to salinity relative to that of unsalinized controls
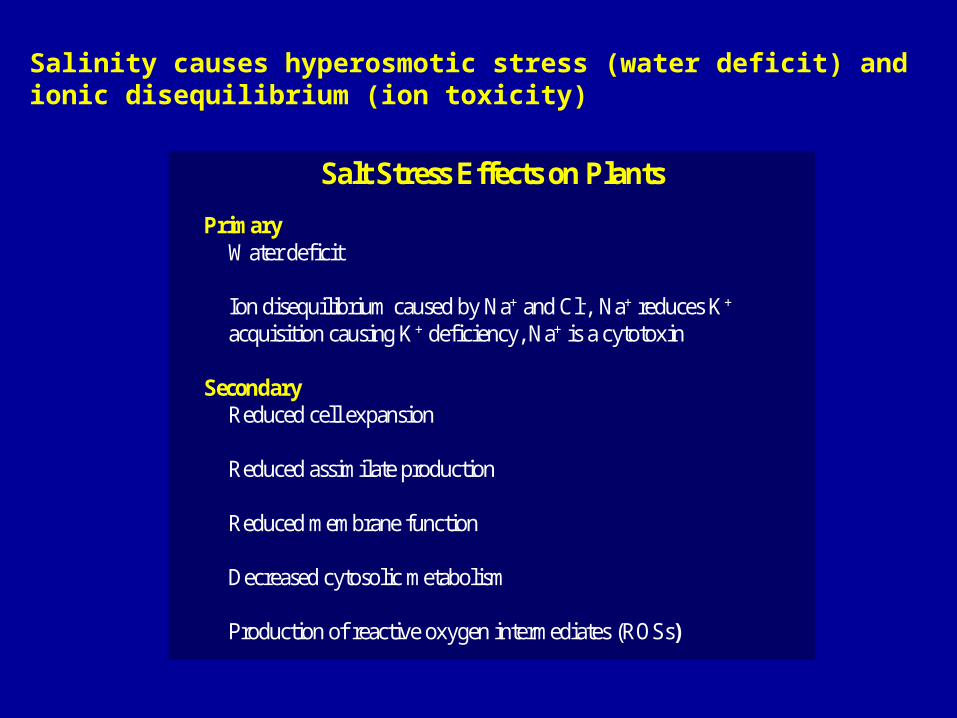
Salinity causes hyperosmotic stress (water deficit) and ionic disequilibrium (ion toxicity)
PrimaryWater deficit
Ion disequilibrium caused by Na+ and Cl-, Na+ reduces K+
acquisition causing K+ deficiency, Na+ is a cytotoxin
SecondaryReduced cell expansion
Reduced assimilate production
Reduced membrane function
Decreased cytosolic metabolism
Production of reactive oxygen intermediates (ROSs)
Salt Stress Effects on Plants

Ion disequilibrium – Na+ rapidly enters the cell because the membrane potential is inside negative (~-120 to -200 mV), Na+ can accumulate to 102- to 103-fold greater concentration than in the apoplast, driven by the membrane potential
Na+ is a cytotoxin and K+ is an essential nutrient
High Na+ interferes with K+/Na+ selective uptake and K+ nutrition
K+/Na+ selectivity is controlled by Ca2+, high Na+ disturbs K+ and Ca2+ availability

Secondary effects of NaCl include:
Reduced cell expansion and assimilate production – similar to water deficit, adaptation includes a reduction in cell expansion rate that affects photosynthate production, i.e., yield decrease
Carbon assimilation and photophosphorylation are salt sensitive – enzymes and membranes

Decreased cytosolic metabolism – metabolic poisoning, enzymes of halophytes and glycophytes are equally sensitive to NaCl
Production of reactive oxygen species (ROS) – products of photorespiration and mitochondrial respiration when electron flow is too great for electron acceptor molecules, e.g., NADPH, resulting in the production reactive oxygen species, lead to cell death
(halophyte)
(glycophte)
(halophyte)

NaCl uptake into roots and transport in plants - radial transport from the soil solution into roots is apoplastic/symplastic (epidermis and cortex), symplastic across the endodermis and then loaded into the xylem
4.4 Pathways for water uptake by the root

Radial transport is regulated - Na+ and Cl- transport to the xylem is limited by apoplastic to symplastic movement into epidermal, cortical and xylem parenchyma cells, endodermis (Casparian strip) restricts radial Na+ transport
Salt movement through the xylem is determined by the transpirational flux – moves through the xylem to the shoot with water
Plants minimize exposure of meristematic cells to Na+ and Cl- - the lack of vasculature to the meristem reduces transport to cells in this tissue, fully expanded leaves are ion sinks and may abscise
Some halophytes deposit salt on the surface of leaves (sink) via glands or bladders

Osmotic adjustment and ion compartmentalization - cellular level response to water deficit is osmotic adjustment (water status adaptation)
Osmotic adjustment – mediated by accumulation and compartmentalization of Na+ and Cl- into the vacuole, compatible osmolytes are accumulated in the cytosol
K+
PlasmaMembrane
polyols proline betaine
trehalose ectoine DMSPNa+
Cl-
Ca2+
TonoplastOH-*-scavenging
perox
cp
mt
Na+/H+K+
H+
H+
Na+
H2O
H2O
pH 5.5
pH 7.5
pH 5.5
-120 to -200 mV
+20 to +50 mV
K+(Na+)
H+
H+
PPi
H+ATP
K+(Na+)
Cl-
Na+Inositol
H+Cl-
H+
Cl-
ATP
Na+
H+
Na+
Ca2+
Ca2+
Ca2+ATP
Ca
2+H
+
Cl-
Ca2+
Ca2+ATP
NaCl↑

Cell expansion during growth – volume increases 10- to 100-fold as cells develop to maturity, due mostly to an increase in the vacuole size, i.e., water uptake into the vacuole drives cell expansion
Vacuolar compartmentalization of Na+ and Cl- facilitates cell expansion and prevents metabolic poisoning of the cytosol and organelles
Osmolytes mediate osmotic adjustment in the cytosol or organelles

Ion homeostasis transport proteins - coordinate net Na+ and Cl- uptake across the plasma membrane with the capacity to compartmentalize these ions into the vacuole, i.e., cytosolic Na+ and Cl- concentrations in the cytosol are maintained below toxic levels
26.15 Membrane transport proteins mediating sodium, potassium, and calcium transport
Na+ influx is passive (nonselective cation channel(s)) (NSCC), HKT1 transport system, and leak through K+ uptake systems because of the inside negative potential across the plasma membrane
Plasma membrane:
Cl- uptake is active (because of the inside negative potential across the plasma membrane)presumably a Cl- - H+ symporter
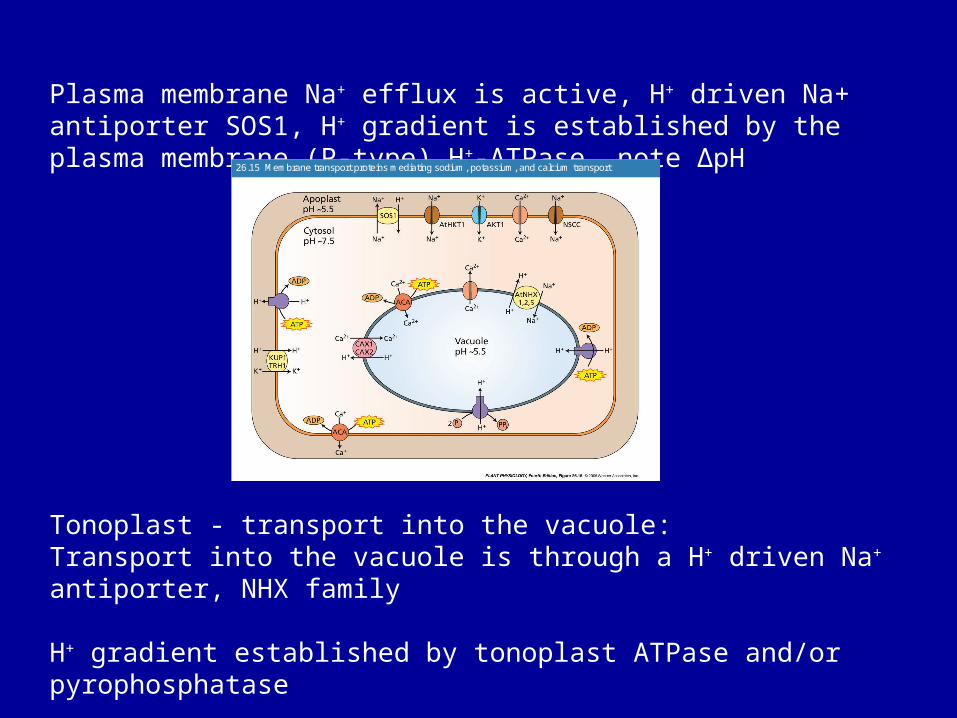
Plasma membrane Na+ efflux is active, H+ driven Na+ antiporter SOS1, H+ gradient is established by the plasma membrane (P-type) H+-ATPase, note ∆pH 26.15 Membrane transport proteins mediating sodium, potassium, and calcium transport
Tonoplast - transport into the vacuole:Transport into the vacuole is through a H+ driven Na+ antiporter, NHX family
H+ gradient established by tonoplast ATPase and/or pyrophosphatase

Salt stress signaling – regulates Na+ ion homeostasis
Na+ (high concentrations) induces Ca2+ transients that regulate the SOS signal pathway
[Na+]ext↑ → [Ca2+]cyt↑ → SOS3 → SOS2 → SOS1SOS3 - Ca2+ binding protein, SOS2 - kinase, SOS1 - H+ driven Na+ antiporter
Negative regulation: AtHKT1
[Ca2+]ext blocks Na+ uptake through NSCC
26.16 Regulation of ion homeostasis by the SOS signal transduct ion pathway

SOS3-SOS2 complex phosphorylates SOS1 to activate its Na+/H+ antiporter activity
SOS3-SOS2 complex induces the expression of SOS1 through some yet unknown transcription factor
SOS pathway regulates AtNHX family antiporters at the post-transcriptional level
The activated SOS pathway and outputs of the pathway are targets for bioengineering of salt tolerance by constitutive activation of the pathway
Ectopic expression of ion homeostasis determinants