sales compensation: tips and tricks to building a powerful plan
TRANSCRIPT
Who are we creating comp plans for anyway?

Meet the Millennials – Your New Sales Hires

The Profile of a Successful BDR or SDR Hire
0-2 Years of Experience Coachable Genuine
CuriosityTrack Record of Winning
Hungry Eager to Make Impact
Goals and Results Driven
Ultimate Stalker

What Millennials Need Out of Their Comp Plan…

SimplicityStructure
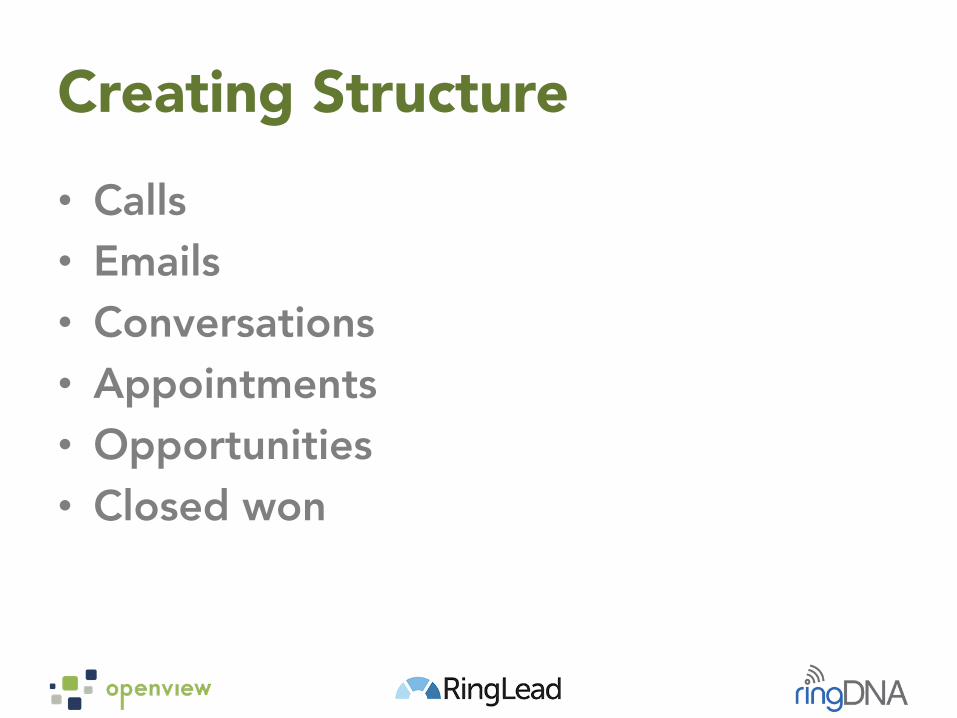
Creating Structure• Calls• Emails• Conversations• Appointments• Opportunities• Closed won

Comp Plan Creation: Creating a Comp Plan that Drives Success
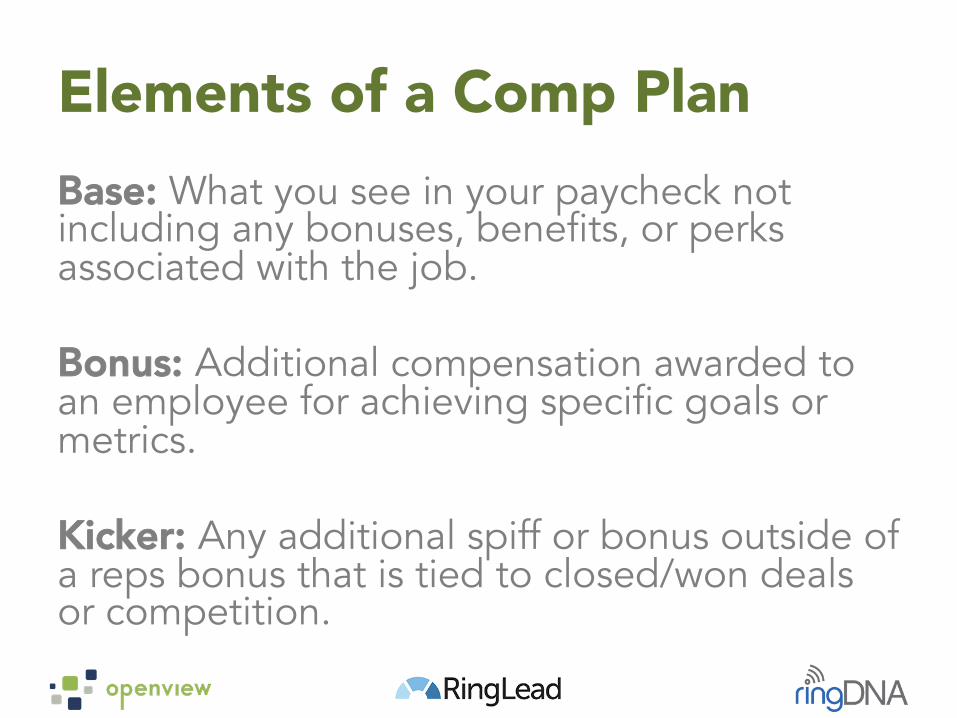
Elements of a Comp PlanBase: What you see in your paycheck not including any bonuses, benefits, or perks associated with the job.
Bonus: Additional compensation awarded to an employee for achieving specific goals or metrics.
Kicker: Any additional spiff or bonus outside of a reps bonus that is tied to closed/won deals or competition.

What is a bonus comprised on?
40% Appointment60% Opportunities
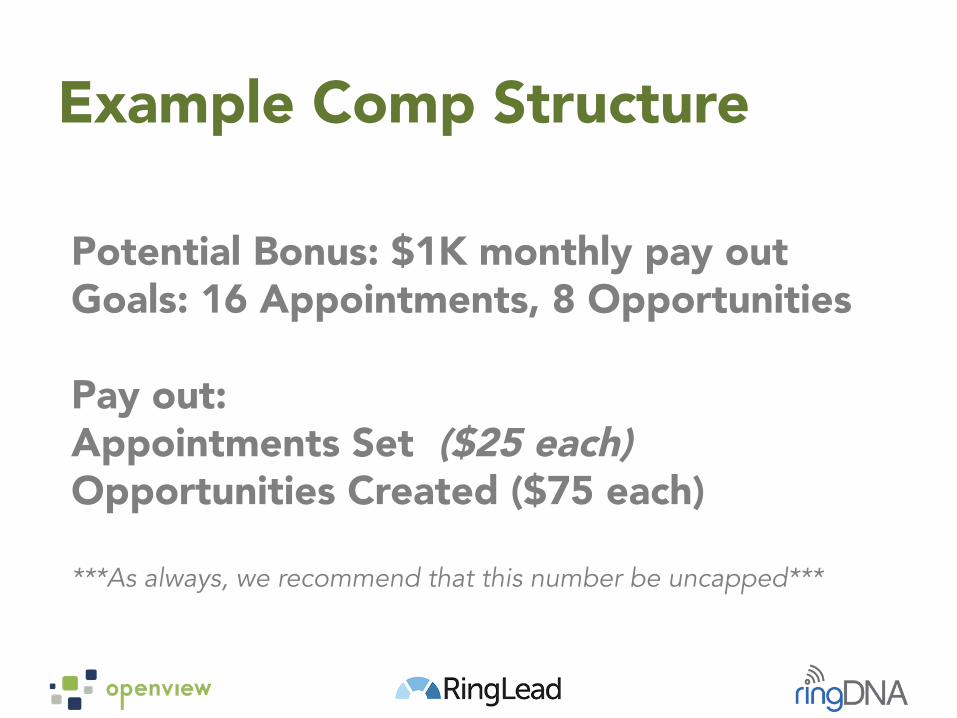
Potential Bonus: $1K monthly pay outGoals: 16 Appointments, 8 Opportunities
Pay out:Appointments Set ($25 each)Opportunities Created ($75 each)
***As always, we recommend that this number be uncapped***
Example Comp Structure

OTE Breakdown: Base vs. Bonus
70% Base30% Bonus

Additional Kicker
10% MRR.89% ARR
Tying It All TogetherDesigning a comp plan is like closing a deal:
– Remember your target audience– Know what you want them to do– Show them how to get there– Tell them what the results are– Be consistent in your delivery

John Kosturos, VP of Sales

The Ultimate Sales Compensation Plan 100% Data Driven

Cold Calling 2.0 Model Controlling the List
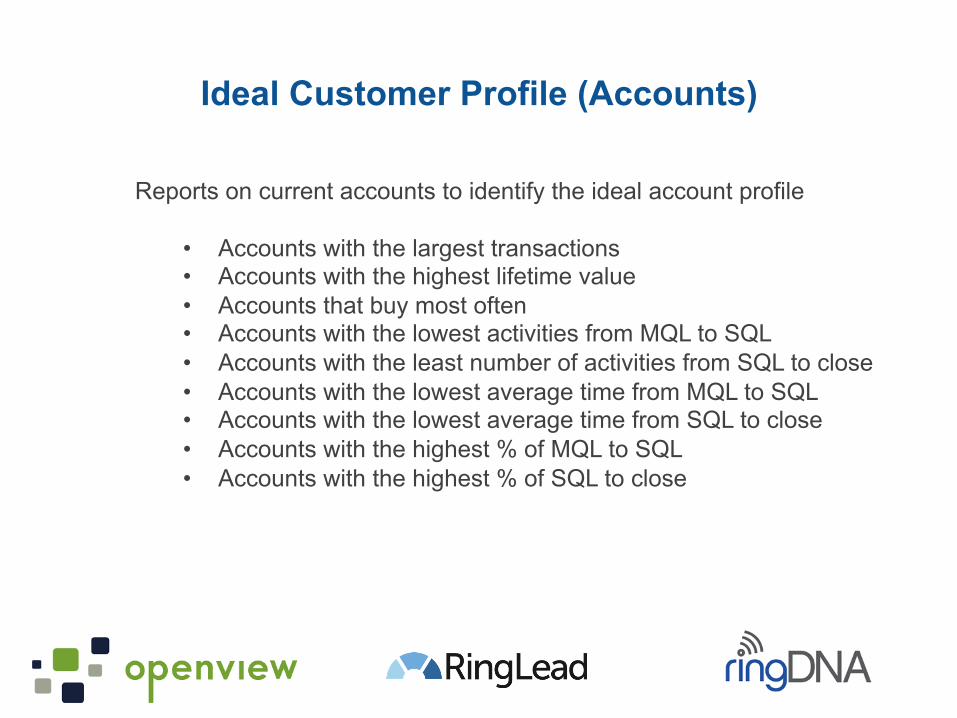
Reports on current accounts to identify the ideal account profile
• Accounts with the largest transactions • Accounts with the highest lifetime value • Accounts that buy most often • Accounts with the lowest activities from MQL to SQL • Accounts with the least number of activities from SQL to close • Accounts with the lowest average time from MQL to SQL • Accounts with the lowest average time from SQL to close • Accounts with the highest % of MQL to SQL • Accounts with the highest % of SQL to close
Ideal Customer Profile (Accounts)
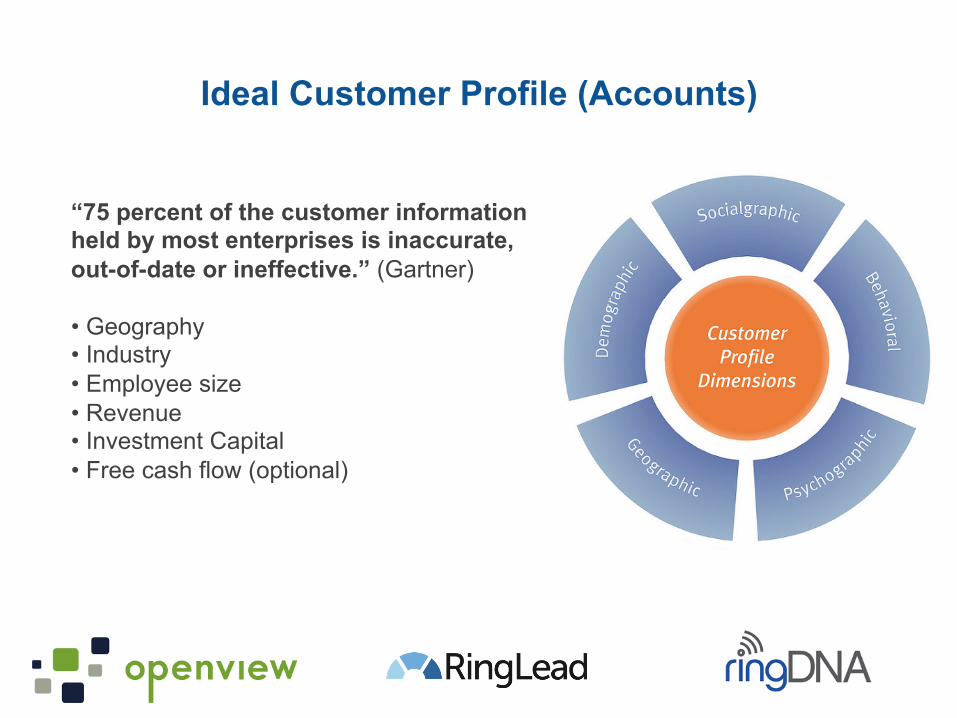
“75 percent of the customer information held by most enterprises is inaccurate, out-of-date or ineffective.” (Gartner)
• Geography • Industry • Employee size • Revenue • Investment Capital • Free cash flow (optional)
Ideal Customer Profile (Accounts)

Map Your Entire Potential Dream Market!!

Identify Decision Makers at Target Accounts
Think About It for a Moment

• Best buyer market segments (segment top 20%) o Industry, employees, revenue, geography, other proprietary metrics
• Average deal size per segment
• Total number of potential accounts per segment (mapping markets)
• What percentage of leads should convert to customers
• Number of activities it takes to close an account
• Goal for how long it should take for you team to work through each market segment
B2B Sales Comp Plan Metrics

• 25000 potential accounts
• 3 key contacts per account (75,000 contacts)
• 8 activities per contact on avg (24 activities per account)
• 600,000 total activities to exhaust the list
• New reps can accomplish about 600 activities per week
• 600,000/600 = 1000 weeks
• If the goal of the company is to exhaust the list in 12 months, it will take ~18 sales people (1000/56 = 17.85)
Sample Target Segment Analysis

Top 3 best buyer segments for example company: 1. Technology companies in USA have an average deal size of $10000 and
close at about 5%. (Assuming 600 combined call/email activities completed per rep, per week.)
2. Manufacturing companies in USA have an average deal size of $3000 and close at about 10%. (Assuming 600 call/email activities completed per rep, per week)
3. Banks in USA have an average deal size of $20000, close at about a 4% clip (Assuming 600 call/email activities completed per rep, per week)
Example of Compensation Calculation

You can calculate your annual revenue per rep with a clear understanding of your avg deal size and close rate. 1. (5% closed) = 1250 new accounts * $10K avg deal = $12,500,000
• $694,444 revenue per rep • $104,000 - $208,000 (comfortable salary + commission range)
2. (10% closed) = 2500 new accounts * $3K avg deal = $7,500,000 • $416,666 revenue per rep • $62,500 - $125,000 (comfortable salary + commission range)
3. (4% closed) 1000 new accounts * $20K avg deal = $20,000,000 • $1,111,111 revenue per rep • $166,666 - $333,333 (comfortable salary + commission range)
Example of Compensation Calculation

Business Data Report Card
Forecasting D
Customer Service F
Sales Efficiency C-
Productivity D-
Client Renewals D
CRM User Adoption F

Howard Brown CEO, RingDNA

We all build comp plans to achieve top performance

But top performance is actually the sum of many parts

The Golden Rule: If it’s not in CRM it doesn’t exist
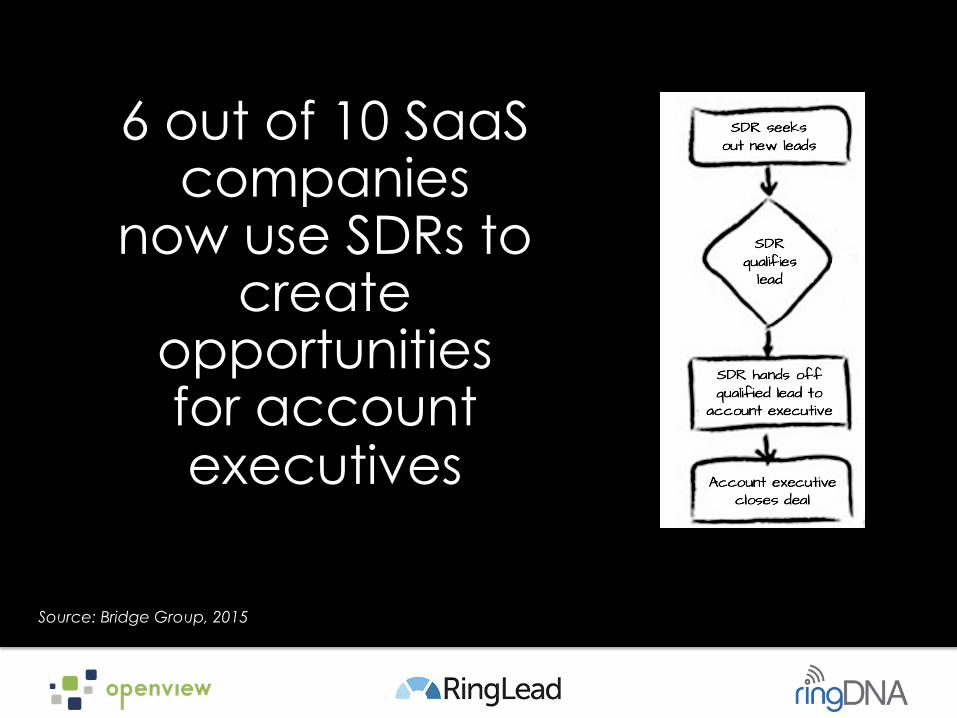
6 out of 10 SaaS companies
now use SDRs to create
opportunities for account executives
Source: Bridge Group, 2015

Two primary ways to comp SDRs RESULTS REVENUE
Mee,ngs, Opportuni,es % of Won Opportuni,es

But putting too much emphasis on any one area can spell trouble

Commonly Tracked Metrics

Give SDRs insight into tracking activity volume versus goals.

The number of sales conversations directly affects quota attainment
Source: Bridge Group, 2015

The entire team will perform at a higher level

To get more wins

Q&A