sales compensation & performance management study
TRANSCRIPT
No portion of this report may be reproduced or distributed in any form or by any means without the
prior written permission of the authors.
Copyright © 2015 CSO Insights All Rights Reserved.
Sales Compensation & Performance Management Study – 2015 Key Trends Analysis
Sales Compensation & Performance Management Study
2015 Key Trends Analysis
Compliments of:

No portion of this report may be reproduced or distributed in any form or by any means without the
prior written permission of the authors.
Copyright © 2015 CSO Insights All Rights Reserved.
Sales Compensation & Performance Management Study – 2015 Key Trends Analysis
Terms and Conditions Printed in the United States of America. Except as permitted under the United States Copyright Act of 1976, no part of this publication may be produced or distributed in any form or by any means, or stored in a database or retrieval systems, without the prior written permission of the publisher. For additional information, contact MHI Global, Inc. 10901 W. Toller Drive, Suite 202, Littleton, CO 80127 email: [email protected]. The reader understands that the information and data used in preparation of this report were as accurate as reasonably possible at the time of preparation by the publisher. The publisher assumes no responsibility to update the information or publication. The publisher assumes that the readers will use the information contained in this publication for the purpose of informing themselves on the matters which form the subject of this publication. It is licensed with the understanding that neither the authors nor those individuals interviewed are engaged in rendering legal, accounting, or other professional service. If legal or other expert advice is required, the services of a competent professional person should be sought. The publisher assumes no responsibility for any use to which the purchaser puts this information. All views expressed in this report are those of the individuals interviewed and do not necessarily reflect those of the companies or organizations they may be affiliated with, MHI Global, Inc. All trademarks are trademarks of their respective companies.
Copyright © 2015 CSO Insights
All Rights Reserved.

No portion of this report may be reproduced or distributed in any form or by any means without the
prior written permission of the authors.
Copyright © 2015 CSO Insights All Rights Reserved.
Sales Compensation & Performance Management Study – 2015 Key Trends Analysis
Acknowledgments
We would like to thank all of the sales and sales operations executives who annually share insights related to their sales compensation and
performance management ideas and best practices. Their help assists us in asking new and relevant questions as the world of compensation and
performance management continues to change. Without their support and insights, the development of the research knowledge base used to
create the 2015 Sales Compensation & Performance Management study would not be possible.
For this reason, we would like to thank the following thought leadership companies for their partnership and insights into sales compensation
and performance management and how these practices are changing the way the game is played. We acknowledge Accenture, CallidusCloud,
IBM, and Xactly for their insights.
We owe a debt of gratitude to many colleagues, mentors, and advisors whose help made this project possible. To list them all would be impossible,
but Jerry Colletti at Colletti-Fiss deserves special mention.
Finally, we would like to thank our editing team whose hard work and diligence made this project possible. Thanks to Kim Cameron, Diane Hodges,
PhD, Andy Jesmok, and Crystal Turnau.

No portion of this report may be reproduced or distributed in any form or by any means without the
prior written permission of the authors.
Copyright © 2015 CSO Insights All Rights Reserved.
Sales Compensation & Performance Management Study – 2015 Key Trends Analysis
Table of Contents
2015 Sales Compensation & Performance Management Study Introduction ............................................................................... 1
Compensation Plan Design Objectives ........................................................................................................................................ 6
Average Annual Quota Size ........................................................................................................................................................ 9
Annual Salesperson Turnover Rates ......................................................................................................................................... 11
Factors Used in Establishing Territories .................................................................................................................................... 13
Total Targeted Compensation for Direct Sales Force ................................................................................................................. 15
Key Areas of Focus for Fiscal 2015 ............................................................................................................................................ 17
Management Behaviors Impacted by Compensation Plans ....................................................................................................... 19
Biggest Challenges When Rolling Out Sales Compensation Plans .............................................................................................. 22
Frequency That Dashboards are Used to Review Performance Metrics ..................................................................................... 24
Ability to Perform Sales Performance Management Activities .................................................................................................. 26
Going Forward Analysis ........................................................................................................................................................... 29
About CSO Insights .................................................................................................................................................................. 32
Copyright © 2015 CSO Insights All Rights Reserved. No portion of this report may be reproduced or distributed in any form or by any means without the
prior written permission of the authors.
Page 1
Sales Compensation & Performance Management Study – 2015 Key Trends Analysis
2015 Sales Compensation & Performance Management Study Introduction
The data used for this analysis were gathered as part of CSO Insights’ 7th Annual Sales Compensation & Performance Management study. As part
of this research effort, we surveyed over 250 companies worldwide collecting information from over 70 sales compensation and performance
management related metrics. For a detailed breakdown of the survey participants, contact CSO Insights. The graphs in this report reflect the
aggregated results from the study participants.
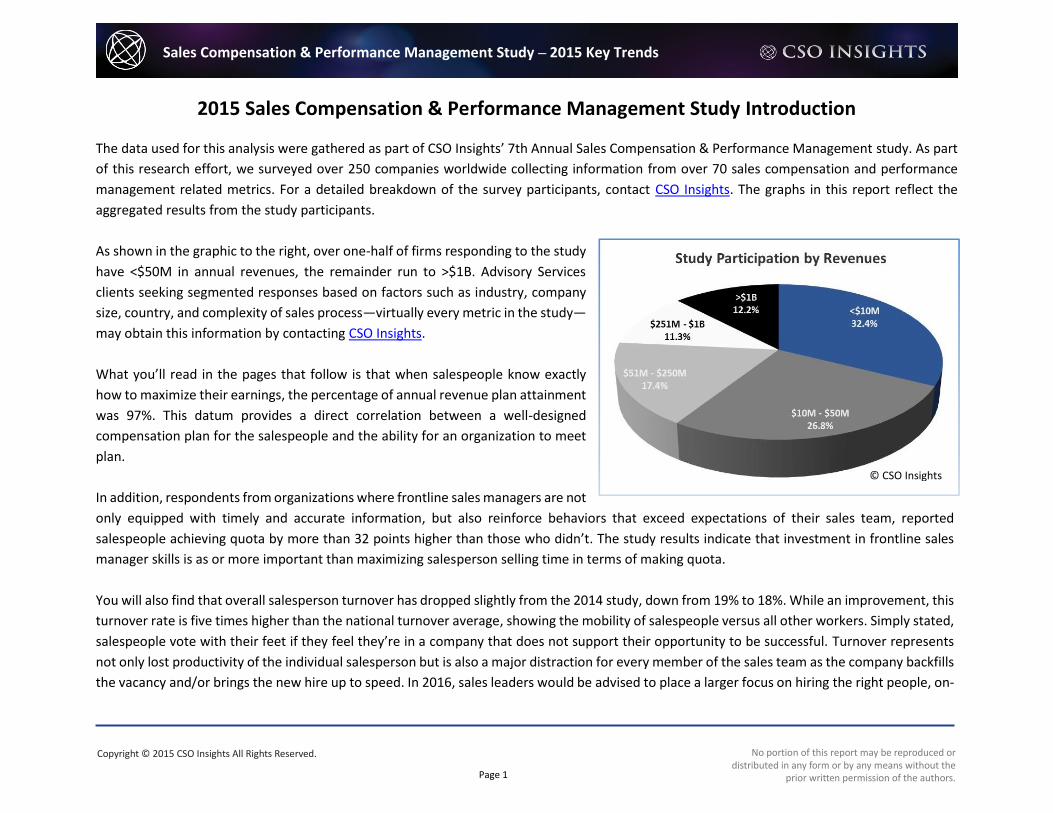
As shown in the graphic to the right, over one-half of firms responding to the study
have <$50M in annual revenues, the remainder run to >$1B. Advisory Services
clients seeking segmented responses based on factors such as industry, company
size, country, and complexity of sales process—virtually every metric in the study—
may obtain this information by contacting CSO Insights.
What you’ll read in the pages that follow is that when salespeople know exactly
how to maximize their earnings, the percentage of annual revenue plan attainment
was 97%. This datum provides a direct correlation between a well-designed
compensation plan for the salespeople and the ability for an organization to meet
plan.
In addition, respondents from organizations where frontline sales managers are not
only equipped with timely and accurate information, but also reinforce behaviors that exceed expectations of their sales team, reported
salespeople achieving quota by more than 32 points higher than those who didn’t. The study results indicate that investment in frontline sales
manager skills is as or more important than maximizing salesperson selling time in terms of making quota.
You will also find that overall salesperson turnover has dropped slightly from the 2014 study, down from 19% to 18%. While an improvement, this
turnover rate is five times higher than the national turnover average, showing the mobility of salespeople versus all other workers. Simply stated,
salespeople vote with their feet if they feel they’re in a company that does not support their opportunity to be successful. Turnover represents
not only lost productivity of the individual salesperson but is also a major distraction for every member of the sales team as the company backfills
the vacancy and/or brings the new hire up to speed. In 2016, sales leaders would be advised to place a larger focus on hiring the right people, on-
© CSO Insights

Copyright © 2015 CSO Insights All Rights Reserved. No portion of this report may be reproduced or distributed in any form or by any means without the
prior written permission of the authors.
Page 2
Sales Compensation & Performance Management Study – 2015 Key Trends Analysis
going employee development practices, and, especially, salesperson retention to reduce turnover. (Note: 20% of responding firms do not target
retention.)
We ended last year’s report with a new metric, but thought it would be interesting to start with the grade companies gave their compensation
and incentive plans this year versus last (see below).
As you can see, A+ had a huge 30% increase, but remains a tiny number (3%). A’s slipped a couple points, C’s decreased, and the biggest
improvement was the reduction in D’s; all of these reductions accrued to the B’s. Before reading on, take a moment and ask yourself the same
question we asked in our survey: What grade would you give your compensation/incentive management program(s)? The table below gives an
idea of how key performance metrics vary along this subjective grading scale.
© CSO Insights
Copyright © 2015 CSO Insights All Rights Reserved. No portion of this report may be reproduced or distributed in any form or by any means without the
prior written permission of the authors.
Page 3
Sales Compensation & Performance Management Study – 2015 Key Trends Analysis
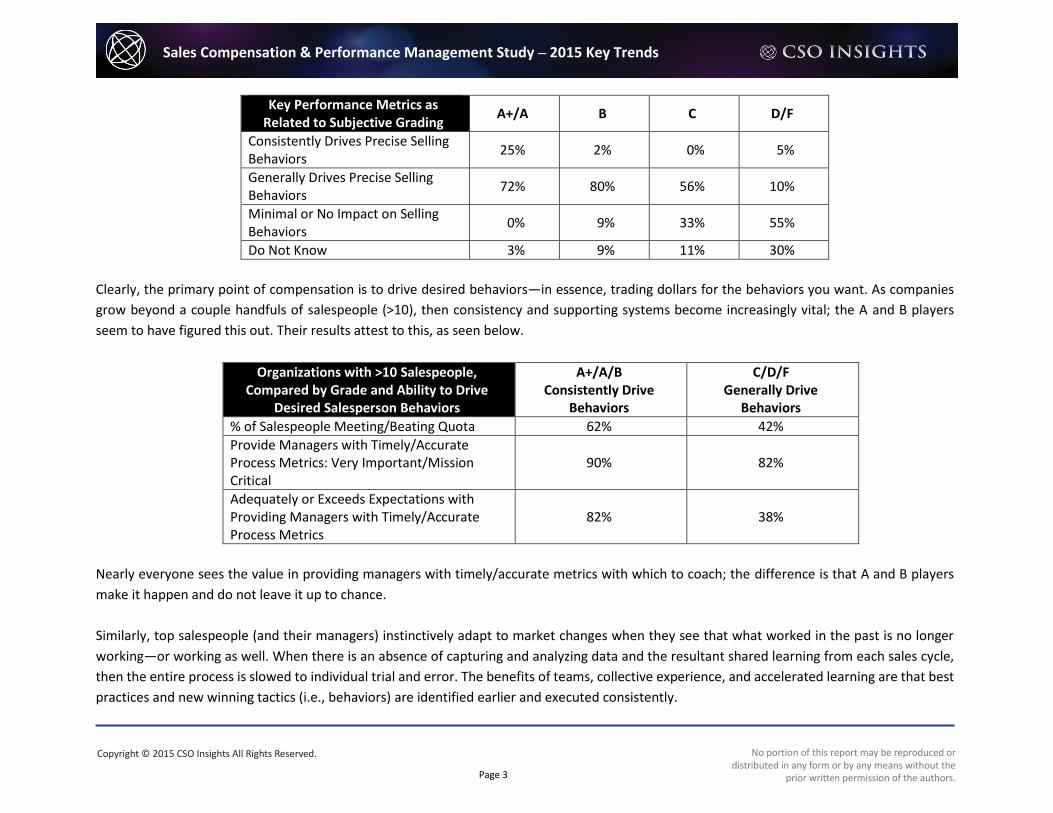
Key Performance Metrics as Related to Subjective Grading
A+/A B C D/F
Consistently Drives Precise Selling Behaviors
25% 2% 0% 5%
Generally Drives Precise Selling Behaviors
72% 80% 56% 10%
Minimal or No Impact on Selling Behaviors
0% 9% 33% 55%
Do Not Know 3% 9% 11% 30%
Clearly, the primary point of compensation is to drive desired behaviors—in essence, trading dollars for the behaviors you want. As companies
grow beyond a couple handfuls of salespeople (>10), then consistency and supporting systems become increasingly vital; the A and B players
seem to have figured this out. Their results attest to this, as seen below.
Organizations with >10 Salespeople, Compared by Grade and Ability to Drive
Desired Salesperson Behaviors
A+/A/B Consistently Drive
Behaviors
C/D/F Generally Drive
Behaviors
% of Salespeople Meeting/Beating Quota 62% 42%
Provide Managers with Timely/Accurate Process Metrics: Very Important/Mission Critical
90% 82%
Adequately or Exceeds Expectations with Providing Managers with Timely/Accurate Process Metrics
82% 38%
Nearly everyone sees the value in providing managers with timely/accurate metrics with which to coach; the difference is that A and B players
make it happen and do not leave it up to chance.
Similarly, top salespeople (and their managers) instinctively adapt to market changes when they see that what worked in the past is no longer
working—or working as well. When there is an absence of capturing and analyzing data and the resultant shared learning from each sales cycle,
then the entire process is slowed to individual trial and error. The benefits of teams, collective experience, and accelerated learning are that best
practices and new winning tactics (i.e., behaviors) are identified earlier and executed consistently.

Copyright © 2015 CSO Insights All Rights Reserved. No portion of this report may be reproduced or distributed in any form or by any means without the
prior written permission of the authors.
Page 4
Sales Compensation & Performance Management Study – 2015 Key Trends Analysis
Point solutions in sales analytics and sales performance management (SPM) systems are able to provide sales managers access to the performance
data—not simply the sales results—that allow them to offer coaching and/or intervene when they can still make a difference. There are many
factors that suggest salespeople need additional attention sooner rather than later: Sales cycles that are stalled beyond usual limits; deals that
are forecast to close but have not gone through half the sales process steps; opportunities with close dates that have been moved out, or
repeatedly modified; as well as countless others.
To further reinforce, support, and accelerate this virtuous cycle, the long lever
of pay is applied—a positive reinforcement if ever there was one. But this is
the exact point where the data break down: 41% of firms report they need
improvement in providing timely/accurate metrics to their sales managers.
And yet, 51.6% of responding firms use spreadsheets or manually calculate
commission payments, as shown in the chart on the right.
Does this majority feel they can do it on muscle or sheer force of will? Or do
they simply turn their backs on questions of performance improvement and
judge how well things are working by the timeliness and accuracy of
commission payments and the lack of complaints? It’s an approach, but one
that in today’s hyper-competitive, rapidly changing, and increasingly
demanding B2B environment is sure to leave these firms in the dust. Here’s
the good news: your firm doesn’t have to be one of them!
With this foundation in place, here’s a summary of key points that are described and discussed in the pages that follow:
Compensation plans that are both understandable and have actionable payoff are more successful in motivating the sales force.
Attention is needed to align quota size with the salesperson’s perceived or real view of the compensation plan’s attainability.
There is a need for continued focus on developing and maintaining an environment of success for sales professionals to reduce
turnover.
Sales leaders should allocate territories according to the current skill set of the sales professional and the current needs of the
customer.
More precision in designing compensation plans is needed to deliver the expected salesperson behaviors and results.
© CSO Insights
Copyright © 2015 CSO Insights All Rights Reserved. No portion of this report may be reproduced or distributed in any form or by any means without the
prior written permission of the authors.
Page 5
Sales Compensation & Performance Management Study – 2015 Key Trends Analysis
The transformation to a customer-centric sales force focus deserves more investment than the current rhetoric.
A positive sales culture and identifying reps that need additional coaching pave the way for delivering the number.
Modeling of proposed compensation plans via sales forecast analytics enables organizations to bring visibility to the probable financial
impact of each plan.
Performance dashboards should provide relevant sales process metrics in terms of normal variance versus instantaneous snapshots.
Investment in sales manager skill sets is the key move to maximize the number of salespeople making quota.
The desired end state is a sales force that is clear on what is expected of them relative to behavior and performance. It is important that the sales
force is equally clear on how behavior and performance are measured by receiving timely, individualized, and consistent feedback—along with
pay—commensurate to and accurate for the performance delivered. With this list of key points in mind, read the remainder of this report and
keep notes on how your firm, sales management team, and sales organization/operation measure up. Advisory Services clients have direct access
to their CSO Insights Analyst at any time, and we encourage you to use this service.
Contact us if you have questions or comments regarding this report, want to know about companies that excel in a specific area, or how best to
invest your sales enablement budgets. If you have any questions or comments on the information presented in this report, feel free to contact
us. We wish you continued success as you wrap up 2015, gain new insights, and implement winning ways throughout 2016!
Barry Trailer Thomas Chamberlain Research Fellow Research Director +1 916-712-9621 +1 630-750-6704 [email protected] [email protected]
Copyright © 2015 CSO Insights All Rights Reserved. No portion of this report may be reproduced or distributed in any form or by any means without the
prior written permission of the authors.
Page 6
Sales Compensation & Performance Management Study – 2015 Key Trends Analysis
Summary of Findings
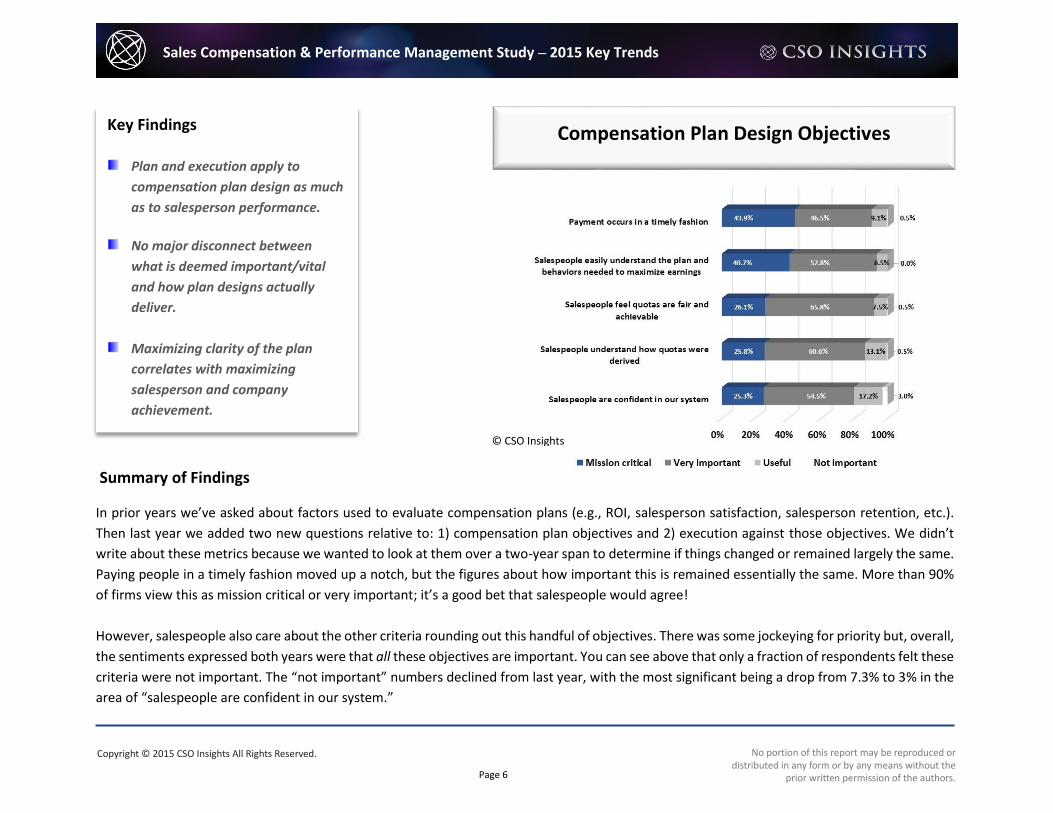
In prior years we’ve asked about factors used to evaluate compensation plans (e.g., ROI, salesperson satisfaction, salesperson retention, etc.).
Then last year we added two new questions relative to: 1) compensation plan objectives and 2) execution against those objectives. We didn’t
write about these metrics because we wanted to look at them over a two-year span to determine if things changed or remained largely the same.
Paying people in a timely fashion moved up a notch, but the figures about how important this is remained essentially the same. More than 90%
of firms view this as mission critical or very important; it’s a good bet that salespeople would agree!
However, salespeople also care about the other criteria rounding out this handful of objectives. There was some jockeying for priority but, overall,
the sentiments expressed both years were that all these objectives are important. You can see above that only a fraction of respondents felt these
criteria were not important. The “not important” numbers declined from last year, with the most significant being a drop from 7.3% to 3% in the
area of “salespeople are confident in our system.”
© CSO Insights
Key Findings
Plan and execution apply to
compensation plan design as much
as to salesperson performance.
No major disconnect between
what is deemed important/vital
and how plan designs actually
deliver.
Maximizing clarity of the plan
correlates with maximizing
salesperson and company
achievement.
Compensation Plan Design Objectives
Copyright © 2015 CSO Insights All Rights Reserved. No portion of this report may be reproduced or distributed in any form or by any means without the
prior written permission of the authors.
Page 7
Sales Compensation & Performance Management Study – 2015 Key Trends Analysis
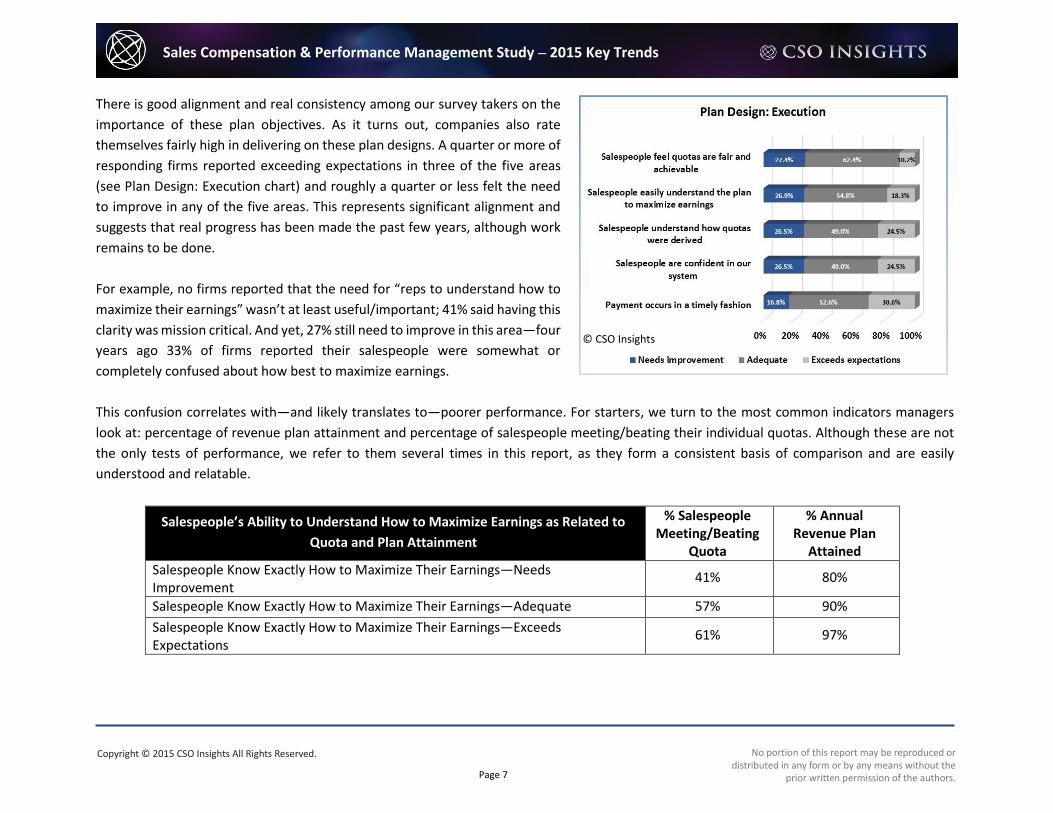
There is good alignment and real consistency among our survey takers on the
importance of these plan objectives. As it turns out, companies also rate
themselves fairly high in delivering on these plan designs. A quarter or more of
responding firms reported exceeding expectations in three of the five areas
(see Plan Design: Execution chart) and roughly a quarter or less felt the need
to improve in any of the five areas. This represents significant alignment and
suggests that real progress has been made the past few years, although work
remains to be done.
For example, no firms reported that the need for “reps to understand how to
maximize their earnings” wasn’t at least useful/important; 41% said having this
clarity was mission critical. And yet, 27% still need to improve in this area—four
years ago 33% of firms reported their salespeople were somewhat or
completely confused about how best to maximize earnings.
This confusion correlates with—and likely translates to—poorer performance. For starters, we turn to the most common indicators managers
look at: percentage of revenue plan attainment and percentage of salespeople meeting/beating their individual quotas. Although these are not
the only tests of performance, we refer to them several times in this report, as they form a consistent basis of comparison and are easily
understood and relatable.
Salespeople’s Ability to Understand How to Maximize Earnings as Related to
Quota and Plan Attainment
% Salespeople Meeting/Beating
Quota
% Annual Revenue Plan
Attained
Salespeople Know Exactly How to Maximize Their Earnings—Needs Improvement
41% 80%
Salespeople Know Exactly How to Maximize Their Earnings—Adequate 57% 90%
Salespeople Know Exactly How to Maximize Their Earnings—Exceeds Expectations
61% 97%
© CSO Insights
Copyright © 2015 CSO Insights All Rights Reserved. No portion of this report may be reproduced or distributed in any form or by any means without the
prior written permission of the authors.
Page 8
Sales Compensation & Performance Management Study – 2015 Key Trends Analysis
This correlation is both direct and desirable; that is, what’s good for the salesperson is also good for the company. When salesperson quota
achievement is high but overall revenue attainment is low, or revenue attainment is high but the number of salespeople hitting their individual
number is low, there will be both confusion and conflict. Making plans that are understandable and actionable pays off, literally.
Later, we’ll look at this important subject from a different angle (see page 15) as it relates to salespeople and their understanding of corporate
goals/objectives.
Copyright © 2015 CSO Insights All Rights Reserved. No portion of this report may be reproduced or distributed in any form or by any means without the
prior written permission of the authors.
Page 9
Sales Compensation & Performance Management Study – 2015 Key Trends Analysis
Summary of Findings
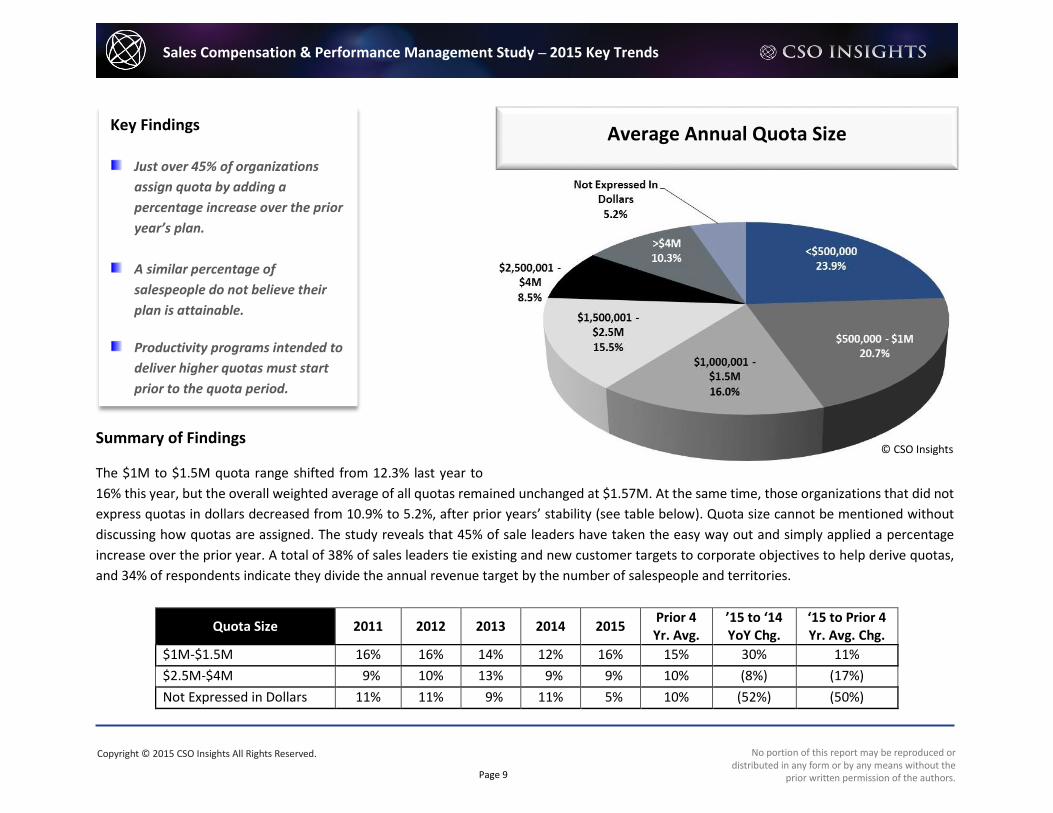
The $1M to $1.5M quota range shifted from 12.3% last year to
16% this year, but the overall weighted average of all quotas remained unchanged at $1.57M. At the same time, those organizations that did not
express quotas in dollars decreased from 10.9% to 5.2%, after prior years’ stability (see table below). Quota size cannot be mentioned without
discussing how quotas are assigned. The study reveals that 45% of sale leaders have taken the easy way out and simply applied a percentage
increase over the prior year. A total of 38% of sales leaders tie existing and new customer targets to corporate objectives to help derive quotas,
and 34% of respondents indicate they divide the annual revenue target by the number of salespeople and territories.
Quota Size 2011 2012 2013 2014 2015 Prior 4 Yr. Avg.
’15 to ‘14 YoY Chg.
‘15 to Prior 4 Yr. Avg. Chg.
$1M-$1.5M 16% 16% 14% 12% 16% 15% 30% 11%
$2.5M-$4M 9% 10% 13% 9% 9% 10% (8%) (17%)
Not Expressed in Dollars 11% 11% 9% 11% 5% 10% (52%) (50%)
Key Findings
Just over 45% of organizations
assign quota by adding a
percentage increase over the prior
year’s plan.
A similar percentage of
salespeople do not believe their
plan is attainable.
Productivity programs intended to
deliver higher quotas must start
prior to the quota period.
Average Annual Quota Size
© CSO Insights

Copyright © 2015 CSO Insights All Rights Reserved. No portion of this report may be reproduced or distributed in any form or by any means without the
prior written permission of the authors.
Page 10
Sales Compensation & Performance Management Study – 2015 Key Trends Analysis
The study indicated that only 57% of salespeople believe their quotas are attainable, which is a problem since other research shows 60% of reps
typically achieve/exceed quota for the company to make plan. Sales leaders should conclude that there is plenty of room for improvement when
aligning quota size with the salesperson’s perceived or real view of plan attainability. As noted earlier, salespeople migrate to where they feel
they can be successful. With four in ten salespeople feeling their assigned quota is unrealistically high, the burden falls to sales managers to
coach—and explain—how each salesperson can succeed (see Going Forward section for more on this topic).
Quota size is also related to average deal size. Basic capacity planning points to the fact that each transaction, regardless of size, consumes a
certain amount of a sales professional’s time. With an average quota attainment across all respondents of 54.6%, increasing quota size without
implementing specific steps to improve salespersons’ effectiveness (win rates) and productivity is an exercise in futility. The timing of these
improvement programs also needs to be examined; they should be rolled out prior to the quota timeframe (e.g., Q4 training to prepare for the
coming year quota assignment) equips salespeople with new skills/tools to meet their new plan. Often organizations assign a larger quota and
then undertake productivity and effectiveness programs. This timing presents a productivity issue in which the salesperson and sales management
team carry the higher quota prior to when the productivity programs become effective. Not accounting for the adoption timeframes and sales
cycles can impact the ability to meet early quarters in the quota period. The rule of thumb is to start major productivity improvement initiatives
at least six months prior to the quarter that it is intended to impact quotas.
When we looked at the size of the quota and compared it to the percentage of salespeople that achieved or exceeded their full year quota (see
table below), there was not a strong connection between the two data points, except at the extreme high end ($4M+). This suggests that it is not
the size of the quota alone that influences the ability to make plan, but also the amount of opportunity in their assigned territory and the ability
of the salesperson to capitalize on that opportunity.
Quota Size % Salespeople
Meeting/Beating Quota
< $500K 51%
$500K - $1M 59%
$1M - $1.5M 58%
$1.5M - $2.5M 52%
$2.5M - $4M 52%
$4M+ 33%
Copyright © 2015 CSO Insights All Rights Reserved. No portion of this report may be reproduced or distributed in any form or by any means without the
prior written permission of the authors.
Page 11
Sales Compensation & Performance Management Study – 2015 Key Trends Analysis
Summary of Findings
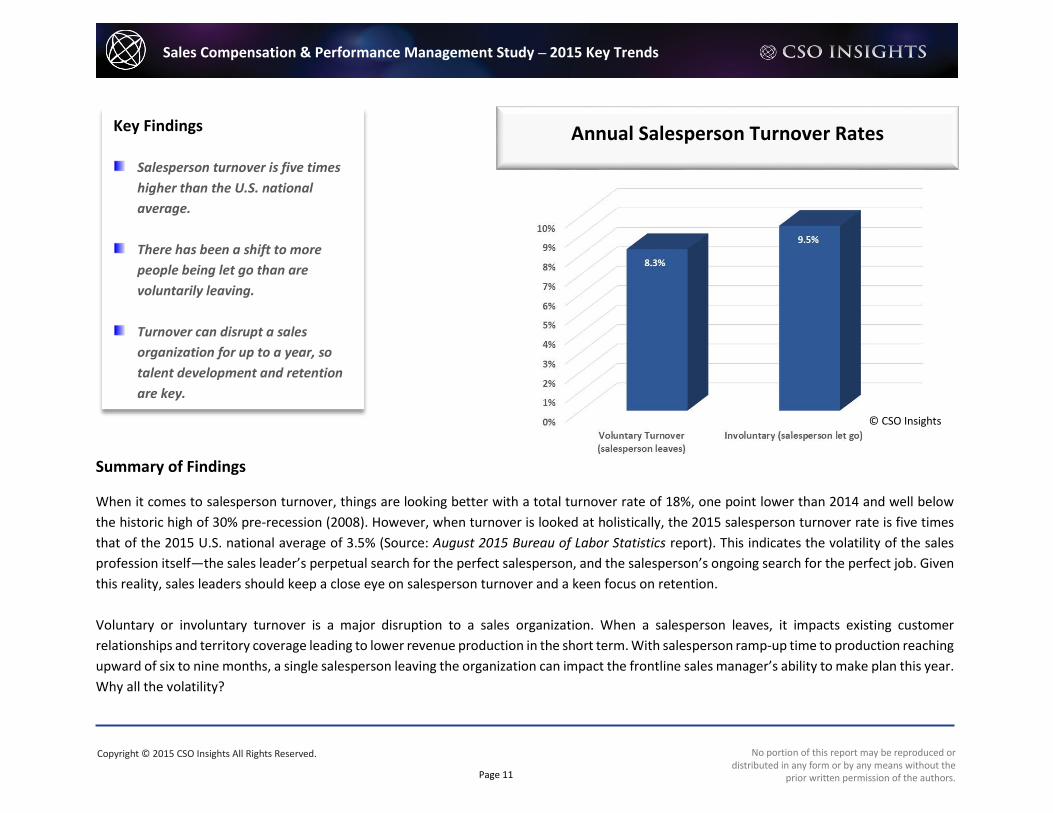
When it comes to salesperson turnover, things are looking better with a total turnover rate of 18%, one point lower than 2014 and well below
the historic high of 30% pre-recession (2008). However, when turnover is looked at holistically, the 2015 salesperson turnover rate is five times
that of the 2015 U.S. national average of 3.5% (Source: August 2015 Bureau of Labor Statistics report). This indicates the volatility of the sales
profession itself—the sales leader’s perpetual search for the perfect salesperson, and the salesperson’s ongoing search for the perfect job. Given
this reality, sales leaders should keep a close eye on salesperson turnover and a keen focus on retention.
Voluntary or involuntary turnover is a major disruption to a sales organization. When a salesperson leaves, it impacts existing customer
relationships and territory coverage leading to lower revenue production in the short term. With salesperson ramp-up time to production reaching
upward of six to nine months, a single salesperson leaving the organization can impact the frontline sales manager’s ability to make plan this year.
Why all the volatility?
Annual Salesperson Turnover Rates
Key Findings
Salesperson turnover is five times
higher than the U.S. national
average.
There has been a shift to more
people being let go than are
voluntarily leaving.
Turnover can disrupt a sales
organization for up to a year, so
talent development and retention
are key.
© CSO Insights
Copyright © 2015 CSO Insights All Rights Reserved. No portion of this report may be reproduced or distributed in any form or by any means without the
prior written permission of the authors.
Page 12
Sales Compensation & Performance Management Study – 2015 Key Trends Analysis
The sales professional’s role in a complex B2B environment is a
multifaceted position that requires a wide variety of competencies. As
such, organizations are not always equipped to adequately enable, coach,
and develop individual sales professionals. The path of least resistance
for many organizations is to replace (involuntary) or manage out low
performers. At the same time, these same challenges apply to retaining
high performers that may feel they have maxed out or will only have even
higher quotas to look forward to in the coming year(s).
The turnover data show a shift in the mix of voluntary and involuntary
turnover over the past year. Involuntary turnover grew from 8.7% in 2014
to 9.5% in 2015, while voluntary turnover shrank from 10.6% to 8.3%. It
appears sales organizations are doing a better job at retaining their core
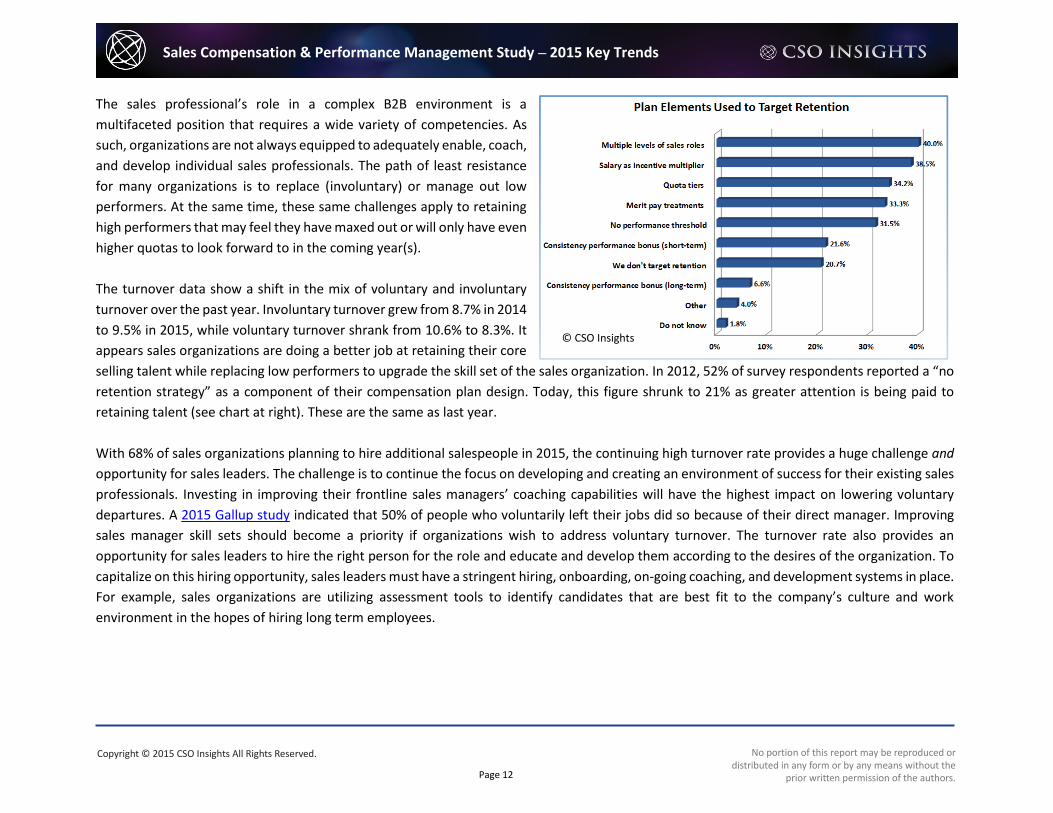
selling talent while replacing low performers to upgrade the skill set of the sales organization. In 2012, 52% of survey respondents reported a “no
retention strategy” as a component of their compensation plan design. Today, this figure shrunk to 21% as greater attention is being paid to
retaining talent (see chart at right). These are the same as last year.
With 68% of sales organizations planning to hire additional salespeople in 2015, the continuing high turnover rate provides a huge challenge and
opportunity for sales leaders. The challenge is to continue the focus on developing and creating an environment of success for their existing sales
professionals. Investing in improving their frontline sales managers’ coaching capabilities will have the highest impact on lowering voluntary
departures. A 2015 Gallup study indicated that 50% of people who voluntarily left their jobs did so because of their direct manager. Improving
sales manager skill sets should become a priority if organizations wish to address voluntary turnover. The turnover rate also provides an
opportunity for sales leaders to hire the right person for the role and educate and develop them according to the desires of the organization. To
capitalize on this hiring opportunity, sales leaders must have a stringent hiring, onboarding, on-going coaching, and development systems in place.
For example, sales organizations are utilizing assessment tools to identify candidates that are best fit to the company’s culture and work
environment in the hopes of hiring long term employees.
© CSO Insights
Copyright © 2015 CSO Insights All Rights Reserved. No portion of this report may be reproduced or distributed in any form or by any means without the
prior written permission of the authors.
Page 13
Sales Compensation & Performance Management Study – 2015 Key Trends Analysis
Summary of Findings
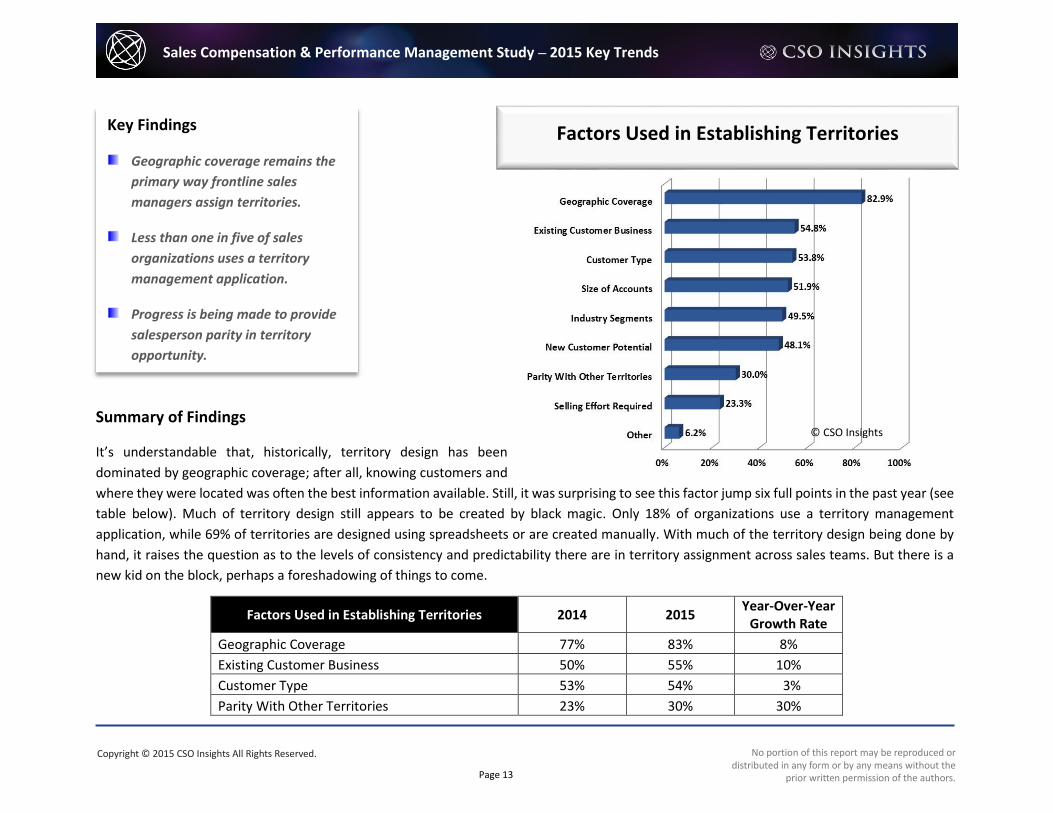
It’s understandable that, historically, territory design has been
dominated by geographic coverage; after all, knowing customers and
where they were located was often the best information available. Still, it was surprising to see this factor jump six full points in the past year (see
table below). Much of territory design still appears to be created by black magic. Only 18% of organizations use a territory management
application, while 69% of territories are designed using spreadsheets or are created manually. With much of the territory design being done by
hand, it raises the question as to the levels of consistency and predictability there are in territory assignment across sales teams. But there is a
new kid on the block, perhaps a foreshadowing of things to come.
Factors Used in Establishing Territories 2014 2015 Year-Over-Year
Growth Rate
Geographic Coverage 77% 83% 8%
Existing Customer Business 50% 55% 10%
Customer Type 53% 54% 3%
Parity With Other Territories 23% 30% 30%
© CSO Insights
Factors Used in Establishing Territories
Key Findings
Geographic coverage remains the
primary way frontline sales
managers assign territories.
Less than one in five of sales
organizations uses a territory
management application.
Progress is being made to provide
salesperson parity in territory
opportunity.
Copyright © 2015 CSO Insights All Rights Reserved. No portion of this report may be reproduced or distributed in any form or by any means without the
prior written permission of the authors.
Page 14
Sales Compensation & Performance Management Study – 2015 Key Trends Analysis
The territory design factor that jumped the most from 2014 to 2015 is “parity with other territories” which grew by seven points—a 30% increase
year-over-year. It appears that more emphasis is being placed on providing sales professionals with an equal opportunity to make plan. One can
speculate that if more sales organizations adopted territory management applications, then the frontline sales manager would have an increased
ability to create equitable sales territories for their staff. Basing territory design decisions on a systematic analysis of the territory (e.g., total
addressable market, named accounts) provides the sales managers with the ability to hold better territory assignment conversations with their
sale professionals without the real or perceived biases that occur in manual processes.
Geographic territories could be looked at as an antiquated approach to territory design. With the advent of cost effective video conferencing and
real-time communication tools being physically close to a customer, geographic territories is not always the ideal choice for territory assignment.
Instead, frontline sales managers could choose to allocate territories according to the current skill set of the sales professional and the current
needs of the customer. For example, current customers need sales professionals with great account management capabilities, rather than a local
person with business development skills. Skills nearly always trump locale in complex B2B selling.
When designing the sales territories, the sales manager’s objective is to ensure 100% coverage of the geography and customer base while
managing expenses to a given budget. The sales professional’s viewpoint is slightly different. The salesperson simply wants a territory that will
offer a real opportunity to make the assigned quota. In any given region, a salesperson will inevitably be assigned the worst producing territory,
as some territory has to have the least potential. Often to soften the blow, the frontline sales manager assigns the sales professional who has the
“bad” territory a few named accounts outside this geographic territory to supplement production.

Copyright © 2015 CSO Insights All Rights Reserved. No portion of this report may be reproduced or distributed in any form or by any means without the
prior written permission of the authors.
Page 15
Sales Compensation & Performance Management Study – 2015 Key Trends Analysis
Summary of Findings
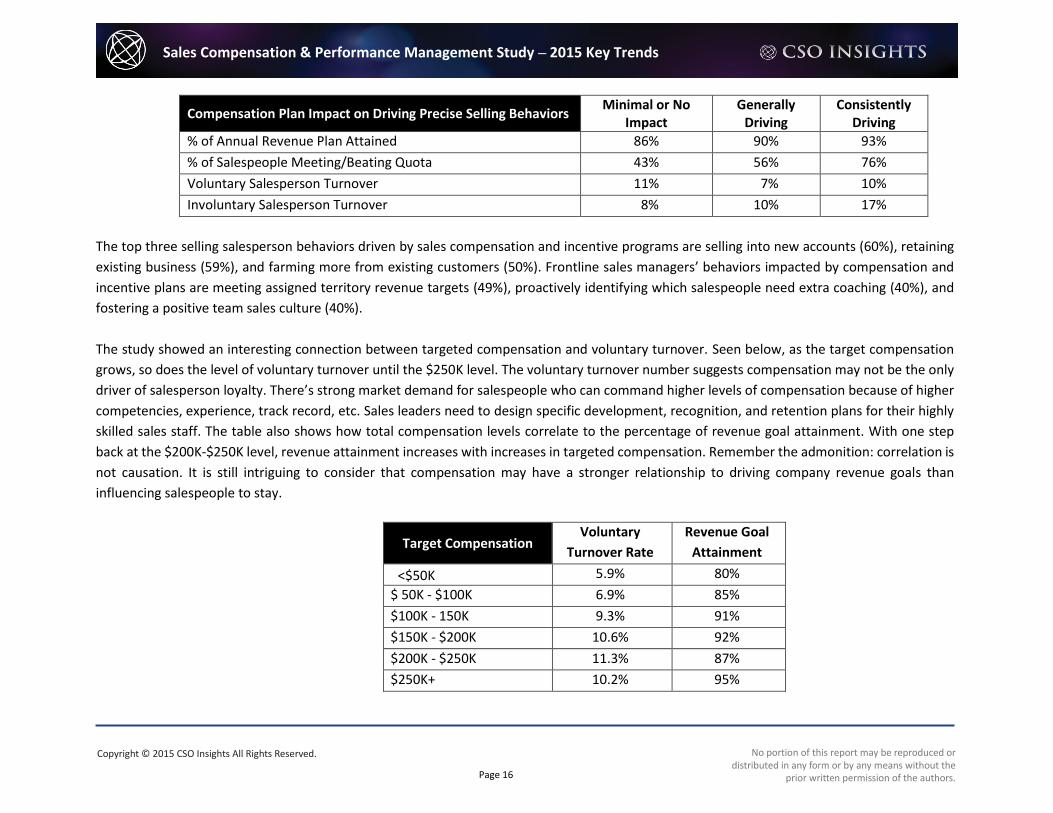
As seen in the chart above, the largest bucket of targeted sales compensation falls into the $100K-$150K range, with nearly one-third (31%) of
respondents—up seven full points from 2014. This change was also the largest of any in the past year, with the increase coming from the two
lower segments. The upper three segments at $150K+, representing nearly a quarter of respondents, were essentially unchanged (a half point
change across all three) year-over-year. So overall, average pay ticked up a bit. Are firms getting what they’re paying for?
The primary objectives of sales compensation plans are to drive desired behavior, recognize achievement, and retain top talent. This year, two-
thirds of organizations reported their incentive programs “generally” drove precise selling behavior (up from 57% in 2014), while an additional
9% of incentive programs “consistently” drove precise selling behavior (down from 12%). In the remaining quarter of organizations, the
compensation and incentive programs had little or no impact on selling behaviors. The table below shows that “generally” is better than
“minimally,” but nothing is better than “consistently.” Of further note, the highest involuntary turnover—double that of the minimal impact
group—is in the “consistent” group, suggesting they are less tolerant of undesired selling behaviors.
Key Findings
$100K - $150K is the largest bucket
of targeted compensation and
increased the most this past year.
Total compensation as a
percentage of total revenues falls
into the 5% - 15% bucket for a
majority of organizations.
Compensation shows stronger
correlation to revenue attainment
than to salesperson retention.
Total Targeted Compensation for Direct Sales Force
© CSO Insights
Copyright © 2015 CSO Insights All Rights Reserved. No portion of this report may be reproduced or distributed in any form or by any means without the
prior written permission of the authors.
Page 16
Sales Compensation & Performance Management Study – 2015 Key Trends Analysis
Compensation Plan Impact on Driving Precise Selling Behaviors Minimal or No
Impact Generally
Driving Consistently
Driving
% of Annual Revenue Plan Attained 86% 90% 93%
% of Salespeople Meeting/Beating Quota 43% 56% 76%
Voluntary Salesperson Turnover 11% 7% 10%
Involuntary Salesperson Turnover 8% 10% 17%
The top three selling salesperson behaviors driven by sales compensation and incentive programs are selling into new accounts (60%), retaining
existing business (59%), and farming more from existing customers (50%). Frontline sales managers’ behaviors impacted by compensation and
incentive plans are meeting assigned territory revenue targets (49%), proactively identifying which salespeople need extra coaching (40%), and
fostering a positive team sales culture (40%).
The study showed an interesting connection between targeted compensation and voluntary turnover. Seen below, as the target compensation
grows, so does the level of voluntary turnover until the $250K level. The voluntary turnover number suggests compensation may not be the only
driver of salesperson loyalty. There’s strong market demand for salespeople who can command higher levels of compensation because of higher
competencies, experience, track record, etc. Sales leaders need to design specific development, recognition, and retention plans for their highly
skilled sales staff. The table also shows how total compensation levels correlate to the percentage of revenue goal attainment. With one step
back at the $200K-$250K level, revenue attainment increases with increases in targeted compensation. Remember the admonition: correlation is
not causation. It is still intriguing to consider that compensation may have a stronger relationship to driving company revenue goals than
influencing salespeople to stay.
Target Compensation Voluntary
Turnover Rate
Revenue Goal
Attainment
<$50K
5.9% 80%
$ 50K - $100K 6.9% 85%
$100K - 150K 9.3% 91%
$150K - $200K 10.6% 92%
$200K - $250K 11.3% 87%
$250K+ 10.2% 95%
Copyright © 2015 CSO Insights All Rights Reserved. No portion of this report may be reproduced or distributed in any form or by any means without the
prior written permission of the authors.
Page 17
Sales Compensation & Performance Management Study – 2015 Key Trends Analysis
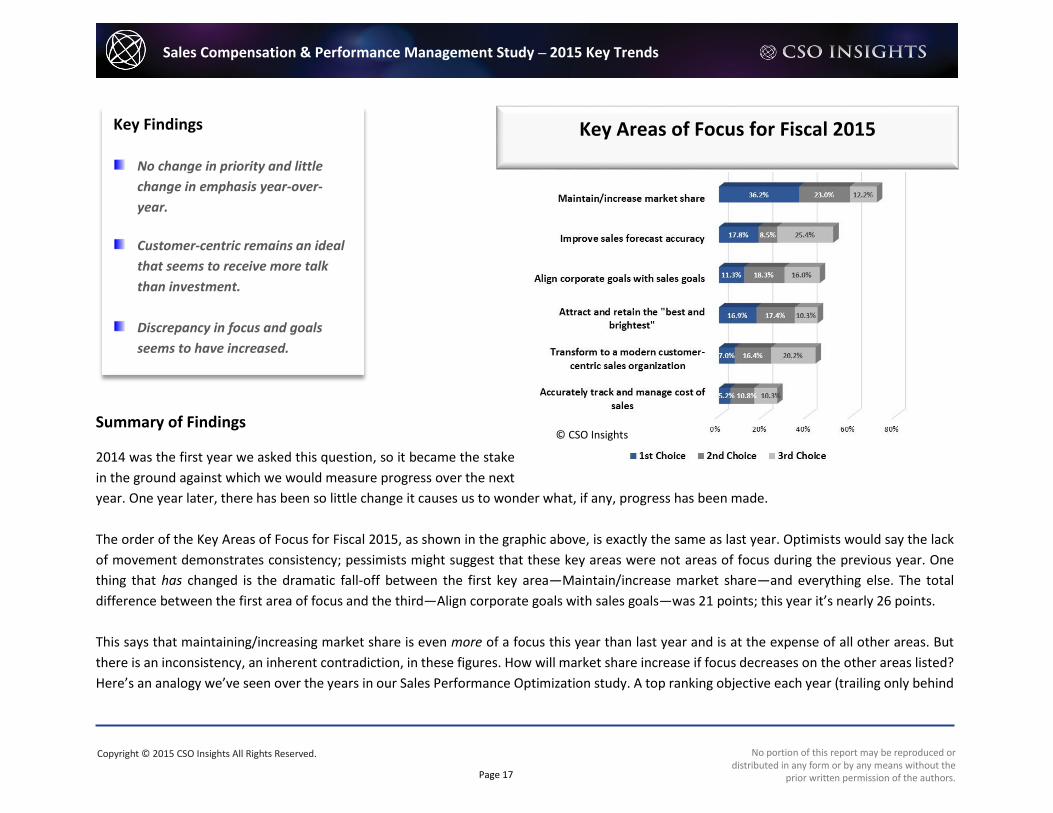
Summary of Findings
2014 was the first year we asked this question, so it became the stake
in the ground against which we would measure progress over the next
year. One year later, there has been so little change it causes us to wonder what, if any, progress has been made.
The order of the Key Areas of Focus for Fiscal 2015, as shown in the graphic above, is exactly the same as last year. Optimists would say the lack
of movement demonstrates consistency; pessimists might suggest that these key areas were not areas of focus during the previous year. One
thing that has changed is the dramatic fall-off between the first key area—Maintain/increase market share—and everything else. The total
difference between the first area of focus and the third—Align corporate goals with sales goals—was 21 points; this year it’s nearly 26 points.
This says that maintaining/increasing market share is even more of a focus this year than last year and is at the expense of all other areas. But
there is an inconsistency, an inherent contradiction, in these figures. How will market share increase if focus decreases on the other areas listed?
Here’s an analogy we’ve seen over the years in our Sales Performance Optimization study. A top ranking objective each year (trailing only behind
Key Findings
No change in priority and little
change in emphasis year-over-
year.
Customer-centric remains an ideal
that seems to receive more talk
than investment.
Discrepancy in focus and goals
seems to have increased.
Key Areas of Focus for Fiscal 2015
© CSO Insights
Copyright © 2015 CSO Insights All Rights Reserved. No portion of this report may be reproduced or distributed in any form or by any means without the
prior written permission of the authors.
Page 18
Sales Compensation & Performance Management Study – 2015 Key Trends Analysis
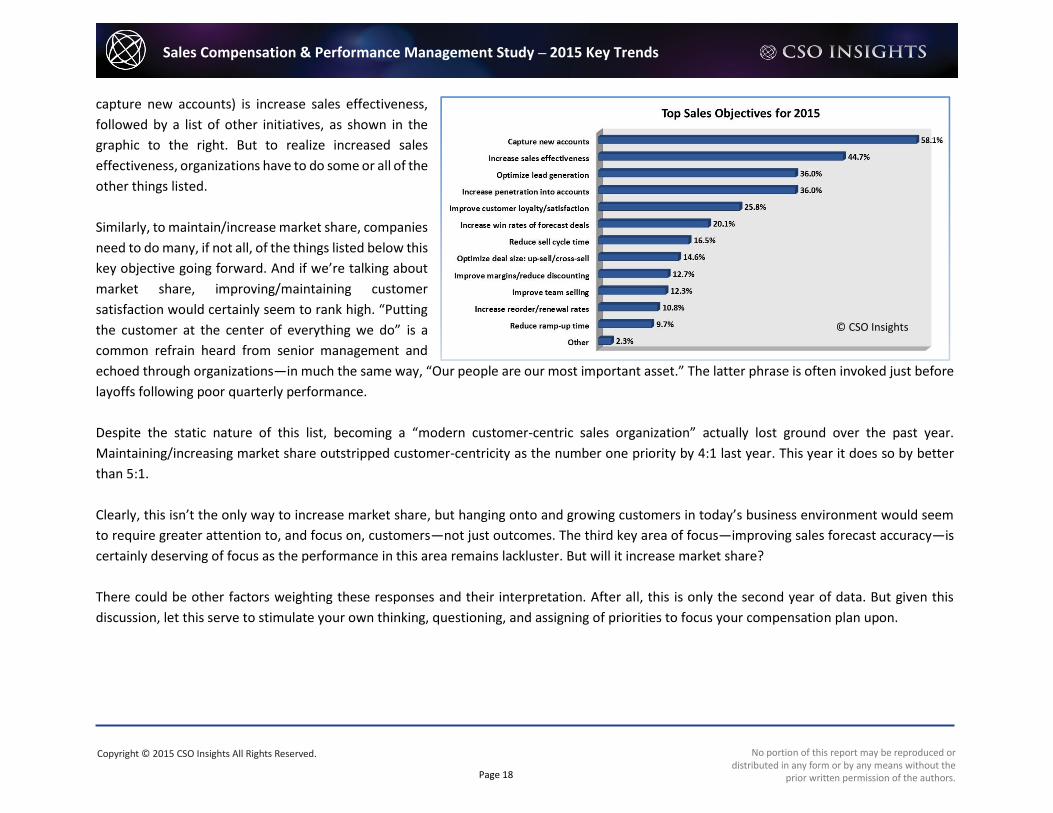
capture new accounts) is increase sales effectiveness,
followed by a list of other initiatives, as shown in the
graphic to the right. But to realize increased sales
effectiveness, organizations have to do some or all of the
other things listed.
Similarly, to maintain/increase market share, companies
need to do many, if not all, of the things listed below this
key objective going forward. And if we’re talking about
market share, improving/maintaining customer
satisfaction would certainly seem to rank high. “Putting
the customer at the center of everything we do” is a
common refrain heard from senior management and
echoed through organizations—in much the same way, “Our people are our most important asset.” The latter phrase is often invoked just before
layoffs following poor quarterly performance.
Despite the static nature of this list, becoming a “modern customer-centric sales organization” actually lost ground over the past year.
Maintaining/increasing market share outstripped customer-centricity as the number one priority by 4:1 last year. This year it does so by better
than 5:1.
Clearly, this isn’t the only way to increase market share, but hanging onto and growing customers in today’s business environment would seem
to require greater attention to, and focus on, customers—not just outcomes. The third key area of focus—improving sales forecast accuracy—is
certainly deserving of focus as the performance in this area remains lackluster. But will it increase market share?
There could be other factors weighting these responses and their interpretation. After all, this is only the second year of data. But given this
discussion, let this serve to stimulate your own thinking, questioning, and assigning of priorities to focus your compensation plan upon.
© CSO Insights
Copyright © 2015 CSO Insights All Rights Reserved. No portion of this report may be reproduced or distributed in any form or by any means without the
prior written permission of the authors.
Page 19
Sales Compensation & Performance Management Study – 2015 Key Trends Analysis
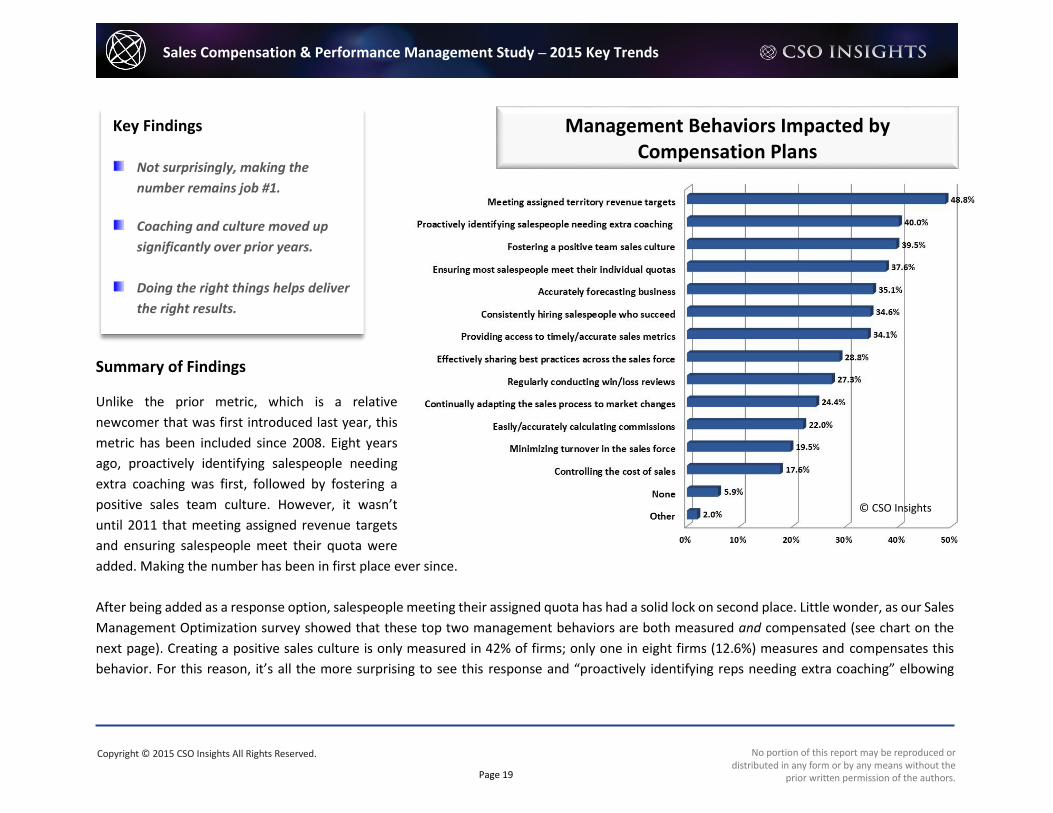
Summary of Findings
Unlike the prior metric, which is a relative
newcomer that was first introduced last year, this
metric has been included since 2008. Eight years
ago, proactively identifying salespeople needing
extra coaching was first, followed by fostering a
positive sales team culture. However, it wasn’t
until 2011 that meeting assigned revenue targets
and ensuring salespeople meet their quota were
added. Making the number has been in first place ever since.
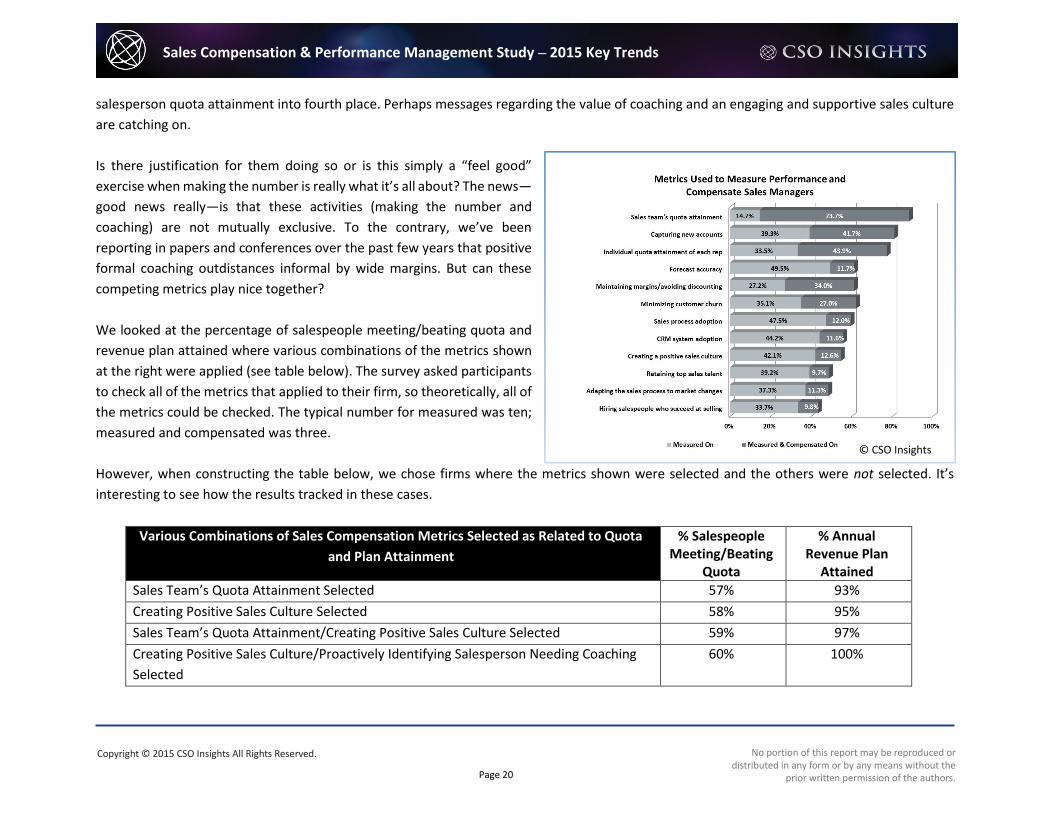
After being added as a response option, salespeople meeting their assigned quota has had a solid lock on second place. Little wonder, as our Sales
Management Optimization survey showed that these top two management behaviors are both measured and compensated (see chart on the
next page). Creating a positive sales culture is only measured in 42% of firms; only one in eight firms (12.6%) measures and compensates this
behavior. For this reason, it’s all the more surprising to see this response and “proactively identifying reps needing extra coaching” elbowing
© CSO Insights
© CSO Insights
Key Findings
Not surprisingly, making the
number remains job #1.
Coaching and culture moved up
significantly over prior years.
Doing the right things helps deliver
the right results.
Management Behaviors Impacted by Compensation Plans
© CSO Insights
Copyright © 2015 CSO Insights All Rights Reserved. No portion of this report may be reproduced or distributed in any form or by any means without the
prior written permission of the authors.
Page 20
Sales Compensation & Performance Management Study – 2015 Key Trends Analysis
salesperson quota attainment into fourth place. Perhaps messages regarding the value of coaching and an engaging and supportive sales culture
are catching on.
Is there justification for them doing so or is this simply a “feel good”
exercise when making the number is really what it’s all about? The news—
good news really—is that these activities (making the number and
coaching) are not mutually exclusive. To the contrary, we’ve been
reporting in papers and conferences over the past few years that positive
formal coaching outdistances informal by wide margins. But can these
competing metrics play nice together?
We looked at the percentage of salespeople meeting/beating quota and
revenue plan attained where various combinations of the metrics shown
at the right were applied (see table below). The survey asked participants
to check all of the metrics that applied to their firm, so theoretically, all of
the metrics could be checked. The typical number for measured was ten;
measured and compensated was three.
However, when constructing the table below, we chose firms where the metrics shown were selected and the others were not selected. It’s
interesting to see how the results tracked in these cases.
Various Combinations of Sales Compensation Metrics Selected as Related to Quota
and Plan Attainment
% Salespeople Meeting/Beating
Quota
% Annual Revenue Plan
Attained
Sales Team’s Quota Attainment Selected 57% 93%
Creating Positive Sales Culture Selected 58% 95%
Sales Team’s Quota Attainment/Creating Positive Sales Culture Selected 59% 97%
Creating Positive Sales Culture/Proactively Identifying Salesperson Needing Coaching
Selected
60% 100%
© CSO Insights

Copyright © 2015 CSO Insights All Rights Reserved. No portion of this report may be reproduced or distributed in any form or by any means without the
prior written permission of the authors.
Page 21
Sales Compensation & Performance Management Study – 2015 Key Trends Analysis
Two things are noteworthy. First, once again, you don’t do numbers; the number is a result of what you do and how well you do it. Second, it’s
clear that a positive sales culture and identifying reps that need additional coaching not only do not get in the way of making the number—they
pave the way to doing so.

Copyright © 2015 CSO Insights All Rights Reserved. No portion of this report may be reproduced or distributed in any form or by any means without the
prior written permission of the authors.
Page 22
Sales Compensation & Performance Management Study – 2015 Key Trends Analysis
Summary of Findings
Anticipating the impact of changes to the
compensation plan has been the perennial and
persistent challenge. A total of 45% of respondents this
year marked this as their biggest challenge, less than
the 52% high-water mark of a few years ago (2012-2013) but up three points from last year.
Somewhat surprisingly, the numbers are not dramatically different for firms reporting using a commercial compensation/incentive management
system versus those operating manually and/or on spreadsheets. The inability to forecast impact remains first among challenges, within two
points of one another (45% commercial versus 47% spreadsheets/manual). It appears the challenge is not figuring out what Plan A versus Plan B
versus Plan C will cost based on certain performance assumptions; using the “sandbox” capability within commercial applications or simply
Key Findings
Inability to forecast the impact of
changes to the compensation plan
is a persistent challenge.
Sales professionals’ understanding
of how to maximize their earnings
correlates with better
performance.
Corporate goals/objectives do not
seem to ignite nor extinguish the
level of sales professionals’
engagement.
Biggest Challenges When Rolling Out Sales Compensation Plans
© CSO Insights
Copyright © 2015 CSO Insights All Rights Reserved. No portion of this report may be reproduced or distributed in any form or by any means without the
prior written permission of the authors.
Page 23
Sales Compensation & Performance Management Study – 2015 Key Trends Analysis
running the numbers via spreadsheets will serve up what commissions will be paid. The difficulty is in forecasting what sales will actually be
generated by Plan A versus Plan B versus Plan C.
Also, perennially in second place (the past five years) is salespeople not being clear on corporate goals and objectives; in other words, “just pay
me.” Does understanding the company’s goals and objectives matter? Does anyone really care? Revenue attainment for both groups (clear versus
not clear) were identical: 88% of plan; apparently the reps not being clear on corporate goals/objectives did not keep them from selling, nor did
being clear on corporate goals/objectives enable them to sell vastly more.
A better measure may be sales professionals’ ability to interpret the plan and understand how best to maximize their earnings. Theoretically, this
would also maximize the company’s results but are often disconnected.
Salespeople’s Ability to Interpret the Plan and Understand How to Maximize
Earnings as Related to Quota and Plan Attainment
% Salespeople
Meeting/Beating
Quota
% Annual
Revenue Plan
Attained
Salespeople Know Exactly How to Maximize Their Earnings 58% 91%
Salespeople are Somewhat Confused About How to Maximize Their Earnings 46% 83%
Salespeople are Completely Confused About How to Maximize Their Earnings * *
Firms Where Salespeople do Not have a Variable Pay Component * *
*Too few to report
It would appear that it is much more important for salespeople to clearly understand what’s in it for them, communicate this early/often, and be sure these personal productivity measures are tied to corporate objectives rather than the other way around. In other words, having sales professionals be crystal clear on corporate goals and objectives but somewhat hazy on how these should direct their actions and how these translate to individual earnings correlates with lower performance results. We present tactics for crystalizing sales professionals’ understanding of how to maximize their earnings in the Going Forward section (see page 29). Further, sales professionals who possess a clear understanding of corporate goals/objectives (versus those who don’t) doesn’t seem to be the key to firing up engagement. We compared groups that viewed understanding the corporate goals and objectives as a challenge against those that did not, and the level of engagement was a virtual tie at 75%.
Copyright © 2015 CSO Insights All Rights Reserved. No portion of this report may be reproduced or distributed in any form or by any means without the
prior written permission of the authors.
Page 24
Sales Compensation & Performance Management Study – 2015 Key Trends Analysis
Summary of Findings
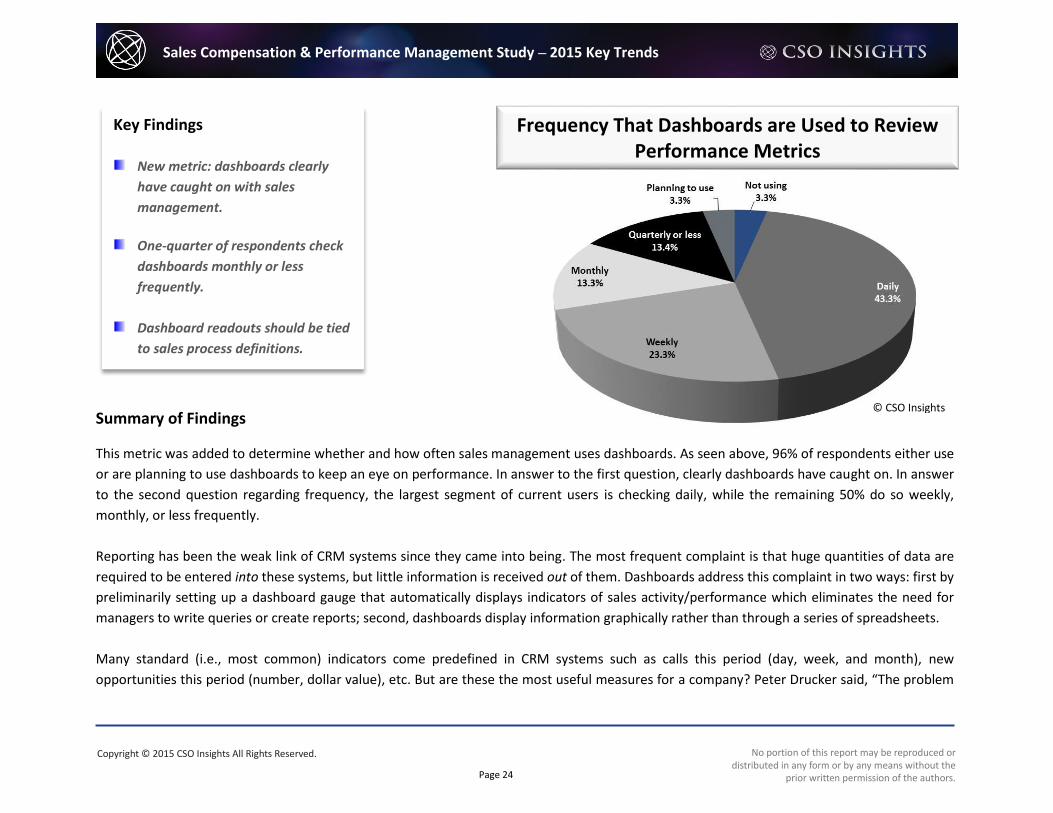
This metric was added to determine whether and how often sales management uses dashboards. As seen above, 96% of respondents either use
or are planning to use dashboards to keep an eye on performance. In answer to the first question, clearly dashboards have caught on. In answer
to the second question regarding frequency, the largest segment of current users is checking daily, while the remaining 50% do so weekly,
monthly, or less frequently.
Reporting has been the weak link of CRM systems since they came into being. The most frequent complaint is that huge quantities of data are
required to be entered into these systems, but little information is received out of them. Dashboards address this complaint in two ways: first by
preliminarily setting up a dashboard gauge that automatically displays indicators of sales activity/performance which eliminates the need for
managers to write queries or create reports; second, dashboards display information graphically rather than through a series of spreadsheets.
Many standard (i.e., most common) indicators come predefined in CRM systems such as calls this period (day, week, and month), new
opportunities this period (number, dollar value), etc. But are these the most useful measures for a company? Peter Drucker said, “The problem
Key Findings
New metric: dashboards clearly
have caught on with sales
management.
One-quarter of respondents check
dashboards monthly or less
frequently.
Dashboard readouts should be tied
to sales process definitions.
Frequency That Dashboards are Used to Review Performance Metrics
© CSO Insights
Copyright © 2015 CSO Insights All Rights Reserved. No portion of this report may be reproduced or distributed in any form or by any means without the
prior written permission of the authors.
Page 25
Sales Compensation & Performance Management Study – 2015 Key Trends Analysis
with management is that they’re measuring the wrong things.” Sales activities are among the easiest things to
track/report/display, but are they the “right” things? Sure, a basic level of activity (quantity) is needed on an ongoing
basis, but you also want the quality of the activities to be consistent—or consistently improving. Blitz campaigns are
famous for being high on activity, low on quality. You want a balance of both.
This is where sales process comes in as well as a critically important, but often overlooked, aspect of dashboards.
In addition to reporting activities and results such as bookings this period plotted against plan (e.g., 30% of plan
with 35% of the year gone by), process measures can be tracked and reported. For example, if you have a five-step
sales process from initial sales qualified lead to close, the CRM system’s dashboard can report what the distribution of
opportunities is throughout the pipeline/sales funnel, total dollar volume, etc.
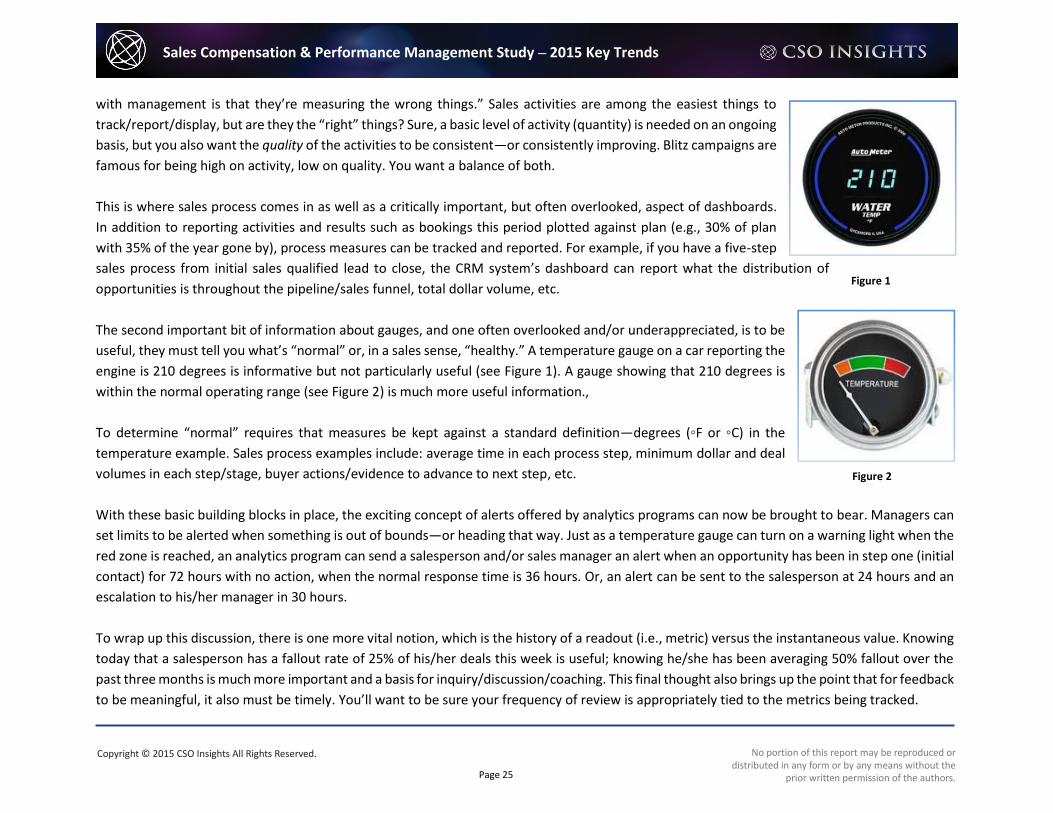
The second important bit of information about gauges, and one often overlooked and/or underappreciated, is to be
useful, they must tell you what’s “normal” or, in a sales sense, “healthy.” A temperature gauge on a car reporting the
engine is 210 degrees is informative but not particularly useful (see Figure 1). A gauge showing that 210 degrees is
within the normal operating range (see Figure 2) is much more useful information.,
To determine “normal” requires that measures be kept against a standard definition—degrees (◦F or ◦C) in the
temperature example. Sales process examples include: average time in each process step, minimum dollar and deal
volumes in each step/stage, buyer actions/evidence to advance to next step, etc.
With these basic building blocks in place, the exciting concept of alerts offered by analytics programs can now be brought to bear. Managers can
set limits to be alerted when something is out of bounds—or heading that way. Just as a temperature gauge can turn on a warning light when the
red zone is reached, an analytics program can send a salesperson and/or sales manager an alert when an opportunity has been in step one (initial
contact) for 72 hours with no action, when the normal response time is 36 hours. Or, an alert can be sent to the salesperson at 24 hours and an
escalation to his/her manager in 30 hours.
To wrap up this discussion, there is one more vital notion, which is the history of a readout (i.e., metric) versus the instantaneous value. Knowing
today that a salesperson has a fallout rate of 25% of his/her deals this week is useful; knowing he/she has been averaging 50% fallout over the
past three months is much more important and a basis for inquiry/discussion/coaching. This final thought also brings up the point that for feedback
to be meaningful, it also must be timely. You’ll want to be sure your frequency of review is appropriately tied to the metrics being tracked.
Figure 1
Figure 2
Copyright © 2015 CSO Insights All Rights Reserved. No portion of this report may be reproduced or distributed in any form or by any means without the
prior written permission of the authors.
Page 26
Sales Compensation & Performance Management Study – 2015 Key Trends Analysis
Summary of Findings
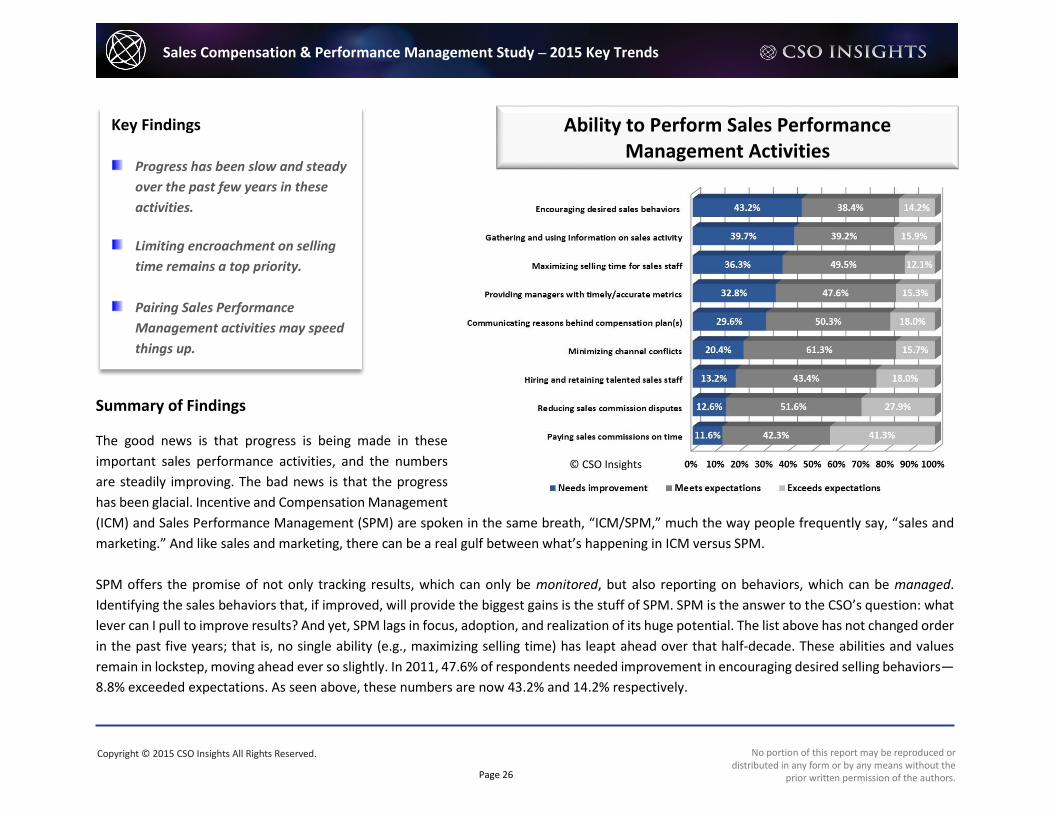
The good news is that progress is being made in these
important sales performance activities, and the numbers
are steadily improving. The bad news is that the progress
has been glacial. Incentive and Compensation Management
(ICM) and Sales Performance Management (SPM) are spoken in the same breath, “ICM/SPM,” much the way people frequently say, “sales and
marketing.” And like sales and marketing, there can be a real gulf between what’s happening in ICM versus SPM.
SPM offers the promise of not only tracking results, which can only be monitored, but also reporting on behaviors, which can be managed.
Identifying the sales behaviors that, if improved, will provide the biggest gains is the stuff of SPM. SPM is the answer to the CSO’s question: what
lever can I pull to improve results? And yet, SPM lags in focus, adoption, and realization of its huge potential. The list above has not changed order
in the past five years; that is, no single ability (e.g., maximizing selling time) has leapt ahead over that half-decade. These abilities and values
remain in lockstep, moving ahead ever so slightly. In 2011, 47.6% of respondents needed improvement in encouraging desired selling behaviors—
8.8% exceeded expectations. As seen above, these numbers are now 43.2% and 14.2% respectively.
Key Findings
Progress has been slow and steady
over the past few years in these
activities.
Limiting encroachment on selling
time remains a top priority.
Pairing Sales Performance
Management activities may speed
things up.
Ability to Perform Sales Performance Management Activities
© CSO Insights

Copyright © 2015 CSO Insights All Rights Reserved. No portion of this report may be reproduced or distributed in any form or by any means without the
prior written permission of the authors.
Page 27
Sales Compensation & Performance Management Study – 2015 Key Trends Analysis
So progress is being made and trending is in the right direction. But is there something that can be done to pick up the pace? Maximizing selling
time and minimizing “corrupted selling time” (i.e., non-selling activities) have comprised a constant drumbeat from CSOs over the past few years.
This certainly makes sense; after all, the more time salespeople spend in front of/on the phone with customers, the more opportunity they have
to close some business.
The first row in the table below shows the percentage of salespeople meeting/beating quota when maximizing selling time needs improvement,
meets, or exceeds expectations. There is some improvement as the ability to maximize selling time improves. Now, look at the second row where
encouraging desired selling behaviors is paired with providing managers timely/accurate metrics. There are huge leaps between the needs, meets,
and exceeds columns.
The numbers are equally compelling when comparing the same groupings to determine the percentage of overall revenue plan attained.
The numbers suggest creating more selling time is incrementally positive but that pulling a combination of SPM levers at the same time can be
significantly better. The suggestion here is to first get your sales process defined and integrated into the CRM system so that actual performance
data across the sales team can be captured. Then use the analytical capabilities of the SPM system to look for where leverage (i.e., which levers)
exist. You’re looking for differences—salesperson versus salesperson, region versus region, period versus period, etc.—to see highs and lows.
Then begin to experiment with which SPM activities, especially in combination, yield the best results. Do more of these and less of simply chanting,
Ability to Perform SPM Activities % of Salespeople Meeting/Beating Quota
Needs Improvement
Meets Expectations
Exceeds Expectations
Maximizing Selling Time 52% 56% 56%
Providing Managers With Timely/Accurate Metrics and Encourage Desired Selling Behaviors
43% 57% 75%
Ability to Perform SPM Activities % of Revenue Plan Attained
Needs Improvement
Meets Expectations
Exceeds Expectations
Maximizing Selling Time 86% 87% 91%
Providing Managers with Timely/Accurate Metrics and Encourage Desired Selling Behaviors
84% 87% 99%
Copyright © 2015 CSO Insights All Rights Reserved. No portion of this report may be reproduced or distributed in any form or by any means without the
prior written permission of the authors.
Page 28
Sales Compensation & Performance Management Study – 2015 Key Trends Analysis
“You have to get out and sell more.” Instead, be a coach, providing timely, objective, consistent, relevant, and individualized feedback to really
turbocharge your sales professionals’ performance.

Copyright © 2015 CSO Insights All Rights Reserved. No portion of this report may be reproduced or distributed in any form or by any means without the
prior written permission of the authors.
Page 29
Sales Compensation & Performance Management Study – 2015 Key Trends Analysis
Going Forward Analysis
The old goalsetting maxim was: Plan your work; work your plan.
A corollary to this is: Those who fail to plan are planning to fail.
OK, enough of the sayings. The fact is, the data do support rational compensation plans that are clearly understood and regularly inspected. This
can’t be news but, for whatever reason, these are in the minority again this year. A CSO of a very large and well known computer manufacturing
company once told us, “The reason I was made Vice President of Sales is that I’m the best at implementing last year’s plan.” Although he was
being somewhat self-effacing, he was being completely honest.
And he’s hardly alone. A total of 45% of the companies responding to this year’s survey indicated they set the coming year’s quota by simply
adding a percentage to the current year’s plan. With this as a starting point, quotas are divvied up, some accounts and/or numbers negotiated,
and the sales team is turned loose to make it happen. Lather. Rinse. Repeat. Year after year.
Do the data point to a better way? Short answer: Yes.
Although much of this has already been reported in the preceding metrics, it’s time to wrap this up and recommend. The top quartile of companies
in this year’s survey shared the following characteristics: met or exceeded annual revenue plan (≥100%), salespeople understand how to maximize
their earnings, and they are able to provide sales managers timely/accurate performance metrics.
Let’s get specific. Jerry Colletti, an advisor to CSO Insights on this report from its beginning, is recognized as a veteran of sales compensation
planning, an author of books on the subject, and a sought after speaker and advisor. We asked him what guidance he would offer to break out of
Ability to Perform SPM Activities % of Revenue Plan Attained
Top Quartile Rest of World (Bottom ¾)
Overall Revenue Attainment 106% 87%
% Salespeople Meeting/Beating Quota 77% 48%
Voluntary Turnover 5% 11%
Involuntary Turnover 9% 11%
Copyright © 2015 CSO Insights All Rights Reserved. No portion of this report may be reproduced or distributed in any form or by any means without the
prior written permission of the authors.
Page 30
Sales Compensation & Performance Management Study – 2015 Key Trends Analysis
the habitual repetitive practices outlined above of simply adding a percentage to this year’s target—regardless of actual attainment—then
spreading it around in regional and individual quotas. Here’s what Jerry had to say:
“To maximize achievement of your business plan:
1. Build measures into the plan that salespeople can impact;
2. Assign quotas that are reaching (i.e., stretch) yet attainable, that first line managers can explain; and
3. Provide measures for managers to coach their reps on how they would/will hit their number.”
We believe the implications of Jerry’s comment for building and implementing plans that drive business success are:
Build in measures salespeople can impact.
Whatever measures comprise the CSO’s target of responsibility (e.g., total revenue, gross margin, etc.), translate them into performance measures
that the salesperson can impact. As we’ve reported in prior years, generally, three to four measures are desirable, five is the max. If you have
more components than this, some or all will be of little consequence (e.g., 5% of variable component) and salespeople will simply ignore them
and “take the hit,” figuring they’ll make it up on other components they can actually impact. Tying a salesperson’s compensation to an overarching
corporate objective is simply out of the salesperson’s control, and he/she will either waste time trying to do something about it or, more
appropriately, simply ignore it.
Assign quotas the manager can explain.
Managers should not only understand the methodology by which quotas were developed/assigned but also be able to explain it to the
salespeople. A friend of mine returned to college to earn her teaching certificate. The professor, a veteran of decades of teaching, shared this
insight: “Often teachers ask a student to explain a concept back to them (e.g., how to solve a math problem) and the student says, ‘I get it, I just
can’t explain it.’” The professor said, “I have one word for that: bullshit.” Ditto for sales plans that sales managers accept and pass on but cannot
explain.
Arm your managers to coach their salespeople.
Top performers figure out what they need to do to maximize their results. You don’t want to forget about these salespeople, as they still deserve
coaching, but they’ll likely know how they’re going to make their number. For the remainder of the team, the manager should meet individually
with each salesperson, explain the quota and how it was developed/assigned, and strategize how to make his/her number. This conversation is
not just about activity (e.g., number of calls, etc.), it also includes how to organize the territory and accounts, the mix of new and existing clients,
Copyright © 2015 CSO Insights All Rights Reserved. No portion of this report may be reproduced or distributed in any form or by any means without the
prior written permission of the authors.
Page 31
Sales Compensation & Performance Management Study – 2015 Key Trends Analysis
congruence with/deviation from ideal customer criteria and what this means in selling motions, the mix of products/services to meet revenue
and margin requirements, etc.
This is often described as developing a “cadence” for executing the plan. Following this and implementing a compensation management system
is critical. The manager should review performance measures on a regular cadence as well. As noted earlier (see page 24), daily may be too often,
but monthly is the minimum.
For smaller sales organizations (i.e., 15 or fewer salespeople), Jerry Colletti recommends that the sales manager(s) carry at least a couple of
accounts for a quarter to “test drive” the new plan before it’s rolled out to the entire team. If there are problems or areas of uncertainty, they
can be surfaced and addressed without upsetting or, worse, distracting the sales team.
Everyone plans to plan; they just don’t get around to doing it. This is a mistake that costs organizations lost traction every day. If you’re thinking
about moving away from the use of spreadsheets, revising your approach to the coming year, adding rigor and discipline (and frequency) to your
coaching/reinforcement/enforcement efforts, know that the data are on your side. We began this section with an old saying and will end with
one from Ring Lardner:
“The race is not always to the swift, nor the battle to the strong—but that’s the way to bet.”
The year ahead holds enormous potential and, with it, possible peril. Many things can go wrong and likely will; some will inexplicably also fall in
your favor. But planning, preparing, testing, and staying the course are your best bets to arriving at this time next year with a happy tale to tell—
progress that’s been made, clients that have been won and well served, and beyond that, yes, another year and its number. You can chase after
it or you can be deliberate and put the pieces in place to get ahead of it. Determine how to put these three steps into action, or get help doing
so. It’s not a sure thing, but it is the way to bet! CSO Insights Advisory Services clients should set an appointment with their analyst to review this
report’s findings and discuss ways to maximize their own compensation planning and performance management efforts.
If you have specific questions about benchmark data or need introductions and/or data-based recommendations, we’re here to help.
Barry Trailer Tom Chamberlain
Research Fellow Research Director
+1 916-712-9621 +1 630-750-6704 [email protected] [email protected]
Copyright © 2015 CSO Insights All Rights Reserved. No portion of this report may be reproduced or distributed in any form or by any means without the
prior written permission of the authors.
Page 32
Sales Compensation & Performance Management Study – 2015 Key Trends Analysis
About CSO Insights CSO Insights is dedicated to improving the performance and productivity of complex B2B sales organizations. We measure and analyze the
behaviors, metrics and strategies behind world-class sales performance, providing our members with the research, data and expertise required
to build strategies for sales performance improvement.
With over 20 years of sales research experience, the CSO Insights team is comprised of respected analysts with decades of success as sales
practitioners and sales executives. This unique perspective, along with our wealth of sales performance metrics and benchmarks, gives us the
exceptional ability to collaborate directly with sales leaders around the world to explore the best practices, strategic trends and next
generation capabilities driving sales performance.
Our research, data, and expertise help sales leaders create and execute strategies to find more, win more, and keep and grow more business. CSO
Insights’ annual sales and marketing effectiveness studies have become industry standards for sales leaders seeking operational metrics, data,
and analysis, most notably: the Sales Best Practices Study, Sales Performance Optimization Study, and Lead Management and Social Engagement
Study.