salem, oregon u.s. department of housing and urban ... · salem, oregon u.s. department of housing...
TRANSCRIPT

C O M P R E H E N S I V E H O U S I N G M A R K E T A N A L Y S I S
Salem, OregonAs of August 1, 2016U.S. Department of Housing and Urban Development Office of Policy Development and Research
OregonWashington
Linn
ClackamasYamhill
Tillamook
Clark
BentonLin
coln
Washington
Skamania
Multnomah
Jeffe
rson
HoodRiver
Was
co
MarionPolk
Housing Market Area
The Salem Housing Market Area (HMA), coterminous with the Salem, OR Metropolitan Statistical Area, consists of Marion and Polk Counties in the Willamette Valley region of Oregon, midway between Portland and Eugene along Interstate 5. The principal city, Salem, is the state capital.
Market DetailsEconomic Conditions ............... 2
Population and Households ..... 5
Housing Market Trends ............ 7
Data Profile ............................. 11
SummaryEconomy The economy of the Salem HMA has steadily improved since 2012 and has recovered all jobs lost as a result of the national recession. Nonfarm payrolls averaged 158,500 jobs during the 12 months ending July 2016, an increase of 4,800 jobs, or 3.1 percent, from the previous 12 months. During the same period, the unemployment rate declined from 6.4 to 5.4 percent. Nonfarm payrolls are expected to expand by an average of 4,800 jobs, or 3.0 percent, a year during the 3year forecast period, led by growth in industries related to health care and business services.
Sales MarketSales housing market conditions in the Salem HMA are currently tight, with an estimated vacancy rate of 2.0 percent, down from 2.4 percent in 2010. During the 12 months ending July 2016, sales of new and existing singlefamily homes, townhomes, and condominiums increased more than 15 percent from the previous 12month period, and the average sales price was up almost 9 percent (CoreLogic, Inc., with adjustments by the analyst). Demand is expected for 3,075 new homes in the HMA during the 3year forecast period (Table 1). The 260 units currently under construction and a
portion of the 4,000 estimated other vacant units in the HMA will fulfill some of the forecast demand.
Rental MarketOverall rental housing market conditions in the Salem HMA are currently slightly tight, with an estimated 4.5 percent vacancy rate as of August 1, 2016, down from 7.0 percent in April 2010. The decline in the vacancy rate is largely because the foreclosure crisis caused a shift in household preferences toward renting, and the rate of new apartment construction and conversion of singlefamily homes to rentals has not kept up with the rate of renter household growth. During the 3year forecast period, demand is estimated for 2,025 rental units; the 520 units currently under construction will satisfy part of that demand (Table 1).
Table 1. Housing Demand in the Salem HMA During the Forecast Period
Salem HMA
SalesUnits
RentalUnits
Total demand 3,075 2,025
Under construction 260 520
Notes: Total demand represents estimated production necessary to achieve a balanced market at the end of the forecast period. Units under construction as of August 1, 2016. A portion of the estimated 4,000 other vacant units in the HMA will likely satisfy some of the forecast demand. The forecast period is August 1, 2016, to August 1, 2019.Source: Estimates by analyst

Sa
lem
, O
R •
CO
MP
RE
HE
NS
IVE
HO
US
ING
MA
RK
ET
AN
ALY
SIS
2Economic Conditions
The economy of the Salem HMA has been expanding since
2012, and the current level of nonfarm pay rolls, 158,500 jobs, surpasses by nearly 4 percent the peak before the downturn of 152,600 jobs, recorded in
2008. During the 12 months ending July 2016, nonfarm payrolls increased by an average of 4,800 jobs, or 3.1 percent, from a year earlier (Table 2), which was higher than the average annual growth of 3,500 jobs, or 2.4 percent, from 2012 through 2015. The current economic expansion is also significantly stronger than the previous period of expansion from 2004 through 2008, when nonfarm payroll growth averaged 2,500 jobs, or 1.8 percent, annually. These recent job gains are in sharp contrast to annual declines of 3,600 jobs, or 2.4 percent, from 2009 through 2011 as a result of the national recession and sluggish consumer spending. The unemployment rate averaged 5.4 percent during the 12 months ending July 2016, down from 6.4 percent a year prior, the lowest rate recorded since 2007. Figure 1 shows trends in the labor force, resident employment, and the unemployment rate from 2000 through 2015.
The government sector serves as the foundation of the economy, representing more than onefourth of all nonfarm payroll jobs in the HMA (Figure 2) due to the presence of the Oregon state capital and assorted state and local agencies, including the Oregon State Hospital, Oregon State Penitentiary, the Mill Creek Correctional Facility and Santiam Correctional Institution, Spirit Mountain Casino, and Chinook Winds Casino Resort. Also included in the government sector are public colleges Western Oregon University and Chemeketa Community College, which in 2014 had enrollments of 6,050 and 11,100 students and employed 900 and 1,150 workers, respectively. The HMA’s largest employer (Table 3), the State of Oregon, employs approximately
Table 2. 12-Month Average Nonfarm Payroll Jobs in the Salem HMA, by Sector
12 Months Ending Absolute Change
Percent ChangeJuly 2015 July 2016
Total nonfarm payroll jobs 153,700 158,500 4,800 3.1Goods-producing sectors 22,300 23,300 1,000 4.5
Mining, logging, & construction 9,600 10,200 600 6.3Manufacturing 12,700 13,100 400 3.1
Service-providing sectors 131,400 135,200 3,800 2.9Wholesale & retail trade 21,700 22,200 500 2.3Transportation & utilities 3,900 3,900 0 0.0Information 1,000 1,000 0 0.0Financial activities 6,900 6,900 0 0.0Professional & business services 13,000 14,200 1,200 9.2Education & health services 24,300 25,200 900 3.7Leisure & hospitality 14,000 14,600 600 4.3Other services 5,200 5,300 100 1.9Government 41,400 42,000 600 1.4
Notes: Numbers may not add to totals because of rounding. Based on 12-month averages through July 2015 and July 2016.Source: U.S. Bureau of Labor Statistics
Figure 1. Trends in Labor Force, Resident Employment, and Unemploy-ment Rate in the Salem HMA, 2000 Through 2015
Une
mpl
oym
ent r
ate
Labo
r fo
rce
and
resi
dent
em
ploy
men
t
210,000
200,000
190,000
180,000
170,000
160,000
150,000
2000
2002
2004
Labor force Resident employment Unemployment rate
2006
2001
2003
2005
2007
2009
2010
2008
2012
2013
2015
2014
2011
12.0
10.0
8.0
6.0
4.0
2.0
0.0
Source: U.S. Bureau of Labor Statistics
Figure 2. Current Nonfarm Payroll Jobs in the Salem HMA, by Sector
Government 26.5%
Leisure & hospitality 9.2%
Other services 3.3%
Education & health services 15.9%Professional & business services 8.9%
Wholesale & retail trade 14.0%
Manufacturing 8.3%
Mining, logging, & construction 6.4%
Information 0.6%Transportation & utilities 2.5%
Financial activities 4.3%
Note: Based on 12-month averages through July 2016.Source: U.S. Bureau of Labor Statistics
Sa
lem
, O
R •
CO
MP
RE
HE
NS
IVE
HO
US
ING
MA
RK
ET
AN
ALY
SIS
3
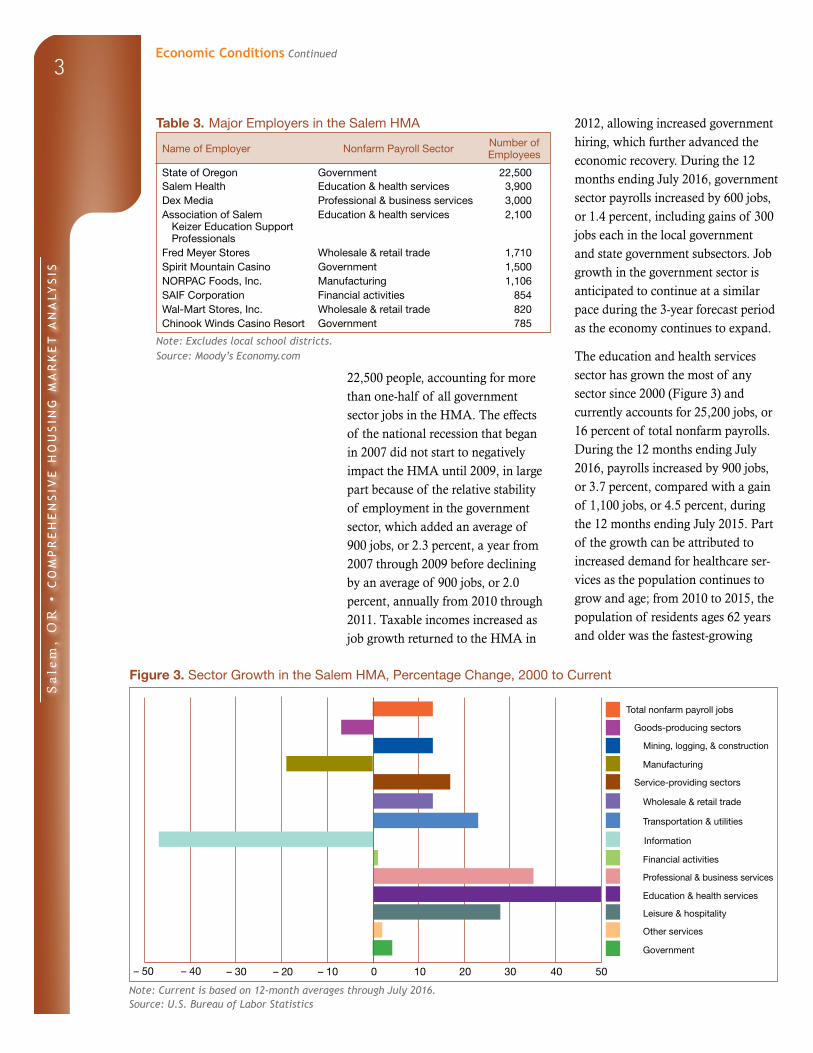
Table 3. Major Employers in the Salem HMA
Name of Employer Nonfarm Payroll Sector Number of Employees
State of Oregon Government 22,500Salem Health Education & health services 3,900Dex Media Professional & business services 3,000Association of Salem
Keizer Education Support Professionals
Education & health services 2,100
Fred Meyer Stores Wholesale & retail trade 1,710Spirit Mountain Casino Government 1,500NORPAC Foods, Inc. Manufacturing 1,106SAIF Corporation Financial activities 854Wal-Mart Stores, Inc. Wholesale & retail trade 820Chinook Winds Casino Resort Government 785
Note: Excludes local school districts.Source: Moody’s Economy.com
22,500 people, accounting for more than onehalf of all government sector jobs in the HMA. The effects of the national recession that began in 2007 did not start to negatively impact the HMA until 2009, in large part because of the relative stability of employment in the government sector, which added an average of 900 jobs, or 2.3 percent, a year from 2007 through 2009 before declining by an average of 900 jobs, or 2.0 percent, annually from 2010 through 2011. Taxable incomes increased as job growth returned to the HMA in
2012, allowing increased government hiring, which further advanced the economic recovery. During the 12 months ending July 2016, government sector payrolls increased by 600 jobs, or 1.4 percent, including gains of 300 jobs each in the local government and state government subsectors. Job growth in the government sector is anticipated to continue at a similar pace during the 3year forecast period as the economy continues to expand.
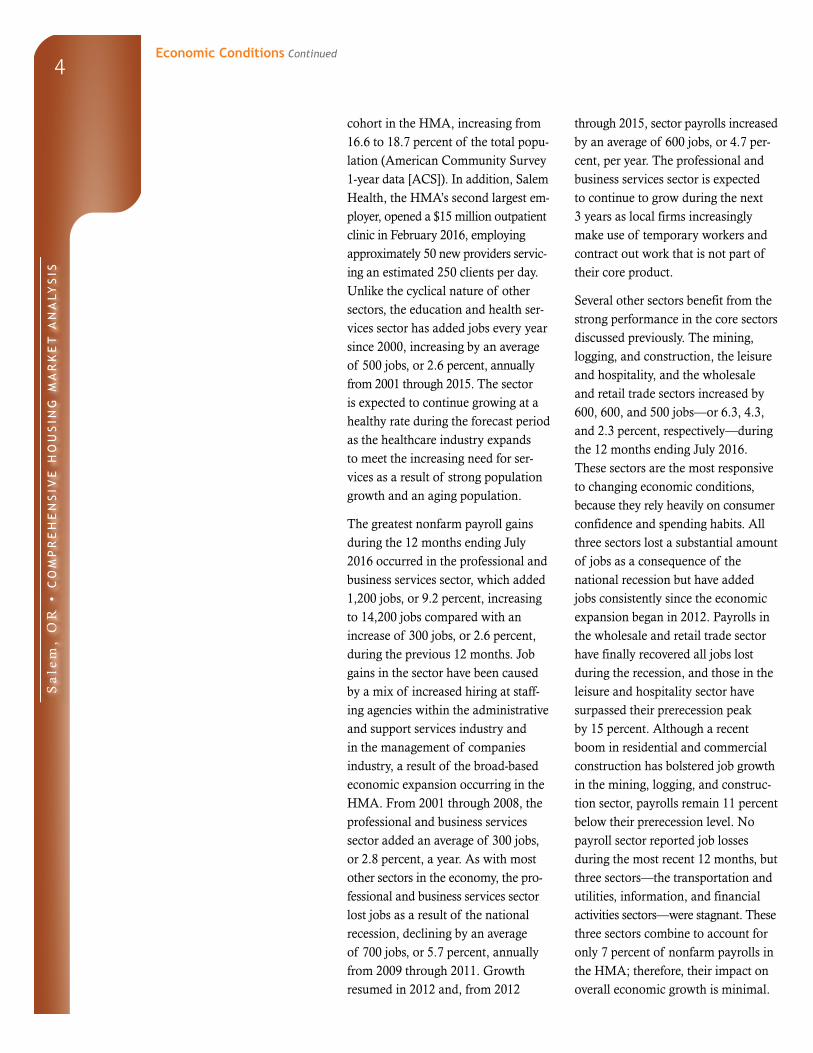
The education and health services sector has grown the most of any sector since 2000 (Figure 3) and currently accounts for 25,200 jobs, or 16 percent of total nonfarm payrolls. During the 12 months ending July 2016, payrolls increased by 900 jobs, or 3.7 percent, compared with a gain of 1,100 jobs, or 4.5 percent, during the 12 months ending July 2015. Part of the growth can be attributed to increased demand for healthcare services as the population continues to grow and age; from 2010 to 2015, the population of residents ages 62 years and older was the fastestgrowing
Figure 3. Sector Growth in the Salem HMA, Percentage Change, 2000 to Current
Total nonfarm payroll jobs
Goods-producing sectors
Mining, logging, & construction
Manufacturing
Service-providing sectors
Information
Financial activities
Professional & business services
Education & health services
Government
Other services
Leisure & hospitality
Transportation & utilities
Wholesale & retail trade
– 20 – 10 200 10– 30– 50 – 40 30 40 50
Note: Current is based on 12-month averages through July 2016.Source: U.S. Bureau of Labor Statistics
Economic Conditions Continued
Sa
lem
, O
R •
CO
MP
RE
HE
NS
IVE
HO
US
ING
MA
RK
ET
AN
ALY
SIS
4
cohort in the HMA, increasing from 16.6 to 18.7 percent of the total population (American Community Survey 1year data [ACS]). In addition, Salem Health, the HMA’s second largest employer, opened a $15 million out patient clinic in February 2016, employ ing ap proximately 50 new providers servicing an estimated 250 clients per day. Unlike the cyclical nature of other sectors, the education and health services sector has added jobs every year since 2000, increasing by an average of 500 jobs, or 2.6 per cent, annually from 2001 through 2015. The sector is expected to continue growing at a healthy rate during the forecast period as the healthcare industry expands to meet the increasing need for services as a result of strong population growth and an aging population.
The greatest nonfarm payroll gains during the 12 months ending July 2016 occurred in the professional and business services sector, which added 1,200 jobs, or 9.2 percent, increasing to 14,200 jobs compared with an increase of 300 jobs, or 2.6 percent, during the previous 12 months. Job gains in the sector have been caused by a mix of increased hiring at staffing agencies within the administrative and support services industry and in the management of companies industry, a result of the broadbased economic expansion occurring in the HMA. From 2001 through 2008, the professional and business services sector added an average of 300 jobs, or 2.8 percent, a year. As with most other sectors in the economy, the professional and business services sector lost jobs as a result of the national recession, declining by an average of 700 jobs, or 5.7 percent, annually from 2009 through 2011. Growth resumed in 2012 and, from 2012
through 2015, sector payrolls increased by an average of 600 jobs, or 4.7 percent, per year. The professional and business services sector is expected to continue to grow during the next 3 years as local firms increasingly make use of temporary workers and contract out work that is not part of their core product.
Several other sectors benefit from the strong performance in the core sectors discussed previously. The mining, logging, and construction, the leisure and hospitality, and the wholesale and retail trade sectors increased by 600, 600, and 500 jobs—or 6.3, 4.3, and 2.3 percent, respectively—during the 12 months ending July 2016. These sectors are the most responsive to chang ing economic conditions, because they rely heavily on consumer confi dence and spending habits. All three sectors lost a substantial amount of jobs as a consequence of the national recession but have added jobs consistently since the economic expansion began in 2012. Payrolls in the wholesale and retail trade sector have finally recovered all jobs lost during the recession, and those in the leisure and hospitality sector have surpassed their prerecession peak by 15 percent. Although a recent boom in residential and commercial construction has bolstered job growth in the mining, logging, and construction sector, payrolls remain 11 percent below their prerecession level. No payroll sector reported job losses during the most recent 12 months, but three sectors—the transportation and utilities, information, and financial activities sectors—were stagnant. These three sectors combine to account for only 7 percent of nonfarm payrolls in the HMA; therefore, their impact on overall economic growth is minimal.
Economic Conditions Continued

Sa
lem
, O
R •
CO
MP
RE
HE
NS
IVE
HO
US
ING
MA
RK
ET
AN
ALY
SIS
5
Strong population growth is expected to positively affect employment in the education and health services sector during the next 3 years, while the large public sector will continue providing a stable foundation to the economy. Other sectors—such as the professional and business services, the wholesale and retail trade, the mining, logging,
and construction, and the leisure and hospitality sectors—are expected to indirectly benefit from growth in core sectors. Nonfarm payrolls are expected to expand by an average of 4,800 jobs, or 3.0 percent, a year during the fore cast period. Table DP1 at the end of this report provides additional employment data.
Population and Households
As of August 1, 2016, the population of the Salem HMA
is estimated at 413,500, increasing at an average annual rate of 0.9 percent, or by 3,600, since 2010, with net in migration accounting for 1,525 people a year, or approximately 42 percent of the increase. Population growth was strongest from 2004 to 2009, during a time of economic expansion, averaging 4,700 people, or 1.3 percent, annu ally, with net inmigration comprising 46 percent of the growth, or 2,175 people each year (Portland State Uni versity July 1 estimates, with adjust ments by the analyst). The HMA is a popular destination for retirees, and an influx during this time furthered population growth; the number of residents in the HMA 62 years and older increased at an average annual rate of almost 6.0 percent from 2005 to 2009, increasing from 14.5 to 16.4 percent of total population (2005 and 2009 ACS 1year data). From 2009 to 2012, as economic conditions weakened because of the national recession, population growth fell to an average of 3,400 people, or 0.9 percent, annu ally. Net inmigration declined to an average of 1,025 people a year and comprised only 30 percent of population growth, partially because the
weak labor market kept jobseekers from moving to the HMA, and also because the housing market collapse left many homeowners with negative equity and unable to relocate. The growth rate in the retiredage population also slowed, averaging only 2.0 percent a year, but its share of the overall population still increased from 16.4 to 17.3 percent of total population.
Since 2012, strengthening economic conditions have boosted population growth to an average of 4,000 people, or 1.0 percent, annually because of increased net inmigration, which has averaged 2,125 people annually, com prising 53 percent of the increase. The retiredaged population continued to increase from 2012 to 2015 at an average annual rate of nearly 4.0 per cent, comprising 18.7 percent of total population, up from 17.3 percent. As economic conditions remain strong, inducing net inmigration from job seekers, along with the continued attraction of retirees to the HMA, the population is expected to increase by an average of 4,475, or 1.1 percent, annually during the 3year forecast period, with more than 58 percent of the growth resulting from net inmigration. The population of the
Economic Conditions Continued

Sa
lem
, O
R •
CO
MP
RE
HE
NS
IVE
HO
US
ING
MA
RK
ET
AN
ALY
SIS
6
HMA is expected to reach 426,900 by August 1, 2019. Figure 4 shows the components of population change from 2000 to the forecast date.
An estimated 147,700 households reside in the HMA, reflecting an average annual increase of 1,025 households, or 0.7 percent, since 2010. By comparison, from 2000 to 2010, when population growth was stronger because of increased net inmigration, the number of households expanded by an average of 1,650, or 1.3 percent, annually. An estimated 59.2 percent of current households, or 87,450 households, are homeowners and the remaining 60,250 are renter households, compared with homeownership rates of 62.1 and 64.0 percent in April 2010 and 2000, respectively (Figure 5). The decline in homeownership reflects the prolonged effects from the foreclosure crisis, including stricter lending standards and a shift in household preferences toward renting. Renter households accounted for slightly more than onehalf of household growth from 2000 to 2010 but have accounted for all of household growth since 2010. The number of households in the HMA is expected to grow by 1,525, or 1.0 percent, annually during the next 3 years, reaching 152,300 households by August 1, 2019. During the forecast period, renter households are projected to comprise approximately 41 percent of new households, mainly because the strong economy has helped improve household finances and access to credit, allowing more households the opportunity to purchase homes. Figure 6 shows population and house hold growth trends from 2000 to the forecast date.
Figure 4. Components of Population Change in the Salem HMA, 2000 to Forecast
3,000
2,500
2,000
1,500
1,000
500
02000 to 2010 2010 to current Current to forecast
Ave
rage
ann
ual c
hang
e
Net natural change Net migration
Notes: The current date is August 1, 2016. The forecast date is August 1, 2019.Sources: 2000 and 2010—2000 Census and 2010 Census; current and forecast—estimates by analyst
Figure 5. Number of Households by Tenure in the Salem HMA, 2000 to Current
2000 2010 Current
Renter Owner
90,000
80,000
70,000
60,000
50,000
40,000
30,000
20,000
10,000
0
Note: The current date is August 1, 2016.Sources: 2000 and 2010—2000 Census and 2010 Census; current—estimates by analyst
Figure 6. Population and Household Growth in the Salem HMA, 2000 to Forecast
Population Households
4,500
4,000
3,500
3,000
2,500
2,000
1,500
1,000
500
02000 to 2010 2010 to current Current to forecast
Ave
rage
ann
ual c
hang
e
Notes: The current date is August 1, 2016. The forecast date is August 1, 2019.Sources: 2000 and 2010—2000 Census and 2010 Census; current and forecast—estimates by analyst
Population and Households Continued

Sa
lem
, O
R •
CO
MP
RE
HE
NS
IVE
HO
US
ING
MA
RK
ET
AN
ALY
SIS
7Housing Market Trends
Sales Market
Sales housing market conditions in the Salem HMA are currently tight, with an estimated vacancy rate of 2.0 percent, down from 2.4 percent in April 2010. The decline in new home production following the collapse of the housing market, combined with improving economic conditions, contributed to the absorption of excess vacancies and to the tight market conditions. The inventory of homes for sale represented a 2.9month supply in August 2016 compared with a 4.5month supply in August 2015. During the same time, the number of active listings increased 36 percent, to 286, while the total marketing time declined from 79 to 46 days (RMLS™).
During the 12 months ending July 2016, approximately 6,850 existing singlefamily homes, townhomes, and condominiums (hereafter, existing homes) sold, up 17 percent from the 6,000 existing homes sold during the previous 12 months (CoreLogic, Inc., with adjustments by the analyst). By comparison, existing home sales averaged 8,175 during the buildup of the housing boom from 2003 through 2007 before declining from 2008 through 2011 at an average annual rate of 18 percent to a low of 3,475 existing home sales. Since 2013, demand for homes has increased faster than the available supply, putting upward pressure on home prices. The average sales price increased 8 percent during the 12 months ending July 2016 to $225,300, which is 32 percent higher than the trough in 2012 and 3 percent higher than the prerecession peak of $213,400 reached in 2007.
In response to strong economic con ditions in the HMA, seriously delinquent (90 or more days delinquent
or in foreclosure) loans and real estate owned (REO) properties have become a less significant part of the sales market than they were during the worst of the housing crisis from 2009 through 2012. During July 2016, 2.8 percent of mortgages in the HMA were seriously delinquent or in REO status, down from 4.1 percent in July 2015 and well below a July high of 6.4 percent in 2012 (CoreLogic, Inc.). As a result of weak economic conditions and the foreclosure crises, REO home sales accounted for almost onefourth of all existing home sales from 2009 through 2012; however, REO sales comprised only 10 percent of existing home sales during the 12 months ending July 2016. The average sales price of an REO home was $162,600, almost 30 percent less than the average sales price of a regular resale home (CoreLogic, Inc., with adjustments by the analyst).
Sales of new singlefamily homes, townhomes, and condominiums (hereafter, new homes) have increased each year since 2013. Approximately 570 new homes sold during the 12 months ending July 2016, reflecting an increase of almost 20 percent from a year ago. By comparison, an average of 1,275 new homes sold annually from 2001 through 2007. After the housing bubble burst, the demand for new homes declined as a result of poor labor market conditions, decreased access to credit, and increased competition from existing homes. From 2008 through 2012, new home sales declined at an average annual rate of 26 percent to a low of 220 new homes sales. During the 12 months ending July 2016, the average sales price of a new home increased 10 percent

Sa
lem
, O
R •
CO
MP
RE
HE
NS
IVE
HO
US
ING
MA
RK
ET
AN
ALY
SIS
8
to $272,100, still 3 percent less than the prerecession peak of $280,500 in 2008 but 42 percent higher than in 2013, when new home sales prices bottomed out.
Singlefamily home construction, as measured by the number of singlefamily homes permitted, reached a 20year low in 2011, when only 320 homes were permitted, in response to decreased demand for new homes as a consequence of the housing market collapse and national recession. Begin ning in 2012, however, builders responded to the improving sales market by increasing new home construction (Figure 7). During the 12 months ending July 2016, 400 singlefamily
homes were permitted, a decline of approximately 5 percent compared with the preceding 12month period; however, singlefamily permitting levels in 2015 were the highest recorded since 2007 (preliminary data subject to revisions). By contrast, an average of 1,600 homes were permitted annually from 2000 through 2007.
New home construction is occurring throughout the HMA, with a higher concentration in the southeast portion of the city of Salem. Examples of larger communities currently under construction include Cottonwood Lakes Phase III and Bailey Ridge Phase II. Cottonwood Lakes comprises 102 lots, with homes ranging from 1,425 to 2,300 square feet and an average list price of $352,300. Bailey Ridge consists of 159 lots; Phase II is under construction with 5 homes available for purchase with an average list price of $432,500, and 10 homes will be available within the coming year. Currently, an estimated 260 singlefamily homes are under construction in the HMA.
During the 3year forecast period, demand is estimated for 3,075 new homes in the HMA, with increasing demand during the second and third years of the forecast period (Table 1). The 260 homes currently under construction and a portion of the 4,000 other vacant units that may reenter the sales market will satisfy some of the demand. Demand is expected to be greatest in the $300,000to$399,999 price range. Table 4 shows the estimated demand for marketrate sales housing by price range.
Figure 7. Single-Family Homes Permitted in the Salem HMA, 2000 to Current
2000
2001
2002
2003
2004
2005
2006
2,500
2,000
1,500
1,000
500
0
2008
2009
2010
2011
2013
2016
2015
2014
2012
2007
Notes: Includes townhomes. Current includes data through July 2016.Sources: U.S. Census Bureau, Building Permits Survey; estimates by analysts
Table 4. Estimated Demand for New Market-Rate Sales Housing in the Salem HMA During the Forecast Period
Price Range ($) Units of PercentFrom To Demand of Total
250,000 299,999 310 10.0300,000 349,999 920 30.0350,000 399,999 920 30.0400,000 449,999 370 12.0450,000 499,999 250 8.0500,000 599,999 180 6.0600,000 and higher 120 4.0
Notes: The 260 homes currently under construction and a portion of the estimated 4,000 other vacant units in the HMA will likely satisfy some of the forecast demand. The forecast period is August 1, 2016, to August 1, 2019.Source: Estimates by analyst
Housing Market TrendsSales Market Continued

Sa
lem
, O
R •
CO
MP
RE
HE
NS
IVE
HO
US
ING
MA
RK
ET
AN
ALY
SIS
9
Rental MarketRental housing market conditions in the Salem HMA are currently slightly tight, with an overall rental vacancy rate estimated at 4.5 percent as of September 1, 2016, down from 7.0 percent in April 2010 when market conditions were soft (Figure 8). Rental market conditions in the Salem HMA have tightened considerably because growth in renter households has outpaced the increase in rental inventory since 2010. The apartment market, which comprises approximately 65 percent of renteroccupied units in the HMA, is very tight, but the vacancy rate increased to 2.7 percent during the second quarter of 2016, up from 1.3 percent a year prior, because ap proximately 320 new units entered the market in the past year (Reis, Inc.). Since 2005, limited apartment con struction has kept the vacancy rate under 6 percent, even during periods when market conditions were soft, rent growth was slower, and concessions
were more prevalent (data available only beginning in 2005). The average apartment rent increased 9 percent from the second quarter of 2015 to the second quarter of 2016, to $790, marking the fourth consecutive quarter with yearoveryear rent growth of 9 percent or higher. Rents averaged $578 for studios, $658 for onebedroom units, $799 for twobedroom units, and $1,042 for threebedroom units. As market conditions tightened, the percentage of units offering concessions declined from 100 percent during the second quarter of 2011 to 0 percent during the second quarter of 2016 (MPF Research).
Multifamily construction activity, as measured by the number of units permitted, has generally improved since the 2009through2011 period, when permitting was lower than during any other 3year period since the late 1980s. Approximately 290 multifamily units were permitted in the HMA during the 12 months ending July 2016 compared with 110 units permitted during the previous 12 months (preliminary data subject to revisions). By comparison, an average of 450 multifamily units were permitted annually from 2000 through 2009 (Figure 9). The onset of the national recession and subsequent housing market collapse caused multifamily construction to decline at an average annual rate of 35 percent from 2009 through 2011, to a low of 110 multifamily units permitted. During this time, financing for new construction was particularly difficult to obtain, despite an increased demand for rental units brought on by the foreclosure crisis. This obstacle resulted in a very limited supply of new apartments, which, coupled with
Figure 8. Rental Vacancy Rates in the Salem HMA, 2000 to Current
2000 Current2010
6.8
4.5
7.08.0
6.0
4.0
2.0
0.0
Note: The current date is August 1, 2016.
Sources: 2000 and 2010—2000 Census and 2010 Census; current—estimates by analyst
Figure 9. Multifamily Units Permitted in the Salem HMA, 2000 to Current
2000
2001
2002
2003
2004
2005
2006
700
600
500
400
300
200
100
0
2008
2009
2010
2011
2013
2016
2015
2014
2012
2007
Notes: Excludes townhomes. Current includes data through July 2016.Sources: U.S. Census Bureau, Building Permits Survey; estimates by analysts
Housing Market Trends Continued

Sa
lem
, O
R •
CO
MP
RE
HE
NS
IVE
HO
US
ING
MA
RK
ET
AN
ALY
SIS
10
increased demand, caused apartment market conditions to tighten. As lenders became increasingly confident in the economic recovery, financing returned and builders increased apartment construction to an average of 240 units annually from 2010 through 2014.
An estimated 520 multifamily units are currently under construction, 200 of which are units in assisted living facilities. The most recent marketrate apartment complex to open was the 108unit Encore Apartments in January 2016 in downtown Salem. Rents start at $900 for onebedroom units, $1,015 for twobedroom units, and $1,325 for threebedroom units. The 115unit South Block Apartments opened in August 2015 in downtown Salem. The property began preleasing in May 2015 and was fully occupied by December 2015, averaging an absorption rate of 16 units per month.
Monthly rents by bedroom range from $995 to $1,300 for studios, from $1,100 to $1,400 for onebedroom units, and from $1,300 to $2,500 for twobedroom units and start at $2,000 for threebedroom units. Phase II of South Block Apartments is under construction and will consist of 63 units on completion in December 2016. Currently, 75 percent of the units have been preleased, and unit rents are the same as those for Phase I.
During the next 3 years, demand is expected for 2,025 new marketrate rental units in the HMA (Table 1), with demand the highest in the first year and tapering off in the second and third years. The 520 units currently under construction will satisfy part of the demand. Table 5 shows the forecast demand for new marketrate rental housing in the HMA by rent level and number of bedrooms.
Table 5. Estimated Demand for New Market-Rate Rental Housing in the Salem HMA During the Forecast Period
Zero Bedrooms One Bedroom Two Bedrooms Three or More Bedrooms
Monthly Gross Rent ($)
Units of Demand
Monthly Gross Rent ($)
Units of Demand
Monthly Gross Rent ($)
Units of Demand
Monthly Gross Rent ($)
Units of Demand
800 or more 100 1,000 to 1,199 550 1,200 to 1,399 870 1,400 to 1,599 3101,200 or more 60 1,400 or more 95 1,600 or more 35
Total 100 Total 610 Total 970 Total 340
Notes: Numbers may not add to totals because of rounding. Monthly rent does not include utilities or concessions. The 520 units currently under construction will likely satisfy some of the estimated demand. The forecast period is August 1, 2016, to August 1, 2019.Source: Estimates by analyst
Housing Market TrendsRental Market Continued

Sa
lem
, O
R •
CO
MP
RE
HE
NS
IVE
HO
US
ING
MA
RK
ET
AN
ALY
SIS
11Data Profile
Table DP-1. Salem HMA Data Profile, 2000 to Current
Average Annual Change (%)
2000 2010 Current 2000 to 2010 2010 to Current
Total resident employment 169,023 170,874 182,900 0.1 1.2
Unemployment rate 5.3% 10.9% 5.4%
Nonfarm payroll jobs 140,700 143,700 158,500 0.2 1.8
Total population 347,214 390,738 413,500 1.2 0.9
Total households 124,699 141,245 147,700 1.3 0.7
Owner households 79,746 87,643 87,450 0.9 0.0
Percent owner 64.0% 62.1% 59.2%
Renter households 44,953 53,602 60,250 1.8 1.9
Percent renter 36.0% 37.9% 40.8%
Total housing units 132,635 151,250 156,400 1.3 0.5
Owner vacancy rate 2.5% 2.4% 2.0%
Rental vacancy rate 6.8% 7.0% 4.5%
Median Family Income $43,200 $58,200 $57,200 3.0 – 0.3
Notes: Numbers may not add to totals because of rounding. Employment data represent annual averages for 2000, 2010, and the 12 months through July 2016. Median Family Incomes are for 1999, 2009, and 2015. The current date is August 1, 2016.Sources: U.S. Census Bureau; U.S. Department of Housing and Urban Development; estimates by analyst

Sa
lem
, O
R •
CO
MP
RE
HE
NS
IVE
HO
US
ING
MA
RK
ET
AN
ALY
SIS
12
Data Definitions and Sources
2000: 4/1/2000—U.S. Decennial Census
2010: 4/1/2010—U.S. Decennial Census
Current date: 8/1/2016—Analyst’s estimates
Forecast period: 8/1/2016–8/1/2019—Analyst’s
estimates
The metropolitan statistical area definition in this
report is based on the delineations established by
the Office of Management and Budget (OMB) in
the OMB Bulletin dated February 28, 2013.
Demand: The demand estimates in the analysis
are not a forecast of building activity. They are
the estimates of the total housing production
needed to achieve a balanced market at the end
of the 3year forecast period given conditions on
the asof date of the analysis, growth, losses, and
excess vacancies. The estimates do not account
for units currently under construction or units in
the development pipeline.
Other Vacant Units: In the U.S. Department of
Housing and Urban Development’s (HUD’s)
analysis, other vacant units include all vacant
units that are not available for sale or for rent.
The term therefore includes units rented or sold
but not occupied; held for seasonal, recreational,
or occasional use; used by migrant workers; and
the category specified as “other” vacant by the
Census Bureau.
Building Permits: Building permits do not neces
sarily reflect all residential building activity that
occurs in an HMA. Some units are constructed
or created without a building permit or are issued
a different type of building permit. For example,
some units classified as commercial structures are
not reflected in the residential building permits.
As a result, the analyst, through diligent fieldwork, makes
an estimate of this additional construction activity. Some
of these estimates are included in the discussions of
singlefamily and multifamily building permits.
For additional data pertaining to the housing market
for this HMA, go to huduser.gov/publications/pdf/
CMARtables_SalemOR_17.pdf.
Contact Information
Holi Weaver, Economist
Seattle HUD Regional Office
206–220–5291
holi.m.woods[email protected]
This analysis has been prepared for the assistance and
guidance of HUD in its operations. The factual informa
tion, findings, and conclusions may also be useful to
builders, mortgagees, and others concerned with local
housing market conditions and trends. The analysis
does not purport to make determinations regarding the
acceptability of any mortgage insurance proposals that
may be under consideration by the Department.
The factual framework for this analysis follows the
guidelines and methods developed by HUD’s Economic
and Market Analysis Division. The analysis and find
ings are as thorough and current as possible based on
information available on the asof date from local and
national sources. As such, findings or conclusions may be
modified by subsequent developments. HUD expresses its
appreciation to those industry sources and state and local
government officials who provided data and information
on local economic and housing market conditions.
For additional reports on other market areas, please go to huduser.gov/portal/ushmc/chma_archive.html.