salaries for united methodist clergy in the … for united methodist clergy in the u.s.context -...
TRANSCRIPT

Salaries for United Methodist Clergy in the U.S. Context - Introduction
HiRho Y. Park, D.Min. Division of Ordained Ministry
General Board of Higher Education and Ministry The United Methodist Church
www.gbhem.org
Copyright © 2010 by the General Board of Higher Education and Ministry of The United Methodist Church. All rights reserved.
page 1 of 2
How much salary do United Methodist clergy receive? How are we doing as a church in terms of providing clergy salary as we strive to create a culture of equity for all? When we talk about clergy salaries in The United Methodist Church, should gender and race matter? These were the initial questions that the Salary Study Committee asked in the beginning of this study in March 2008. After having the first Racial-Ethnic United Methodist Clergywomen’s Consultation in January 2008, the committee that consisted of representatives from the nine United Methodist general agencies decided to follow up with one of the recommendations of the study that was sponsored by the General Board of Higher Education and Ministry in 2004, “The Status of Racial and Ethnic Minority Clergywomen in The United Methodist Church” by Dr. Jung Ha Kim and Dr. Rosetta Ross. The recommendation was to conduct a study on UM clergy salaries to develop hard data on the financial status of racial-ethnic clergywomen in comparison with their male and female European-American and male racial-ethnic peers. However, the committee quickly learned that there was no set of data on UM clergy salary in general, so we decided to undertake a massive research project to conduct the first study about the status of UM clergy salaries in the history of The United Methodist Church. This portion is phase I of the study, which examines and analyzes UM clergy salaries in general during the period between 1997 and 2008. The committee recommends further study on race and gender relations in salary structure of UM clergy in phase II. This study, “The Salaries for United Methodist Clergy in the U.S. Context,” was conducted by the General Board of Higher Education and Ministry in collaboration with the General Council on Finance and Administration, the General Board of Pension and Health Benefits, the General Commission on Religion and Race, the General Commission on Communication (United Methodist Communications), the General Commission on the Status and Role of Women, the Anna Howard Shaw Center at Boston University, the Women’s Division of the General Board of Global Ministries, and the General Board of Discipleship. Dr. Eric Johnson of Princeton University, a sociologist, provided quantitative analysis, and Dr. HeeAn Choi of Boston University provided socio-theological reflections on the results of the study. The goals of phase I of the study were to: (1) do an in-depth examination and general analysis of factors that influence clergy salaries in The United Methodist Church in the US context, and assess the state of UMC clergy salaries; (2) clarify some “myths” about clergy salaries within the UMC due to the diverse circumstances of annual conferences; and (3) explore areas of growth as a church, such as facing stratification with respect to race and

Salaries for United Methodist Clergy in the U.S. Context - Introduction
HiRho Y. Park, D.Min. Division of Ordained Ministry
General Board of Higher Education and Ministry The United Methodist Church
www.gbhem.org
Copyright © 2010 by the General Board of Higher Education and Ministry of The United Methodist Church. All rights reserved.
page 2 of 2
gender, to create equity for all as an inclusive church. The United Methodist Church is still learning to be a global church, and I regret that we could not obtain information from the Central Conferences for this study. It is my hope that this study will be an important reference to the current issues of the church, such as discussions related to the itinerancy system, guaranteed appointment for elders, the worldwide nature of the church, and the effectiveness of clergy. Rev. Dr. HiRho Y. Park Director of Continuing Formation for Ministry GBHEM

Salaries for United Methodist Clergy in the U.S. Context - Quantitative Analysis
Eric B. Johnson, Ph.D. Division of Ordained Ministry
General Board of Higher Education and Ministry The United Methodist Church
www.gbhem.org
Copyright © 2010 by the General Board of Higher Education and Ministry of The United Methodist Church. All rights reserved.
page 1 of 46
Contents Summary ............................................................................................................................................................................................ 2
1 Introduction .................................................................................................................................................................... 3
2 Baseline—Time Trend, Part-time Work, and Parsonage Adjustments ................................................................. 6
3 Raw Salary Differences by Gender and Race/Ethnicity ......................................................................................... 9
Table 1: Percentage Change in Average Salary for Gender and Race/Ethnic Groups from Males/Whites11
4 Congregational Attributes ............................................................................................................................................ 11
Table 2: Percentage Change in Average Salary Based on Congregational Attributes ..................................... 14
5 Seniority and Appointment Characteristics ............................................................................................................. 16
Table 3: Percentage Change in Average Salary Based on Characteristics of Position .................................... 18
6 Explaining Gender and Race Differences ............................................................................................................... 20
Table 4: Gender/Race Gap Conditioned upon Congregation, Person, and Position Attributes ................ 20
7 Conference Differences .............................................................................................................................................. 23
A Data.................................................................................................................................................................................. 28
i. Pastor Salary .................................................................................................................................................. 28
ii. Sources ........................................................................................................................................................... 28
iii. Missing Values............................................................................................................................................... 30
Table 5: Salary Data Missing from Sample ............................................................................................................. 32
Table 6: Salary Missing by Category ........................................................................................................................ 32
B Methods ......................................................................................................................................................................... 33
C Definition of Terms ..................................................................................................................................................... 34
D Descriptive Statistics ..................................................................................................................................................... 35
Table 7: Descriptive Statistics ................................................................................................................................... 35
Table 8: Bivariate Correlations ................................................................................................................................. 36
E Model Results ................................................................................................................................................................. 38
Table 9: Linear Regression Model Results—Overall ........................................................................................... 38
Table 10: Linear Regression Model Results—Conference Differences ............................................................ 41
Table 11: Linear Regression Model Results—Conference Differences, Race ................................................. 43
Codebook ........................................................................................................................................................................................ 45

Salaries for United Methodist Clergy in the U.S. Context - Quantitative Analysis
Eric B. Johnson, Ph.D. Division of Ordained Ministry
General Board of Higher Education and Ministry The United Methodist Church
www.gbhem.org
Copyright © 2010 by the General Board of Higher Education and Ministry of The United Methodist Church. All rights reserved.
page 2 of 46
Summary The report examines salaries for United Methodist pastors from 1997 to 2008. The following list summarizes the main findings in the report:
• Average pastor salaries have increased substantially over this period of time, exceeding the general rate of inflation by approximately 2% per year, resulting in a 20% total increase over the past decade. • Without taking other factors into account, there are substantial differences between male and female pastors (13%), and white and non-white pastors (9–15%). • However, the gender and race gaps stem from different causes:
- The gender gap is due largely to differences in seniority between male and female
pastors, and can be expected to decrease over time as female pastors gain seniority. - The race gap results from the assignment of non-white pastors to congregations that
pay lower salaries.
• Congregation size is the largest differentiating factor for pastor salaries, reflecting the importance of appointments for pastor salaries. • Even after accounting for congregation attributes and differences in seniority, appointment status matters greatly for pastor salaries.
- Associate pastors and part-time/other local pastors earn about 30% less than elders
who are the lead or sole pastor. - There is only a moderate gap (~10%) between full-time local pastors and elders,
however.
• Average pastor salaries differ substantially between conferences. Even after adjusting for variation in average salaries due to congregation, appointment, and personal characteristics, more than $14,000 separates the conference with the highest average salary from the lowest. • The gender gap also differs between conferences, and is generally larger in Southern conferences.

Salaries for United Methodist Clergy in the U.S. Context - Quantitative Analysis
Eric B. Johnson, Ph.D. Division of Ordained Ministry
General Board of Higher Education and Ministry The United Methodist Church
www.gbhem.org
Copyright © 2010 by the General Board of Higher Education and Ministry of The United Methodist Church. All rights reserved.
page 3 of 46
1 Introduction
This report presents the results of a quantitative examination of pastor salaries in the United Methodist Church (UMC) from 1997 to 2008, focusing particularly on how salaries differ with respect to gender and race. As one phase of an in-depth examination of pastor salaries, this report uses existing data collected by UMC General Agencies, The General Board of Pension and Health Benefits and The General Board of Finance and Administration, to analyze variation in the average salary level for pastors across a number of factors and groups. Initially, pastor salaries are determined by the Bishop and the Cabinet of the annual conference, where appointments are made (par. 604.13, BOD). According to the method for setting and funding the salaries from the annual conference-wide plan, local churches recommend the amount of clergy compensation each year during the Charge Conference, which is an annual meeting between the local church or churches in a pastoral charge and their district superintendent. Because of the importance of the appointment system to salary levels, the analyses presented in this report focus mainly on attributes of congregations, the appointment system, and the career progression of pastors as predictors of salaries. Appointments are made within conferences, and most pastors spend their entire career within a single conference. Conferences have substantial leeway to determine both formal and informal practices regarding salary setting, including setting standards for minimum salaries.1 Thus, while salaries are set through consultation between congregations, district superintendents, and pastors, conferences also play a potentially large role establishing salary differences. For this reason, in addition to examining how pastors’ salaries vary overall within the UMC, this report also considers how average salaries differ between conferences. The analyses in this report are based upon multiple regression. Multiple regression was chosen because salaries are determined by many factors, complicating comparisons across subgroups. Differences in the average salary between subgroups, such as gender or race, may occur because members of these subgroups differ in some other characteristic important to salaries. For instance, differences in average salaries between males and females may be due to differences in the seniority of males and females in the pastorate. Regression models provide a means to deal with this complication. The coefficients of a regression model have an “all things equal” interpretation, indicating how much average salaries differ between groups that have similar
1The complexity of these standards is such that it was not deemed feasible to analyze these minimums in the current report. In
order for smaller, poorer churches to meet these minimums, there is an equitable compensation fund that supplements congregational resources; however, the use of equitable compensation funds was not consistently recorded over the entire period.

Salaries for United Methodist Clergy in the U.S. Context - Quantitative Analysis
Eric B. Johnson, Ph.D. Division of Ordained Ministry
General Board of Higher Education and Ministry The United Methodist Church
www.gbhem.org
Copyright © 2010 by the General Board of Higher Education and Ministry of The United Methodist Church. All rights reserved.
page 4 of 46
characteristics on all other variables included in the model. When few variables are included, regression models can be used to provide estimates of the raw differences between subgroup members. Tracking how these differences change as more variables are added to the model provides insight into the processes that generate these differences. Starting from a baseline model, this analysis adds possible predictors of pastor salaries in five stages: (1) gender and race, (2) congregation attributes, (3) seniority, (4) other appointment characteristics, and (5) other career characteristics. This strategy allows raw differences in salary across gender and race to be considered at stage 1. Explanations for these differences are then considered at the end of the report, based upon the results of the other four stages. Gender and race are considered in the first stage in order to provide an empirical measurement of extant differences in salaries between men and women and across race. Congregational attributes are considered in the second stage because of the importance of the appointment system in determining pastor salaries. By considering congregational attributes at this stage, differences in salary across seniority and other appointment and career characteristics are considered net of what one would expect based upon the tendency of pastors to be appointed to better-paying congregations over the course of their career. Likewise, the differences in salaries between local pastors and elders (stage 4) are considered net of the tendency for these pastors to have less seniority than elders. As a means of producing meaningful comparisons, this report calculates average salaries, and differences in these averages, for pastors having specific characteristics. These characteristics are reported in the footnote of the table or figure in which the results are reported. Because of the modeling techniques used to produce these estimates, a few technical notes are necessary. Salaries are often summarized by median values, because the standard (arithmetic) mean can be unduly inflated when there are a few large values, and does not indicate the central tendency of the data in this case. The averages presented in this report are calculated based on the natural log of salaries. They will lie closer to median salaries, and can be interpreted like medians. They provide a good indicator of the central tendency in pastor salaries, but will not match averages that have been produced by calculating the arithmetic mean. See the methodological section for further discussion of this point. The sample frame for this analysis consists of all pastors serving UMC congregations in the United States from 1997 to 2008. Salary and appointment history data came from the General Board of Pensions and Health Benefits, and congregational statistics came from the General Board of Finance and Administration data. Retired pastors serving congregations and supply pastors were excluded from the sample because they are not present in the Board of Pensions

Salaries for United Methodist Clergy in the U.S. Context - Quantitative Analysis
Eric B. Johnson, Ph.D. Division of Ordained Ministry
General Board of Higher Education and Ministry The United Methodist Church
www.gbhem.org
Copyright © 2010 by the General Board of Higher Education and Ministry of The United Methodist Church. All rights reserved.
page 5 of 46
data in great enough numbers to ensure that averages for them would be representative. Similarly, a substantial number of part-time/other local pastors do not appear in the Pensions data set. These pastors have been included in the analysis because they occur in greater numbers and are not missing as often. However, results for part-time/other local pastors should be viewed more cautiously because there is greater potential for bias. The salary figures used for analysis include the salary and housing allowance (if any) paid to the pastor and reported to the General Board of Finance and Administration. It does not include other forms of compensation, such as benefits and contributions to pension funds. Housing payments are included because housing is a major cost, and salaries include housing costs in most other occupations. A description of this measure, the data in general, and a full list of variables and their source is presented in the appendix.

Salaries for United Methodist Clergy in the U.S. Context - Quantitative Analysis
Eric B. Johnson, Ph.D. Division of Ordained Ministry
General Board of Higher Education and Ministry The United Methodist Church
www.gbhem.org
Copyright © 2010 by the General Board of Higher Education and Ministry of The United Methodist Church. All rights reserved.
page 6 of 46
2 Baseline—Time Trend, Part-time Work, and Parsonage Adjustments What is the average pastor salary, and how much has it changed in the past 10 years? The first model was designed to answer this question. This model adjusts for two prosaic factors that must be taken into account in order to calculate a meaningful average: part-time appointments and the presence of a parsonage. Pastors in part-time appointments will be paid less than their full-time counterparts, and a failure to account for this would result in misleading averages. This is particularly true since the proportion of pastors in part-time appointments has changed over the past 10 years. Figure 1: Salary Change over Time

Salaries for United Methodist Clergy in the U.S. Context - Quantitative Analysis
Eric B. Johnson, Ph.D. Division of Ordained Ministry
General Board of Higher Education and Ministry The United Methodist Church
www.gbhem.org
Copyright © 2010 by the General Board of Higher Education and Ministry of The United Methodist Church. All rights reserved.
page 7 of 46
The average pastor salary has increased steadily by approximately 2% per year over the past 10 years, resulting in a 21% increase from 1998 to 2008.2 In 1998, the average salary of full-time pastors not living in a parsonage was approximately $45,300, and this had increased to $55,000 by 2008. Since dollar figures here (and throughout the study) have been adjusted to 2008 dollars using the consumer price index, salary increases for pastors have exceeded the general rate of inflation over the past 10 years. Figure 2: Percentage of Part-time Pastors in Study Data
For reasons discussed in the text, these figures are not representative for UMC pastors as a whole, and underestimate the number of part-time pastors. More than 80% of the pastors in the study sample held full-time appointments (figure 2), though both the number of part-time appointments and the proportion of pastors being paid for half or quarter time have increased over the past 10 years. The percentage of full-time pastors in the data decreased from 89% in 1997 to 79% in 2008, and the percentage of pastors earning half or quarter time increased from 3% to 17% over the same period. However, this trend could result, in part, from changes in how the database is constructed. Furthermore, while these figures indicate that part-time status needs to be accounted for when examining time trends using this data, they almost certainly underestimate the number of part-time pastors. Part-time
2 A steady increase appears to capture the pattern of change over time. Additional model specifications that allowed this increase
to vary between years did not indicate any notable additional patterns (such as increases occurring primarily at the beginning or ending of the period.)
Salaries for United Methodist Clergy in the U.S. Context - Quantitative Analysis
Eric B. Johnson, Ph.D. Division of Ordained Ministry
General Board of Higher Education and Ministry The United Methodist Church
www.gbhem.org
Copyright © 2010 by the General Board of Higher Education and Ministry of The United Methodist Church. All rights reserved.
page 8 of 46
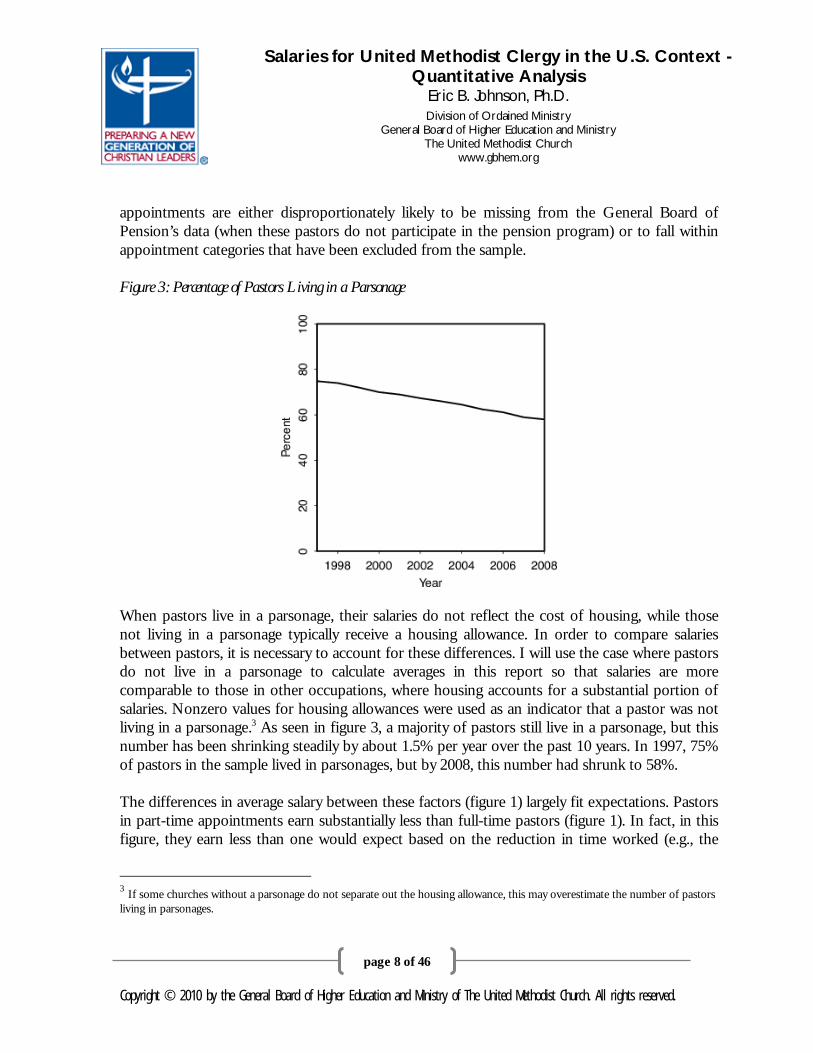
appointments are either disproportionately likely to be missing from the General Board of Pension’s data (when these pastors do not participate in the pension program) or to fall within appointment categories that have been excluded from the sample. Figure 3: Percentage of Pastors Living in a Parsonage
When pastors live in a parsonage, their salaries do not reflect the cost of housing, while those not living in a parsonage typically receive a housing allowance. In order to compare salaries between pastors, it is necessary to account for these differences. I will use the case where pastors do not live in a parsonage to calculate averages in this report so that salaries are more comparable to those in other occupations, where housing accounts for a substantial portion of salaries. Nonzero values for housing allowances were used as an indicator that a pastor was not living in a parsonage.3 As seen in figure 3, a majority of pastors still live in a parsonage, but this number has been shrinking steadily by about 1.5% per year over the past 10 years. In 1997, 75% of pastors in the sample lived in parsonages, but by 2008, this number had shrunk to 58%. The differences in average salary between these factors (figure 1) largely fit expectations. Pastors in part-time appointments earn substantially less than full-time pastors (figure 1). In fact, in this figure, they earn less than one would expect based on the reduction in time worked (e.g., the
3 If some churches without a parsonage do not separate out the housing allowance, this may overestimate the number of pastors living in parsonages.

Salaries for United Methodist Clergy in the U.S. Context - Quantitative Analysis
Eric B. Johnson, Ph.D. Division of Ordained Ministry
General Board of Higher Education and Ministry The United Methodist Church
www.gbhem.org
Copyright © 2010 by the General Board of Higher Education and Ministry of The United Methodist Church. All rights reserved.
page 9 of 46
average salary of three-quarter-time pastors is much less than three-quarters of what full-time pastors make). However, this results from the type of congregations offering part-time employment and from the fact that part-time pastors are less likely to be experienced, hold full membership, or be lead rather than associate pastors, on average. When these factors are accounted for, three-quarter-time pastors earn 73%, half-time pastors 64%, and quarter-time pastors 41%, of what full-time pastors earn (results calculated from data in table 10). The salary of pastors living in parsonages is 83% of the total salaries for pastors not living in parsonages.
3 Raw Salary Differences by Gender and Race/Ethnicity While the number of female pastors is increasing steadily in the UMC, most pastors remain male (figure 4). Twenty percent (20%) of pastors in the study sample were female in 1998, and this had increased to 29% by 2008, resulting in an overall average of 26% female pastors (figure 5). There are fewer non-white pastors in the UMC (only 12%), and this figure has not changed dramatically over the past 10 years. Most nonwhite pastors are black (7%), followed by Asian (3%), and Hispanic/Latino (1%). Race/ethnic groups that fall within the Other category also account for about 1% of UMC pastors, and include Native Americans, Pacific Islanders, and pastors selecting multiple categories. Figure 4: Distribution of Pastors by Gender and Race

Salaries for United Methodist Clergy in the U.S. Context - Quantitative Analysis
Eric B. Johnson, Ph.D. Division of Ordained Ministry
General Board of Higher Education and Ministry The United Methodist Church
www.gbhem.org
Copyright © 2010 by the General Board of Higher Education and Ministry of The United Methodist Church. All rights reserved.
page 10 of 46
Figure 5: Trends for Female Pastors
Note: Because part-time local pastors and supply pastors are underrepresented in this data set, these percentages may not be representative for UMC pastors as a whole. Figure 6: Average Salary by Gender and Race/Ethnicity
Note: These averages are for full-time pastors, in 2008, without a parsonage. Error bars represent a 95% confidence interval.
Salaries for United Methodist Clergy in the U.S. Context - Quantitative Analysis
Eric B. Johnson, Ph.D. Division of Ordained Ministry
General Board of Higher Education and Ministry The United Methodist Church
www.gbhem.org
Copyright © 2010 by the General Board of Higher Education and Ministry of The United Methodist Church. All rights reserved.
page 11 of 46
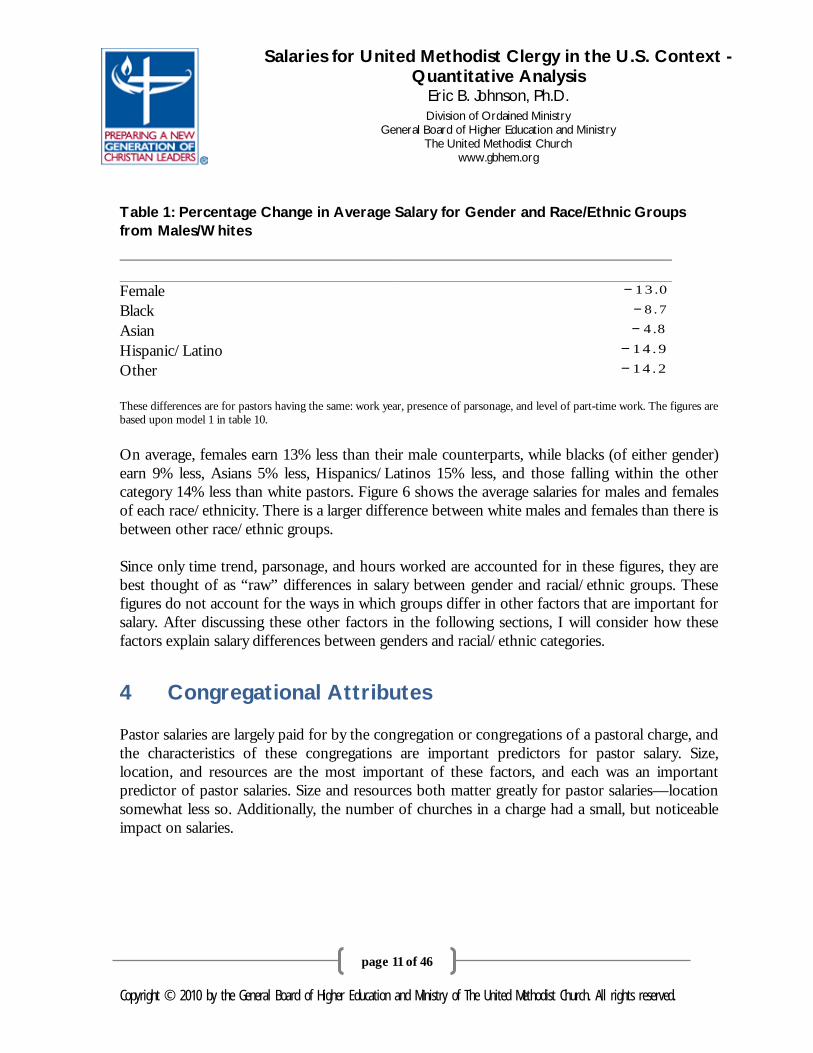
Table 1: Percentage Change in Average Salary for Gender and Race/Ethnic Groups from Males/Whites Female − 1 3 .0 Black − 8 .7 Asian − 4 .8 Hispanic/Latino − 14 .9 Other − 14 .2 These differences are for pastors having the same: work year, presence of parsonage, and level of part-time work. The figures are based upon model 1 in table 10. On average, females earn 13% less than their male counterparts, while blacks (of either gender) earn 9% less, Asians 5% less, Hispanics/Latinos 15% less, and those falling within the other category 14% less than white pastors. Figure 6 shows the average salaries for males and females of each race/ethnicity. There is a larger difference between white males and females than there is between other race/ethnic groups. Since only time trend, parsonage, and hours worked are accounted for in these figures, they are best thought of as “raw” differences in salary between gender and racial/ethnic groups. These figures do not account for the ways in which groups differ in other factors that are important for salary. After discussing these other factors in the following sections, I will consider how these factors explain salary differences between genders and racial/ethnic categories.
4 Congregational Attributes Pastor salaries are largely paid for by the congregation or congregations of a pastoral charge, and the characteristics of these congregations are important predictors for pastor salary. Size, location, and resources are the most important of these factors, and each was an important predictor of pastor salaries. Size and resources both matter greatly for pastor salaries—location somewhat less so. Additionally, the number of churches in a charge had a small, but noticeable impact on salaries.

Salaries for United Methodist Clergy in the U.S. Context - Quantitative Analysis
Eric B. Johnson, Ph.D. Division of Ordained Ministry
General Board of Higher Education and Ministry The United Methodist Church
www.gbhem.org
Copyright © 2010 by the General Board of Higher Education and Ministry of The United Methodist Church. All rights reserved.
page 12 of 46
Figure 7: Frequency of Congregational/Charge Membership by Urban Location
Note: The shaded regions reflect what proportion of congregations and multi-church charges at each level of membership have a rural, suburban, etc. location, while the overall height indicates how congregations and multi-church charges are distributed by membership. Proportions have been smoothed. The membership of a congregation was used as the measure of size, and congregations were designated as either Urban, Suburban, Large Town, or Rural based upon their census tract. When multiple congregations are included in a pastoral charge, membership figures were combined and the census tract for the largest congregation in the charge was used as the location. Figure 7 shows the distribution of congregations and multiple parish charges by membership and location. Membership is highly “skewed” in that there are many small congregations and only a few really large congregations, so size is presented on a logarithmic scale in the figure. The median size is 275 members. Congregations and multi-church charges around and below median membership are relatively evenly split between urban, suburban, large-town, and rural locations, but very large congregations are mostly located in urban areas. The membership of a congregation is the most important determinant of their overall budget, so the number of members and the budget are highly correlated. For this reason, a congregation’s budget relative to other congregations with the same number of members is a more appropriate measure of financial resources when membership is also being considered. In order to capture the relative financial strength of congregation, I first calculated how many dollars per member a congregation included in its budget, and then compared the figure for that congregation to others by coding which decile the congregation fell into. Figures for multiple congregations in a

Salaries for United Methodist Clergy in the U.S. Context - Quantitative Analysis
Eric B. Johnson, Ph.D. Division of Ordained Ministry
General Board of Higher Education and Ministry The United Methodist Church
www.gbhem.org
Copyright © 2010 by the General Board of Higher Education and Ministry of The United Methodist Church. All rights reserved.
page 13 of 46
pastoral charge were aggregated for this measure, as they were for membership. By this measure, a congregation or multi-church charge in the ninth decile had more resources per member than 90% of congregations. Since wealthier congregations tend to be located in areas with higher costs of living, this measure partially captures cost-of-living differences. Multi-church charges are often formed from the congregations that are least able to pay pastors on their own. The number of churches in a charge may indicate weaknesses not reflected in resources or size, so I also included the number of churches in a charge as a predictor in addition to the decile measure of resources. Figure 8: Predicted Average Salary by Congregational Membership
Note: Predicted salaries are for 2008, for a for white, male, 50-year-old full elder with 15 years of seniority and no years in extensional ministry, who is a lead pastor serving in an urban appointment, comprised of a single congregation, at the median level of resources per member. The range of each line on the x axis is based upon the range of data for that category. The figures are based upon model 5 in table 10. Including congregational attributes resulted in the greatest increase in model fit, from 47% of the variation in pastor salaries in stage 1, to 70% of the variation in pastor salaries in stage 2. By comparison, the remaining stages explained just an additional 9% of variation in salaries (79%, total; see values in table 10). In general, salaries differ as expected across these factors. Larger and wealthier congregations pay pastors more than smaller, resource-poor congregations. Figure
Salaries for United Methodist Clergy in the U.S. Context - Quantitative Analysis
Eric B. Johnson, Ph.D. Division of Ordained Ministry
General Board of Higher Education and Ministry The United Methodist Church
www.gbhem.org
Copyright © 2010 by the General Board of Higher Education and Ministry of The United Methodist Church. All rights reserved.
page 14 of 46
8 shows how salaries increase with size for full-time and part-time pastors in appointments with and without a parsonage. This figure uses the model from the final analysis stage so that other personal and position attributes are accounted for. For full-time pastors, salaries increase dramatically with size and do not level out as size increases. There is less difference in pastor salaries between appointments with and without a parsonage at smaller congregation sizes (when salaries are lower) than there are at large congregation sizes. At the high end, this pattern may reflect the fact that large congregations are more likely to be located in urban areas with higher housing costs.
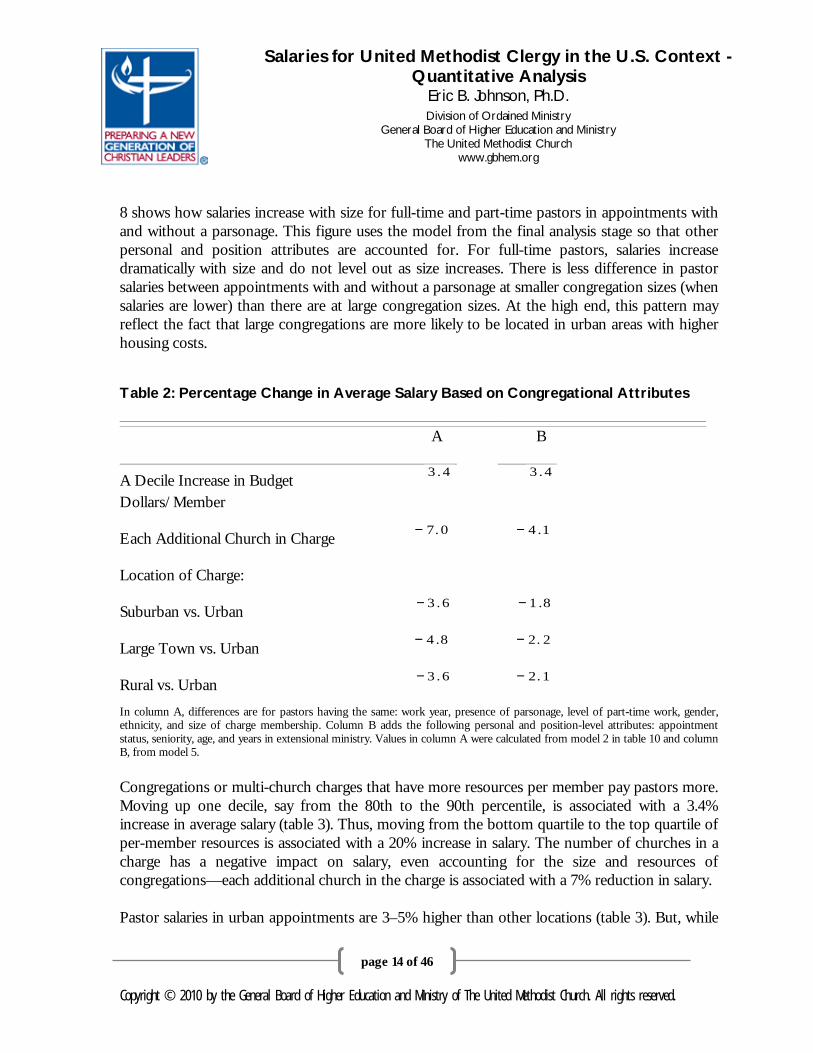
Table 2: Percentage Change in Average Salary Based on Congregational Attributes A B A Decile Increase in Budget Dollars/Member
3 .4 3 . 4
Each Additional Church in Charge − 7.0 − 4 .1
Location of Charge:
Suburban vs. Urban − 3 .6 − 1 .8
Large Town vs. Urban − 4 .8 − 2. 2
Rural vs. Urban − 3 .6 − 2.1
In column A, differences are for pastors having the same: work year, presence of parsonage, level of part-time work, gender, ethnicity, and size of charge membership. Column B adds the following personal and position-level attributes: appointment status, seniority, age, and years in extensional ministry. Values in column A were calculated from model 2 in table 10 and column B, from model 5. Congregations or multi-church charges that have more resources per member pay pastors more. Moving up one decile, say from the 80th to the 90th percentile, is associated with a 3.4% increase in average salary (table 3). Thus, moving from the bottom quartile to the top quartile of per-member resources is associated with a 20% increase in salary. The number of churches in a charge has a negative impact on salary, even accounting for the size and resources of congregations—each additional church in the charge is associated with a 7% reduction in salary. Pastor salaries in urban appointments are 3–5% higher than other locations (table 3). But, while

Salaries for United Methodist Clergy in the U.S. Context - Quantitative Analysis
Eric B. Johnson, Ph.D. Division of Ordained Ministry
General Board of Higher Education and Ministry The United Methodist Church
www.gbhem.org
Copyright © 2010 by the General Board of Higher Education and Ministry of The United Methodist Church. All rights reserved.
page 15 of 46
we might expect salaries in suburban appointments to fall between urban appointments and those located in rural and large-town areas, this does not appear to be the case. Pastors are paid at similar levels in suburban, large-town, and rural appointments. The salary differences across local church characteristics discussed in this section reflect, in part, the way in which pastors are assigned to congregations. Congregations that have fewer resources to support a pastor are often assigned local pastors or pastors at the beginning of their careers. While differences in salary across personal and positional attributes are discussed in the pages that follow, one question is whether differences across local church characteristics remain when these attributes are taken into account. Column B in table 4 shows salary differences from stage 5 of these analyses accounting for these values. The reduction in salary differences associated with urban location and the number of churches in a charge, confirms that younger, lower-status pastors are assigned to congregations that pay less in salary. However, the differences do not disappear, which indicates that seniority and appointment status do not entirely account for these differences. Furthermore, there is no change in the role of resources, suggesting that resource differences between churches are not associated with assignment in the same way.

Salaries for United Methodist Clergy in the U.S. Context - Quantitative Analysis
Eric B. Johnson, Ph.D. Division of Ordained Ministry
General Board of Higher Education and Ministry The United Methodist Church
www.gbhem.org
Copyright © 2010 by the General Board of Higher Education and Ministry of The United Methodist Church. All rights reserved.
page 16 of 46
5 Seniority and Appointment Characteristics In the next step of the analysis, I added characteristics of pastors and of their appointments. These included the total number of years a pastor had served in the UMC, and their appointment category. Appointment categories were captured through three variables: Associate Pastor indicates whether the pastor was serving at a multi-pastor charge and was not the lead pastor, Probationary Status indicates years when the pastor’s status was probationary or student rather than full, and Type of Appointment indicates whether a pastor was an elder, deacon, or local pastor. There number of pastors drops steadily as seniority increases, so that there are more pastors with low seniority in the UMC. Most of the high-seniority pastors are elders, while the majority of low-seniority pastors are local pastors (figure 9).4 Figure 9: Seniority by Appointment Status
4 Note that for classification purposes, the local pastor category includes Student Local Pastors, who are training to become
Elders.

Salaries for United Methodist Clergy in the U.S. Context - Quantitative Analysis
Eric B. Johnson, Ph.D. Division of Ordained Ministry
General Board of Higher Education and Ministry The United Methodist Church
www.gbhem.org
Copyright © 2010 by the General Board of Higher Education and Ministry of The United Methodist Church. All rights reserved.
page 17 of 46
Figure 10: Predicted Average Salary by Seniority
Note: Predicted salaries are for full-time, full-status, white, male pastors in 2008, serving in urban appointments comprised of a single congregation with 250 members, at the median level of resources per member, and no parsonage. The range of each line on the x axis is based upon the range of data for that category. Salaries increase with seniority (figure 10), even taking into account the characteristics of the congregations pastors are assigned to. Salaries increase most rapidly with seniority at first, leveling out at around 30 years of experience. For Elders that are the senior/sole pastor of a 250-member church, the predicted average salary is $49,000 for a pastor with no seniority, $54,000 for a pastor with the median of 15 years’ experience, and $58,000 for a pastor with 30 years of experience. Having 50 years of experience, however, only increases the average salary by $1,000 to $59,000 (figure 10).
Salaries for United Methodist Clergy in the U.S. Context - Quantitative Analysis
Eric B. Johnson, Ph.D. Division of Ordained Ministry
General Board of Higher Education and Ministry The United Methodist Church
www.gbhem.org
Copyright © 2010 by the General Board of Higher Education and Ministry of The United Methodist Church. All rights reserved.
page 18 of 46
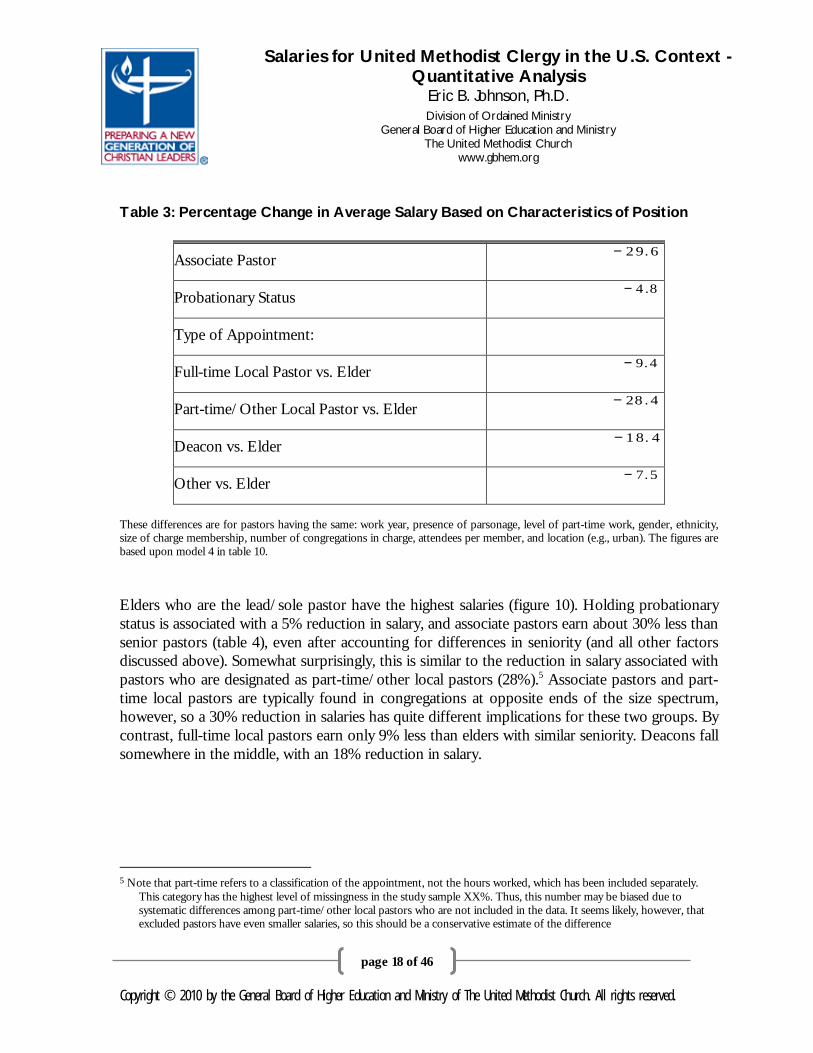
Table 3: Percentage Change in Average Salary Based on Characteristics of Position
Associate Pastor − 29.6
Probationary Status − 4 .8
Type of Appointment:
Full-time Local Pastor vs. Elder − 9.4
Part-time/Other Local Pastor vs. Elder − 28 .4
Deacon vs. Elder − 18. 4
Other vs. Elder − 7.5
These differences are for pastors having the same: work year, presence of parsonage, level of part-time work, gender, ethnicity, size of charge membership, number of congregations in charge, attendees per member, and location (e.g., urban). The figures are based upon model 4 in table 10. Elders who are the lead/sole pastor have the highest salaries (figure 10). Holding probationary status is associated with a 5% reduction in salary, and associate pastors earn about 30% less than senior pastors (table 4), even after accounting for differences in seniority (and all other factors discussed above). Somewhat surprisingly, this is similar to the reduction in salary associated with pastors who are designated as part-time/other local pastors (28%).5 Associate pastors and part-time local pastors are typically found in congregations at opposite ends of the size spectrum, however, so a 30% reduction in salaries has quite different implications for these two groups. By contrast, full-time local pastors earn only 9% less than elders with similar seniority. Deacons fall somewhere in the middle, with an 18% reduction in salary.
5 Note that part-time refers to a classification of the appointment, not the hours worked, which has been included separately.
This category has the highest level of missingness in the study sample XX%. Thus, this number may be biased due to systematic differences among part-time/other local pastors who are not included in the data. It seems likely, however, that excluded pastors have even smaller salaries, so this should be a conservative estimate of the difference

Salaries for United Methodist Clergy in the U.S. Context - Quantitative Analysis
Eric B. Johnson, Ph.D. Division of Ordained Ministry
General Board of Higher Education and Ministry The United Methodist Church
www.gbhem.org
Copyright © 2010 by the General Board of Higher Education and Ministry of The United Methodist Church. All rights reserved.
page 19 of 46
Figure 11: Salary Differences across Age
As a final step, age and time spent in extensional ministries were included in the analysis. There is relatively little difference between salaries across age once seniority and other position and congregation attributes are taken into account. Pastors who have held extensional appointments have modestly larger salaries (1% greater for every 10 years in an extensional appointment). There is a slight reduction in the average salary of older pastors, however. Salaries peak around 45 years of age and then decline. Pastor salaries increase by $5,000 (from $50,000 to $55,000) between 20 and 45 years of age, and then decline by about the same amount between 45 and 70 years of age (figure 11).

Salaries for United Methodist Clergy in the U.S. Context - Quantitative Analysis
Eric B. Johnson, Ph.D. Division of Ordained Ministry
General Board of Higher Education and Ministry The United Methodist Church
www.gbhem.org
Copyright © 2010 by the General Board of Higher Education and Ministry of The United Methodist Church. All rights reserved.
page 20 of 46
6 Explaining Gender and Race Differences
Table 4: Gender/Race Gap Conditioned upon Congregation, Person, and Position Attributes
Female − 3 . 6 Black 1.6 Asian 4 .8 Hispanic/Latino 0 .9 Other − 1 .5
These differences are for pastors having the same: work year, presence of parsonage, level of part-time work, membership, number of congregations in charge, budget, location, seniority, appointment type, age, and time in extensional ministry. The figures are based on model 5 in table 10. The differences in salary between pastors of different genders and race/ethnic groups reported in table 2 have not taken into account how congregational attributes, seniority, and other position attributes differ across gender and race. The degree to which differences in salary across gender and race/ethnicity persist in the last stage of the analysis, once these factors have been taken into account, is an indicator for discriminatory salary setting, while reductions in the gender/race gap suggest it can be attributed to gender/racial differences in these factors. Comparing table 2 to table 5 shows that most of the gender/race gap disappears once congregational, personal, and position attributes are taken into account—an initial gap of 13% between men and women is reduced to 4%, while the gap disappears for all racial/ethnic groups (except for the Other category). In fact, once these factors are accounted for, Asian pastors earn 5% more than their white counterparts.

Salaries for United Methodist Clergy in the U.S. Context - Quantitative Analysis
Eric B. Johnson, Ph.D. Division of Ordained Ministry
General Board of Higher Education and Ministry The United Methodist Church
www.gbhem.org
Copyright © 2010 by the General Board of Higher Education and Ministry of The United Methodist Church. All rights reserved.
page 21 of 46
Figure 12: Impact of Salary Predictors on Gender/Race Gap
The analysis stage at which these reductions occur can reveal the source of the gender/race gap in pastor salaries. Reductions in the gap when congregational attributes are included in the analysis suggest that differences are largely due to the assignment process—differences in the congregations and multi-church charges that male and female or white and ethnic pastors are assigned to. Reductions that occur when seniority is included in the analysis suggest that either more female/ethnic pastors are entering the workforce or that these pastors drop out of the pastor workforce earlier, so that the average seniority level is consistently lower for these groups. This may well be the case for female pastors who leave the ministry or take time off to raise children. Finally, racial and ethnic groups may be overrepresented in certain appointment categories, such as associate pastors or local pastors, with salary differences due to this overrepresentation. In order to evaluate each of these explanations, figure 12 plots the difference between females and males, and the differences between each racial/ethnic and whites at 4 analysis stages (stages 4 and 5 have been combined). The baseline model is represented by points labeled 1, and the final analysis with all factors included is represented by points labeled 4. The longer the line segment between two numbers, the greater the role that set of factors plays in determining the gender/race gap.6 Gender. For the gap between males and females, there is relatively little shift from the baseline model (1) when congregational attributes are included (2). This indicates that the salary 6 Note, however, that while the overall change in the gender gap does not depend on the order in which variables are introduced
to the model, changing this order will alter the length of each line segment if the variables are correlated with one another. Because of the importance of pastor appointments, I have included congregations’ attributes first.

Salaries for United Methodist Clergy in the U.S. Context - Quantitative Analysis
Eric B. Johnson, Ph.D. Division of Ordained Ministry
General Board of Higher Education and Ministry The United Methodist Church
www.gbhem.org
Copyright © 2010 by the General Board of Higher Education and Ministry of The United Methodist Church. All rights reserved.
page 22 of 46
differences between males and females is not primarily due to males being assigned to congregations and multi-church charges which pay higher salaries (i.e. larger/richer churches). Thus, there is not much evidence for differential appointment of males versus females (at least as it impacts salary). The biggest reduction in the gender gap occurs when seniority is included in the model (3). This stage accounts for 6.5 percentage points of the gender gap, or two-thirds of the total change. This suggests that differences in the seniority between males and females account for most of the gender gap. The percentage of female pastors in the UMC has increased by about 50% over the study period (from 19% in 1997 to 29% in 2008), and the mean seniority of female pastors has also increased by about 30% over the same period (figure 5). These changes indicate that new female pastors are entering the pastorate, and suggest that the gender gap will diminish over time as these female pastors gain experience. In fact, allowing the gap between males and females to change over time suggest that the raw gender gap has diminished by 3 percentage points over the study period (from 15% in 1997 to 12% in 2008). Race/Ethnicity. The gaps between whites and other racial/ethnic groups show a different pattern. In all cases, the longest segment in figure 12 occurs when congregational attributes are added to the baseline model (between points 1 and 2). This indicates that the lion’s share of the race gap for pastors occurs because these pastors are assigned to congregations and multi-church charges that pay lower salaries). In fact, once congregational attributes have been accounted for, the salaries of black and Asian pastors are similar to those of white pastors, while the gap for Hispanic/Latino pastors is reduced from 15% to 4%. The likely mechanism for these findings is the assignment of ethnic pastors to ethnic congregations. Ethnic congregations (defined as congregations that report 40% or more of their membership is nonwhite) do not pay lower salaries than other congregations once other congregational attributes have been accounted for, but do tend to possess characteristics of other low-salary congregations and multi-church charges (small size, fewer resources, etc.).

Salaries for United Methodist Clergy in the U.S. Context - Quantitative Analysis
Eric B. Johnson, Ph.D. Division of Ordained Ministry
General Board of Higher Education and Ministry The United Methodist Church
www.gbhem.org
Copyright © 2010 by the General Board of Higher Education and Ministry of The United Methodist Church. All rights reserved.
page 23 of 46
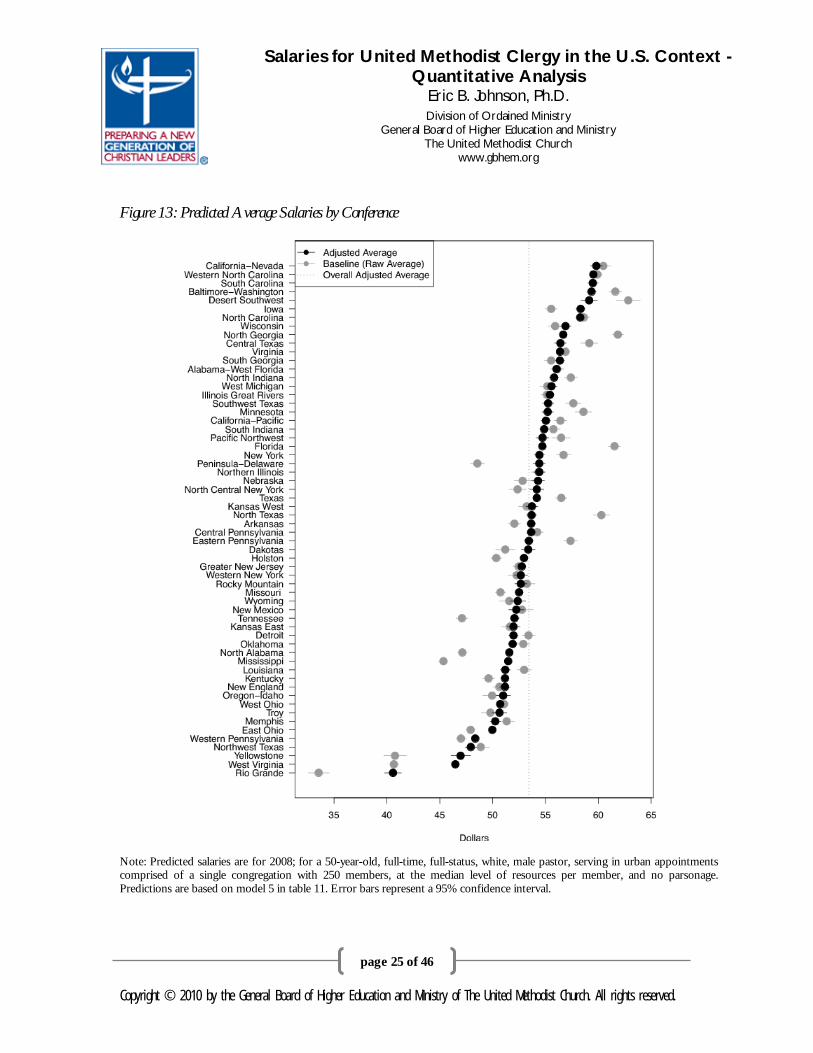
7 Conference Differences Conferences have substantial autonomy in deciding many factors of import to pastor salaries, including how pastors are appointed to congregations, salary minimums, and who receives equitable compensation funds to supplement salaries. This autonomy raises the questions, how do salaries differ between conferences, and is there variation in the gender/race gap between conferences? This section considers these questions using multilevel regression, which allows for (some) differences between conferences, while keeping the same basic analysis structure used in the rest of the report. There are substantial differences in average salaries between conferences, both in the baseline averages and in the adjusted averages (figure 13).7 The adjusted averages are based on the full model, and account for all of the congregation, position, and personal attributes discussed above. The adjusted average presents a means to compare salaries between conferences on an all-things-being-equal basis. Large differences between the baseline and adjusted average for a conference indicates that pastors or congregations in the conference differ from overall UMC average for one or more important predictor of pastor salary (such as congregational size or pastor seniority). Excluding Rio Grande (which is an outlier), there is a range of around $14,000 between the conference with the highest adjusted salary and the lowest (figure 13). This is a fairly substantial range for average salaries to vary. The standard deviation statistic for these multilevel models provides another means to summarize the amount of variation between conferences and how it changes at differing levels of the analysis. The amount that this statistic is reduced across the stages of the analysis indicates that differences between conferences on the factors included in the mode account for a substantial amount of the initial or “raw” differences in average salary between conferences. Between the baseline model and the final model, the between-conference variation in salaries decreased by 36% (from a standard deviation of 0.11, to a standard deviation of 0.07).8 This reduction indicates that a substantial portion of between-conference variation is explained by the types of pastors and congregations in the conferences. However, the factors included in these models do not explain a majority of the variation between conferences. There are two potential explanations for the variation between conferences that remain at the final analysis stage. First, it may result from differences in conference policies pertaining to salaries and pastor assignments. Alternatively, the current model may be missing an important predictor of pastor salaries that happens to differ substantially between conferences. 7 As above, the baseline model accounts only for the time trend, presence of a parsonage, and part-time work. 8 This reduction is calculated from the “intercept” variance component in table 10.

Salaries for United Methodist Clergy in the U.S. Context - Quantitative Analysis
Eric B. Johnson, Ph.D. Division of Ordained Ministry
General Board of Higher Education and Ministry The United Methodist Church
www.gbhem.org
Copyright © 2010 by the General Board of Higher Education and Ministry of The United Methodist Church. All rights reserved.
page 24 of 46
The fact that the individual level model accounts for almost 80% of the variation in pastor salaries, makes this second option less likely. The most likely candidate for a missing variable, however, is cost-of-living. Cost-of-living differences are both a potentially important determinant of salaries and are also likely to differ between conferences. But, there does not appear to be an easy correlation between conferences with high adjusted salaries and those where the cost-of-living should be highest. (Why, for example, do the Desert-Southwest and Iowa have the 5th and 6th highest adjusted averages?) Though cost-of-living is not directly controlled in this analysis, size, location, and congregational resources all serve as proxies for cost-of-living to some degree. Next, I examined to what degree the gender gap varies between conferences. Figure 14 shows conference differences in the gender gap, using the same format as figure 12 above. As with the conference averages, there is substantial variation in the gender gap between conferences, even after accounting for congregation, position, and personal attributes. A fair number of conferences have gaps of 7–10% at the bottom end, while there are many conferences without much difference at all. Most of the conferences with large gender gaps are located in the South, suggesting that there are regional differences in factors that lead to the salary gender gap in the UMC. In order to investigate how the race gap varies by conferences, I combined the race/ethnicity codes into two categories: White/Asian and Nonwhite. I combined the Asian and White categories because Asian pastors exhibited a different pattern from other race/ethnic groups (less initial difference, and greater earnings in the final model; figure 12). There is even more variation between conferences with respect to the race gap (figure 15) than there is regarding the gender gap. Under the baseline model (dots labeled 1), nonwhite pastors earn less than 20% of what white/Asian pastors earn in about 10 conferences. For many of these conferences, a substantial race gap remains, even after accounting for congregation attributes, seniority, and position attributes. However, unlike for gender, not all conferences exhibit an initial race gap, and in the final model (dots labeled 4) there are many conferences in which nonwhite pastors do better than white/Asian pastors (on an all-things-equal basis). Furthermore, while many of the conferences that have large race gaps are located in the South, there are a number of exceptions, so this pattern is not as pronounced as it is for the gender gap.
Salaries for United Methodist Clergy in the U.S. Context - Quantitative Analysis
Eric B. Johnson, Ph.D. Division of Ordained Ministry
General Board of Higher Education and Ministry The United Methodist Church
www.gbhem.org
Copyright © 2010 by the General Board of Higher Education and Ministry of The United Methodist Church. All rights reserved.
page 25 of 46
Figure 13: Predicted Average Salaries by Conference
Note: Predicted salaries are for 2008; for a 50-year-old, full-time, full-status, white, male pastor, serving in urban appointments comprised of a single congregation with 250 members, at the median level of resources per member, and no parsonage. Predictions are based on model 5 in table 11. Error bars represent a 95% confidence interval.

Salaries for United Methodist Clergy in the U.S. Context - Quantitative Analysis
Eric B. Johnson, Ph.D. Division of Ordained Ministry
General Board of Higher Education and Ministry The United Methodist Church
www.gbhem.org
Copyright © 2010 by the General Board of Higher Education and Ministry of The United Methodist Church. All rights reserved.
page 26 of 46
Figure 14: Gender Gap by Conference

Salaries for United Methodist Clergy in the U.S. Context - Quantitative Analysis
Eric B. Johnson, Ph.D. Division of Ordained Ministry
General Board of Higher Education and Ministry The United Methodist Church
www.gbhem.org
Copyright © 2010 by the General Board of Higher Education and Ministry of The United Methodist Church. All rights reserved.
page 27 of 46
Figure 15: Race Gap by Conference
Note: Because there was little difference between Asian and White pastors, these categories have been combined and serve as the reference group. The figure plots the average difference of pastors from other racial/ethnic groups from the reference group.

Salaries for United Methodist Clergy in the U.S. Context - Quantitative Analysis
Eric B. Johnson, Ph.D. Division of Ordained Ministry
General Board of Higher Education and Ministry The United Methodist Church
www.gbhem.org
Copyright © 2010 by the General Board of Higher Education and Ministry of The United Methodist Church. All rights reserved.
page 28 of 46
A Data
i. Pastor Salary This study focuses on pastor salary levels. Other elements of pastor compensation are broadly similar to general employment practices and include: pension contributions, benefits contributions, and job-related expenses/allowances. While these elements are important components of pastor compensation and would need to be examined when considering the cost of a pastor to a congregation, they invoke a conceptually different set of issues from pastors’ salaries, and are not considered in the scope of this report. For UMC pastors, base salary figures do not include housing expenses. Pastors either live in a church-owned parsonage, or receive an additional “housing allowance” that is reported separately from their base salary. Housing is a major household expense, and housing allowances can amount to a substantial percentage of a pastor’s base salary. For this reason, it makes little sense to examine salaries without accounting for housing payments. I use combined base salary and housing figures as a measure of total salary, adjusting statistically to account for differences between pastors with and without a parsonage. As used in the report, salary refers to total salary, not base salary. To account for inflation, all dollar amounts are adjusted to 2008 dollars. Pastors pay their own social security taxes, which are included in their base salary. The responsibility of pastors for these taxes does not affect comparisons between pastors, but does need to be taken into consideration when comparing the salaries of pastors to those in other occupations.
ii. Sources It is possible to approach pastor compensation from two perspectives: that of the congregations that support pastors, and that of the pastors who receive support. This is the essential difference between the two UMC agencies holding data on pastor salaries. The General Council on Finance and Administration (GCFA) tracks congregations over time, while the General Board of Pensions and Health Benefits (GBOPHB) tracks people over time. These perspectives result in a number of small but important differences in the data held by each agency that made it necessary to combine data from both in order to analyze pastor salaries. The GCFA data tracks information reported annually by congregations. Smaller congregations are often grouped together under one pastoral charge, forming multi-church charges. Because

Salaries for United Methodist Clergy in the U.S. Context - Quantitative Analysis
Eric B. Johnson, Ph.D. Division of Ordained Ministry
General Board of Higher Education and Ministry The United Methodist Church
www.gbhem.org
Copyright © 2010 by the General Board of Higher Education and Ministry of The United Methodist Church. All rights reserved.
page 29 of 46
pastor appointments can include multiple congregations, GCFA data need to be aggregated in order to reflect the characteristics of pastoral charges rather than congregations. GCFA data contain a number of variables with information on specific congregations, including charge-church alignments. Charge-church alignments extend only to 1997, thus setting the starting point of this study. The GCFA also tracks information about the pastors assigned to local churches each year including: gender, race, birth date, appointment status, and contributions made by the congregation for the pastor’s salary and housing expenses. The GBOPHB tracks people who are enrolled in the UMC pension system based upon reports provided by conference administrative officials. Most, but not all, people who lead UMC churches fall into this category. Exceptions include: ministers from other denominations, unpaid local pastors, some part-time pastors, ministers who have retired, and supply ministers. Because of these exclusions, the GCFA data provides a more complete sampling framework. However, for the pastors it does have, the GBOPHB holds data on appointment histories and the level of part-time work. Data on central conference pastors is not available across the entire period, so this report focuses on the U.S. Both agencies track pastor salaries, either of which are potentially usable for analysis. However, there are a number of differences between the salary data for each agency. The GCFA tracks contributions made by congregations on a pastor’s behalf as reported by individual congregations. Repairs, improvements, and utility payments for parsonages are often included in these figures, though they are not paid to pastors. On the other hand, prior to 2005, the GCFA did not track the amount of equitable compensation funds received by pastors as part of their salary, so GCFA data do not accurately reflect the salaries of pastors who receive these funds. Additionally, salaries for associate pastors are reported separately from that paid to the lead pastor, but are not broken out individually for each associate pastor when there is more than one. These features of GCFA data limit its usefulness for analyzing the salary received by pastors (it is, however, better suited for examining the costs of pastors to congregations). Thus, while GCFA records have better coverage of UMC pastors than GBOPHB records, this report used salary figures present in GBOPHB records. I used GCFA records to establish the sampling frame of U.S. pastoral charges that existed from 1997 to 2008 (i.e., the universe of which potential appointments), and then matched GBOPHB appointment and salary information to the charges in this sampling frame. Finally, I used the GBOPHB’s historical record of appointments to generate statistics on the career path of pastors (e.g., seniority). This procedure utilizes the strengths of both data sets, using the more accurate salary information from the GBOPHB, while allowing for a better understanding of potential biases resulting from missing data. The GBOPHB does not collect information on the race/ethnicity of pastors, so GCFA records were used for this attribute. When there were multiple congregations in a

Salaries for United Methodist Clergy in the U.S. Context - Quantitative Analysis
Eric B. Johnson, Ph.D. Division of Ordained Ministry
General Board of Higher Education and Ministry The United Methodist Church
www.gbhem.org
Copyright © 2010 by the General Board of Higher Education and Ministry of The United Methodist Church. All rights reserved.
page 30 of 46
pastoral charge, GCFA information on the local churches was aggregated to the charge level for analysis, and the location was based on that of the largest church in the charge. A codebook at the end of the report lists the variables included in analysis and their source. Each row in the resulting data set contains information for one pastor in one year. Since GCFA data is reported on a calendar-year basis, charges were matched to pastor information at the end of that calendar year. For example, a pastor whose salary changed in June of 2006 from $35,000 to $38,000 would have $35,000 recorded for 2005 and $38,000 for 2006. After preliminary analysis, salary values under $5,000, including a number of salaries reported as zero, were removed, since these values appeared not to correspond to part-time pastors, and were thus probably errors. I combined conferences that merged during the study period, so that conference boundaries were the same across the entire period. The merged conferences are: Greater New Jersey, Arkansas, and Missouri. The following missionary conferences had very few pastors and were pooled into a single category, “Missionary Conferences,” for analysis: Oklahoma Indian Missionary, Red Bird Missionary, and Alaska Missionary.
iii. Missing Values Because all available records were used rather than a random sample of pastors, sampling error, which reflects uncertainty about how the sample average reflects the population average, is of little concern. The sample sizes presented in this report are generally large enough so that sampling error is very small. However, even with a large number of pastors, systematic error is still a concern. Systematic error can result when some types of pastors are more likely to be missing from the data than others. So long as the sources of missing data are understood, this type of error can be mitigated to a large degree by including factors that predict missing records in the regression analysis. Thus, it is important to understand the degree and sources of missing data. For UMC pastor salaries there are two main worries for systematic error. The first is that the salaries of pastors in less-normative job categories (e.g., part-time local pastors and deacons) are less likely to be recorded. The second is the uncertainties introduced by matching GCFA records to GBOPHB records. I evaluated the sources of missing data in both the GCFA data, which is serving to define the sample frame for the study, and in the Board of Pensions data after it had been matched to the charge assignments of the GCFA. For the purposes of evaluating patterns

Salaries for United Methodist Clergy in the U.S. Context - Quantitative Analysis
Eric B. Johnson, Ph.D. Division of Ordained Ministry
General Board of Higher Education and Ministry The United Methodist Church
www.gbhem.org
Copyright © 2010 by the General Board of Higher Education and Ministry of The United Methodist Church. All rights reserved.
page 31 of 46
of missingness, the years from 1997 to 1999 were excluded. For these years, the GCFA does not maintain a complete record of pastor assignments, thus invalidating any comparison between GCFA and Pensions data. Overall, in the GCFA data, there is no record of an appointment for 8% of charges (table 6). The percentage is highest in 2000 (12%), and decreases steadily to (3%) in 2008, so data are least accurate early in the study period. One sample of these records was compared to a data set that had been checked against the printed version of the General Minutes of the Annual Conferences of The United Methodist Church. In this sample about one-third of the records had no pastor listed in the printed annual report; another third were marginal pastor categories (retired pastors, part-time local pastors, ministers of other denominations, etc.); and the final third were mismatched, mostly because the charge-church alignments did not agree between data sets. Thus, most cases are either legitimately missing or are marginal pastor categories. Beyond the 8% of appointments missing from GCFA data, an additional 15% have no record in GBOPHB data (table 6). However, examining missing records by appointment status suggests that, not surprisingly, the categories most likely to be missing from GBOPHB data are those that often do not have a pension component to compensation: supply pastors, previously retired pastors, and part-time/other local pastors. Consequently, I excluded supply and retired pastors from the sample frame. Part-time/other local pastors were included because their level of missingness, while high, was not so extreme. Once supply and retired pastors were removed from the sample framework, the percentage of missing values decreased to 7% (or approximately 10% of non-missing GFCA records). Most of these missing values are part-time or other local pastors. For pastoral charges that can be matched to GBOPHB pastor data, there are very few missing values (table 6). Most result from the coding decision to remove cases with salaries less than $5,000. This pattern of missing values suggests that missingness is mostly determined by known factors—pastor appointment status and charge-church matching issues. The data is relatively complete for elders and, to a lesser degree, for full-time local pastors, but that values for part-time/other local pastors will have a higher potential for bias. While the salaries of pastors on the margins of the appointment system are of interest, this study cannot provide strong findings for them. The regression coefficients do not change radically when a pastor’s appointment status is included in the analysis (model 3 and 4, table 10), indicating that including part-time/other local pastors is not biasing the results for other categories.

Salaries for United Methodist Clergy in the U.S. Context - Quantitative Analysis
Eric B. Johnson, Ph.D. Division of Ordained Ministry
General Board of Higher Education and Ministry The United Methodist Church
www.gbhem.org
Copyright © 2010 by the General Board of Higher Education and Ministry of The United Methodist Church. All rights reserved.
page 32 of 46
Table 5: Salary Data Missing from Sample
All Sample Pensions Pastors match 6 8 73 87 Pastors do not match 9 10 11 Missing in Pensions Only
15 7 0
Missing in GCFA Only
1 1 1
Missing in Both 7 9 0 N 278267 2 2 250 8 21 70 71
Note: The years 1997–99 are excluded from this table, since the GCFA does not maintain full pastor records in these years. The study sample frame excludes the following job categories based upon GCFA classifications: Pastors who are officially retired, Pastors serving outside of their conference of membership, and Supply pastors.
Table 6: Salary Missing by Category
Pensions GCFA Missing N Missing N Elder 0 150851 4 135 52 4 Full-time Local Pastor
0 2 183 2 11 1 7901
Local Pastor 1 0 3108 7 35 33768 Deacon 22 324 5 9 6 731 Other 3 1 0056 8 6684 Total 2 2 170 71 10 20 062 7
Note: The years 1997–99 are excluded from this table. The “Pensions” column uses category codes from the GBOPHB data for pastoral charges where there is a record of a pastor. The GCFA column shows missingness according to GCFA categories using all records in the sample framework. Note that GCFA and Pensions category designations do not always match up. The local pastor category includes pastors designated as “part-time,” “student,” and “other” local pastors.

Salaries for United Methodist Clergy in the U.S. Context - Quantitative Analysis
Eric B. Johnson, Ph.D. Division of Ordained Ministry
General Board of Higher Education and Ministry The United Methodist Church
www.gbhem.org
Copyright © 2010 by the General Board of Higher Education and Ministry of The United Methodist Church. All rights reserved.
page 33 of 46
B Methods Standard linear regression analysis was used for analyses that pooled conferences together. To capture conference differences, multilevel models were used that allowed intercepts and either the coefficients for gender or race to vary by conference. These models use the natural logarithm of salaries at the outcome. The log transformation is commonly used for dollar amounts because it reduces or eliminates the asymmetry in data that are highly “skewed,” that is, have a few extremely large values. However, when model predictions are placed back on the original scale, they do not match the standard (arithmetic) mean. For skewed data, however, this is actually a plus, since the extreme values inflate the arithmetic mean so that it is greater than the peak of the distribution. Medians are frequently reported when data is skewed, for this reason. The results of returning logged salary values to the original scale can be viewed as a similar strategy to reporting medians. Regression models where the outcome is logged have another attractive property, the exponent of their coefficients gives the proportional, or multiplicative, change in the predicted outcome, that results from a one-unit change in a variable. Percentage changes can be calculated using the formula: When the coefficients are close to 0, 100* coefficient closely approximates the percentage change. This approximation allows the coefficients reported in tables 10 and 11 to be interpreted directly. Input variables were centered and/or scaled as indicated in the codebook. Centering and scaling does not affect the statistical properties of the model, but does alter the interpretation of the coefficients. Centering determines the interpretation of the intercept, which is the value when all predictors are 0. In general continuous values were centered close to mean values. Scaling variables changes the units of analysis (e.g., capturing the change from 10 years of tenure rather than 1 year of tenure). All analyses were conducted using R, with the lmer function used for multilevel models.

Salaries for United Methodist Clergy in the U.S. Context - Quantitative Analysis
Eric B. Johnson, Ph.D. Division of Ordained Ministry
General Board of Higher Education and Ministry The United Methodist Church
www.gbhem.org
Copyright © 2010 by the General Board of Higher Education and Ministry of The United Methodist Church. All rights reserved.
page 34 of 46
C Definition of Terms All definitions taken from the 2008 Book of Discipline. Pastoral Charge
“One or more churches, . . . with a charge conference, and to which an ordained or licensed minister is or may be duly appointed or appointable as pastor in charge or co-pastor.”
Charge Conference “Within the pastoral charge, the basic unit in the connectional system of The United Methodist Church . . . organized from the church or churches in every pastoral charge.”
Local Pastor “Persons not ordained as elders who are appointed to preach and conduct divine worship and perform the duties of a pastor,” who have completed “studies for the license as a local pastors.”
Associate Member A pastor of another denomination.
Bishop “Bishops are elected from the elders and set apart for a ministry of servant leadership, general oversight, and supervision.”
Deacon One of two “Orders” of ministry in The United Methodist Church. “This ministry exemplifies and leads the Church in the servanthood every Christian is called to live both in the church and in the world.”
District Superintendent “District superintendents are elders in full connection appointed by the bishop to the cabinet as an extension of the superintending role of the bishop.”
Elder One of two “Orders” of ministry in The United Methodist Church. This order leads churches “in the celebration of sacraments and the guidance and care of communal life.”

Salaries for United Methodist Clergy in the U.S. Context - Quantitative Analysis
Eric B. Johnson, Ph.D. Division of Ordained Ministry
General Board of Higher Education and Ministry The United Methodist Church
www.gbhem.org
Copyright © 2010 by the General Board of Higher Education and Ministry of The United Methodist Church. All rights reserved.
page 35 of 46
D Descriptive Statistics
Table 7: Descriptive Statistics
Median Mean Std Missing ln (Salary) 10.58 1 0. 54 0 .53 6 52 5.0 0 Has Parsonage 1.00 0 .66 0 .47 3911 .00 Charge Membership 2 7 6 .0 0 540 . 08 902 .32 0 .00 ln (Charge Membership) 0 .10 0 .1 8 1.0 2 0 .0 0 Charge attendance Ratio 0 .43 0 .46 0 .19 0 .00 Budget percentile 0 .50 0 .40 2 .76 0 .00 Number of Cong. in Charge 0 .0 0 0 . 27 0 . 6 3 0 .0 0
Ethic Charge 0 .00 0 .08 0 .26 0 .00 Age 51 .0 0 50 .35 9 .3 8 11 3 .0 0 Seniority 13. 00 14 . 72 11 .2 0 5.0 0 Years in Extensional Ministry
0 . 00 2 .46 5.1 8 0 .0 0
Years in current charge 11 .50 11 . 72 7 .36 0 .00
Associate Pastor 0 .0 0 0 .15 0 . 36 0 .0 0 Reduction from Full-Time 1. 00 0 .94 0 .16 0 .00
Probationary Status 0 .00 0 .11 0 .31 0 .00
Female 0 .0 0 0 .24 0 .4 3 0 .0 0 Nonwhite 0 .00 0 .23 0 .42 0 .00
Missing values calculated from study sample.

Salaries for United Methodist Clergy in the U.S. Context - Quantitative Analysis
Eric B. Johnson, Ph.D. Division of Ordained Ministry
General Board of Higher Education and Ministry The United Methodist Church
www.gbhem.org
Copyright © 2010 by the General Board of Higher Education and Ministry of The United Methodist Church. All rights reserved.
page 36 of 46
Table 8: Bivariate Correlations
1 2 3 4 5 6 7 8
ln(Salary) [1] Year [2] Has Parsonage [3] Charge Membership [4]
ln(Charge Membership) [5]
Charge Attendance Ratio [6]
Budget Percentile [7] Number of Cong. in Charge [8]
Ethic Charge [9]
Age [10]
Seniority [11]
Years in Extensional Ministry [12]
Years in Current Charge [13]
Associate Pastor [14]
Reduction from Full-Time [15]
Probationary Status
0 . 0 90 .07 − 0. 110 . 38 0 . 0 2 − 0.18
0 . 64 0 .0 0 − 0. 03 0 . 73
− 0.1 5 0 .0 0 − 0.13 − 0.21 − 0.38
0 . 31 0 .0 1 − 0. 09 0 .11 0 .09 0 .38− 0.23 0 . 01 0 . 09 − 0.13 − 0.13 0 . 05
− 0.27
− 0.09 0 .00 − 0.13 − 0.06 − 0.16 0 .18− 0.0 2 − 0. 06
0 . 06 0 .1 3 − 0. 0 4 − 0. 0 4 − 0.06 − 0.06− 0.05
0 . 0 2
0 .50 0 .00 0 .11 0 .1 4 0 .32 − 0. 15 0 .1 0− 0.1 5
0 . 28 − 0.17 0 . 04 0 .12 0 . 22 − 0. 12 0 .07− 0. 10
0 .5 2 0 .1 2 0 .1 5 0 .1 0 0 . 29 − 0.12 0 . 09− 0.14
0 . 08 0 . 04 − 0. 25 0 .4 4 0 .4 6 − 0.07 0 .18− 0.09
− 0.60 0 .1 6 − 0. 34 − 0.13 − 0.35 0 .12− 0.1 5
0 .06
− 0. 14 − 0.0 2 0 .0 1 − 0.01 − 0.05 0 .0 1 0 .04

Salaries for United Methodist Clergy in the U.S. Context - Quantitative Analysis
Eric B. Johnson, Ph.D. Division of Ordained Ministry
General Board of Higher Education and Ministry The United Methodist Church
www.gbhem.org
Copyright © 2010 by the General Board of Higher Education and Ministry of The United Methodist Church. All rights reserved.
page 37 of 46
[16]
Female [17] Nonwhite [18]
9 10 11 12 13 14 15 16 17 ln(Salary) [1] Year [2] Has Parsonage [3]
Charge Membership [4]
ln(Charge Membership) [5]
Charge Attendance Ratio [6]
Budget Percentile [7]
Number of Cong. in Charge [8]
Ethic Charge [9] Age [10] Seniority [11] Years in Extensional Ministry [12]
Years in Current Charge [13]
Associate Pastor [14]
Reduction from Full-Time [15]
− 0.0 2
− 0.1 5 0 .07 − 0.10 − 0.01 − 0.06 − 0.05 0 .0 0 0 .0 0
− 0.09 − 0.2 2 − 0. 08 − 0.0 2 − 0.09 0 .08− 0.01 − 0.0 2
0 .02− 0.08 0 .44− 0.06 0 .37 0 .75
− 0.07 0 .35 0 .8 4 0 .33
− 0.0 5 − 0.1 5 − 0.12 − 0.0 4 − 0. 15
0 . 07 0 .0 7 − 0. 2 2 − 0.11 − 0.25 0 .01

Salaries for United Methodist Clergy in the U.S. Context - Quantitative Analysis
Eric B. Johnson, Ph.D. Division of Ordained Ministry
General Board of Higher Education and Ministry The United Methodist Church
www.gbhem.org
Copyright © 2010 by the General Board of Higher Education and Ministry of The United Methodist Church. All rights reserved.
page 38 of 46
Probationary Status [16]
Female [17] Nonwhite [18]
E Model Results
Table 9: Linear Regression Model Results—Overall
m0 m1 m2 m3 m4 m5 Constant 10.91 10.97 10.84 10.84 10.90 10.90 Year 0.02 0.02 0.02 0.02 0.02 0.02 Presence of Parsonage -0.19 -0.20 -0.06 -0.07 -0.12 -0.12 Part-time Status (Full Time Omitted)
Three-Quarter Time -1.00 -0.99 -0.62 -0.55 -0.32 -0.32 Half-Time -1.04 -1.03 -0.70 -0.64 -0.45 -0.45 Quarter-Time -1.55 -1.53 -1.17 -1.11 -0.89 -0.89
Female -0.14 -0.11 -0.04 -0.04 -0.04 Race/Ethnicity (White Omitted)
Black -0.09 0.01 0.02 0.01 0.02 Asian -0.05 0.02 0.07 0.05 0.05 Hispanic/Latino -0.16 -0.04 -0.02 0.01 0.01 Other -0.15 -0.06 -0.04 -0.01 -0.01
Log of Membership 0.29 0.26 0.31 0.31 Log of Membership
2 -0.05 -0.04 -0.02 -0.02
Number of Congregations in Charge
-0.07 -0.05 -0.04 -0.04
Budget (Decile of Dollars per Member)
0.03 0.03 0.03 0.03
Location (Urban Omitted) Suburban -0.04 -0.02 -0.02 -0.02 Large-Town -0.05 -0.03 -0.02 -0.02
0 . 0 0 − 0.2 9 − 0. 3 4 − 0. 16 − 0. 36 0 .09 − 0. 06
− 0.01 − 0.01 − 0.29 − 0. 21 − 0.27 0 .1 4 0 .09 0 .110 .49 − 0.03 − 0. 10 − 0.02 − 0. 13 0 . 09 0 .02 0 . 06 0 .01
Missing values excluded for each bivariate pair.

Salaries for United Methodist Clergy in the U.S. Context - Quantitative Analysis
Eric B. Johnson, Ph.D. Division of Ordained Ministry
General Board of Higher Education and Ministry The United Methodist Church
www.gbhem.org
Copyright © 2010 by the General Board of Higher Education and Ministry of The United Methodist Church. All rights reserved.
page 39 of 46
Rural -0.04 -0.03 -0.02 -0.02 Time as UMC Pastor (10s of Years)
0.13 0.06 0.06
Time as UMC Pastor2
-0.03 -0.01 -0.01 Associate Pastor -0.35 -0.35 Probationary Status -0.05 -0.05
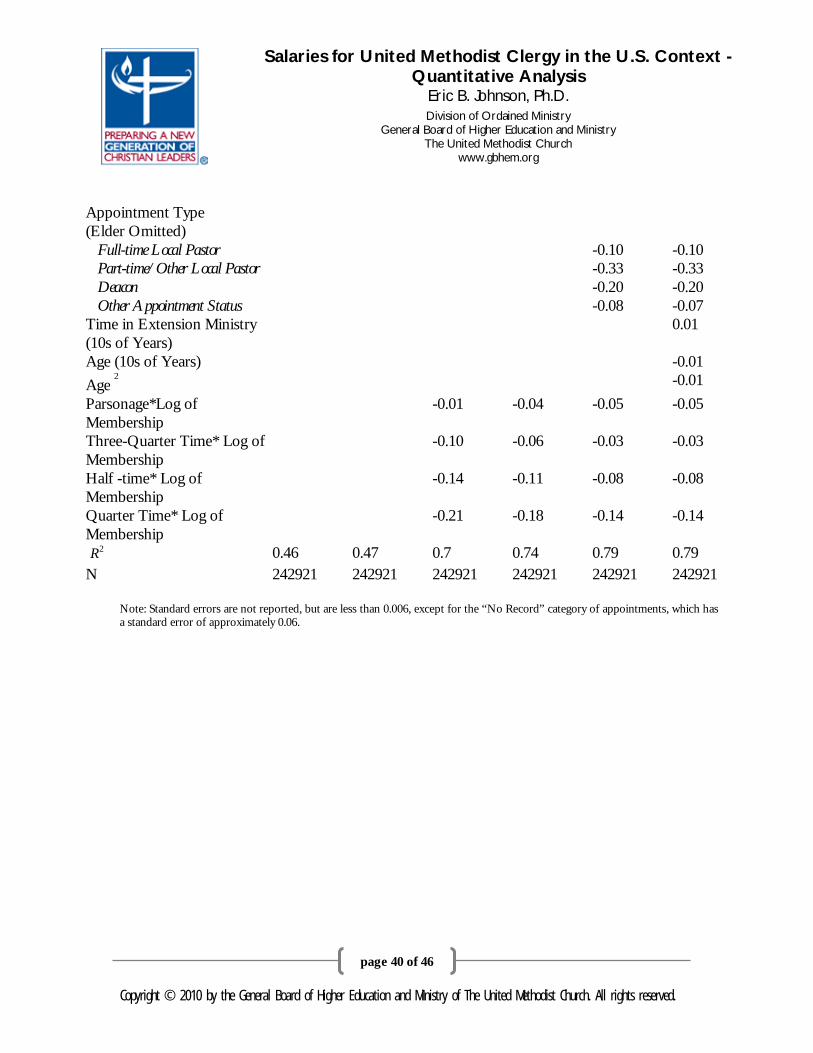
Salaries for United Methodist Clergy in the U.S. Context - Quantitative Analysis
Eric B. Johnson, Ph.D. Division of Ordained Ministry
General Board of Higher Education and Ministry The United Methodist Church
www.gbhem.org
Copyright © 2010 by the General Board of Higher Education and Ministry of The United Methodist Church. All rights reserved.
page 40 of 46
Appointment Type (Elder Omitted)
Full-time Local Pastor -0.10 -0.10 Part-time/Other Local Pastor -0.33 -0.33 Deacon -0.20 -0.20 Other Appointment Status -0.08 -0.07
Time in Extension Ministry (10s of Years)
0.01
Age (10s of Years) -0.01 Age
2 -0.01
Parsonage*Log of Membership
-0.01 -0.04 -0.05 -0.05
Three-Quarter Time* Log of Membership
-0.10 -0.06 -0.03 -0.03
Half -time* Log of Membership
-0.14 -0.11 -0.08 -0.08
Quarter Time* Log of Membership
-0.21 -0.18 -0.14 -0.14
R2 0.46 0.47 0.7 0.74 0.79 0.79
N 242921 242921 242921 242921 242921 242921 Note: Standard errors are not reported, but are less than 0.006, except for the “No Record” category of appointments, which has a standard error of approximately 0.06.
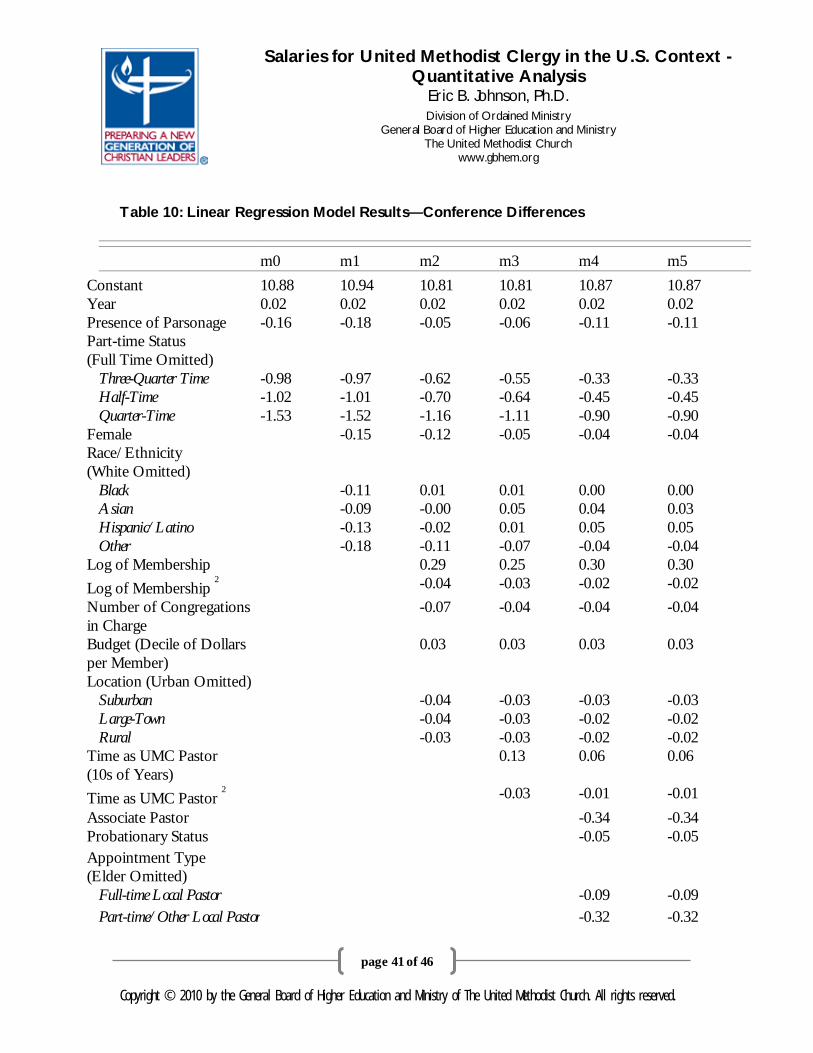
Salaries for United Methodist Clergy in the U.S. Context - Quantitative Analysis
Eric B. Johnson, Ph.D. Division of Ordained Ministry
General Board of Higher Education and Ministry The United Methodist Church
www.gbhem.org
Copyright © 2010 by the General Board of Higher Education and Ministry of The United Methodist Church. All rights reserved.
page 41 of 46
Table 10: Linear Regression Model Results—Conference Differences
m0 m1 m2 m3 m4 m5 Constant 10.88 10.94 10.81 10.81 10.87 10.87 Year 0.02 0.02 0.02 0.02 0.02 0.02 Presence of Parsonage -0.16 -0.18 -0.05 -0.06 -0.11 -0.11 Part-time Status (Full Time Omitted)
Three-Quarter Time -0.98 -0.97 -0.62 -0.55 -0.33 -0.33 Half-Time -1.02 -1.01 -0.70 -0.64 -0.45 -0.45 Quarter-Time -1.53 -1.52 -1.16 -1.11 -0.90 -0.90
Female -0.15 -0.12 -0.05 -0.04 -0.04 Race/Ethnicity (White Omitted)
Black -0.11 0.01 0.01 0.00 0.00 Asian -0.09 -0.00 0.05 0.04 0.03 Hispanic/Latino -0.13 -0.02 0.01 0.05 0.05 Other -0.18 -0.11 -0.07 -0.04 -0.04
Log of Membership 0.29 0.25 0.30 0.30 Log of Membership
2 -0.04 -0.03 -0.02 -0.02
Number of Congregations in Charge
-0.07 -0.04 -0.04 -0.04
Budget (Decile of Dollars per Member)
0.03 0.03 0.03 0.03
Location (Urban Omitted) Suburban -0.04 -0.03 -0.03 -0.03 Large-Town -0.04 -0.03 -0.02 -0.02 Rural -0.03 -0.03 -0.02 -0.02
Time as UMC Pastor (10s of Years)
0.13 0.06 0.06
Time as UMC Pastor2
-0.03 -0.01 -0.01 Associate Pastor -0.34 -0.34 Probationary Status -0.05 -0.05 Appointment Type (Elder Omitted)
Full-time Local Pastor -0.09 -0.09 Part-time/Other Local Pastor -0.32 -0.32
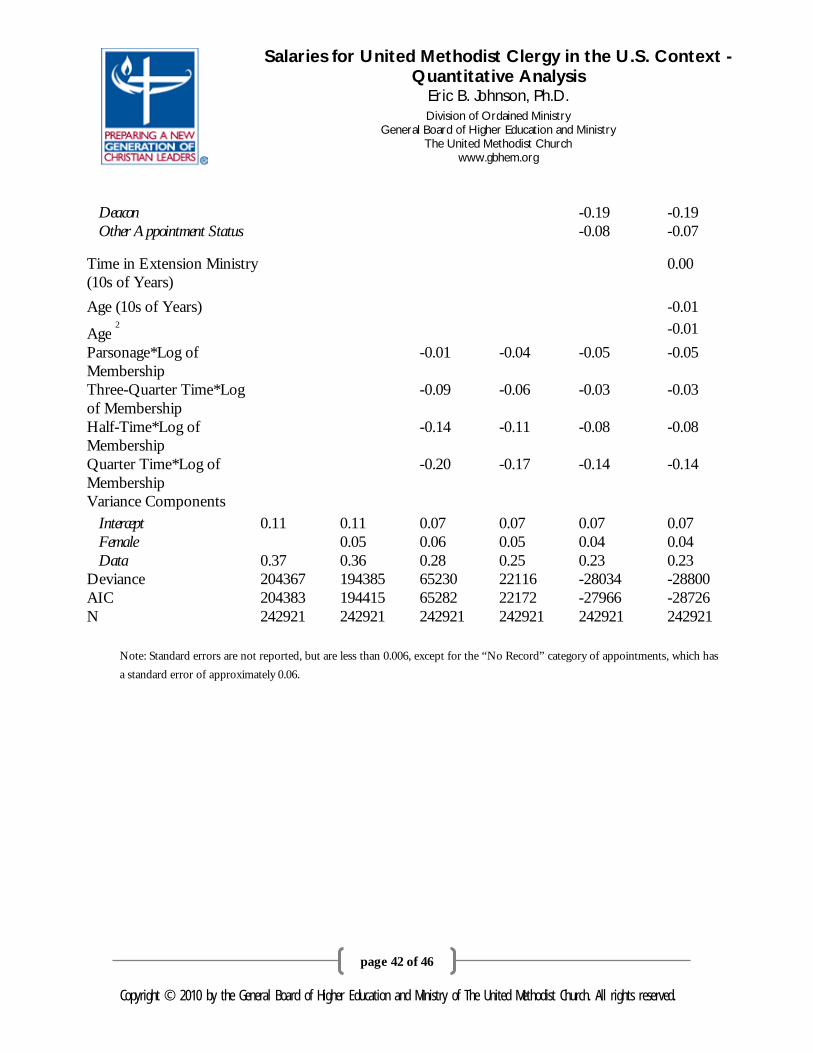
Salaries for United Methodist Clergy in the U.S. Context - Quantitative Analysis
Eric B. Johnson, Ph.D. Division of Ordained Ministry
General Board of Higher Education and Ministry The United Methodist Church
www.gbhem.org
Copyright © 2010 by the General Board of Higher Education and Ministry of The United Methodist Church. All rights reserved.
page 42 of 46
Deacon -0.19 -0.19 Other Appointment Status -0.08 -0.07
Time in Extension Ministry (10s of Years)
0.00
Age (10s of Years) -0.01
Age2
-0.01 Parsonage*Log of Membership
-0.01 -0.04 -0.05 -0.05
Three-Quarter Time*Log of Membership
-0.09 -0.06 -0.03 -0.03
Half-Time*Log of Membership
-0.14 -0.11 -0.08 -0.08
Quarter Time*Log of Membership
-0.20 -0.17 -0.14 -0.14
Variance Components Intercept 0.11 0.11 0.07 0.07 0.07 0.07 Female 0.05 0.06 0.05 0.04 0.04 Data 0.37 0.36 0.28 0.25 0.23 0.23
Deviance 204367 194385 65230 22116 -28034 -28800 AIC 204383 194415 65282 22172 -27966 -28726 N 242921 242921 242921 242921 242921 242921
Note: Standard errors are not reported, but are less than 0.006, except for the “No Record” category of appointments, which has a standard error of approximately 0.06.

Salaries for United Methodist Clergy in the U.S. Context - Quantitative Analysis
Eric B. Johnson, Ph.D. Division of Ordained Ministry
General Board of Higher Education and Ministry The United Methodist Church
www.gbhem.org
Copyright © 2010 by the General Board of Higher Education and Ministry of The United Methodist Church. All rights reserved.
page 43 of 46
Table 11: Linear Regression Model Results—Conference Differences, Race
m0 m1 m2 m3 m4 m5 Constant 10.88 10.94 10.81 10.82 10.88 10.88 Year 0.02 0.02 0.02 0.02 0.02 0.02 Presence of Parsonage -0.16 -0.18 -0.05 -0.07 -0.11 -0.11 Part-time Status (Full Time Omitted)
Three- Quarter Time -0.98 -0.97 -0.62 -0.55 -0.33 -0.33 Half-Time -1.02 -1.00 -0.70 -0.64 -0.45 -0.45 Quarter-Time -1.53 -1.52 -1.17 -1.11 -0.90 -0.90
Female -0.15 -0.13 -0.05 -0.04 -0.04 Log of Membership 0.29 0.25 0.30 0.30 Log of Membership
2 -0.04 -0.03 -0.02 -0.02
Number of Congregations in Charge
-0.06 -0.04 -0.04 -0.04
Budget (Decile of Dollars per Member)
0.03 0.03 0.03 0.03
Location (Urban Omitted) Suburban -0.04 -0.03 -0.03 -0.03 Large-Town -0.04 -0.03 -0.02 -0.02 Rural -0.03 -0.03 -0.02 -0.02
Time as UMC Pastor (10s of Years)
0.13 0.06 0.06
Time as UMC Pastor2
-0.03 -0.01 -0.01 Associate Pastor -0.34 -0.34 Probationary Status -0.05 -0.05 Appointment Type (Elder Omitted)
Full-time Local Pastor -0.09 -0.09 Part-time/Other Local Pastor -0.32 -0.32 Deacon -0.20 -0.19 Other Appointment Status -0.07 -0.07
Time in Extension Ministry (10s of Years)
0.00
Age (10s of Years) -0.01

Salaries for United Methodist Clergy in the U.S. Context - Quantitative Analysis
Eric B. Johnson, Ph.D. Division of Ordained Ministry
General Board of Higher Education and Ministry The United Methodist Church
www.gbhem.org
Copyright © 2010 by the General Board of Higher Education and Ministry of The United Methodist Church. All rights reserved.
page 44 of 46
Age2
-0.01 Pastor Not White/Asian -0.09 0.00 0.02 0.02 0.02 Parsonage*Log of Membership
-0.01 -0.04 -0.05 -0.05
Three-Quarter- Time*Log of Membership
-0.09 -0.06 -0.03 -0.03
Half-Time*Log of Membership
-0.14 -0.11 -0.07 -0.07
Quarter-Time*Log of Membership
-0.20 -0.17 -0.13 -0.14
Variance Components Intercept 0.11 0.1 0.07 0.06 0.06 0.06 Non-White/Asian 0.12 0.08 0.08 0.08 0.08 Data 0.37 0.36 0.28 0.25 0.23 0.23
Deviance 204367 193647 65545 21928 -28545 -29340 AIC 204383 193671 65591 21978 -28483 -29272 N 242921 242921 242921 242921 242921 242921
Note: Standard errors are not reported, but are less than 0.006, except for the “No Record” category of appointments, which has a standard error of approximately 0.06.

Salaries for United Methodist Clergy in the U.S. Context - Quantitative Analysis
Eric B. Johnson, Ph.D. Division of Ordained Ministry
General Board of Higher Education and Ministry The United Methodist Church
www.gbhem.org
Copyright © 2010 by the General Board of Higher Education and Ministry of The United Methodist Church. All rights reserved.
page 45 of 46
Codebook Variables Item Variable Source Description Charge Number charge GCFA For single-congregation charges: same as
Church Number. For multiple congregation charges: the Church Number of one congregation. Note that this congregation is not necessarily stable over time.
Year year GCFA Centered on 2008 in the models (year-2008). Note: Congregational statistics are for the duration of the calendar year. Pastor statistics are for the people who are pastors at the end of the year.
Start Date start GCFA/BOP Recorded date in which appointment started. Format: MMDD.
Conference conf GCFA Conference of largest congregation in charge.
District dist GCFA District of largest congregation in charge.
State state GCFA State of largest congregation in charge.
County county GCFA County of largest congregation in charge.
Census Tract censustract GCFA Census tract of largest congregation in charge.
Number in Charge chrg.n GCFA Number of additional congregations in charge beyond 1.
Charge Membership chrg.mem2 GCFA Sum total reported membership of charge. Included in regression models as the natural logarithm, centered around 250 members, ln(chrg.mem2) – ln(250) .
Charge Attendance Ratio chrg.att.rat GCFA The sum of attendance divided by charge membership. Included in regression models in units of attendees per 10 members, centered around the mean value of 5 attendees per 10 members.
Charge Budget chrg.budget GCFA The sum of total reported operating budget

Salaries for United Methodist Clergy in the U.S. Context - Quantitative Analysis
Eric B. Johnson, Ph.D. Division of Ordained Ministry
General Board of Higher Education and Ministry The United Methodist Church
www.gbhem.org
Copyright © 2010 by the General Board of Higher Education and Ministry of The United Methodist Church. All rights reserved.
page 46 of 46
in 2008 dollars Budget Decile pctl.budg GCFA The percentile of the reported operating
budget per member relative to other charges, on a decile scale.
Charge Proportion chrg.p.lrg GCFA The proportion of local church members that are not in the largest congregation in the charge, (i.e. 0 for all single congregation charges).
Charge Ethnic Proportion chrg.ethnic GCFA Proportion of charge membership within an “ethnic” congregation (one reporting 40% or greater nonwhite membership). 1 for ethnic single-congregation charges.
Location urban GCFA Urban, Suburban, Large-Town, and Rural. These designations were assigned based on census tract, using Rural Urban Commuting Area designations, www.ers.usda.gov/Data/RuralUrbanCommutingAreaCodes/. The four-tier classification is based on a suggested simplification of RUCA codes given at depts.washington.edu/uwruca/ruca-uses.php.
GCFA Pastor Identifier g.labelid GCFA GBOPHB Pastor Identifier g.partno GCFA GBOPHB identfier for pastors. Age age GBOPHB Included in the regression model in units of
10 years, centered around the mean value of 50 years.
Gender GBOPHB 1 for female, and 0 for male. Race/Ethnicity GCFA White, Black, Asian, Hispanic/Latino, and
Other. The Other category includes Native Americans, Pacific Islanders, and Multiracial designations.
Service ID g.service_id GBOPHB Appointment identifier from GBOPHB. Year Appointment Started g.sp.y0 GCFA Year Appointment Ended g.sp.yl GCFA Time in Appointment g.dur GCFA Years in current appointment, 0 if arrived in
the current year.
Salaries for United Methodist Clergy in the U.S. Context - Quantitative Analysis
Eric B. Johnson, Ph.D. Division of Ordained Ministry
General Board of Higher Education and Ministry The United Methodist Church
www.gbhem.org
Copyright © 2010 by the General Board of Higher Education and Ministry of The United Methodist Church. All rights reserved.
page 47 of 46
Associate Pastor ap GCFA Whether this individual is an associate pastor.
Detailed Appointment Category
p.status GBOPHB
Appointment Category p.app.cat GBOPHB Elder, Deacon, Full-time Local Pastor, Part-time/Other Local Pastor, and Other. The Other category is predominately Associate Members and Supply pastors.
Level probationary GBOPHB 1 is a pastor who holds “probationary” or “student” status, 0 otherwise. Whether the person holds full, probationary, or student status.
Part-time parttime.f GBOPHB Coded as:Full-Time,Three-Quarter- Time, Half-Time, and Quarter -ime
Salary Start Date s.begdate GBOPHB Date in which current salary began. Salary p.sal2 GBOPHB The salary level recorded by the GBOPHB
at the end of the current time period. Includes the amount recorded under housing exclusion. Adjusted to 2008 dollars using the CPI.
Housing Allowance p.hous GBOPHB The amount paid for a pastor’s housing allowance. Adjusted to 2008 dollars using the CPI.
Parsonage p.parson GBOPHB Indicator: Pastor is staying in a parsonage. Housing payments of 0 will be the only consistent estimator.
Total Salary sal GBOPHB p.sal2+p.hous Seniority dur GBOPHB Years since first appointment to a charge.
Included in the regression model in units of 10 years, centered around the mean of 15 years seniority.
Number of Previous Appointments
cng.n GBOPHB Number of recorded appointments to local churches within the UMC
Extensional Appointments ext.dur GBOPHB Years spent in extensional ministry. Included in the regression model in units of 10 years.