saifuddin n. zoomkawala muneer r. bhimjee ali raza siddiqui hasanali abdullah heinz walter dollberg...
TRANSCRIPT


Company Information 03
Directors’ Review 04
Directors’ Review (Urdu) 05
Condensed Interim Balance Sheet 06
Condensed Interim Profit & Loss Account 08
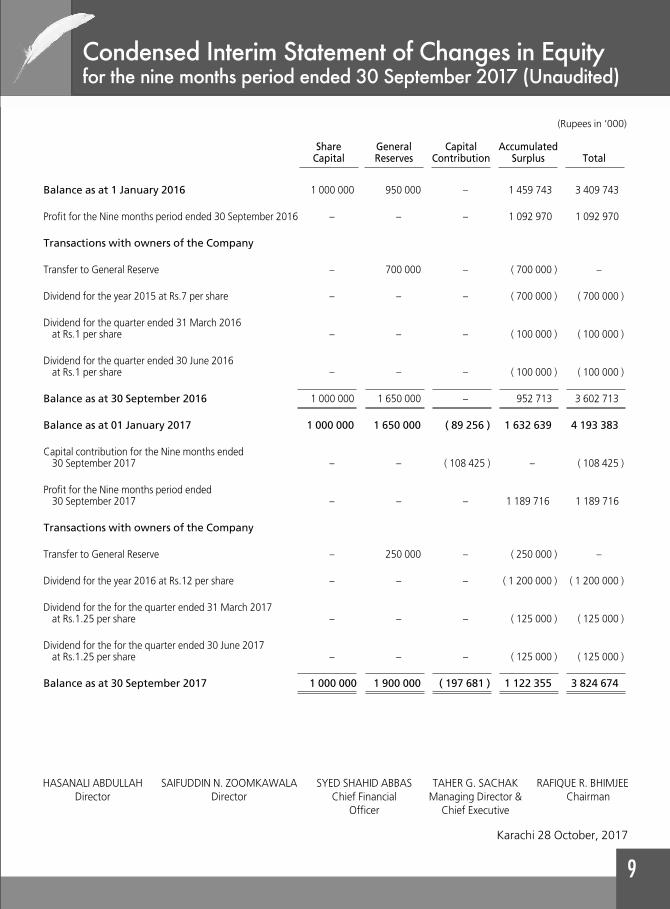
Condensed Interim Statement of Changes in Equity 09
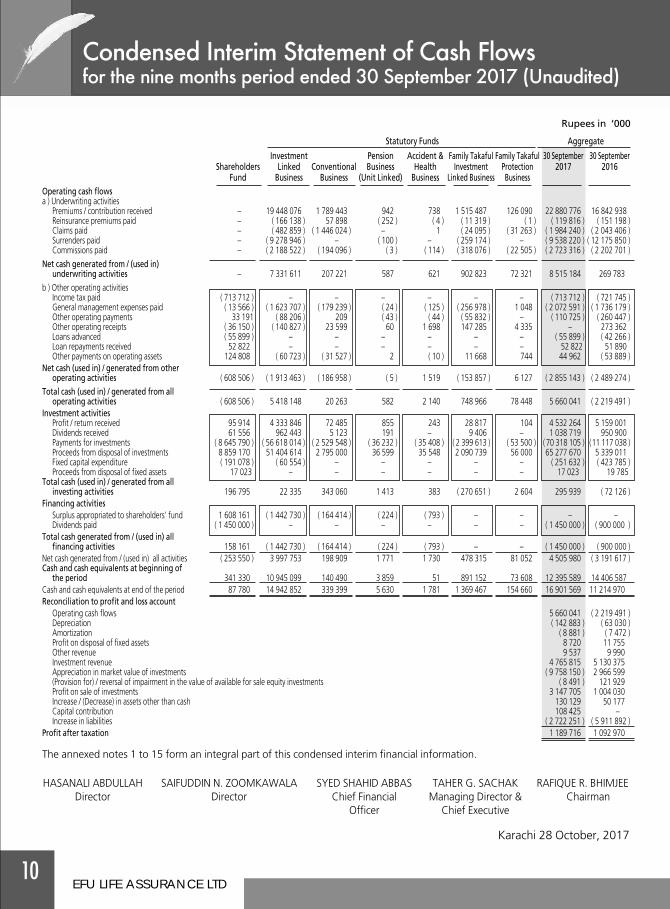
Condensed Interim Statement of Cash Flows 10
Condensed Interim Revenue Account 11
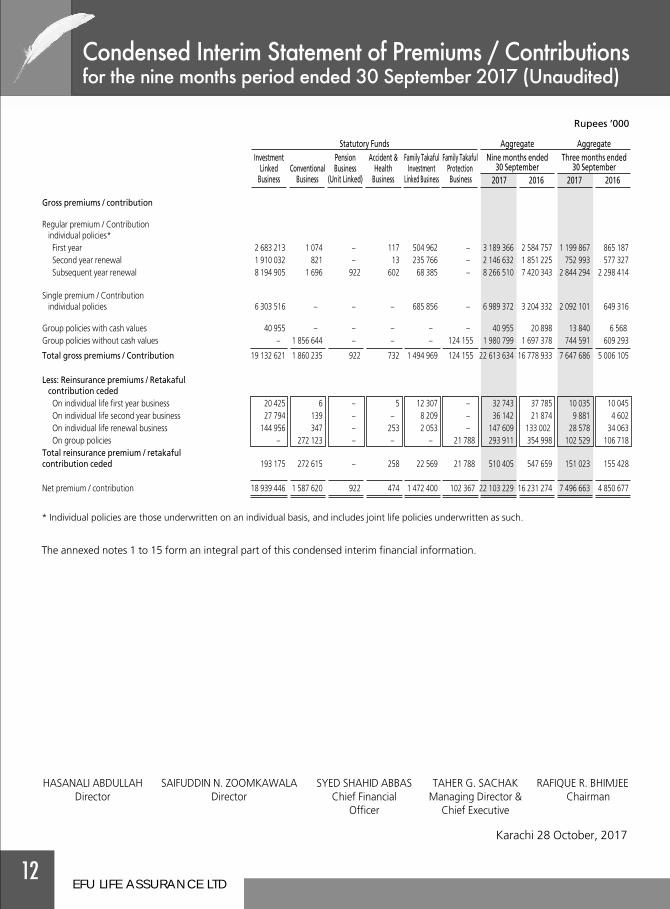
Condensed Interim Statement of Premiums 12
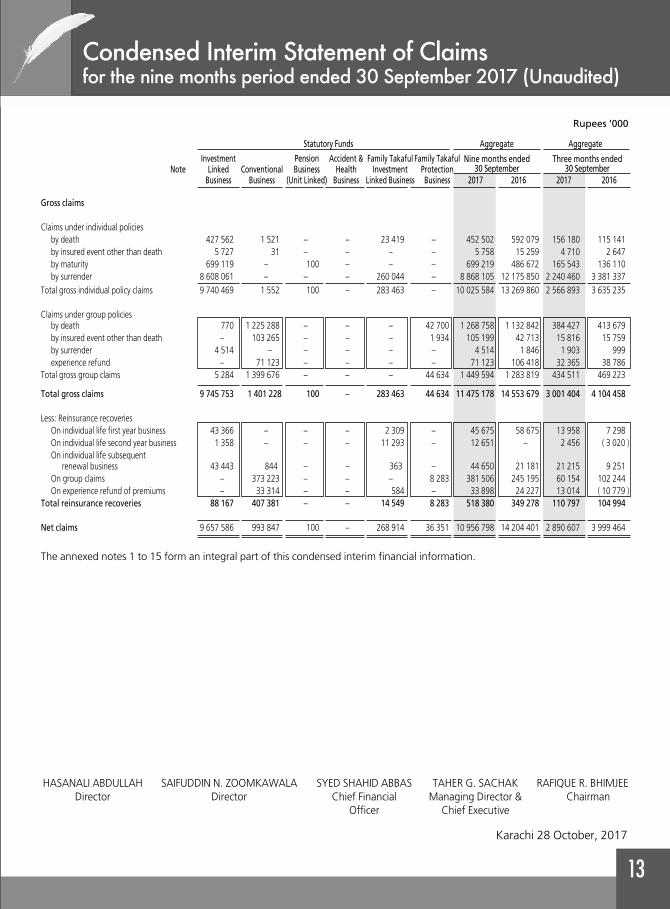
Condensed Interim Statement of Claims 13
Condensed Interim Statement of Expenses 14
Condensed Interim Statement of Investment Income 15
Notes to the Condensed Interim Financial Statements 16
EFU LIFE ASSURANCE LTD
ChairmanRafique R. Bhimjee
Managing Director& Chief ExecutiveTaher G. Sachak
DirectorsSaifuddin N. ZoomkawalaMuneer R. BhimjeeAli Raza SiddiquiHasanali AbdullahHeinz Walter DollbergKamal AfsarSyed Salman Rashid
Corporate SecretaryS. Shahid Abbas
Appointed ActuaryOmer MorshedF.C.A., F.P.S.A., F.I.A.
Legal AdvisorMohammad Ali Sayeed, M.A.B.L.
AuditorsKPMG Taseer Hadi & Co.Chartered Accountants, Karachi
Shariah AdvisorMufti Muhammad Ibrahim Essa
RatingRating Agency: JCR-VISInsurer Financial Strength Rating: AA+Outlook: Stable
RegistrarTechnology Trade (Pvt.) Ltd.Dagia House 241-CBlock-2, P.E.C.H.S.Off Shahrah-e-QuaideenKarachi.Ph: (92-21) 34391316-17 & 19, 34387960-61Fax: (92-21) 34391318
Website:www.efulife.com
Registered OfficeAl-Malik Centre70 W, F-7/G-7Jinnah Avenue, (Blue Area)Islamabad.
Main OfficeEFU Life House,Plot No.112, 8th East StreetPhase 1, DHA, Karachi.

EFU LIFE ASSURANCE LTD
The Directors of your Company are pleased to present the Condensed Interim Financial Statements (Un-audited) forthe nine months ended 30 September 2017.
Your Company's total premium income was Rs. 22.61 Billion (2016: Rs. 16.78 Billion) during the first nine monthsof 2017, a growth of 35%. New individual life regular premium income was Rs. 3.19 Billion (2016: Rs.2.58 Billion),an increase of 23.4%. Renewal premium was Rs. 10.41 Billion (2016: Rs. 9.27 billion) an increase of 12.3%. Inclusiveof renewal premium, the total individual life regular premium business increased by 14.7% to Rs. 13.62 Billion (2016:Rs. 11.86 billion). Group Benefits business increased by 16.7% at Rs. 2.02 Billion (2016: Rs. 1.72 billion).
Your company had launched its window takaful operations under a dedicated brand name “Hemayah” in February2015. The total family takaful business was Rs.1.62 Billion (2016: 1.33 billion), a growth of 22%. Out of this, Rs. 1.49Billion (2016: Rs.1.29 Billion) was from Takaful Investment Linked Business, while Rs.124 Million (2016: Rs.31 Million)was from Takaful Protection Business. The Company expects this line of business to grow further during the nextfew years.
Your Company had a Profit after Tax of Rs. 1.19 Billion (2016: Rs. 1.09 Billion). The Earnings per Share is Rs. 11.90(2016: Rs. 10.92).
The Directors have pleasure in declaring 3rd Interim Dividend of Rs.1.25/- per share. i.e. 12.5% . This cash dividendis in addition to Interim Cash Dividend of Rs.2.50/- per share i.e. 25% already declared and paid during the year 2017.
Your Directors would like to place on record their appreciation for the contributions made by the EFU Life Head Officeteam and all distribution channels towards the development and growth of the Company. We would also like tothank the Securities and Exchange Commission of Pakistan for its guidance, and our main reinsurer Munich Re forits continuous support. Last but not least we would like to thank all our clients for their continued confidence inthe Company.
Karachi 28 October, 2017
HASANALI ABDULLAH SAIFUDDIN N. ZOOMKAWALA TAHER G. SACHAK RAFIQUE R. BHIMJEEDirector Director Managing Director & Chairman
Chief Executive

EFU LIFE ASSURANCE LTD
The annexed notes 1 to 15 form an integral part of this condensed interim financial information.
Rupees in ‘000
Statutory Funds Aggregate
Investment Pension Accident & Family Takaful Family Takaful 30 September 31 DecemberNote Shareholders Linked Conventional Business Health Investment Protection 2017 2016
Fund Business Business (Unit Linked) Business Linked Business Business Unaudited Audited
Share capital and reserves
Authorised share capital
[150 000 000 ordinary shares (2016: 150 000 000) of Rs.10 each] 1 500 000 – – – – – – 1 500 000 1 500 000
Issued, subscribed and paid-up share capital
15 000 000 Ordinary Shares (2016:15 000 000) of Rs 10/- each issued as
fully paid in cash 150 000 – – – – – – 150 000 150 00085 000 000 Ordinary Shares (2016:85 000 000) of Rs 10/- each issued as
fully paid as bonus shares 850 000 – – – – – – 850 000 850 000
1 000 000 – – – – – – 1 000 000 1 000 000
Accumulated surplus 924 674 – – – – – – 924 674 1 543 383General reserves 1 900 000 – – – – – – 1 900 000 1 650 000Net shareholders' equity 3 824 674 – – – – – – 3 824 674 4 193 383
Balance of statutory fund[including policyholders'liabilities Rs. 98 700 million(2016: Rs. 95 869 million)
Statutory fund 6 – 97 394 711 1 168 261 26 203 1 854 2 065 603 66 915 100 723 547 97 774 373Cede Money-Waqf – – – – – 2 000 – 2 000 2 000Shareholder's Fund unit holding in PIF – – – – – 5 695 – 5 695 5 690
– 97 394 711 1 168 261 26 203 1 854 2 073 298 66 915 100 731 242 97 782 063
Deferred tax liability 133 900 – – – – – – 133 900 131 000
Creditors and accrualsOutstanding claims – 818 938 802 227 – 1 346 6 222 16 702 1 645 435 1 692 717Premiums / Contribution received in advance – 790 700 33 507 35 28 41 056 13 194 878 520 575 806Amounts due to reinsurers / retakaful – 10 267 15 048 – – 6 167 25 263 56 745 148 023Amounts due to agents – 347 527 14 442 15 12 50 292 2 217 414 505 556 464Accrued expenses – 263 159 13 602 4 7 12 500 12 501 301 773 411 528Unclaimed dividend 21 223 – – – – – – 21 223 22 047Other creditors and accruals 46 043 105 357 6 098 – 13 78 214 25 000 260 725 371 455Inter-fund payable – 343 942 31 820 1 735 4 158 – 4 676 386 331 417 045
Total liabilities 67 266 2 679 890 916 744 1 789 5 564 194 451 99 553 3 965 257 4 195 085
Contingencies and commitments 8
Total equity and liabilities 4 025 840 100 074 601 2 085 005 27 992 7 418 2 267 749 166 468 108 655 073 106 301 531
Karachi 28 October, 2017
The annexed notes 1 to 15 form an integral part of this condensed interim financial information.
Rupees in ‘000
Statutory Funds Aggregate
Investment Pension Accident & Family Takaful Family Takaful 30 September 31 DecemberNote Shareholders Linked Conventional Business Health Investment Protection 2017 2016
Fund Business Business (Unit Linked) Business Linked Business Business Unaudited Audited
Cash and bank depositsPolicy stamps in hand – 9 437 105 – – 258 – 9 800 4 379
Current and other accounts 87 780 4 458 415 314 194 5 630 1 781 348 209 136 660 5 352 669 3 033 110
Deposits maturing within 12 months – 10 475 000 25 100 – – 1 021 000 18 000 11 539 100 9 358 100
87 780 14 942 852 339 399 5 630 1 781 1 369 467 154 660 16 901 569 12 395 589
LoansTo employees - secured 84 750 – – – – – – 84 750 80 918
To employees and agents - unsecured 10 239 – – – – – – 10 239 10 994
94 989 – – – – – – 94 989 91 912
Investments 7
Government securities 1 423 305 47 406 082 1 347 273 15 506 5 355 140 836 – 50 338 357 48 870 068
Other fixed income securities – 932 548 – – – – – 932 548 1 575 511
Listed equities and mutual funds 962 300 34 195 284 110 116 6 777 261 706 531 – 35 981 269 38 385 096
Unlisted equities 508 – – – – – – 508 508
2 386 113 82 533 914 1 457 389 22 283 5 616 847 367 – 87 252 682 88 831 183
Current assets - othersPremiums due but unpaid – – 116 657 – – – 10 944 127 601 92 029
Amounts due from reinsurers – 223 124 802 – – – – 125 025 75 757
Prepayments – 35 333 1 068 1 4 2 815 – 39 221 36 280
Sundry receivables 50 000 71 881 4 377 1 7 5 969 – 132 235 208 871
Investment income accrued 3 026 966 435 3 264 74 – 14 089 114 987 002 1 782 633
Shareholders' Fund unit holding in PIF – – – – – 5 695 – 5 695 5 690
Taxation - provision less payments 175 970 – – – – 647 645 177 262 58 550
Advances and deposits 10 500 130 730 38 049 3 10 107 105 179 504 151 600
Inter-fund receivable 364 738 – – – – 21 593 386 331 417 045
604 234 1 204 602 288 217 79 21 50 915 11 808 2 159 876 2 828 455
Fixed assets 9
Tangible assets
Leased hold land – 126 505 – – – – – 126 505 126 505
Building – 1 266 728 – – – – – 1 266 728 1 254 115
Furniture fixtures officeequipment and vehicles 838 217 – – – – – – 838 217 752 127
Intangible assetsComputer software 14 507 – – – – – – 14 507 21 645
852 724 1 393 233 – – – – – 2 245 957 2 154 392
Total assets 4 025 840 100 074 601 2 085 005 27 992 7 418 2 267 749 166 468 108 655 073 106 301 531
HASANALI ABDULLAH SAIFUDDIN N. ZOOMKAWALA SYED SHAHID ABBAS TAHER G. SACHAK RAFIQUE R. BHIMJEEDirector Director Chief Financial Managing Director & Chairman
Officer Chief Executive

EFU LIFE ASSURANCE LTD
Karachi 28 October, 2017
Rupees ‘000
Nine months ended Three months endedNote 30 September 30 September
2017 2016 2017 2016
The annexed notes 1 to 15 form an integral part of this condensed interim financial information.
Investment income not attributable to statutory funds
Return on government securities 66 596 84 406 22 386 22 442
Return on other fixed income securities and deposits 14 041 15 524 1 597 1 674
Dividend income 61 556 41 078 9 184 8 004
142 193 141 008 33 167 32 120
Profit on sale of Investments 35 924 – 35 924 –
(Provision for) / Reversal of impairment in the valueof available for sale investments ( 7 140 ) 119 225 23 054 99 572
Net investment income 170 977 260 233 92 145 131 692
Other revenue 18 257 21 745 5 988 7 302
189 234 281 978 98 133 138 994
Expenses not attributable to statutory funds ( 9 779 ) ( 38 853 ) ( 3 724 ) ( 11 807 )
179 455 243 125 94 409 127 187
Surplus transferred from statutory funds 1 608 161 1 439 045 494 404 457 640
Profit before tax for the period 1 787 616 1 682 170 588 813 584 827
Taxation 10 ( 597 900 ) ( 589 200 ) ( 172 900 ) ( 184 650 )
Profit after tax for the period 1 189 716 1 092 970 415 913 400 177
(Rupees)
Earnings per share - basic and diluted 11.90 10.93 4.16 4.00
HASANALI ABDULLAH SAIFUDDIN N. ZOOMKAWALA SYED SHAHID ABBAS TAHER G. SACHAK RAFIQUE R. BHIMJEEDirector Director Chief Financial Managing Director & Chairman
Officer Chief Executive
Karachi 28 October, 2017
(Rupees in ‘000)
GeneralReserves
CapitalContribution
AccumulatedSurplus Total
ShareCapital
Balance as at 1 January 2016 1 000 000 950 000 – 1 459 743 3 409 743
Profit for the Nine months period ended 30 September 2016 – – – 1 092 970 1 092 970
Transactions with owners of the Company
Transfer to General Reserve – 700 000 – ( 700 000 ) –
Dividend for the year 2015 at Rs.7 per share – – – ( 700 000 ) ( 700 000 )
Dividend for the quarter ended 31 March 2016at Rs.1 per share – – – ( 100 000 ) ( 100 000 )
Dividend for the quarter ended 30 June 2016at Rs.1 per share – – – ( 100 000 ) ( 100 000 )
Balance as at 30 September 2016 1 000 000 1 650 000 – 952 713 3 602 713
Balance as at 01 January 2017 1 000 000 1 650 000 ( 89 256 ) 1 632 639 4 193 383
Capital contribution for the Nine months ended30 September 2017 – – ( 108 425 ) – ( 108 425 )
Profit for the Nine months period ended30 September 2017 – – – 1 189 716 1 189 716
Transactions with owners of the Company
Transfer to General Reserve – 250 000 – ( 250 000 ) –
Dividend for the year 2016 at Rs.12 per share – – – ( 1 200 000 ) ( 1 200 000 )
Dividend for the for the quarter ended 31 March 2017at Rs.1.25 per share – – – ( 125 000 ) ( 125 000 )
Dividend for the for the quarter ended 30 June 2017at Rs.1.25 per share – – – ( 125 000 ) ( 125 000 )
Balance as at 30 September 2017 1 000 000 1 900 000 ( 197 681 ) 1 122 355 3 824 674
HASANALI ABDULLAH SAIFUDDIN N. ZOOMKAWALA SYED SHAHID ABBAS TAHER G. SACHAK RAFIQUE R. BHIMJEEDirector Director Chief Financial Managing Director & Chairman
Officer Chief Executive
EFU LIFE ASSURANCE LTD
Karachi 28 October, 2017
The annexed notes 1 to 15 form an integral part of this condensed interim financial information.
Rupees in ‘000
Statutory Funds Aggregate
Investment Pension Accident & Family Takaful Family Takaful 30 September 30 SeptemberShareholders Linked Conventional Business Health Investment Protection 2017 2016
Fund Business Business (Unit Linked) Business Linked Business BusinessOperating cash flowsa ) Underwriting activities
Premiums / contribution received – 19 448 076 1 789 443 942 738 1 515 487 126 090 22 880 776 16 842 938Reinsurance premiums paid – ( 166 138 ) 57 898 ( 252 ) ( 4 ) ( 11 319 ) ( 1 ) ( 119 816 ) ( 151 198 )Claims paid – ( 482 859 ) ( 1 446 024 ) – 1 ( 24 095 ) ( 31 263 ) ( 1 984 240 ) ( 2 043 406 )Surrenders paid – ( 9 278 946 ) – ( 100 ) – ( 259 174 ) – ( 9 538 220 ) ( 12 175 850 )Commissions paid – ( 2 188 522 ) ( 194 096 ) ( 3 ) ( 114 ) ( 318 076 ) ( 22 505 ) ( 2 723 316 ) ( 2 202 701 )
Net cash generated from / (used in)underwriting activities – 7 331 611 207 221 587 621 902 823 72 321 8 515 184 269 783
b ) Other operating activitiesIncome tax paid ( 713 712 ) – – – – – – ( 713 712 ) ( 721 745 )General management expenses paid ( 13 566 ) ( 1 623 707 ) ( 179 239 ) ( 24 ) ( 125 ) ( 256 978 ) 1 048 ( 2 072 591 ) ( 1 736 179 )Other operating payments 33 191 ( 88 206 ) 209 ( 43 ) ( 44 ) ( 55 832 ) – ( 110 725 ) ( 260 447 )Other operating receipts ( 36 150 ) ( 140 827 ) 23 599 60 1 698 147 285 4 335 – 273 362Loans advanced ( 55 899 ) – – – – – – ( 55 899 ) ( 42 266 )Loan repayments received 52 822 – – – – – – 52 822 51 890Other payments on operating assets 124 808 ( 60 723 ) ( 31 527 ) 2 ( 10 ) 11 668 744 44 962 ( 53 889 )
Net cash (used in) / generated from otheroperating activities ( 608 506 ) ( 1 913 463 ) ( 186 958 ) ( 5 ) 1 519 ( 153 857 ) 6 127 ( 2 855 143 ) ( 2 489 274 )
Total cash (used in) / generated from alloperating activities ( 608 506 ) 5 418 148 20 263 582 2 140 748 966 78 448 5 660 041 ( 2 219 491 )
Investment activitiesProfit / return received 95 914 4 333 846 72 485 855 243 28 817 104 4 532 264 5 159 001Dividends received 61 556 962 443 5 123 191 – 9 406 – 1 038 719 950 900Payments for investments ( 8 645 790 ) ( 56 618 014 ) ( 2 529 548 ) ( 36 232 ) ( 35 408 ) ( 2 399 613 ) ( 53 500 ) ( 70 318 105 ) ( 11 117 038 )Proceeds from disposal of investments 8 859 170 51 404 614 2 795 000 36 599 35 548 2 090 739 56 000 65 277 670 5 339 011Fixed capital expenditure ( 191 078 ) ( 60 554 ) – – – – – ( 251 632 ) ( 423 785 )Proceeds from disposal of fixed assets 17 023 – – – – – – 17 023 19 785
Total cash (used in) / generated from allinvesting activities 196 795 22 335 343 060 1 413 383 ( 270 651 ) 2 604 295 939 ( 72 126 )
Financing activitiesSurplus appropriated to shareholders' fund 1 608 161 ( 1 442 730 ) ( 164 414 ) ( 224 ) ( 793 ) – – – –Dividends paid ( 1 450 000 ) – – – – – – ( 1 450 000 ) ( 900 000 )
Total cash generated from / (used in) allfinancing activities 158 161 ( 1 442 730 ) ( 164 414 ) ( 224 ) ( 793 ) – – ( 1 450 000 ) ( 900 000 )
Net cash generated from / (used in) all activities ( 253 550 ) 3 997 753 198 909 1 771 1 730 478 315 81 052 4 505 980 ( 3 191 617 )Cash and cash equivalents at beginning of
the period 341 330 10 945 099 140 490 3 859 51 891 152 73 608 12 395 589 14 406 587Cash and cash equivalents at end of the period 87 780 14 942 852 339 399 5 630 1 781 1 369 467 154 660 16 901 569 11 214 970Reconciliation to profit and loss account
Operating cash flows 5 660 041 ( 2 219 491 )Depreciation ( 142 883 ) ( 63 030 )Amortization ( 8 881 ) ( 7 472 )Profit on disposal of fixed assets 8 720 11 755Other revenue 9 537 9 990Investment revenue 4 765 815 5 130 375Appreciation in market value of investments ( 9 758 150 ) 2 966 599(Provision for) / reversal of impairment in the value of available for sale equity investments ( 8 491 ) 121 929Profit on sale of investments 3 147 705 1 004 030Increase / (Decrease) in assets other than cash 130 129 50 177Capital contribution 108 425 –Increase in liabilities ( 2 722 251 ) ( 5 911 892 )
Profit after taxation 1 189 716 1 092 970
HASANALI ABDULLAH SAIFUDDIN N. ZOOMKAWALA SYED SHAHID ABBAS TAHER G. SACHAK RAFIQUE R. BHIMJEEDirector Director Chief Financial Managing Director & Chairman
Officer Chief Executive

Karachi 28 October, 2017
The annexed notes 1 to 15 form an integral part of this condensed interim financial information.
Rupees ‘000
Statutory Funds Aggregate
Investment Pension Accident & Family Takaful Family TakafulNote Linked Conventional Business Health Investment Protection
Business Business (Unit Linked) Business Linked Business Business 2017 2016 2017 2016
Nine months ended30 September
Three months ended30 September
Income
Premiums / contribution lessreinsurances / retakaful 18 939 446 1 587 620 922 474 1 472 400 102 367 22 103 229 16 231 274 7 496 663 4 850 677
Net investment income ( 2 085 280 ) 75 259 649 127 84 552 36 619 ( 1 888 074 ) 9 043 042 ( 5 348 653 ) 4 113 006
Total net income 16 854 166 1 662 879 1 571 601 1 556 952 138 986 20 215 155 25 274 316 2 148 010 8 963 683
Claims net of reinsurance recoveries 9 657 586 993 847 100 – 268 914 36 351 10 956 798 14 202 821 2 890 607 3 997 884Management expenses 3 708 974 364 508 44 224 669 541 66 156 4 809 447 3 749 881 1 682 374 1 180 629
Total claims and expenditure 13 366 560 1 358 355 144 224 938 455 102 507 15 766 245 17 952 702 4 572 981 5 178 513
Excess of income over claimsand expenditure 3 487 606 304 524 1 427 377 618 497 36 479 4 448 910 7 321 614 ( 2 424 971 ) 3 785 170
Add : policyholders' liabilities at beginningof the period 93 863 055 664 081 24 608 1 825 1 307 669 8 011 95 869 249 82 185 371 101 578 998 84 688 365
Less : policyholders' liabilities at endof the period 5.2 95 915 166 728 245 25 791 1 545 1 998 287 31 238 98 700 272 87 915 016 98 700 272 87 915 016
( 2 052 111 ) ( 64 164 ) ( 1 183 ) 280 ( 690 618 ) ( 23 227 ) ( 2 831 023 ) ( 5 729 645 ) 2 878 726 ( 3 226 651 )
Surplus / (Deficit) before tax 1 435 495 240 360 244 657 ( 72 121 ) 13 252 1 617 887 1 591 969 453 755 558 519
Movement in policyholders' liabilities 2 052 111 64 164 1 183 ( 280 ) 690 618 23 227 2 831 023 5 729 645 ( 2 878 726 ) 3 226 651
Transfer of (surplus) / deficit toshareholders' fund ( 1 442 730 ) ( 164 414 ) ( 224 ) ( 793 ) – – ( 1 608 161 ) ( 1 439 045 ) ( 494 404 ) ( 457 640 )
Capital contribution – – – – 101 528 6 897 108 425 – 16 917 –
Balance of statutory funds at beginningof the period 95 349 835 1 028 151 25 000 2 270 1 345 578 23 539 97 774 373 83 829 194 103 626 005 86 384 233
Balance of statutory funds at endof the period 97 394 711 1 168 261 26 203 1 854 2 065 603 66 915 100 723 547 89 711 763 100 723 547 89 711 763
Represented by:
Policyholders' liabilities 5.2 95 915 166 728 245 25 791 1 545 1 998 287 31 238 98 700 272 87 915 016 98 700 272 87 915 016Retained earnings on other than
participating business 1 479 545 440 016 412 309 67 316 35 677 2 023 275 1 796 747 2 023 275 1 796 747
Balance of statutory funds 6 97 394 711 1 168 261 26 203 1 854 2 065 603 66 915 100 723 547 89 711 763 100 723 547 89 711 763
HASANALI ABDULLAH SAIFUDDIN N. ZOOMKAWALA SYED SHAHID ABBAS TAHER G. SACHAK RAFIQUE R. BHIMJEEDirector Director Chief Financial Managing Director & Chairman
Officer Chief Executive
EFU LIFE ASSURANCE LTD
Karachi 28 October, 2017
* Individual policies are those underwritten on an individual basis, and includes joint life policies underwritten as such.
Rupees ‘000
The annexed notes 1 to 15 form an integral part of this condensed interim financial information.
Gross premiums / contribution
Regular premium / Contribution individual policies*
First year 2 683 213 1 074 – 117 504 962 – 3 189 366 2 584 757 1 199 867 865 187Second year renewal 1 910 032 821 – 13 235 766 – 2 146 632 1 851 225 752 993 577 327Subsequent year renewal 8 194 905 1 696 922 602 68 385 – 8 266 510 7 420 343 2 844 294 2 298 414
Single premium / Contribution individual policies 6 303 516 – – – 685 856 – 6 989 372 3 204 332 2 092 101 649 316
Group policies with cash values 40 955 – – – – – 40 955 20 898 13 840 6 568Group policies without cash values – 1 856 644 – – – 124 155 1 980 799 1 697 378 744 591 609 293
Total gross premiums / Contribution 19 132 621 1 860 235 922 732 1 494 969 124 155 22 613 634 16 778 933 7 647 686 5 006 105
Less: Reinsurance premiums / Retakaful contribution ceded
On individual life first year business 20 425 6 – 5 12 307 – 32 743 37 785 10 035 10 045On individual life second year business 27 794 139 – – 8 209 – 36 142 21 874 9 881 4 602On individual life renewal business 144 956 347 – 253 2 053 – 147 609 133 002 28 578 34 063On group policies – 272 123 – – – 21 788 293 911 354 998 102 529 106 718
Total reinsurance premium / retakafulcontribution ceded 193 175 272 615 – 258 22 569 21 788 510 405 547 659 151 023 155 428
Net premium / contribution 18 939 446 1 587 620 922 474 1 472 400 102 367 22 103 229 16 231 274 7 496 663 4 850 677
Statutory FundsInvestment
LinkedBusiness
ConventionalBusiness
PensionBusiness
(Unit Linked)
Accident &Health
Business
Family TakafulInvestment
Linked Business
Family TakafulProtection Business
Three months ended30 September
Nine months ended30 September
201620172017 2016
AggregateAggregate
HASANALI ABDULLAH SAIFUDDIN N. ZOOMKAWALA SYED SHAHID ABBAS TAHER G. SACHAK RAFIQUE R. BHIMJEEDirector Director Chief Financial Managing Director & Chairman
Officer Chief Executive
Karachi 28 October, 2017
Statutory Funds Aggregate Aggregate
Investment Pension Accident & Family Takaful Family TakafulNote Linked Conventional Business Health Investment Protection
Business Business (Unit Linked) Business Linked Business Business 2017 2016 2017 2016
Nine months ended30 September
Three months ended30 September
Rupees ‘000
The annexed notes 1 to 15 form an integral part of this condensed interim financial information.
Gross claims
Claims under individual policiesby death 427 562 1 521 – – 23 419 – 452 502 592 079 156 180 115 141by insured event other than death 5 727 31 – – – – 5 758 15 259 4 710 2 647by maturity 699 119 – 100 – – – 699 219 486 672 165 543 136 110by surrender 8 608 061 – – – 260 044 – 8 868 105 12 175 850 2 240 460 3 381 337
Total gross individual policy claims 9 740 469 1 552 100 – 283 463 – 10 025 584 13 269 860 2 566 893 3 635 235
Claims under group policies by death 770 1 225 288 – – – 42 700 1 268 758 1 132 842 384 427 413 679by insured event other than death – 103 265 – – – 1 934 105 199 42 713 15 816 15 759by surrender 4 514 – – – – – 4 514 1 846 1 903 999experience refund – 71 123 – – – – 71 123 106 418 32 365 38 786
Total gross group claims 5 284 1 399 676 – – – 44 634 1 449 594 1 283 819 434 511 469 223
Total gross claims 9 745 753 1 401 228 100 – 283 463 44 634 11 475 178 14 553 679 3 001 404 4 104 458
Less: Reinsurance recoveriesOn individual life first year business 43 366 – – – 2 309 – 45 675 58 675 13 958 7 298On individual life second year business 1 358 – – – 11 293 – 12 651 – 2 456 ( 3 020 )On individual life subsequent
renewal business 43 443 844 – – 363 – 44 650 21 181 21 215 9 251On group claims – 373 223 – – – 8 283 381 506 245 195 60 154 102 244On experience refund of premiums – 33 314 – – 584 – 33 898 24 227 13 014 ( 10 779 )
Total reinsurance recoveries 88 167 407 381 – – 14 549 8 283 518 380 349 278 110 797 104 994
Net claims 9 657 586 993 847 100 – 268 914 36 351 10 956 798 14 204 401 2 890 607 3 999 464
HASANALI ABDULLAH SAIFUDDIN N. ZOOMKAWALA SYED SHAHID ABBAS TAHER G. SACHAK RAFIQUE R. BHIMJEEDirector Director Chief Financial Managing Director & Chairman
Officer Chief Executive
EFU LIFE ASSURANCE LTD
Karachi 28 October, 2017
Rupees ‘000
Nine months ended30 September
Three months ended30 September
Statutory Funds Aggregate Aggregate
Investment Pension Accident Family Takaful Family TakafulLinked Conventional Business & Health Investment Protection
Business Business (Unit Linked) Business Linked Business Business 2017 2016 2017 2016
The annexed notes 1 to 15 form an integral part of this condensed interim financial information.
Acquisition costs
Remuneration to insurance intermediarieson individual policies:– commission on first year premiums / Contribution 1 236 184 319 – 44 213 787 – 1 450 334 1 087 673 615 296 358 716– commission on second year premiums / Contribution 160 515 77 – 5 20 302 – 180 899 161 520 46 501 51 513– commission on subsequent renewal premiums / Contribution 178 339 41 15 35 1 679 – 180 109 185 469 13 616 56 823– commission on single premiums / Contribution 202 235 – – – 22 124 – 224 359 110 568 57 836 20 182– override commission 290 225 73 3 13 36 845 – 327 159 264 421 112 418 85 223– other benefits to insurance intermediaries 414 165 100 15 23 101 773 – 516 076 430 569 159 446 137 749
2 481 663 610 33 120 396 510 – 2 878 936 2 240 220 1 005 113 710 206Remuneration to insurance intermediaries
on group policies:– commission 3 147 190 867 – – – 24 483 218 497 165 130 73 873 43 681– other benefits to insurance intermediaries 614 41 094 – – – 1 250 42 958 37 953 11 843 12 516
3 761 231 961 – – – 25 733 261 455 203 083 85 716 56 197
Branch overheads 393 124 11 964 11 23 44 532 – 449 654 358 025 150 286 113 735Other acquisition costs
– policy stamps 42 137 241 – 2 9 459 – 51 839 52 663 19 011 18 037
Total acquisition cost 2 920 685 244 776 44 145 450 501 25 733 3 641 884 2 853 991 1 260 126 898 175
Administration expensesSalaries and other benefits 314 385 52 406 – 37 56 870 1 992 425 690 375 180 145 529 124 120Travelling expenses 51 919 5 200 – 1 1 753 52 58 925 58 030 3 389 16 400Actuary's fees 6 595 370 – 1 1 134 – 8 100 7 650 2 700 2 550Medical fees 14 692 149 – – 309 – 15 150 16 142 4 199 4 948Legal and professional fee 13 987 29 476 – 2 6 374 1 556 51 395 31 522 26 502 12 982Advertisements and publicity 91 604 8 034 – – – – 99 638 87 637 61 100 17 961Computer expenses 10 713 616 – 1 1 836 1 13 167 11 515 3 071 3 940Printing and stationery 30 748 2 435 – 4 6 306 49 39 542 21 764 6 450 4 867Depreciation 73 364 4 464 – 9 12 510 20 90 367 23 447 31 428 6 429Amortisation 7 231 406 – 1 1 243 – 8 881 7 472 3 010 2 320Rental 4 226 1 245 – 1 726 53 6 251 25 814 2 298 13 665Exchange (gain) / loss ( 2 327 ) – – – – – ( 2 327 ) ( 336 ) ( 326 ) ( 1 481 )Postage 30 955 1 744 – 4 5 445 1 38 149 46 470 10 905 11 439Fees and subscription 43 716 2 950 – 5 10 723 59 57 453 40 407 23 135 13 014Wakala/Wakalat-ul-Istasmar Expenses – – – – 99 615 36 409 136 024 80 342 60 633 26 174Other management expenses 111 660 10 239 – 13 19 485 231 141 628 85 990 44 481 29 589
Gross management expenses 3 724 153 364 510 44 224 674 830 66 156 4 829 917 3 773 037 1 688 630 1 187 092
Commission from reinsurers ( 7 523 ) ( 2 ) – – ( 5 230 ) – ( 12 755 ) ( 15 425 ) ( 3 975 ) ( 4 086 )
Fees charged to policy holders ( 7 656 ) – – – ( 59 ) – ( 7 715 ) ( 7 731 ) ( 2 281 ) ( 2 377 )
Net management expenses 3 708 974 364 508 44 224 669 541 66 156 4 809 447 3 749 881 1 682 374 1 180 629
HASANALI ABDULLAH SAIFUDDIN N. ZOOMKAWALA SYED SHAHID ABBAS TAHER G. SACHAK RAFIQUE R. BHIMJEEDirector Director Chief Financial Managing Director & Chairman
Officer Chief Executive
Karachi 28 October, 2017
Statutory Funds Aggregate Aggregate
Investment Pension Accident Family Takaful Family TakafulLinked Conventional Business & Health Investment Protection
Business Business (Unit Linked) Business Linked Business Business 2017 2016 2017 2016
Rupees ‘000
Nine months ended30 September
Three months ended30 September
The annexed notes 1 to 15 form an integral part of this condensed interim financial information.
Investment income
Income from Trading InvestmentsGain / (loss) on trading 146 222 – – – – – 146 222 40 654 124 390 3 998Dividend Income on trading 6 311 – – – – – 6 311 18 310 97 1 363
152 533 – – – – – 152 533 58 964 124 487 5 361
On government securities 2 974 843 66 024 789 243 6 811 49 3 048 759 3 440 749 945 334 1 058 523On other fixed income securities and deposits 565 077 5 072 36 – 33 815 161 604 161 643 017 213 994 206 263Dividend income 956 132 5 123 191 – 9 406 – 970 852 891 512 269 970 262 685Amortisation of (premium) / discount ( 227 027 ) 277 15 ( 2 ) – – ( 226 737 ) ( 278 368 ) ( 78 108 ) ( 101 096 )
4 269 025 76 496 1 031 241 50 032 210 4 397 035 4 696 910 1 351 190 1 426 375
Gain on sale of investments 2 920 776 – 133 – 44 650 – 2 965 559 963 376 407 464 252 063
Unrealised (loss) / gain on investment
Government securities ( 486 762 ) – ( 58 ) – – – ( 486 820 ) 157 731 ( 217 662 ) ( 294 363 )Other fixed income securities ( 41 215 ) – – – – – ( 41 215 ) ( 2 237 ) ( 1 895 ) 7 730Listed equities securities and mutual
fund units ( 8 893 176 ) – ( 457 ) – ( 109 745 ) – ( 9 003 378 ) 3 089 473 ( 7 070 968 ) 2 687 778
( 9 421 153 ) – ( 515 ) – ( 109 745 ) – ( 9 531 413 ) 3 244 967 ( 7 290 525 ) 2 401 145
Provision for impairment invalue of investments
Available-for-sale fixed income securities – – – – – – – – – –Available-for-sale equity securities
and mutual fund units – ( 1 237 ) – ( 114 ) – – ( 1 351 ) 2 704 442 2 915
– ( 1 237 ) – ( 114 ) – – ( 1 351 ) 2 704 442 2 915
( 2 078 819 ) 75 259 649 127 ( 15 063 ) 210 ( 2 017 637 ) 8 966 921 ( 5 406 942 ) 4 087 859
Less : Investment related expense ( 6 461 ) – – – – – ( 6 461 ) ( 4 221 ) ( 2 344 ) ( 1 027 )
Add: Wakala / Wakalat-ul-Istasmar Income – – – – 99 615 36 409 136 024 80 342 60 633 26 174
Net investment income ( 2 085 280 ) 75 259 649 127 84 552 36 619 ( 1 888 074 ) 9 043 042 ( 5 348 653 ) 4 113 006
HASANALI ABDULLAH SAIFUDDIN N. ZOOMKAWALA SYED SHAHID ABBAS TAHER G. SACHAK RAFIQUE R. BHIMJEEDirector Director Chief Financial Managing Director & Chairman
Officer Chief Executive

EFU LIFE ASSURANCE LTD
1. STATUS AND NATURE OF BUSINESS
1.1 EFU Life Assurance Limited (the Company) was incorporated in Pakistan on 09 August 1992 as a public limitedcompany under the Companies Ordinance, 1984 and started its operations from 08 November 1992. The sharesof the Company are quoted on Pakistan Stock Exchange. The registered office of the Company is located atAl-Malik Centre, 70W, F-7/G-7 Jinnah Avenue, Islamabad while the principal place of business is located at EFU lifehouse Plot No.112, 8th East street, phase 1, DHA, Karachi.
1.2 The Company is engaged in life insurance business including ordinary life business, pension fund business andaccident and health business and has established following statutory funds, as required by the Insurance Ordinance,2000 and Takaful Rules, 2012:
- Investment Linked business (includes individual life business)
- Conventional business (includes group life and individual life businesses)
- Pension business (unit linked)*
- Accident and health business
- Family takaful investment linked business (Refer note 1.3)
- Family takaful protection business (Refer note 1.3)
* The Company had discontinued pension business and accordingly no new business has been written under this fund.
1.3 The Company was granted authorisation on 19 January 2015 under Rule 6 of the Takaful Rules, 2012 to undertakeTakaful Window Operation in respect of family takaful products by Securities and Exchange Commission of Pakistan(SECP) and subsequently the Company commenced Window Takaful Operations on 6 February 2015 under thebrand name "Hemayah". For the purpose of carrying on takaful business, the Company has formed a Waqf namelyEFU Life - Window Family Takaful Limited Waqf (here-in-after referred to as the Participant Takaful Fund (PTF))was formed on 6 February 2015 under a Waqf deed executed by the Company with a cede amount of Rs. 2 million.The cede money is required to be invested in Shariah compliant investments and any profit thereon can be utilizedonly to pay benefits to participants or defray PTF expenses. Waqf deed also governs the relationship of the companyand policyholders for the management of Takaful operations, investment of policyholders' funds and shareholders'funds as approved by the Shariah Advisor appointed by the Company.
2. BASIS OF PREPARATION AND STATEMENT OF COMPLIANCE
2.1 The condensed interim financial information of the Company for the Nine months period ended 30 September 2017has been prepared in accordance with the requirements of the International Accounting Standard 34 - 'InterimFinancial Reporting' as applicable in Pakistan, provisions of and directives issued under the Companies Ordinance,1984, the Insurance Ordinance, 2000 and SEC (Insurance) Rules, 2002. In case requirements differ, the provisions ordirectives of the Companies Ordinance, 1984, Insurance Ordinance, 2000 and SEC (Insurance) Rules, 2002 shall prevail.
2.2 The condensed interim financial information does not include all the information and disclosures required in theannual financial statements. Accordingly, the condensed interim financial information should be read in conjunctionwith the Company’s annual financial statements as at and for the year ended 31 December 2016.
2.3 The Companies Ordinance,1984 has been repealed after the enactment of the Companies Act, 2017. However, asallowed by the SECP vide its circular No.7 dated 20 July 2017 and circular No.23 dated 4 October 2017, thesecondensed interim financial statements have been prepared in accordance with the provisions of the repealedCompanies Ordinance,1984.
2.4 During the period, Securities and Exchange Commission of Pakistan ("SECP") issued Insurance AccountingRegulations, 2017 and Insurance Rules, 2017 which were applicable with effect from 01 April 2017. However, theCompany applied for the extension till 31 December 2017. The SECP vide his letter ID/OSM/EFU Life/2017/10488,dated 4 August 2017 allowed the Company to prepare its half yearly accounts for the period ended 30 June 2017,third quarter ended 30 September 2017 and annual audited accounts for the year ended 31 December 2017 in

5. POLICYHOLDERS’ LIABILITIES
5.1 Gross of reinsurance/retakaful
Actuarial liability relatingto future events 95 647 505 603 356 25 794 1 696 2 024 421 30 785 98 333 557 95 491 066
Provision for outstandingreported claims payableover a period exceedingtwelve months 462 083 178 876 – 6 607 – 641 572 562 058
Provision for incurred butnot reported claims 128 487 258 200 – – – 10 456 397 143 379 460
96 238 075 1 040 432 25 794 1 702 2 025 028 41 241 99 372 272 96 432 584
5.2 Net of reinsurance/retakaful
Actuarial liability relatingto future events 95 515 004 491 988 25 791 1 540 1 997 791 22 770 98 054 884 95 251 783
Provision for outstandingreported claims payableover a period exceedingtwelve months 299 471 40 928 – 5 496 – 340 900 324 160
Provision for incurred butnot reported claims 100 691 195 329 – – – 8 468 304 488 293 306
95 915 166 728 245 25 791 1 545 1 998 287 31 238 98 700 272 95 869 249
Statutory Funds Aggregate
InvestmentLinked
BusinessConventional
Business
PensionBusiness
(Unit Linked)
Accident& HealthBusiness
Family TakafulInvestment Linked
Business
Family TakafulProtectionBusiness
30 September2017
Unaudited
31 December2016
Audited
Rupees ‘000
accordance with the requirement of previous rules and allowed the implication of Insurance Accounting Regulations,2017 effective from the accounting year commencing from 1 January 2018. Accordingly the Company has followedthe accounting format as prescribed in the previous rules.
3. SIGNIFICANT ACCOUNTING POLICIES
The significant accounting policies and the methods of computation adopted by the Company in the preparationof this condensed interim financial information are the same as those applied in the preparation of the annualfinancial statements of the company for the year ended 31 December 2016.
4. FINANCIAL RISK MANAGEMENT / JUDGEMENTS AND ESTIMATES
The financial risk management objectives and policies are consistent with those disclosed in the financial statementsof the Company for the year ended 31 December 2016.
In preparing this condensed interim financial information, management has made judgments, estimates andassumptions that affect the application of accounting policies and the reported amounts of assets and liabilities,income and expense. Actual results may differ from these estimates.
The significant judgments made by management in applying the Company's accounting policies and the keysources of estimation uncertainty were the same as those that applied to the financial statements as at the yearended 31 December 2016.
EFU LIFE ASSURANCE LTD
Statutory Funds Aggregate
InvestmentLinked
BusinessConventional
Business
PensionBusiness
(Unit Linked)
Accident& HealthBusiness
30 September2017
Unaudited
31 December2016
Audited
Rupees ‘0006. RECONCILIATION OF STATUTORY FUNDS
Family TakafulInvestment Linked
Business
Family TakafulProtectionBusiness
6.1 The SECP has issued amendments to the SEC (Insurance) Rules, 2002, which includes revision in the solvency margin forthe life insurers. Keeping in view such future solvency requirements, the Company has retained an aggregate amount ofRs.1,916 million (2016: Rs. 1,861 million) in the Statutory Funds, based on the advice of the appointed actuary.
7. INVESTMENTS
Accident &Health
BusinessShareholders
Fund
InvestmentLinked
BusinessConventional
Business
PensionBusiness
(Unit Linked)
Family TakafulInvestment Linked
Business
30 September2017
Unaudited
31 December2016
Audited
Statutory Funds Aggregate
Rupees ‘000
Family TakafulProtection
Business
Policyholders’ liabilities
Balance at beginningof the period 93 863 055 664 081 24 608 1 825 1 307 669 8 011 95 869 249 82 185 371
Increase / (decrease)during the period 2 052 111 64 164 1 183 ( 280 ) 690 618 23 227 2 831 023 13 683 878
Balance at end of the period 95 915 166 728 245 25 791 1 545 1 998 287 31 238 98 700 272 95 869 249
Retained earnings on other thanparticipating business
Balance at beginning of the period 1 486 780 364 070 392 445 37 909 15 528 1 905 124 1 643 822
Surplus for the period 1 435 495 240 360 244 657 ( 72 121 ) 13 252 1 617 887 2 498 124
Capital contribution – – – – 101 528 6 897 108 425 89 256
Surplus appropriatedto shareholders’ fund ( 1 442 730 ) ( 164 414 ) ( 224 ) ( 793 ) – – ( 1 608 161 ) ( 2 326 078 )
Balance at end of the period(refer note no. 6.1) 1 479 545 440 016 412 309 67 316 35 677 2 023 275 1 905 124
Balance of statutory funds 97 394 711 1 168 261 26 203 1 854 2 065 603 66 915 100 723 547 97 774 373
Government securitiesHeld to maturity (at amortized cost) 1 423 305 417 680 1 347 273 – 5 355 – – 3 193 613 3 465 074
Available for sale (at fair value) – 46 988 402 – 15 506 – 140 836 – 47 144 744 45 404 994
1 423 305 47 406 082 1 347 273 15 506 5 355 140 836 – 50 338 357 48 870 068
Other fixed income securitiesHeld to maturity (at amortized cost) – – – – – – – – –
Available for sale (at fair value) – 932 548 – – – – – 932 548 1 575 511
– 932 548 – – – – – 932 548 1 575 511
Listed equities and mutual fundsAvailable for sale (at fair value) – 34 013 372 – 6 777 – 706 531 – 34 726 680 36 742 608
Held for trading (at fair value) – 100 331 – – – – – 100 331 459 246
Available for sale (at lower ofcost or market value) 1 332 543 81 581 150 491 – 1 035 – – 1 565 650 1 586 143
1 332 543 34 195 284 150 491 6 777 1 035 706 531 – 36 392 661 38 787 997
Less: Provision for impairmentin value of investments 370 243 – 40 375 – 774 – – 411 392 402 901
962 300 34 195 284 110 116 6 777 261 706 531 – 35 981 269 38 385 096
7.1 These Government securities are placed in the IPS account maintained with JS Bank ("the related party").7.2 Market value of the government securities carried at amortized cost amounted to Rs. 3,213 million (31 December 2016:
Rs. 3,492.21 million).7.3 Government securities include Rs.125 million (31 December 2016: Rs. 115 million) placed with the State Bank of Pakistan,
in accordance with Section 29 of the Insurance Ordinance, 2000.7.4 Listed equities and mutual funds include investment in EFU General Insurance Limited (a related party) at carrying value of
Rs. 2,030 million (31 December 2016: Rs. 1,486 million) representing 6.81% (31 December 2016: 6.81 %) of the issuedcapital of the related party.
7.5 Market value of the listed equities and mutual funds held at lower of cost or market value amounted to Rs. 1,834 million(31 December 2016: Rs. 2,037 million).
7.6 Listed equities and mutual funds include investment in 3,178,851 (2016: 3,178,851) ordinary shares of Agritech limitedwhich are not held in the name of the company. These shares are held in the name of Trustees i.e. Faysal Bank and PakBrunei Investment Company, on behalf of EFU Life Assurance Limited. The market value of these shares as at 30 September2017 is Rs. 28.069 million (2016: Rs. 40.308 million).
8. CONTINGENCIES AND COMMITMENTS8.1 The Income tax assessment of the Company for tax year 2016 has been finalized. The tax department has reopened the
assessment order issued under Sec 122(5A) for the tax year 2009-2016 and has raised a demand of Rs. 56.31 million againstdividend income so received by the Company to be taxed at corporate rate instead of reduced rates available in the Firstschedule of Income Tax Ordinance 2001. The Company filed an appeal for tax year 2009-2013 before CIT appeals where thecase was decided against the Company. The Company has filed an appeal before Appellate Tribunal for the same tax yearsand believes that the matter will be settled in its favour. For tax year 2014 and tax year 2016, the Company filed an appealbefore CIT appeals against the order, where the case was decided in favour of the Company. For the tax year 2015, theCompany has filed an appeal before CIT appeal. No provision has been made in respect of aforementioned additional demand.
In 2013, Income Tax Department imposed an additional tax demand under section 151(1)(d) on account of non-deductionof withholding tax on surrender and maturity amounting to Rs.13.833 million and Rs.15.014 million for Tax Years 2012and 2013 respectively. The Company filed an appeal before Commissioner Inland Revenue (Appeals) and the same wasdismissed. The Company filed second appeal before the Appellate Tribunal against the order of CIT. The learned AppellateTribunal Inland revenue has now decided the case in Company's favour.Subsequent to the period, the department has filedreview application against the order in Honourable Court of Sindh. The decision is still pending
In 2015 and 2016, The searle company Limited issued bonus shares (76,031 shares and 342,480 shares respectively) afterwithholding 5 percent of bonus shares (3,801.55 shares and 18,707.44 shares respectively) and the IBL Healthcare ltd.issued bonus shares (46,625 shares and 80,311 shares respectively) after withholding 5 percent of bonus shares (2,331.26shares and 4,031 shares respectively). In this regard, a constitutional petition had been filed by the company in Sindh HighCourt challenging the applicability of withholding tax provision on bonus shares received by the Company. The honorablehigh court decided the case against the Company. Subsequently, the Company filed an appeal with a larger bench of theSindh High Court and in response the Sindh High Court has suspended the earlier judgement until the next date of hearing,which has not yet been decided. The Company is of the view that the case will be decided in its favour and no provisionhas been made for the aforementioned tax.
8.2 Bank guarantees amounting to Rs. 8.265 million have been given in respect of Group Life coverage. These bank guaranteeswill expire by 31st March 2018 and 16 January 2020.
Nine months ended-Unaudited
30 September 2017
Additions Disposals9.1 Tangible and intangible
Furniture, fixture and fittings 50 802 936 11 369 18Office equipment 34 197 1 172 4 323 70Computers 21 553 23 12 449 –Motor Vehicles 82 784 25 918 75 699 27 536Intangibles 1 742 – 4 854 –Capital work in progress – – 313 493 –Building 60 554 – – –
251 632 28 049 422 187 27 624
9. FIXED ASSETS
30 September 2016
Additions Disposals
Rupees in ‘000

EFU LIFE ASSURANCE LTD
10. TAXATIONCurrent ( 523 062 ) ( 523 161 )Prior years ( 71 938 ) ( 66 839 )Deferred ( 2 900 ) 800
( 597 900 ) ( 589 200 )
Nine months ended (Unaudited)
30 September2017
30 September2016
Rupees in ‘000
11. RELATED PARTY TRANSACTIONS
The related parties comprise of directors, key management personnel, associated companies / associated undertakings, andentities with common directors and retirement benefit fund. The transactions with related parties are carried out at commercialterms and conditions except for compensation to key management personnel which are on employment terms. The detailsof transactions with related parties during the period, other than those which have been specifically disclosed elsewherein the financial statements are as follows:
Nine months ended-Unaudited
30 September2017
30 September2016
Rupees in ‘000
11.2 BalancesBank balances 46 744 30 906Bank deposits 2 150 000 2 150 000Premium payable 22 49Premium receivable 785 5 197Investment in EFU General Insurance Company Limited 1 476 329 1 486 093Investment in related party 712 845 238 310
(Rupees in ‘000)
30 September2017
Unaudited
31 December2016
Audited
11.1 Transactions11.1.1 Associated companies / Associated undertakings
Premium written 89 260 50 555Premium paid 37 454 41 529Claims paid 13 629 11 354Claims received 2 403 4 369Commission paid 71 860 64 704Travelling expenses 2 357 1 041Dividend paid 927 189 567 963Dividend received 129 059 78 650Bonus shares – 375 263Interest on bank deposit 98 345 121 898
11.1.2 Employees’ fundsContribution to provident fund 19 243 17 034Contribution to pension fund 15 783 13 767
11.1.3 Key Management PersonnelLoan to Key Employees 550 35 869Loan recovered 3 003 500Compensation paid 93 936 87 413Loan Receivable 27 491 30 844
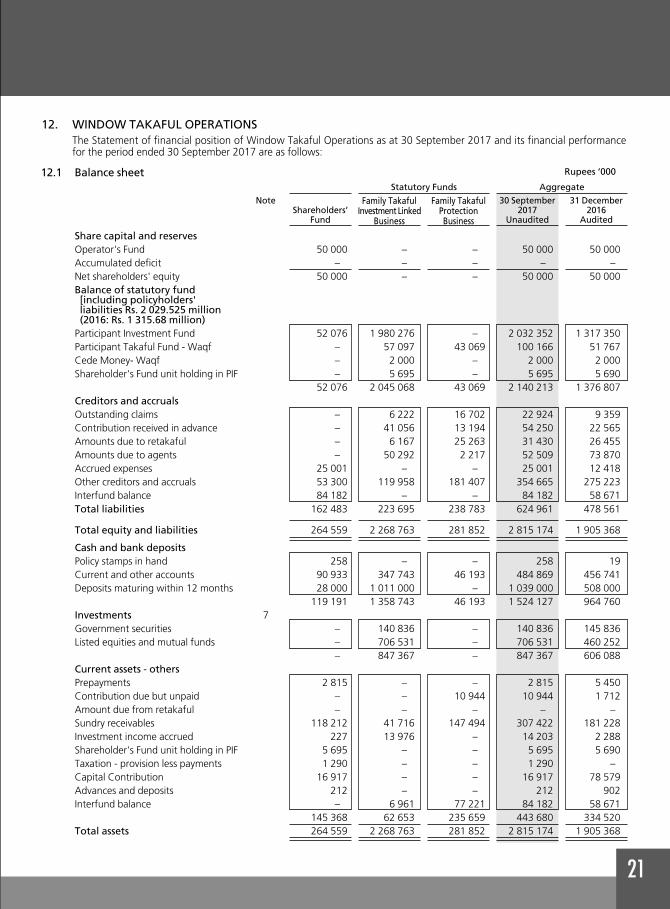
12. WINDOW TAKAFUL OPERATIONSThe Statement of financial position of Window Takaful Operations as at 30 September 2017 and its financial performancefor the period ended 30 September 2017 are as follows:
12.1 Balance sheet
Family TakafulInvestment Linked
Business
30 September2017
Unaudited
31 December2016
Audited
Rupees ‘000
Statutory Funds Aggregate
Shareholders’Fund
Note Family TakafulProtection
Business
Share capital and reservesOperator's Fund 50 000 – – 50 000 50 000Accumulated deficit – – – – –Net shareholders' equity 50 000 – – 50 000 50 000Balance of statutory fund [including policyholders' liabilities Rs. 2 029.525 million (2016: Rs. 1 315.68 million)Participant Investment Fund 52 076 1 980 276 – 2 032 352 1 317 350Participant Takaful Fund - Waqf – 57 097 43 069 100 166 51 767Cede Money- Waqf – 2 000 – 2 000 2 000Shareholder's Fund unit holding in PIF – 5 695 – 5 695 5 690
52 076 2 045 068 43 069 2 140 213 1 376 807Creditors and accrualsOutstanding claims – 6 222 16 702 22 924 9 359Contribution received in advance – 41 056 13 194 54 250 22 565Amounts due to retakaful – 6 167 25 263 31 430 26 455Amounts due to agents – 50 292 2 217 52 509 73 870Accrued expenses 25 001 – – 25 001 12 418Other creditors and accruals 53 300 119 958 181 407 354 665 275 223Interfund balance 84 182 – – 84 182 58 671Total liabilities 162 483 223 695 238 783 624 961 478 561
Total equity and liabilities 264 559 2 268 763 281 852 2 815 174 1 905 368
Cash and bank depositsPolicy stamps in hand 258 – – 258 19Current and other accounts 90 933 347 743 46 193 484 869 456 741Deposits maturing within 12 months 28 000 1 011 000 – 1 039 000 508 000
119 191 1 358 743 46 193 1 524 127 964 760Investments 7Government securities – 140 836 – 140 836 145 836Listed equities and mutual funds – 706 531 – 706 531 460 252
– 847 367 – 847 367 606 088Current assets - othersPrepayments 2 815 – – 2 815 5 450Contribution due but unpaid – – 10 944 10 944 1 712Amount due from retakaful – – – – –Sundry receivables 118 212 41 716 147 494 307 422 181 228Investment income accrued 227 13 976 – 14 203 2 288Shareholder's Fund unit holding in PIF 5 695 – – 5 695 5 690Taxation - provision less payments 1 290 – – 1 290 –Capital Contribution 16 917 – – 16 917 78 579Advances and deposits 212 – – 212 902Interfund balance – 6 961 77 221 84 182 58 671
145 368 62 653 235 659 443 680 334 520Total assets 264 559 2 268 763 281 852 2 815 174 1 905 368
EFU LIFE ASSURANCE LTD
Rupees ‘000
Family TakafulProtection
Business
Family TakafulInvestment
Linked Business
Nine months ended30 September
201730 September
2016
Three months ended30 September
201730 September
2016
Statutory Funds Aggregate
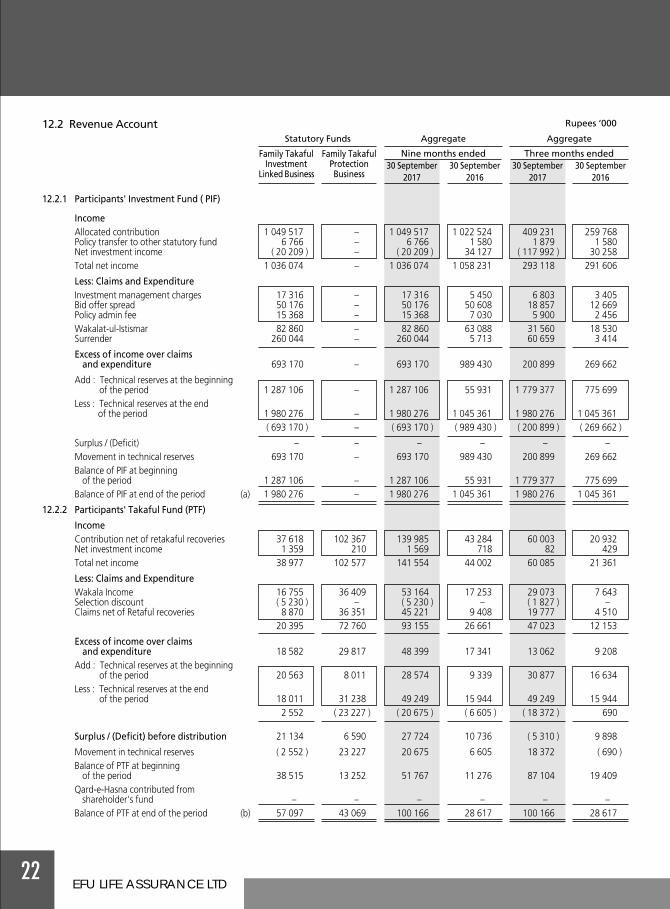
12.2 Revenue AccountAggregate
12.2.1 Participants' Investment Fund ( PIF)
IncomeAllocated contribution 1 049 517 – 1 049 517 1 022 524 409 231 259 768Policy transfer to other statutory fund 6 766 – 6 766 1 580 1 879 1 580Net investment income ( 20 209 ) – ( 20 209 ) 34 127 ( 117 992 ) 30 258Total net income 1 036 074 – 1 036 074 1 058 231 293 118 291 606
Less: Claims and ExpenditureInvestment management charges 17 316 – 17 316 5 450 6 803 3 405Bid offer spread 50 176 – 50 176 50 608 18 857 12 669Policy admin fee 15 368 – 15 368 7 030 5 900 2 456Wakalat-ul-Istismar 82 860 – 82 860 63 088 31 560 18 530Surrender 260 044 – 260 044 5 713 60 659 3 414
Excess of income over claims and expenditure 693 170 – 693 170 989 430 200 899 269 662
Add : Technical reserves at the beginning of the period 1 287 106 – 1 287 106 55 931 1 779 377 775 699Less : Technical reserves at the end of the period 1 980 276 – 1 980 276 1 045 361 1 980 276 1 045 361
( 693 170 ) – ( 693 170 ) ( 989 430 ) ( 200 899 ) ( 269 662 )
Surplus / (Deficit) – – – – – –Movement in technical reserves 693 170 – 693 170 989 430 200 899 269 662Balance of PIF at beginning of the period 1 287 106 – 1 287 106 55 931 1 779 377 775 699Balance of PIF at end of the period (a) 1 980 276 – 1 980 276 1 045 361 1 980 276 1 045 361
12.2.2 Participants' Takaful Fund (PTF)
IncomeContribution net of retakaful recoveries 37 618 102 367 139 985 43 284 60 003 20 932Net investment income 1 359 210 1 569 718 82 429Total net income 38 977 102 577 141 554 44 002 60 085 21 361
Less: Claims and ExpenditureWakala Income 16 755 36 409 53 164 17 253 29 073 7 643Selection discount ( 5 230 ) – ( 5 230 ) – ( 1 827 ) –Claims net of Retaful recoveries 8 870 36 351 45 221 9 408 19 777 4 510
20 395 72 760 93 155 26 661 47 023 12 153
Excess of income over claims and expenditure 18 582 29 817 48 399 17 341 13 062 9 208Add : Technical reserves at the beginning of the period 20 563 8 011 28 574 9 339 30 877 16 634Less : Technical reserves at the end of the period 18 011 31 238 49 249 15 944 49 249 15 944
2 552 ( 23 227 ) ( 20 675 ) ( 6 605 ) ( 18 372 ) 690
Surplus / (Deficit) before distribution 21 134 6 590 27 724 10 736 ( 5 310 ) 9 898
Movement in technical reserves ( 2 552 ) 23 227 20 675 6 605 18 372 ( 690 )Balance of PTF at beginning of the period 38 515 13 252 51 767 11 276 87 104 19 409Qard-e-Hasna contributed from shareholder's fund – – – – – –Balance of PTF at end of the period (b) 57 097 43 069 100 166 28 617 100 166 28 617

Aggregate12.2.3 Shareholders' Sub-Fund
Nine months ended30 September
2017 2016
Aggregate
Three months ended30 September
2017 2016
(Rupees in ‘000)
12.3 Statement of contribution
Family TakafulInvestment Linked
Business
Family TakafulProtectionBusiness
Statutory Funds
IncomeUn-allocated contribution 378 499 – 378 499 238 389 144 123 76 073Net investment income 3 787 – 3 787 1 036 637 283Wakalat-ul-Istismar - PIF 82 860 – 82 860 63 088 31 560 18 530Wakala Fee - PTF 16 755 36 409 53 164 17 253 29 073 7 643
Total net income 481 901 36 409 518 310 319 766 205 393 102 529
Less: ExpenditureAcquisition costs 455 731 25 733 481 464 304 656 166 978 98 895Administration expenses 119 425 4 014 123 439 48 260 45 372 20 573
575 156 29 747 604 903 352 916 212 350 119 468
(Shortfall) / Excess of incomeover expenditure ( 93 255 ) 6 662 ( 86 593 ) ( 33 150 ) ( 6 957 ) ( 16 939 )
Add : Technical reserves at the beginning of the period – – – – – –
Less : Technical reserves at the end of the period – – – – – –
– – – – – –
(Deficit) / surplus before tax ( 93 255 ) 6 662 ( 86 593 ) ( 33 150 ) ( 6 957 ) ( 16 939 )
Movement in technical reserves – – – – – –
(Deficit) / surplus transfer toshareholder's fund – – – 28 215 – 17 538
Capital contribution 101 528 6 897 108 425 – 16 917 –
Balance of shareholders' sub fundat beginning of the period – – – – – –
Qard-e-Hasna – – – – – –
Retained earnings on other thanparticipating business 19 957 10 287 30 244 16 291 52 076 10 757
Balance of shareholders'sub fund at end of the period (c) 28 230 23 846 52 076 11 356 62 036 11 356
Balance of statutory fundsat end of the period (a+b+c) 2 065 603 66 915 2 132 518 1 085 334 2 142 478 1 085 334
Represented by:
Policy holder's liability 1 998 287 31 238 2 029 525 1 061 305 2 029 525 1 061 305
Retained Earnings 67 316 35 677 102 993 24 029 112 953 24 029
2 065 603 66 915 2 132 518 1 085 334 2 142 478 1 085 334
Gross contribution
Regular contribution individual policiesFirst year 504 962 – 504 962 327 967 190 497 104 135
Second year 235 766 – 235 766 68 449 84 033 39 523 Third year 68 385 – 68 385 975 44 567 975Single contribution individual policies 685 856 – 685 856 900 255 258 419 204 864Group policies without cash values – 124 155 124 155 31 201 55 453 9 483
Total gross contribution 1 494 969 124 155 1 619 124 1 328 847 632 969 358 980

EFU LIFE ASSURANCE LTD
12.4 Statement of claims
Gross ClaimsClaims under individual policiesby death 23 419 – 23 419 2 400 ( 2 799 ) 2 000by insured event other than death – – – – – –
23 419 – 23 419 2 400 ( 2 799 ) 2 000Surrenders / partial withdrawals 260 044 – 260 044 5 714 60 659 3 415Claims under group policiesby death – 42 700 42 700 11 541 23 701 5 441by insured event other than death – 1 934 1 934 281 1 177 113
– 44 634 44 634 11 822 24 878 5 554
Total Gross Claims 283 463 44 634 328 097 19 936 82 738 10 969
Gross Claims allocated as follows:
Participants’ Investment Fund (PIF)Surrenders / Partial withdrawals under same in source policies 260 044 – 260 044 5 714 60 659 3 415
Participants’ Takaful Fund (PTF)Under individual policies by death 23 419 – 23 419 2 400 ( 2 799 ) 2 000Under group policies by death – 42 700 42 700 11 541 23 701 5 441Under group policies by event other than death – 1 934 1 934 281 1 177 113
Total gross claims under PTF 23 419 44 634 68 053 14 222 22 079 7 554
Less: Retakaful recoveries under PTFOn individual policies first year 2 309 – 2 309 – ( 4 445 ) –On individual policies second year 11 293 – 11 293 – 1 064 –
On individual policies subsequent year 363 – 363 – 363 –On group policies – 8 283 8 283 4 814 5 320 3 044
Profit commission from reinsurer PTA income 584 – 584 – – –
14 549 8 283 22 832 4 814 2 302 3 044Net Claims under PTF 8 870 36 351 45 221 9 408 19 777 4 510
AggregateNine months ended
30 September
2017 2016
AggregateThree months ended
30 September
2017 2016
(Rupees in ‘000)
Family TakafulInvestment Linked
Business
Family TakafulProtectionBusiness
Statutory Funds
12.3.1 Participants' Investment FundAllocated regular contribution 370 427 – 370 427 122 269 152 691 54 904Allocated single contribution 685 856 – 685 856 900 255 258 419 204 864
Total allocated contribution 1 056 283 – 1 056 283 1 022 524 411 110 259 768
12.3.2 Participants' Takaful FundAllocated gross contribution 60 187 124 155 184 342 67 934 77 736 23 139Less : Retakaful contribution ceded
On individual life first year business 12 307 – 12 307 13 822 4 262 3 204 On individual life second year business 8 209 – 8 209 – 2 417 – On individual life renewal year business 2 053 – 2 053 – 1 171 – On group policies – 21 788 21 788 10 828 9 883 ( 997 )
Total retakaful contribution ceded 22 569 21 788 44 357 24 650 17 733 2 207
Net Risk Contribution of PTF 37 618 102 367 139 985 43 284 60 003 20 932
12.3.3 Shareholders' Sub-FundUnallocated regular contribution 378 499 – 378 499 238 389 144 123 76 073
Rupees ‘000
Nine months ended30 September
201730 September
2016
Three months ended30 September
201730 September
2016
Aggregate
Shareholders' Sub-FundRemuneration to insurance intermediaries
on individual policies:– commission on first year Contribution 213 787 – 213 787 143 185 80 352 43 432– commission on second year Contribution 20 302 – 20 302 7 229 6 987 4 156
– commission on subsequent renewal 1 679 – 1 679 – 1 160 –– commission on single Contribution 22 124 – 22 124 33 584 8 653 7 418– override commission 36 845 – 36 845 20 849 13 696 9 081– other benefits to insurance intermediaries 101 773 – 101 773 71 838 23 559 26 434
396 510 – 396 510 276 685 134 407 90 521Remuneration to insurance intermediaries
on group policies:– Commission – 24 483 24 483 1 381 9 716 647– other benefits to insurance intermediaries – 1 250 1 250 1 000 326 318
Branch overheads 44 532 – 44 532 25 112 17 233 7 245Other acquisition costs
– policy stamps 9 459 – 9 459 478 3 469 164Total acquisition cost 450 501 25 733 476 234 304 656 165 151 98 895Administration expensesSalaries and other benefits 56 870 1 992 58 862 26 149 20 933 8 230Travelling expenses 1 753 52 1 805 1 045 660 358Cede money-Waqf – – – – – –Actuary's fees 1 134 – 1 134 452 378 152Medical fees 309 – 309 421 55 60Legal and professional fee 6 374 1 556 7 930 2 777 4 644 1 142Advertisements and publicity – – – 523 2 106Computer expenses 1 836 1 1 837 678 429 232Printing and stationery 6 306 49 6 355 1 233 1 237 254Depreciation 12 510 20 12 530 1 338 4 323 398Amortisation 1 243 – 1 243 440 421 137Rental 726 53 779 1 488 279 831Postage 5 445 1 5 446 2 847 1 632 674Fees and subscription 10 723 59 10 782 925 6 009 765Other management expenses 19 485 231 19 716 7 950 6 197 2 485Commission from Reinsurance ( 5 230 ) – ( 5 230 ) – ( 1 827 ) 4 752Fees charged to policy holder ( 59 ) – ( 59 ) ( 6 ) – ( 3 )Net Management Expenses 569 926 29 747 599 673 352 916 210 523 119 468
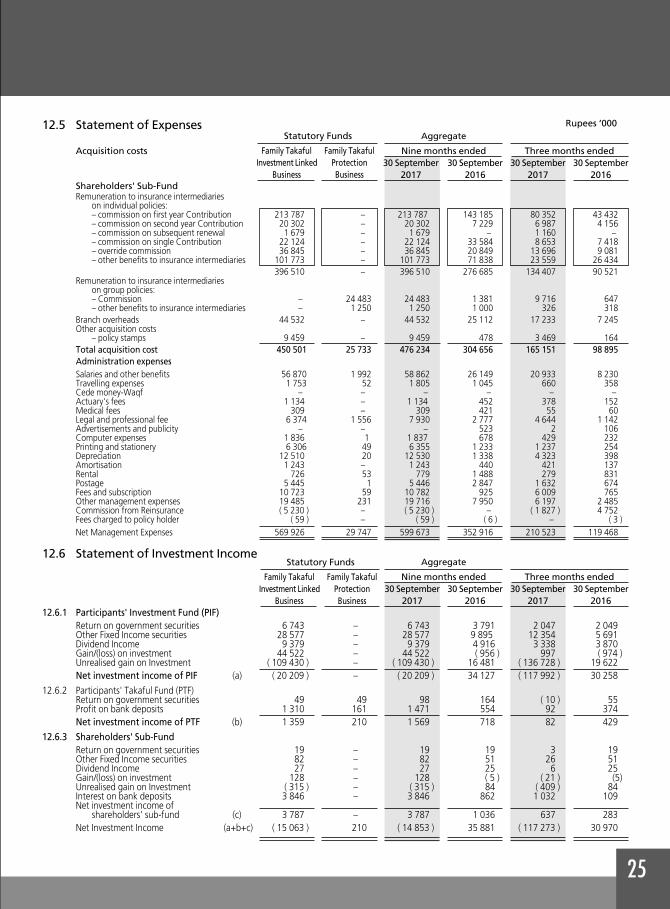
12.5 Statement of Expenses
Acquisition costs Family TakafulInvestment Linked
Business
Family TakafulProtectionBusiness
Statutory Funds
Nine months ended30 September
201730 September
2016
Three months ended30 September
201730 September
2016
Aggregate12.6 Statement of Investment Income
Family TakafulInvestment Linked
Business
Family TakafulProtectionBusiness
Statutory Funds
12.6.1 Participants' Investment Fund (PIF)Return on government securities 6 743 – 6 743 3 791 2 047 2 049Other Fixed Income securities 28 577 – 28 577 9 895 12 354 5 691Dividend Income 9 379 – 9 379 4 916 3 338 3 870Gain/(loss) on investment 44 522 – 44 522 ( 956 ) 997 ( 974 )Unrealised gain on Investment ( 109 430 ) – ( 109 430 ) 16 481 ( 136 728 ) 19 622Net investment income of PIF (a) ( 20 209 ) – ( 20 209 ) 34 127 ( 117 992 ) 30 258
12.6.2 Participants' Takaful Fund (PTF)Return on government securities 49 49 98 164 ( 10 ) 55Profit on bank deposits 1 310 161 1 471 554 92 374Net investment income of PTF (b) 1 359 210 1 569 718 82 429
12.6.3 Shareholders' Sub-FundReturn on government securities 19 – 19 19 3 19Other Fixed Income securities 82 – 82 51 26 51Dividend Income 27 – 27 25 6 25Gain/(loss) on investment 128 – 128 ( 5 ) ( 21 ) (5)Unrealised gain on Investment ( 315 ) – ( 315 ) 84 ( 409 ) 84Interest on bank deposits 3 846 – 3 846 862 1 032 109Net investment income of
shareholders' sub-fund (c) 3 787 – 3 787 1 036 637 283Net Investment Income (a+b+c) ( 15 063 ) 210 ( 14 853 ) 35 881 ( 117 273 ) 30 970

EFU LIFE ASSURANCE LTD
13.
FAIR
VA
LUE
MEA
SUR
EMEN
TIn
vest
men
ts o
n th
e ba
lanc
e sh
eet
are
carr
ied
at f
air
valu
e ex
cept
for
inve
stm
ents
in n
on u
nit-
linke
d fu
nds
whi
ch a
re s
tate
d at
low
er o
f co
st o
rm
arke
t va
lue
and
unqu
oted
inve
stm
ents
whi
ch a
re s
tate
d at
cos
t. T
he C
ompa
ny is
of
the
view
tha
t th
e fa
ir va
lue
of t
he r
emai
ning
fin
anci
al a
sset
san
d lia
bilit
ies
are
not
sign
ifica
ntly
diff
eren
t fr
om t
heir
carr
ying
val
ues
sinc
e as
sets
and
liab
ilitie
s ar
e es
sent
ially
sho
rt t
erm
in n
atur
e.Th
e C
om
pan
y m
easu
res
fair
val
ues
usi
ng
th
e fo
llow
ing
fai
r va
lue
hie
rarc
hy
that
ref
lect
s th
e si
gn
ific
ance
of
the
inp
uts
use
d in
mak
ing
th
em
easu
rem
ents
:Le
vel 1
: Fai
r va
lue
mea
sure
men
ts u
sing
quo
ted
pric
es (u
nadj
uste
d) in
act
ive
mar
kets
for
iden
tical
ass
ets
or li
abili
ties.
Leve
l 2:
Fair
valu
e m
easu
rem
ents
usi
ng in
puts
oth
er t
han
quot
ed p
rices
incl
uded
with
in L
evel
1 t
hat
are
obse
rvab
le f
or t
he a
sset
or
liabi
lity,
eith
erdi
rect
ly (i
.e. a
s pr
ices
) or
indi
rect
ly (i
.e. d
eriv
ed f
rom
pric
es).
Leve
l 3: F
air
valu
e m
easu
rem
ents
usi
ng in
puts
for
the
ass
et o
r lia
bilit
y th
at a
re n
ot b
ased
on
obse
rvab
le m
arke
t da
ta (i
.e. u
nobs
erva
ble
inpu
ts).
The
tabl
e be
low
ana
lyse
s fin
anci
al in
stru
men
ts m
easu
red
at t
he e
nd o
f th
e re
port
ing
perio
d by
the
leve
l in
the
fair
valu
e hi
erar
chy
into
whi
ch t
hefa
ir va
lue
mea
sure
men
t is
cat
egor
ized
:
(Rup
ees
'000
)
Not
eAv
aila
ble
for
HFT
HTM
Loan
s and
Oth
erOt
her
Tota
lLe
vel 1
Le
vel 2
Leve
l 3To
tal
Sale
Rece
ivabl
esfin
ancia
lfin
ancia
las
sets
liabi
litie
sOn
bal
ance
shee
t fin
ancia
l instr
umen
tsFin
ancia
l asse
ts m
easu
red
at fa
ir valu
e– I
nves
tmen
tsGo
vern
men
t Sec
uritie
s (Tb
ills +
PIBs
+ Su
kuks
)47
144
744
–
–
–
–
–
4
7 14
4 74
4–
4
7 14
4 74
4 –
4
7 14
4 74
4Su
kuk B
onds
(oth
er th
an g
over
nmen
t) 5
13 2
56
–
–
–
–
–
513
256
513
256
–
5
13 2
56Lis
ted
equit
y sec
uritie
s 3
4 73
4 57
6 1
00 3
31
–
–
–
–
34
834
907
34
834
907
–
–
34
834
907
Units
of m
utua
l fund
s 1
15 4
35
–
–
–
–
–
115
435
115
435
–
1
15 4
35De
bt se
curit
ies (L
isted
TFCs
) 2
09 2
92
–
–
–
–
–
209
292
209
292
–
2
09 2
92Fin
ancia
l asse
ts no
t mea
sure
d at
fair v
alue
– Gov
ernm
ent S
ecur
ities (
Tbills
+ PI
Bs +
Suku
ks)
–
–
3 1
93 6
13
–
–
–
3 1
93 6
13–
3
434
595
–
3
434
595
– Unli
sted
equit
y sec
uritie
s 5
08
–
–
–
–
–
508
–
–
508
5
08– B
alanc
es w
ith b
anks
*–
–
1
6 90
1 56
9 –
–
1
6 90
1 56
9–
–
–
–
– Cer
tifica
te o
f Inve
stmen
t–
–
2
10 0
00
–
–
210
000
–
–
–
–– A
dvan
ces
–
–
–
94
989
987
002
–
1 0
81 9
91–
–
–
–
– List
ed eq
uity s
ecur
ities a
nd m
utua
l fund
unit
s
(at lo
wer o
f cos
t or m
arke
t valu
e) 1
154
258
–
–
–
–
–
1
154
258
1 8
34 4
47
–
–
1 8
34 4
47– O
ther
asse
ts (ex
cludin
g m
arku
p ac
crued
)*–
–
–
9
56 3
91
–
956
391
–
–
–
– 8
3 87
2 06
9 1
00 3
31
3 1
93 6
13 1
7 20
6 55
8 1
943
393
–
10
6 31
5 96
4 3
7 39
1 90
2 5
0 69
4 77
4 5
08
88
087
184
Finan
cial li
abilit
ies n
ot m
easu
red
at fa
ir valu
e– D
epos
its an
d ot
her a
ccou
nts *
–
–
–
–
–
–
–
–
–
–
–– B
orro
wing
s–
–
–
–
–
–
–
–
–
–
– Liab
ilities
again
st as
sets
subje
ct to
finan
ce le
ase
–
–
–
–
–
–
–
–
–
–
–– S
ub -
ordin
ated
loan
s–
–
–
–
–
–
–
–
–
–
–
– Oth
er lia
bilitie
s (ex
cludin
g Lia
bilitie
s aga
inst
–
–
a
ssets
subje
ct to
finan
ce le
ase)
*–
–
–
–
–
3
578
926
3
578
926
–
–
–
––
–
–
–
–
3
578
926
3
578
926
–
–
–
– 8
3 87
2 06
9 1
00 3
31
3 1
93 6
13 1
7 20
6 55
8 1
943
383
( 3
578
926
)102
737
038
37
391
902
50
694
774
508
8
8 08
7 18
4
30 S
epte
mbe
r 20
17Fa
ir va
lue
(Rup
ees
'000
)
Not
eAv
aila
ble
for
HFT
HTM
Loan
s and
Oth
erOt
her
Tota
lLe
vel 1
Le
vel 2
Leve
l 3To
tal
Sale
Rece
ivabl
esfin
ancia
lfin
ancia
las
sets
liabi
litie
s
On b
alan
ce sh
eet f
inan
cial in
strum
ents
Finan
cial a
ssets
mea
sure
d at
fair
valu
e- I
nves
tmen
tsGo
vern
men
t Sec
uritie
s (Tb
ills +
PIBs
+ Su
kuks
) 4
5 40
4 99
4 –
–
–
–
–
4
5 40
4 99
4 –
4
5 40
4 99
4 –
4
5 40
4 99
4Su
kuk B
onds
(oth
er th
an g
over
nmen
t)1
192
326
–
–
–
–
–
1 1
92 3
26
–
1 1
92 3
26
–
1 1
92 3
26Lis
ted
equit
y sec
uritie
s36
230
825
4
59 2
46
–
–
–
–
36
690
071
36
690
071
–
–
36
690
071
Units
of m
utua
l fund
s51
1 78
3 –
–
–
–
–
5
11 7
83
–
511
783
–
511
783
Debt
secu
rities
(List
ed TF
Cs)
173
185
–
–
–
–
–
173
185
1
73 1
85
–
–
173
185
Finan
cial a
ssets
not m
easu
red
at fa
ir valu
e- G
over
nmen
t Sec
uritie
s (Tb
ills +
PIBs
+ Su
kuks
) –
–
3
465
074
–
–
–
3
465
074
–
3
492
212
–
3
492
212
- Unli
sted
equit
y sec
uritie
s50
8 –
–
–
–
–
5
08
–
–
508
5
08- B
alanc
es w
ith b
anks
* –
–
–
12
391
210
–
–
1
2 39
1 21
0 –
–
–
–
- Cer
tifica
te o
f Inve
stmen
t –
–
–
2
10 0
00
–
–
210
000
–
–
–
–
- Adv
ance
s –
–
–
9
1 91
2 1
782
633
–
1
874
545
–
–
–
–
- List
ed eq
uity s
ecur
ities a
nd m
utua
l fund
unit
s
(at lo
wer o
f cos
t or m
arke
t valu
e)1
183
242
–
–
–
–
–
1 1
83 2
42
1 9
95 9
95
–
–
1 9
95 9
95- O
ther
asse
ts (ex
cludin
g m
arku
p ac
crued
)* –
–
–
–
2
162
060
–
2
162
060
–
–
–
–
84
696
863
459
246
3
465
074
12
693
122
3 9
44 6
93
–
105
258
998
38
859
251
50
601
315
508
8
9 46
1 07
4
Finan
cial li
abilit
ies n
ot m
easu
red
at fa
ir valu
e- D
epos
its an
d ot
her a
ccou
nts *
–
–
–
–
–
–
–
–
–
–
–- B
orro
wing
s –
–
–
–
–
–
–
–
–
–
–
- Liab
ilities
again
st as
sets
subje
ct to
finan
ce le
ase
–
–
–
–
–
–
–
–
–
–
–- S
ub -
ordin
ated
loan
s –
–
–
–
–
–
–
–
–
–
–
- Oth
er lia
bilitie
s (ex
cludin
g Lia
bilitie
s aga
inst
a
ssets
subje
ct to
finan
ce le
ase)
* –
3
202
234
3
202
234
–
–
–
–
–
–
–
–
–
3 2
02 2
34
3 2
02 2
34
–
–
–
– 8
4 69
6 86
3 4
59 2
46
3 4
65 0
74 1
2 69
3 12
2 3
944
693
(3
202
234)
102
056
764
38
859
251
5
0 60
1 31
5 5
08
89
461
074
31 D
ecem
ber
2016
Fair
valu
e
13.1
*Th
e C
om
pan
y h
as n
ot
dis
clo
sed
th
e fa
ir v
alu
es f
or
thes
e fi
nan
cial
ass
ets
and
liab
iliti
es,
as t
hes
e ar
e fo
r sh
ort
ter
m o
r re
pri
ce o
ver
sho
rt t
erm
.Th
eref
ore,
the
ir ca
rryi
ng a
mou
nts
are
reas
onab
le a
ppro
xim
atio
n of
fai
r va
lue.

Karachi 28 October, 2017
EFU LIFE ASSURANCE LTD
14 GENERAL
14.1 Corresponding figures have been rearranged and reclassified, wherever necessary, to facilitate comparison. However,there are no material reclassifications to report.
14.2 Figures have been rounded off to the nearest thousand of rupees, unless otherwise stated.
15. DATE OF AUTHORIZATION FOR ISSUE
These condensed interim financial information were authorized for issue by the Board of Directors of the Company intheir meeting held on 28 October 2017.
HASANALI ABDULLAH SAIFUDDIN N. ZOOMKAWALA SYED SHAHID ABBAS TAHER G. SACHAK RAFIQUE R. BHIMJEEDirector Director Chief Financial Managing Director & Chairman
Officer Chief Executive