safta and implications for pakistan - cuts citee · saarc south asian association for regional...
TRANSCRIPT

* Director General, Foreign Trade Institute of Pakistan; Email: [email protected]
This paper is written under a research grant from the Economic Affairs Division of the
Commonwealth Secretarial, London to CUTS International, Jaipur. Views expressed in this
paper are those of the author and not necessarily reflect those of their institutions and of the Commonwealth Secretariat and CUTS International.
Revised Draft
SAFTA and Implications for Pakistan
Safdar A. Sohail*

ii
Table of Content 1. Introduction .................................................................................................................1
2. Trade Structure of Pakistan ..........................................................................................6
2.1 Pakistan Economy At the Dawn of 2008 ................................................................6
2.2 Export Profile of Pakistan ......................................................................................8
3. Pakistan’s Trade with SAARC Members ................................................................... 11
3.1. Pakistan-Bangladesh Trade ................................................................................. 12
3.2. Pakistan’s Trade Potential [2006]........................................................................ 14
3.3. Pakistan and India Trade Analysis....................................................................... 16
3.4. Pakistan – Sri Lanka Trade Analysis ................................................................... 25
3.5. Trade between Pakistan and Rest of South Asia .................................................. 28
4. Recommendations...................................................................................................... 35
4.1. Domestic Reform with Regional Imperatives ...................................................... 36
4.2. Domestic Preparedness ....................................................................................... 37
4.3. Political Will....................................................................................................... 37
4.4. Need to enhance Efficiency in Exports................................................................ 37
4.5. Profit Shifting from International Firms to Regional Firms.................................. 37
4.6. Textile Vision for SAARC: South Asia as a Textile and Apparel Hub................. 38
4.7. Trans-Frontier Cooperation ................................................................................. 38
4.8. Research Support for SAFTA.............................................................................. 39
4.9. Strengthening Regional Identity .......................................................................... 39
4.10 Overcoming the Difficulties in Enhancing the Cooperation
between the Agricultural Sectors................................................................................ 39
4.11. Learning from the History of South-South Cooperation..................................... 40
4.12. Need to Bring the Regional Firms at the Centre Stage ....................................... 40
5. Regionalism vs Multilateralism: Choices for Pakistan................................................ 41
Annexure I..................................................................................................................... 46

iii
List of Tables
Table 1: Major Export Markets (percentage share)........................................................ 9
Table 2: Pakistan’s Major Exports (percentage share) ................................................... 9
Table 3: Pakistan’s Major Imports (Percentage share)................................................. 10
Table 4: By Main Commodity Group (ITS) ................................................................ 10
Table 5: Pakistan’s Percentage Share in South Asian Countries Imports and Exports.. 11
Table 6: Pakistan-Bangladesh Trade Flows................................................................. 12
Table 7: Pakistan and Bangladesh Trade in Perspective (2006) ................................... 12
Table 8: Pakistan Top twenty Imports and Exports from Bangladesh 2006 ................. 13
Table 9: Pakistan India Trade Flows ........................................................................... 16
Table 10: Pakistan and India Trade in Perspective 2006.............................................. 16
Table 11: Top Twenty Exporting Countries to India ................................................... 17
Table 12: Ranking of Top Twenty Countries According to Year 2005-2006 ............... 17
Table 13: Main Indicators of Pakistan’s Trade with India ........................................... 18
Table 14: Pakistan Top Twenty Imports and Exports from India................................. 18
Table 15: Pakistan India Indicative Potential Trade..................................................... 19
Table 16: Pakistan-Sri Lanka Trade ............................................................................ 25
Table 17: Pakistan Sri Lanka Indicative Potential Trade ............................................. 25
Table 18: Pakistan and Rest of South Asia .................................................................. 28
Table 19: Pakistan and Nepal Trade in Perspective .................................................... 28
Table 20: Pakistan Nepal Indicative Potential Trade ................................................... 29
Table 21: Pakistan and Maldives in Perspective 2006 ................................................. 31
Table 22: Pakistan Maldives Indicative Potential Trade .............................................. 31
Table 23: Pakistan and Bhutan – Trade in Perspective 2006........................................ 33
Table 24: Pakistan Bhutan Indicative Potential Trade ................................................. 34

iv
Acronyms
BoP Balance of Payment
CECA Comprehensive Economic Co-operation Agreement
CEPA Comprehensive Economic Partnership Agreement
DDA Doha Development Agenda
ECO Economic Cooperation Organisation
FDI Foreign Direct Investment
FTA Free Trade Agreement or Free Trade Area
GSP Generalised System of Preferences
LDCs Least Developed Countries
M&As Mergers and Acquisitions
MFN Most Favoured Nation
MoP Margin of Preference
MTS Multilateral Trading System
NAFTA North American Free Trade Area
NTBs Non-tariff Barriers
OIC Organisation of Islamic Conference
PRoO Preferential Rules of Origin
PTA Preferential Trade Agreement
RoO Rules of origin
RTAs Regional Trade Agreements
SAARC South Asian Association for Regional Cooperation
SAFTA South Asia Free Trade Agreement
SAPTA South Asian Preferential Trade Agreement
TBT Technical Barriers to Trade
WTO World Trade Organisation

1
1. Introduction
With the winds of globalization blowing all over, the phenomenon of regioanlism appears to have caught up with every country, in all parts of the world, especially in the domain of trade, irrespective of the size and form of the economy. Regional Trade Agreements [RTAs] are becoming a conduit as well as national/ regional response to the forces of change and flux. As a result, more than 56 percent of international trade at present is covered under RTAs, which are becoming increasingly deep and comprehensive and are providing institutional arrangements of integration beyond the economic integration. This complex phenomenon has raised many pertinent questions not only for the future of national trade polices but also for the geo-strategic importance of trade integration in the regional context. We propose to study this phenomenon, in case of Pakistan, a middle sized country and economy situated in the north western expanse of Indian sub-continent through its membership of South Asian Free Trade Area (SAFTA), which was launched in 2006, amid a lot of fanfare. We hope that our study would be able to throw some light, particularly on the following aspects of regionalism in case of Pakistan:
(i) Can SAFTA become an instrument of choice of trade liberalisation better suited and manageable in harnessing the process for pro-poor development for Pakistan and from Pakistan’s perspective?
(ii) In what sense can SAFTA process become a defining element of a new architecture of the global trading system?
(iii) Being at the confluence of three regions and a neighbour of two large, fast moving economies of the world, how would Pakistan exercise her options in this continuous interplay between integration and distinction, in almost all the crucial aspects of her body politic?
We hope our analysis of Pakistan’s reactions and role in the flux of globalisation through SAFTA would not only help us see Pakistan perspectives on SAFTA and the trade potential offered by SAFTA to Pakistan but also on the issues of integration and preservation of national interest in the South Asian context.
Improving market access conditions and institutional strengthening of trade relations with her major trading partners has been long term policy objectives for Pakistan as it would be with any other country. Pakistan has been actively involved in non-agricultural market access (NAMA) negotiations since long now. Pakistan actually has been forced, as noted by the official report produced by the World Trade Organisation (WTO) Secretariat for Pakistan’s Trade Policy Review 2008 Report on Pakistan into regional arrangements. ‘’Pakistan's agreements appear to be largely in response to their global proliferation’’, Report maintains and further asserts that successfully concluding the Doha Round could help stem Pakistan's drift to preferential trade liberalisation, thereby potentially strengthening the multilateral system and facilitating its unilateral reforms.
1
Pakistan’s official position therefore tries to balance between Pakistan’s commitment to multilateral trade liberalisation and regional integration. While asserting that Pakistan fully believes in the multilateral trading system (MTS), it is also cognizant of the proliferation of regional and bilateral Preferential Trading
1 WTO Trade Policy Review for Pakistan, issued mid-January 2008. See WTO website; www.wto.org/english/tratop_e/tpr_e/tp293_e.htm) PRESS/TPRB/293
2
Arrangements (PTAs), especially when some of these arrangements could place Pakistani exporters at a disadvantageous position vis-à-vis their competitors.2 Over the last few years Pakistan has either finalised or is close to finalise several trade agreements and is also exploring the possibility of such deals with many more economic blocks and countries. The apparent impression one gets in this regard is that Pakistan is ‘big’ on RTAs.3 But the fact is that most of these RTAs are shallow and have limited coverage. It is a beginning in case of many agreements with the possibility that they would one day cover substantial trade. Therefore, it is too early to foresee the results of these initiatives and their linkage and/or effect with SAFTA. Pakistan appears to be open to mutually beneficial, trade creating arrangements, including SAFTA but the final outcomes of these different initiatives, as one can expect, would depend on a large number factors, internal as well as external to SAFTA process. We hope this general and ‘introductory’ effort at delineating Pakistan’s perspectives on SAFTA would contribute to the ongoing debate in Pakistan and elsewhere on the merits of regional cooperation.
SAFTA is unfolding in a region, which is also struggling with historical prejudices and seemingly intractable inter-state, inter-ethnic, communal, sectarian and class conflicts. International trade and integration are the new mantras, especially in case of fast growing Indian economy, summed up in the oft-repeated cliché that Indian growth is good for the world.4 Being the largest economy in South Asia, the Indian perspective would be the most consequential for the future of South Asia if it would succeed or like to have one. But in the Indian context, the international trade integration has not always been considered a boon as it was presumed to bring invaders along too. Even now there are potent protectionist voices, of all hues, against a whole hog opening of Indian economy. In this fluid situation, the most important aspect for Pakistan in the SAFTA process is SAFTA’s usefulness as an instrument to reduce historically rooted conflicts in the region, as was suggested by Indian themselves when they wanted trade to be given a chance over politics.
5
Indian sub-continent historically has been a store house of Ideas and Spices. But in most of the cases, instead of taking them to others, other would come to them to take these, wherefrom a love and hate relation with ‘foreigners’ and the emergence of a social science of interaction with the ‘Other’. The dominant paradigm in traditional India was an insistence on valuing the local. Can this ethos transform itself into a regional identity balancing the local, regional and global? It would involve a conscious effort by big and small in South Asia, starting with serious attempts to realise the trade potential offered by SAFTA in the preset form and in making it a dynamic driver of positive social change and development for the poor and vulnerable across South Asia. Pakistan’s role and interest in realising the promise of SAFTA would be important, though not as central and crucial as of India.
Trade links within the geographical expanse of South Asia are not a new phenomenon. These links date back as far as our recorded economic history can recall and communicate. In the context of Pakistan, the famous silk route tells many stories of traders’ activity. With the emergences of independent nation-states in the 1940s, political
2 Pakistan’s Minister of Commerce’s Trade Policy speech 2007-08 www.commerce.gov.pk 3 FTA Watch, www.ftawatch.org 4 Chairperson’s concluding remarks (May 23, 2007: Trade Policy Review: India) 5 Chepanag, Bidana, 1999, The IDSA Journal, New Delhi

3
considerations largely cancelled out the proximity factor. Almost all the states in South Asia also favoured import substitution thus creating more of a protectionist trade regime, with very low levels of intra-regional trade due to homological production structures. But the South Asian economies do not only share the same production patterns, they share something even more important: all of them have the problems of endemic poverty, rampant ignorance and yawning in-equality. The keenness displayed by South Asian countries in embracing globalisation and opening up their economies for the last two decades has unleashed new dynamics touching all the aspects of life. The proposition of crafting a regional solution for the endemic problems of South Asia through South Asian Association of Regional Cooperation (SAARC) coincided with this openness to reform. In a way, it was one of the manifestations of reform mindedness, which grew more ambitious when South Asian Preferential Trade Agreement (SAPTA) was transformed into SAFTA.
South Asia is home to 22 percent population of world and is considered an important actor in international geo-politics due to its strategic location, sheer size of population, potentially a big consumer market, and due to the variety and abundance of natural resources. But the share of South Asia in world GDP and global trade is two percent and one percent respectively. A better understanding of SAARC economies and will to find complementarities and synergies among the economies and the people of South Asia from the platform of SAFTA can enable South Asia, theoretically, to enhance this contribution as well as the geo-strategic weight of South Asia as a Region. There is no unanimous voice in Pakistan on the promise and potential of SAFTA as a trade agreement in the limited sense or as a stepping stone towards a South Asian century. The academic literature on different aspects of SAFTA has just started coming out in Pakistan but there are sufficient materials around to allow us to present a typology of perceptions and positions on SAFTA process in Pakistan.
Some articles and government reports in Pakistan have tried to analyse the reasons for the traditional patterns of trade flows of Pakistan. The interest in regional trade flows was engendered due to SAPTA and SAFTA but still there is a relative dearth of research literature on studies at micro (product/firm), and meso (sectoral) levels. Most of the available work is general in nature. After pointing out to the proverbial unavailability of data as their main concern, these works usually begin and end with the trend analyses of available statistics.6
The available commentaries on the SAARC trade integration, could be divided in four categories: the technicists, optimists, pessimists and the realists. The tecnicist approach7 is shared by many researchers in different countries of South Asia. These authors try to identify the technical reasons for the under-performance of SAFTA e.g., the structural and policy-induced factors such as lack of political commitment, big sensitive lists, absence of deep enough tariff cuts, restrictive trade policies, lack of finances, lack of exportable surpluses, lack of complementarities and identical comparative advantage etc.8 As expected, these authors present the well known solutions, popular with the
6 Recently, some organisations such as Sustainable Development Policy Institute, Pakistan have started generating separate data on SAFTA trade, which will be helpful in the coming years. www.sdpi.org 7 This type of approach is used by the researcher using different modelling techniques 8 Kemal, A. R., Exploring Pakistan’s Regional Cooperation Potential; Identical Comparative Advantage and Lack of Trade Complementarities, http://www.pide.org.pk/pdf/psde20AGM/EXPLORING%20PAKISTANS%20REGIONAL%20ECONOMIC%20COOPERATION%20POTENTIAL.pdf

4
majority of the South Asian researchers i.e., smaller sensitive list, strategic cooperation in light engineering sector, relaxing rules of origin (RoO), and commitment of not using anti-dumping and countervailing duties as protective mechanisms etc. Such works take RTAs merely as tools of market access and concern principally with the increase or decrease in trade flows.
Pakistan’s role and prospects in SAFTA has been a subject for foreign researchers too. In an often quoted work, ‘Impacts of the South Asia Free Trade Agreement’, Elizabeth Krueger, Rossana Cecilia Bastos Pinto, and Valarie Thomas Tristan, analysed the impacts of SAFTA declaring it as ‘one path toward trade liberalisation, welfare gains, and economic growth for the seven countries in the South Asia region’. The paper takes a largely pessimistic view on the possible achievements of SAFTA goals, declaring, ‘successful implementation and large welfare gains are therefore unlikely to be realised under this agreement’ and asserting that SAFTA will be a trade-diverting, efficiency-reducing agreement, leaving some of the countries worse off’. Last but not the least, while commenting on the situation of not providing mutually benefiting concessions under SAFTA on the products of trade-interests of members countries, the authors remark, ‘as political tensions between India and Pakistan have rekindled, the countries of South Asia are likely to achieve greater economic success through bilateral trade agreements’.
In ‘How Desirable is the South Asian Free Trade Area?-A Quantitative Economic Assessment’, Jayatilleke S Bandara and Wusheng Yu (2001), have addressed the question of desirability of SAFTA and put forward an economic argument for it. While evaluating the preferential trade outcomes under SAPTA, the authors quote Mukherji (2000) who had estimated that the region’s total preferential imports amounted to about US$479.8mn, nearly half of which went to Pakistan. With 26 percent and 16 percent share of India and Sri Lanka. In addition, Mukherji has also estimated percentages of each member country’s total preferential imports in terms of its total regional imports. Pakistan has the highest coverage of preferential imports (about 40 percent), followed by Nepal (35 percent), India (30 percent), Bhutan (17 percent) and Sri Lanka (12 percent). While analysing the conditions, which hamper trade within the region, especially the role of Pakistan, the authors suggest that South Asia may gain more from unilateral or multilateral liberalisation than from SAFTA.
‘The experience of last 15 years demonstrates that it is very difficult to achieve a meaningful regional cooperation in economic and social matters in South Asia without proper resolutions of political conflicts between member countries. Since 1999 the member countries could not meet at a SAARC summit because of political conflict, which seems to jeopardise the formation of SAFTA before the end of 2001. In this environment, some member countries in the region have chosen another option, i.e., entering into bilateral trade agreements’ write the authors of “How Desirable is the South Asian Free Trade Area”?
There have been however some works which are more optimistic about the SAPTA/SAFTA process. The optimists in Pakistan are exemplified by Burki, who asserts that ‘’of all the economies in South Asia, Pakistan will feel the impact of the successful launch of the SAFTA most strongly by gaining in several ways such as with SAFTA, the share of trade in Pakistan’s GDP will increase, foreign direct investment (FDI) will increase, the structure of the economy will change, long-term growth prospects will improve, the incidence of poverty will decline, and the quality of the legal system will
5
improve.9 Burki bases his optimism on his belief that the history will repeat itself by the rediscovery of trade independence, which Pakistan and India had in the British rule. Burki sees Pakistan’s past trade policies failing in what he terms Pakistan’s relative neglect of agriculture sector and becoming a food-deficit country and not trying to develop transportation mechanisms and relying on industrialisation instead. Asserting that Pakistan was the most open economy in South Asia and was receptive to foreigners and foreign ideas, Burki is hopeful that Pakistan should be able to increase its exports 10 percent a year over the next 10 years with its South Asian neighbours, including Afghanistan. Burki’s confidence and optimism from SAARC process is underpinned by his hope that the region would embrace wider reform and economic integration in a true spirit, would be able to put the history behind itself by embracing softer borders and would give the integration process a chance to reduce poverty, improve the services sector, ensure better energy related linkages, improve transit trade facilities and help in an across the board development of human resources in South Asia.
Burki wrote the above quoted text in 1996. Ten years down the road, the pessimists are gaining ground as the composite dialogue between the two major countries of the South Asia i.e., India and Pakistan is apparently moving at a snails pace, in the common perception and the trade deficit between the two countries is tilting more and more in India’s favour. The pessimists of SAFTA process appear in different hues. There are some for whom the economic case for SAFTA is quite week, citing the reasons such as the presence of high levels of protection in the region and the tendency of the member countries to establish highly restrictive ‘sectoral exceptions/sensitive lists’ and stringent ‘RoO’.10 A large number of researchers believe that the SAFTA process depends on the improvement of political and trade relations between India and Pakistan essentially and they do not see it improving in the short term at least.11 Many of such researchers question the ‘peace dividend’ argument and maintain that easing of political tensions between India and Pakistan should not be treated under SAFTA at all. Mostly such voices come from India and end up suggesting that India and Pakistan should move to most-favoured nation (MFN) based trade in order to make most of the SAFTA.12
Such a line of thinking, effecting a disconnect between trade and a comprehensive peace between India and Pakistan, is used by the Pakistani researchers who insist that that India was never really interested neither in solving the outstanding political issues nor in developing a strong regional trade block built on mutual benefits. Such a thinking, usually coming from the Chambers of Commerce and Industry and many independent analysts would like the reader believe that India was merely interested in establishing a hub and spoke system in South Asia.13 Lately, some studies have appeared, which can be termed as ‘realist’, such as the State Bank of Pakistan Report on the “Implications of Liberalising Trade and Investment with India”, (SBP, 2005).14 Predicting that Pakistan could benefit from trading with India, with imports mopping up net savings ranging from US$400-
9 Burki, South Asian Free Trade Area – Opportunities and Challenges; Potential of the South Asian Free Trade Area, http://pdf.dec.org/pdf_docs/PNADE563.pdf 10‘ Preferential Trading in South Asia’, a background paper on the merits of the SAFTA Agreement, Baysan, Panagariya, and Pitigala (2006), 11 Munir, SAFTA for Pakistan, 2007, Lahore, Chamber of Commerce and Industry. 12 Gumman & Madan, India Pakistan Trade Cooperation and SAARC in Peace and Democracy in South Asia, Volume 2, Number 1 & 2, 2006 13 Op. Cite, pp.5 14 State Bank of Pakistan; Implications of Liberalising Trade and Investment with India http://www.sbp.org.pk/publications/pak-india-trade/index.htm
6
900mn with bilateral trade volume going as high as US$5.2bn in five years, the study identifies that about 70.3 percent of the common items exported from Pakistan have unit values less or equal to Indian imports' unit values and there is a large scope for export of those items simply by producing the quality required in India. The SBP study also identifies that India currently earns US$15bn of export revenue from 2,646 common items being imported by Pakistan from other countries and analyses that in 2004 the unit value for Pakistan's imports were more than unit value of Indian exports in 48.7 percent of these items. 45 percent of those common imports were still not a part of Pakistan positive list and Pakistan could benefit by gradually removing restrictions on these items. SBP reports cautiously suggests that more opening to Indian economy can still be beneficial to Pakistan contrary to the increasingly noisy voices hinting at the worsening trade deficit between India and Pakistan and the nefarious impact of ‘cheap’ Indian imports on Pakistan’s local industry. The realist approach actually suggests a cautious but positive approach to SAFTA to derive as much benefit as it could offer without having ambitious notions about the SAFTA process.
The above survey shows that the researchers in the region are divided on the possible impact of the SAFTA on different economies of the region, in this particular case, on Pakistan and differ also about the possible causes and probable solutions. This is but natural as liberalising trade regimes is seldom a neutral process nor is it easy to foresee how it would impact the economic and social structures, the people involved in such systems, and also the consumers of the produce. In this county case study, we have tried to study the implications of SAFTA for Pakistan with help of available data, relevant analyses and interaction with the principle stakeholders. We have especially focused on the nature of Pakistan’s trade links with its neighbours, highlighting the indicative trade potential for Pakistan under SAFTA. Towards the end we have presented Pakistani perspectives on the larger issues involved in the debate between regionalism and multilateralism and have presented recommendations on the issues of critical importance for the success of SAFTA as an effective tool for trade led development in Pakistan and South Asia.
2. Trade Structure of Pakistan
2.1 Pakistan Economy At the Dawn of 2008
Pakistan economy has registered an impressive growth over the last many years. GDP has grown at a rate of over 6 annually with real per capita income rising at a rate of 4.7 percent, from 2001-02 to 2006-07. Per capita income at constant prices of 1999-2000 has increased from US$503 in 2001-02 to US$925 in 2006-07. The share of industrial sector during this has increased in GDP from 23.7 percent to 25.8 percent; that of services from 52.1 percent to 53.3 percent while that of agriculture declined from 24.1 percent to 20.9 percent. This rapid growth of GDP in Pakistan owes a great deal to the sharp growth in the manufacturing sector resulting from demand stimulus from higher incomes, and relaxation of banking restriction on consumer credit. Higher levels of exports and higher level of investment have also contributed to this growth. The main contribution in services sector, which grew at an average of 7 percent, has come from financial and telecommunication sectors. There has been a sharp increase in foreign remittances by Pakistanis working abroad, from US$1bn in 2001-02 to US$5.5bn in 2006-07.

7
This growth helped in bringing down the poverty line from 36 percent to 24 percent.15
The rate of unemployment declined from 8.3 percent to 5.3 percent during this period. The income inequality, however, has gone up. With an increase in the allocation of resources to human development activities, Pakistan has been able to graduate to a Medium Human Development country and ranked 134th out of 177 in 2006 compared to 142nd out of 177 in 2002.16 Pakistan continued with the institutional reform of liberalisation, deregulation and privatisation. In order to further liberalise FDI regime, minimum FDI levels in social, agriculture and infrastructure sectors have been reduced from US$0.5mn to US$0.3mn and in services such as retailing and wholesaling it has been reduced from US$0.3mn to US$0.15mn.17 The maximum limit of foreign equity of 51% in life insurance was removed in September 2006.
Pakistan’s total trade has increased from US$21.5bn in 2001 to US$47.7bn in 2007, with an annual increase of 18 percent. The share of manufactured products in imports as well as exports has increased while that of the semi-manufacturing has declined. Despite this fairly good economic performance, Pakistan’s economy faces lot of constraints, ranging from the unreliable provision of public utilities, poor public infrastructure, weak institutional and policy frameworks and low labour productivity, arising from poor education, health and housing provision.
Over the last 10 to 15 years, Pakistan has liberalised its international trade significantly. Pakistan’s major exports are textiles, leather & leather products, rice, sports goods, carpets and surgical instruments. But major categories of Pakistan’s exports are for the last one year facing serious challenges in the international market. Currently, more than 75 percent of Pakistan’s exports originate from four items, i.e. textiles, rice, leather and sports goods and more than half of its exports go to seven countries. The worst hit in this slow down is the textile industry, which is the backbone of Pakistan’s economy with a status of the largest industry and with a comparative advantage of resource utilisation: source of employment to industrial workers (38 percent) and the largest source of foreign exchange earnings (60 percent), accounting for 27 percent value addition in manufacturing sector. The trade in textiles is directly affected by removal of quantitative trade restrictions and end of EU's Generalised system of Preferences (GSP) Scheme for Pakistan.
Textile is a big sector for Pakistan with the sub-sectors of raw cotton, cotton yarn, cotton cloth, carded cotton and combed cotton, non-cotton yarn, knitwear, bed sheets and pillow cases, tents, canvas and tarpaulin, garments and other textile products. Pakistan’s exports like many other developing countries face supply-side constraints that severely limit their ability to benefit from the multilateral trading system (MTS). In Pakistan, the more important constraints in the industrial sector, especially in Textiles are as follows:
i) Over governed and over monitored regime of 27 different government agencies;
ii) Delay in sales tax refund causing serious cash flow/liquidity problem to the industry;
iii) Adverse traveling advice by the foreign countries to their citizens discouraging travel to Pakistan;
15 SBP: www.sbp.org.pk 16 Ibid 17 Board of Investment, government of Pakistan website www.pakboi.gov.pk

8
iv) Concerns about intellectual property rights and international arbitration agreements;
v) Concerns about social compliance; vi) Poor leveraging with information and communication technology (ICT); vii) Concerns about the Insurance guarantees; and viii) Historically low investment in human resource development.
Agriculture is the largest sector of the Pakistani economy, contributing 23 percent to the GDP and involving 42 percent of the total labour force.18 Though Pakistan faces major difficulties with crop yields19 and over use of pesticides and high post-harvest losses when compared to other agricultural sectors in the region, yet Pakistan has a strong comparative advantage in the production and exports of a number of agricultural products because of its climate and location. Pakistan is one of the world’s top five producers of cotton, rice and milk and one of the top 10 for wheat and sugar cane. Its production of fruits and vegetables is also significant. But Pakistan has moved rather slowly on value-added agricultural exports, which constitute less than two percent of its agricultural exports.
The services sector has been growing fast over the past few years. Financial services and telecommunication have been the most dynamic sectors and have received the bulk of FDI also. But level of exportation of services from Pakistan remains very low. We actually do not find much literature also on the possible supply-side constraints on the export of services. Pakistan’s export of services stood at US$2.2bn, according to WTO, as compared to an importation of US$8bn. In fact, the statistics of exportation available with the Federal Bureau of Statistics are not yet fully dis-aggregated. Pakistan has opened up its services sector in the recent past and has submitted an ambitious offer to WTO with a hope to attract FDI in the sector but the export culture and capacity.
At the Firm level also, Pakistan’s industrial and exporting sectors are facing significant problems. Most of the exporting companies in Pakistan are small in size. Their small size puts a lot of constraints on the companies themselves and adds inefficiencies at the sectoral level. These firms would usually focus on “me too” products, mostly compete on prices, try to grab other companies’ customers (usually by offering lower prices), don’t invest anything on R&D, provide very little (if any customer after-sales support) and at times create a bad image for the country. The small firms are particularly hit by high employee turnover, especially middle management people continuously shift from one company to another. From the employees’ perspectives, their motivation levels are low and they are dissatisfied with working conditions. The resultant lack of trust between the employer and the employee results in poor utilisation of employee’s capabilities and increasing inefficiencies.
2.2 Export Profile of Pakistan
Pakistan traditionally exports to four regional markets i.e., US, EU, Far East and the Gulf.
18 Labour Force Survey: http://www.statpak.gov.pk/depts/fbs/publications/lfs2005_06/lfs2005_06.html 19 India's rice paddy yield hovers at 3008 kg per hectare. In the US, the average yield per hectare is around 7000 kg. (www.indiatogether.org/agriculture/opinions) In Pakistan this stands at 2117 kg. In case of cotton, Pakistan’s per hectare average yield is 650 kg as compared to 900 kg in US and 1000 kg in China.
9
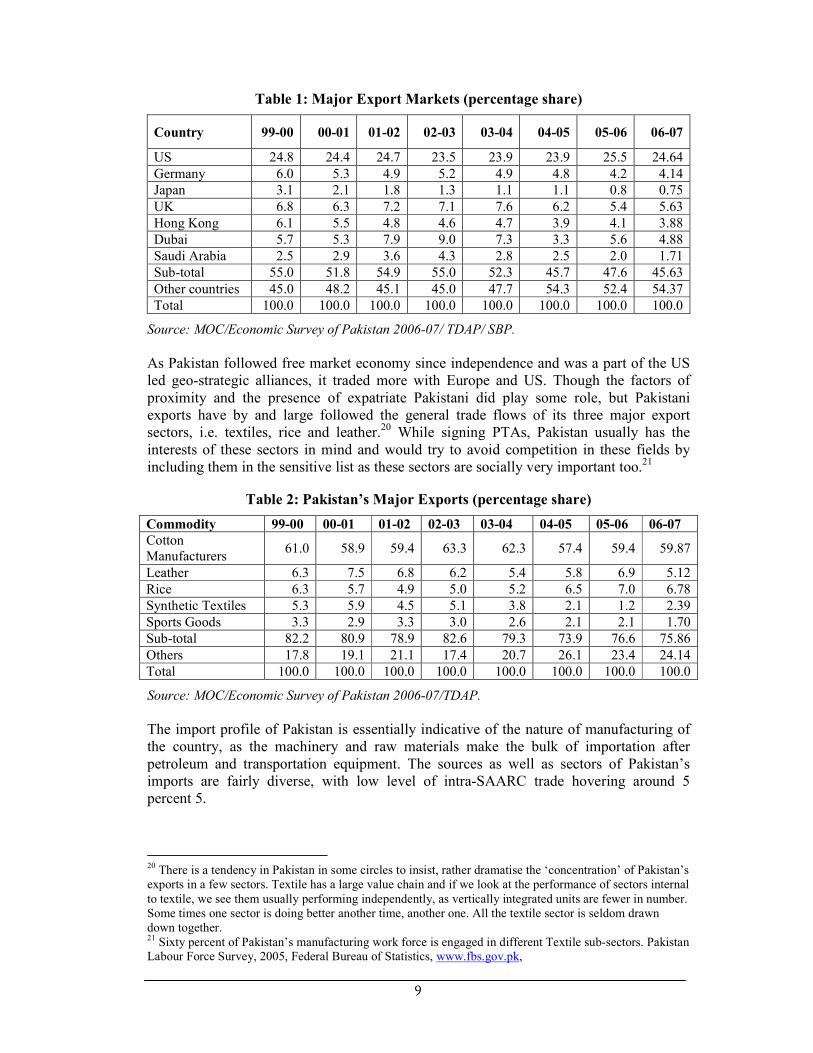
Table 1: Major Export Markets (percentage share)
Country 99-00 00-01 01-02 02-03 03-04 04-05 05-06 06-07
US 24.8 24.4 24.7 23.5 23.9 23.9 25.5 24.64
Germany 6.0 5.3 4.9 5.2 4.9 4.8 4.2 4.14
Japan 3.1 2.1 1.8 1.3 1.1 1.1 0.8 0.75
UK 6.8 6.3 7.2 7.1 7.6 6.2 5.4 5.63
Hong Kong 6.1 5.5 4.8 4.6 4.7 3.9 4.1 3.88
Dubai 5.7 5.3 7.9 9.0 7.3 3.3 5.6 4.88
Saudi Arabia 2.5 2.9 3.6 4.3 2.8 2.5 2.0 1.71
Sub-total 55.0 51.8 54.9 55.0 52.3 45.7 47.6 45.63
Other countries 45.0 48.2 45.1 45.0 47.7 54.3 52.4 54.37
Total 100.0 100.0 100.0 100.0 100.0 100.0 100.0 100.0
Source: MOC/Economic Survey of Pakistan 2006-07/ TDAP/ SBP.
As Pakistan followed free market economy since independence and was a part of the US led geo-strategic alliances, it traded more with Europe and US. Though the factors of proximity and the presence of expatriate Pakistani did play some role, but Pakistani exports have by and large followed the general trade flows of its three major export sectors, i.e. textiles, rice and leather.20 While signing PTAs, Pakistan usually has the interests of these sectors in mind and would try to avoid competition in these fields by including them in the sensitive list as these sectors are socially very important too.21
Table 2: Pakistan’s Major Exports (percentage share)
Commodity 99-00 00-01 01-02 02-03 03-04 04-05 05-06 06-07
Cotton Manufacturers
61.0 58.9 59.4 63.3 62.3 57.4 59.4 59.87
Leather 6.3 7.5 6.8 6.2 5.4 5.8 6.9 5.12
Rice 6.3 5.7 4.9 5.0 5.2 6.5 7.0 6.78
Synthetic Textiles 5.3 5.9 4.5 5.1 3.8 2.1 1.2 2.39
Sports Goods 3.3 2.9 3.3 3.0 2.6 2.1 2.1 1.70
Sub-total 82.2 80.9 78.9 82.6 79.3 73.9 76.6 75.86
Others 17.8 19.1 21.1 17.4 20.7 26.1 23.4 24.14
Total 100.0 100.0 100.0 100.0 100.0 100.0 100.0 100.0
Source: MOC/Economic Survey of Pakistan 2006-07/TDAP.
The import profile of Pakistan is essentially indicative of the nature of manufacturing of the country, as the machinery and raw materials make the bulk of importation after petroleum and transportation equipment. The sources as well as sectors of Pakistan’s imports are fairly diverse, with low level of intra-SAARC trade hovering around 5 percent 5.
20 There is a tendency in Pakistan in some circles to insist, rather dramatise the ‘concentration’ of Pakistan’s exports in a few sectors. Textile has a large value chain and if we look at the performance of sectors internal to textile, we see them usually performing independently, as vertically integrated units are fewer in number. Some times one sector is doing better another time, another one. All the textile sector is seldom drawn down together. 21 Sixty percent of Pakistan’s manufacturing work force is engaged in different Textile sub-sectors. Pakistan Labour Force Survey, 2005, Federal Bureau of Statistics, www.fbs.gov.pk,

10
Table 3: Pakistan’s Major Imports (Percentage share)
Commodities 99-00 00-01 01-02 02-03 03-04 04-05 05-06 06-07
Machinery 13.9 19.3 17.1 18.5 17.8 22.5 18.0 22.7
Petroleum & Products
27.2 31.3 27.1 25.1 20.3 19.4 22.3 22.5
Chemicals 17.5 20.0 15.9 15.1 16.1 15.5 13.4 12.7
Transport equip. 5.5 4.0 4.8 5.6 5.6 6.2 7.7 8.0
Edible oil 4.0 3.1 3.8 4.8 4.2 3.7 2.7 2.9
Iron & Steel 3.0 2.6 3.3 3.3 3.3 4.3 5.1 5.0
Fertilizer 1.9 1.6 1.7 2.1 1.8 2.0 2.4 1.2
Tea 2.0 1.9 1.5 1.4 1.2 1.1 0.9 0.7
Sub-total 75.0 83.8 75.2 75.9 70.3 74.7 72.5 75.7
Others 25.0 16.2 24.8 24.1 29.7 25.3 27.5 24.3
Total 100.0 100.0 100.0 100.0 100.0 100.0 100.0 100.0
Source: MOC/Economic Survey of Pakistan 2006-07.
In case of Pakistan, exports as well as many local industries, are heavily dependent on imports, therefore Pakistan has been following rather a liberal import regime. Again the sourcing of Pakistan’s imports has been following an historical trend and Pakistani importers have been preferring to import from US, EU and Far East in order to offer a better ratio of price and quality. Pakistan continues to source more of its imports from outside South Asia, though, recently the proximity factor has started playing a significant role and Pakistan’s imports from the region have jumped up. For Pakistan, EU, UAE, Saudi Arabia, China and US are the suppliers of imports into Pakistan.
Table 4: By Main Commodity Group (ITS)22
Agricultural products 13.9
Fuels and mining products 28.8
Manufacturers 55.6
By main origin
i) EU 16.3
ii) UAE 11.4
iii) Saudi Arabia 10.2
iv) China 9.8
v) US 6.3
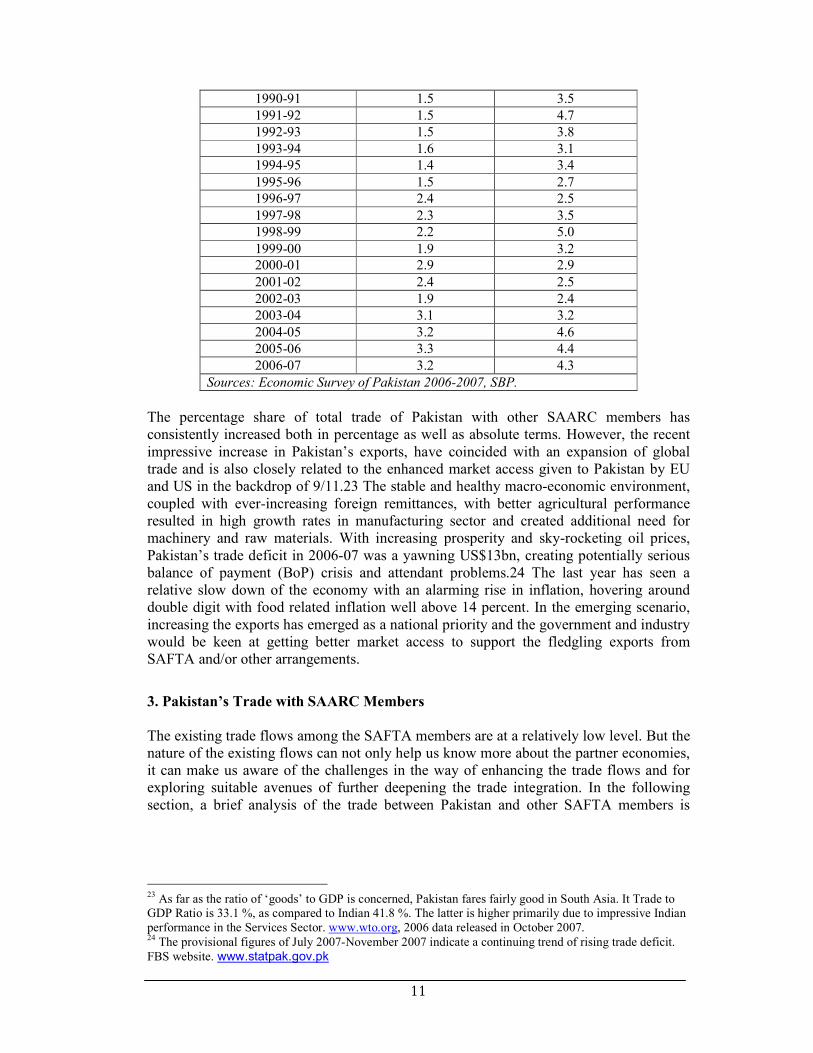
The direction and composition of exports and imports of Pakistan do not have any of the South Asian country as major trading partner and shows a usual anti-regional bias. Table 5 (excluding Afghanistan) shows that Pakistan’s percentage share of intra-regional imports has been around 1.7 percent on average and percentage share in exports around 3.5 percent. However, imports have shown an increasing trend due to a sharp increase in imports from India.
Table 5: Pakistan’s Percentage Share in South Asian
Countries Imports and Exports
Year Imports Exports
22 WTO Data on Pakistan, 2006. www.wto.org
11
1990-91 1.5 3.5
1991-92 1.5 4.7
1992-93 1.5 3.8
1993-94 1.6 3.1
1994-95 1.4 3.4
1995-96 1.5 2.7
1996-97 2.4 2.5
1997-98 2.3 3.5
1998-99 2.2 5.0
1999-00 1.9 3.2
2000-01 2.9 2.9
2001-02 2.4 2.5
2002-03 1.9 2.4
2003-04 3.1 3.2
2004-05 3.2 4.6
2005-06 3.3 4.4
2006-07 3.2 4.3
Sources: Economic Survey of Pakistan 2006-2007, SBP.
The percentage share of total trade of Pakistan with other SAARC members has consistently increased both in percentage as well as absolute terms. However, the recent impressive increase in Pakistan’s exports, have coincided with an expansion of global trade and is also closely related to the enhanced market access given to Pakistan by EU and US in the backdrop of 9/11.23 The stable and healthy macro-economic environment, coupled with ever-increasing foreign remittances, with better agricultural performance resulted in high growth rates in manufacturing sector and created additional need for machinery and raw materials. With increasing prosperity and sky-rocketing oil prices, Pakistan’s trade deficit in 2006-07 was a yawning US$13bn, creating potentially serious balance of payment (BoP) crisis and attendant problems.24 The last year has seen a relative slow down of the economy with an alarming rise in inflation, hovering around double digit with food related inflation well above 14 percent. In the emerging scenario, increasing the exports has emerged as a national priority and the government and industry would be keen at getting better market access to support the fledgling exports from SAFTA and/or other arrangements.
3. Pakistan’s Trade with SAARC Members
The existing trade flows among the SAFTA members are at a relatively low level. But the nature of the existing flows can not only help us know more about the partner economies, it can make us aware of the challenges in the way of enhancing the trade flows and for exploring suitable avenues of further deepening the trade integration. In the following section, a brief analysis of the trade between Pakistan and other SAFTA members is
23 As far as the ratio of ‘goods’ to GDP is concerned, Pakistan fares fairly good in South Asia. It Trade to GDP Ratio is 33.1 %, as compared to Indian 41.8 %. The latter is higher primarily due to impressive Indian performance in the Services Sector. www.wto.org, 2006 data released in October 2007. 24 The provisional figures of July 2007-November 2007 indicate a continuing trend of rising trade deficit. FBS website. www.statpak.gov.pk

12
presented, highlighting the export potential from Pakistani perspective, identifying possible obstacles and the way forward in actualising this potential.25
3.1. Pakistan-Bangladesh Trade
The volume of Pakistan-Bangladesh trade is not very significant, given the total trade of both countries (see Table 7) Over the last few years, the trade between Pakistan and Bangladesh has increased in $ terms. Pakistan however apparently has a favourable balance of trade with Bangladesh all these years. [Table 1] As far as the volumes are concerned, the volumes of major products have stagnated or gone down. Pakistan’s share of both exports and imports in relation to Bangladesh have gone down significantly, which speaks of the irrelevance, to a large measure, of trade in the bilateral relations between the two countries and casts a long shadow on all this rhetoric on the recent or potential expansion of Bangladesh’s exports as well imports to Pakistan and vice versa. Even, this apparent increase in trade between the two countries, in terms of value was reversed to an extent during 2006-7.
Table 6: Pakistan-Bangladesh Trade Flows
(US $ Thousand)
Bangladesh Year
1999-
2000
Year
2000-01
Year
2001-02
Year
2002-03
Year
2003-04
Year
2004-05
Year
2005-06
Year
2006-07
Exports to 120419 133422 101139 114356 195011 205821 269741 261947
Imports from 29489 33270 27525 32638 45918 61218 64554 58385
Source: Trade Development Authority of Pakistan / Board of Investment Pakistan.
Table 7: Pakistan and Bangladesh Trade in Perspective (2006)
(US$ Thousand)
Year 2006 Total
Exports
(Global)
Exports to
Bangladesh/
Pakistan
% of total
exports
Total
imports
(Global)
Imports from
Bangladesh/
Pakistan
% of total
imports
Pakistan 16,932,873 266,835 1.575% 29,825,754 55,886 0.187%
Bangladesh 11,924,686 55,886 0.468% 10,331,314 266,835 2.582%
Source: ITC calculations based on COMTRADE statistics.
Pakistan’s top twenty exports items to Bangladesh are given in the Table 8. The major export items in 2006 being cotton fabric and yarn, electrical machinery, man-made filaments, man-made staple fibres, raw hides and skins and vehicles other than railway. The export base of Bangladesh to Pakistan is extremely narrow, almost entirely focussed on two commodities, i.e. jute and tea.
25 This part deals only with goods.

13
Table 8: Pakistan Top twenty Imports and Exports from Bangladesh 2006
(US$ Thousand)
Pakistan’s Exports to Bangladesh Pakistan imports from Bangladesh
HS Code
Product Label Value 2006
Hs Code Product label
Value 2006
52 Cotton 212,390 53 Vegetable textiles fibres nes, paper yarn, woven fabric
44,555
84 Nuclear reactors, boilers, machinery, etc
9,142 09 Coffee, tea, mate and spices
5,475
54 Manmade filaments 8,721 72 Iron and steel 1,825
55 Manmade staple fibres
5,905 14 Vegetable plaiting materials, vegetable products nes
829
87 Vehicles other than railway, tramway
5,179 24 Tobacco and manufactured tobacco substitutes
466
10 Cereals 2,831 30 Pharmaceutical products 425
41 Raw hides and skins (other than fur skins) and leather
2,736 39 Plastics and articles thereof
271
60 Knitted or crocheted fabric
2,187 96 Miscellaneous manufactured articles
250
39 Plastics and articles thereof
1,766 41 Raw hides and skins (other than fur skins) and leather
224
32 Tanning, dyeing extracts, tannins, derives, pigments etc
1,123 62 Articles of apparel, accessories, not knit or crochet
221
38 Miscellaneous chemical products
1,017 48 Paper & paperboard, articles of pulp, paper and board
197
61 Articles of apparel, accessories, knit or crochet
984 84 Nuclear reactors, boilers, machinery, etc
168
30 Pharmaceutical products
977 65 Headgear and parts thereof
162
63 Other made textile articles, sets, worn clothing etc
912 15 Animal, vegetable fats and oils, cleavage products, etc
121
09 Coffee, tea, mate and spices
822 33 Essential oils, perfumes, cosmetics, toiletries
105
90 Optical, photo, technical, medical, etc apparatus
769 29 Organic chemicals
84
17 Sugars and sugar confectionery
753 55 Manmade staple fibres
68
62 Articles of apparel, accessories, not knit or crochet
733 58 Special woven or tufted fabric, lace, tapestry etc
63
85 Electrical, electronic equipment
712 85 Electrical, electronic equipment
61

14
25 Salt, sulphur, earth, stone, plaster, lime and cement
675 Articles of apparel, accessories, knit or crochet
46
3.2. Pakistan’s Trade Potential [2006]26
Two of Pakistan’s most important export items to Bangladesh are woven cotton fabrics and cotton yarn under HS Code 5209 and HS Code 5208 respectively. There is a significant indicative export potential but Pakistan is not getting any concession on export of these items. SAFTA therefore remains irrelevant for these two items of crucial importance for Pakistan. As compared to Pakistan exports of US$226mn for the Bangladesh readymade garments (RMG) sector, China, India and Hong Kong exported yarn and fabrics worth US$534mn, 333mn and 171mn respectively to Bangladesh during 2006. Gradually, Bangladesh is building its own capacity in spinning and weaving too and in coming days, Pakistan’s exports even can go down, if the major causes of the low level of exportation of these two items such as warehousing facilities, transportation and banking issues lack of trust are not sorted out.
Machinery is traditionally an important import item of Bangladesh. Though, it is the third largest export item from Pakistan, but it is a fraction of Bangladesh’s total imports. This sector has a huge potential of increase for Pakistan but Pakistan’s position in the market is very poor. Pakistan has exported manmade filament yarn worth US$8.7mn to Bangladesh in 2006. This is also part of the raw material supplies to RMG sector. Pakistan can possibly enhance its exports of man-made filament but it item is included in the sensitive list of Bangladesh. In respect of woven fabric of synthetic staple fabric (HS Code 5513) and yarn of synthetic staple fibres (HS Code 5509) there can be significant export potential but these products are included in sensitive list of Bangladesh. Parts and accessories of motor vehicles (HS Code 8708) and special purpose motor vehicles (8705) are included in sensitive list of Bangladesh though tractors are getting concessional duty on export to the tune of 0.66 percent. Agricultural implements and machinery is an area where both countries can enhance their cooperation.
Looking at it more closely, we know that in fact US$226mn out of US$266mn are the raw materials for Bangladesh’s RMG sector and none of the other items values more than US$3mn, making trade balance in favour of Pakistan irrelevant. In other words, the trade between the two countries is dependent disproportionately on single sectors, i.e. textile (yarn and fabric) in case of Pakistan and jute in case of Bangladesh. As far as the other items of interest of Pakistan, among its top 20 export items are concerned, most of them are not getting any tariff concessions such as electrical, electronic equipment (HS Code 85), plastics and its articles (HS Code 39), air vacuum pumps (HS Code 8414), pharmaceutical products (HS Code 30), knitted or crocheted fabric (HS Code 6002), Portland cement (HS Code 2523) and rice (HS Code 1006) etc.
A few items such as raw hides and skins (HS code 41) enjoy duty free access in Bangladesh, but it is not surprising as it is a raw material. Perhaps more importantly, the overlap between Bangladesh’s top twenty import items and Pakistan’s top twenty export items is very limited and Pakistan is up against efficient competitors such as China, India, Korea, Hong Kong etc. In order to enhance exports in these very areas, Pakistan has to
26 The analysis in the section is base on the data from ITC for the year 2006. The data from ITC is from January to December, whereas the data from Pakistani sources is from July to June, if not specified otherwise.

15
come over the supply side constraints and get better terms of trade from Bangladesh. Equally importantly, Pakistan needs to focus on other import items currently being imported by Bangladesh from other countries – especially other than SAFTA members – and try to enhance their exports.
i) Bangladesh under SAFTA has included 1245 items in its sensitive list. This large list, by any standard, covering many items in which Pakistan has comparative advantage significantly lowers the possibility of exports from Pakistan.
ii) Bangladesh is having deeper concessions due to its least developed country (LDC0 status but its exports to Pakistan have not really gone up significantly. As far as exportation from Pakistan to Bangladesh is concerned, it is primarily restricted to jute and tea. Though there is a possibility of enhancing trade in these two commodities further yet Bangladesh has not yet been able to enhance the exports of non-traditional items. Pakistan has given duty free access to tea, which is not a big exportable commodity of Bangladesh, which now is suggesting more access for other products like jute goods, RMG etc. Apparently, the current level of concessions under SAFTA does not appear to be creating the necessary stimulus to Bangladesh’s exports to Pakistan.
iii) As noted above Pakistan’s exports to Bangladesh have recently gone down. As the introduction of SAFTA is too recent, it is difficult to correlate this relative decline positively or negatively to SAFTA. One of the possible reasons of this decline can be the Political turmoil/labour problems in Bangladesh and image of Pakistan. Fruit imports from Pakistan have gone down recently due to high air freight charges and difficulties in getting the space. Pakistan itself is experiencing shortages and price hikes in case of raw cotton, rice, wheat etc. Export ban by Pakistan government on wheat, lentils etc., might also have contributed lowering of trade figures in addition to the fact that Bangladesh has started its own indigenous production of yarn, fabrics, spices, leather etc.
iv) The structural constraints for promoting trade between the two countries however appear to be equally important as compared to the sector level constraints such as lack of harmonisation of standards, presence of non-trade barriers (NTBs) and para-tariffs, transportation – there are no direct shipping lines between the two countries and the option of land route passing through India is not yet available – lack of banking facilities and a robust trade dispute resolution mechanism etc.
v) The phenomenal growth of the RMG sector in Bangladesh in recent years has enhanced the buying capacity in Bangladesh in general and created the capacity to produce and export other items, resulting in the opportunities for a deeper integration process in the region.
vi) Bangladesh has tremendous human resource available and would be looking for more investments and movement of its manpower at the South Asia level. SAFTA members are considering more cooperation in the services sector, which, is expected to benefit all the member countries given the dynamic growth of services sector in South Asia over the last decade. There have been some Pakistani investments in Bangladesh, mainly in textiles. In nutshell, mere insistence on the curtailment of the sensitive list will not lead to tremendous economic benefits to the partners.

16
Despite the fact that the textile is the most sensitive of the sensitive items, the future of the whole region, especially of Pakistan-Bangladesh economic cooperation and prosperity, lies in the textile sector, given the central importance of textile for both the economies.
3.3. Pakistan and India Trade Analysis
India and Pakistan share a long border with each other as well a long history of bitter relations. The communities living in these countries have a long history of relations, stretched over centuries, with frequently shifting borders of empires and dynasties. India and Pakistan are the two largest economies of South Asia having a GDP of US$906.2bn and US$128.8bn respectively, in 2006.
27 It is common sense that the nature of India and
Pakistan relations would form the core of academic debates on success or failure of SAFTA.
The formal trade between Pakistan and India has been steadily growing. Pakistan has followed the path of progressive liberalisation of trade with India and has taken significant steps in this direction during 1990s. The average tariffs which stood at 225 percent in 1990-01 were brought down at around 14 percent in 2005-06, along with a reduction in the tariff slabs. However, Pakistan’s trade with India is being done on the basis of a positive list which speaks of a cautious approach towards the opportunities and threats of trade with India. Table 9 shows a consistent increase in exports from Pakistan to India during FY 2002-03 to FY 2006-07. The imports from India, however, have grown at a much faster pace.
Table 9: Pakistan India Trade Flows
(in US$ Thousand)
India Year
2002-03
Year
2003-04
Year 2004-
05
Year
2005-06
Year
2006-07
Exports to 70664 93680 288516 293326 342918
Imports from 166509 382367 547458 802002 1,256.790
Source: TDAP.
Table 10 shows that the volume of Pakistan-India trade as a proportion of their global trade remains very small. The trade gap between the two countries has been increasingly and has lately assumed alarming proportions.
Table 10: Pakistan and India Trade in Perspective 2006
(in US$ Thousand) Year
2006
Total
Exports
(Global)
Exports to
India/
Pakistan
% of total
Exports
Total Imports
(Global)
Imports from
India/
Pakistan
% of Total
Imports
Pakistan 16,932,873 326,704 1.93 29,825,754 1,114,995 3.74
India 99,108,861 1,114,995 1.13 106,077,126 326,704 0.31
Source: ITC calculations based on COMTRADE statistics.
27 WTO Data 2006, www.wto.org

17
Pakistani exports to India constituted only 1.93 percent of its total exports. Indian importation short up to $185bn but Pakistan remains a distant 54th exporter to India as shown in the Table 11 below.
Table 11: Top Twenty Exporting Countries to India
(in US$ Million)
2005-2006 2006-2007 % Growth India's Total Import
149,165.73 185,749.30 24.53
* % Share: India’s Total Imports.
Table 12: Ranking of Top Twenty Countries According to Year 2005-2006
(in US$ Million)
Sr.
No.
Country Name 2005-2006
Exports
%
Share
2006-2007
Exports
% Share %
Growth
1 CHINA 10868.05 7.2859 17460.66 9.4001 60.66
2 US 9454.74 6.3384 11736.13 6.3183 24.13
3 SWITZERLAND 6555.8 4.395 9123.45 4.9117 39.17
4 GERMANY 6023.63 4.0382 7546.33 4.0626 25.28
5 AUSTRALIA 4947.91 3.3171 7008.01 3.7728 41.64
6 BELGIUM 4725.14 3.1677 4141.84 2.2298 -12.34
7 KOREA 4563.85 3.0596 4806.02 2.5874 5.31
8 UAE 4354.08 2.919 8657.54 4.6609 98.84
9 FRANCE 4113.3 2.7575 4212.05 2.2676 2.4
10 JAPAN 4061.1 2.7225 4595.60 2.4741 13.16
11 UK 3930.3 2.6349 4174.48 2.2474 6.21
12 SINGAPORE 3353.77 2.2484 5489.56 2.9554 63.68
13 INDONESIA 3008.11 2.0166 4169.08 2.2445 38.59
14 SOUTH AFRICA 2471.8 1.6571 2471.66 1.3306 -0.01
15 MALAYSIA 2415.61 1.6194 5294.81 2.8505 119.19
16 HONG KONG 2206.98 1.4795 2483.85 1.3372 12.55
17 RUSSIA 2022.19 1.3557 2409.49 1.2972 19.15
18 ITALY 1855.63 1.244 2674.44 1.4398 44.13
19 SAUDI ARAB 1632.34 1.0943 13383.9 7.2054 719.92
20 TAIWAN 1382.96 0.9271 1678.31 0.9035 21.36
54 PAKISTAN 179.56 0.1204 323.26 0.174 80.03
Source: www.commerce.nic.in Department of Commerce, India
* Pakistan is on the 54th position.
Indian exports to Pakistan accounted for 1.13 percent of its total exportation. But India is becoming an important source of exportation to Pakistan as Pakistan imported 3.7 percent of its total importation from India, according to WTO data for 2006 and 4.07 on the basis of July 2006-June 2007 data. A summary of the main indicators of Pakistan’s trade with India is given in Table 13.

18
Table 13: Main Indicators of Pakistan’s Trade with India
(in US$ Million)
Indicator 2005-06 2006-07 Difference
(%age)
Imports from India 865.94 1,256.79 +45.14
% of Global Imports 3.03 4.07
Active Lines at 8 Digit HS (Excluding Chapter 99) 956 1,066 +11.51
Imports from India under SAPTA 91.01 160.35 +76.19
SAPTA as % of Total Imports from India 11.00 13.00
Imports from India under SAFTA nil 2.69
SAFTA as % of Total Imports from India nil 0.21
Imports From India under DTRE 1.83 2.91 +58.84
DTRE as % of Total Imports from India 0.21 0.23
Exports to India 274.06 377.61 +37.78
% of Global Exports of Pakistan 1.65 2.10
Active Tariff Lines at 8 digit HS (Excluding Chapter 99) for Exports
499 569 +14.02
Source: Ministry of Commerce, government of Pakistan.
The composition of Pakistan-India trade is given in Table 14.
Table 14: Pakistan Top Twenty Imports and Exports from India
(in US$ Million)
Pakistan's Exports to India Pakistan's Imports from India
HS Code
Product label Value 2006
HS Code
Product label Value 2006
27 Mineral fuels, oils, distillation products, etc
162,006 17 Sugars and sugar confectionery
324,262
52 Cotton 56,293 29 Organic chemicals 209,377
08 Edible fruit, nuts, peel of citrus fruit, melons
32,208 39 Plastics and articles thereof 103,146
29 Organic chemicals 30,439 23 Residues, wastes of food industry, animal fodder
102,215
78 Lead and articles thereof 4,158 52 Cotton 73,092
55 Manmade staple fibres 3,812 26 Ores, slag and ash 46,201
07 Edible vegetables and certain roots and tubers
3,323 40 Rubber and articles thereof 39,885
51 Wool, animal hair, horsehair yarn and fabric thereof
3,182 07 Edible vegetables and certain roots and tubers
33,117
41 Raw hides and skins (other than fur skins) and leather
2,983 72 Iron and steel 32,071
74 Copper and articles thereof
2,980 32 Tanning, dyeing extracts, tannins, derives, pigments etc
23,308
63 Other made textile articles, sets, worn clothing etc
2,311 09 Coffee, tea, mate and spices 22,280
84 Nuclear reactors, boilers, machinery, etc
1,900 12 Oil seed, oleagic fruits, grain, seed, fruit, etc, nes
14,167

19
12 Oil seed, oleagic fruits, grain, seed, fruit, etc, nes
1,689 84 Nuclear reactors, boilers, machinery, etc
11,710
39 Plastics and articles thereof
1,647 02 Meat and edible meat offal 10,159
72 Iron and steel 1,563 04 Dairy products, eggs, honey, edible animal product nes
9,362
22 Beverages, spirits and vinegar
1,427 76 Aluminium and articles thereof
6,533
90 Optical, photo, technical, medical, etc apparatus
1,381 38 Miscellaneous chemical products
6,245
10 Cereals 1,050 49 Printed books, newspapers, pictures etc
4,591
76 Aluminium and articles thereof
943 30 Pharmaceutical products 4,224
60 Knitted or crocheted fabric
903 55 Manmade staple fibres 3,214
Source: ITC calculations based on COMTRADE statistics.
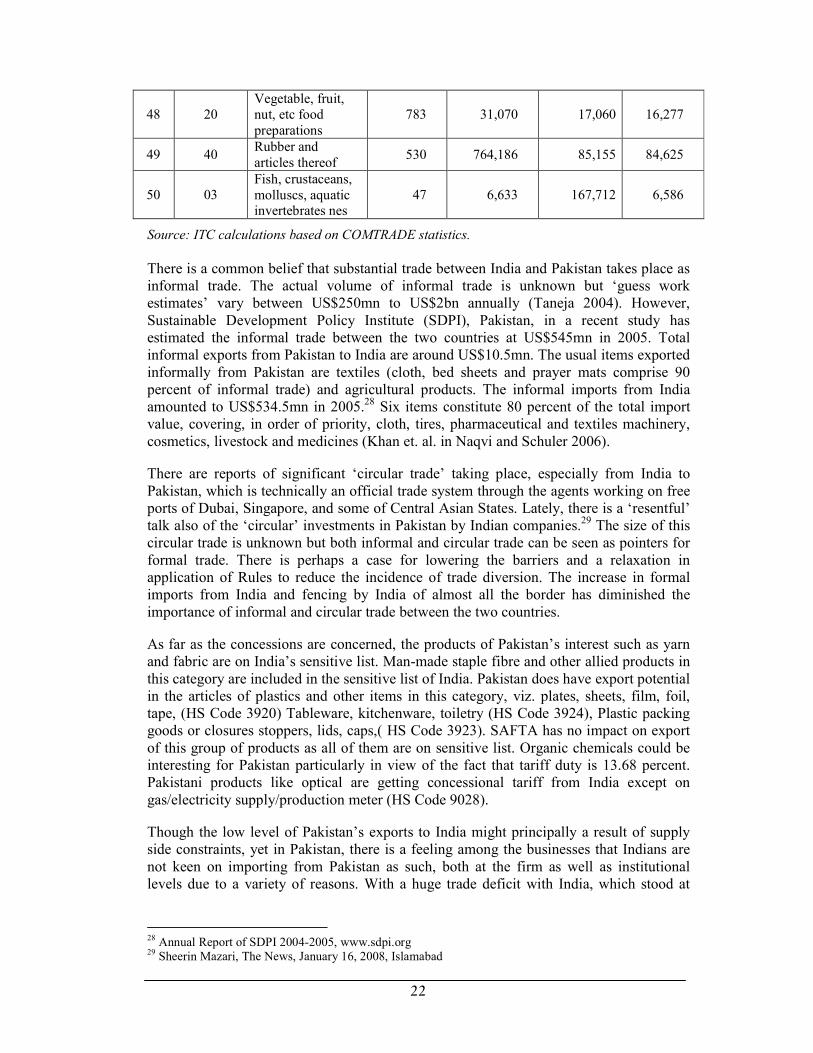
The exports from Pakistan to India present a mix of raw materials and fresh edible fruits and nuts and vegetable roots/tubers. However, imports from India include finished goods also in addition to raw materials and intermediate goods such as organic chemicals and ores, slag and ashes and cotton. The indicative export potential of Pakistan as per ITC calculations is given in Table 15 below.
Table 15: Pakistan India Indicative Potential Trade
(in US$ Thousand)
Sr.
No.
Product
Code Product label
Pakistan's
Exports to
India
India's
Imports
from world
Pakistan's
Exports to
world
Indicative
Potential
Trade
1 52 Cotton 56,293 360,000 3,601,009 303,707
2 90 Optical, photo, technical, medical, etc apparatus
1,381 3,336,745 170,606 169,225
3 39 Plastics and articles thereof
1,647 2,287,193 213,347 211,700
4 85 Electrical, electronic equipment
248 14,002,235 120,333 120,085
5 84 Nuclear reactors, boilers, machinery, etc
1,900 18,947,893 112,948 111048
6 30 Pharmaceutical products
45 681,849 86,686 86,641
7 41
Raw hides and skins (other than fur skins) and leather
2,983 214,864 317,719 211,881
8 87 Vehicles other than railway, tramway
270 2,001,198 84,550 84,280

20
9 63 Other made textile articles, sets, worn clothing etc
2,311 109,410 3,242,514 107,099
10 73 Articles of iron or steel
257 1,993,984 74,362 74,105
11 15
Animal, vegetable fats and oils, cleavage products, etc
0 1,439,936 99,507 99,507
12 62 Articles of apparel, accessories, not knit or crochet
646 56,127 1,348,321 55,481
13 64 Footwear, gaiters and the like, parts thereof
412 121,099 135,213 120,687
14 29 Organic chemicals 30,439 4,598,198 62,320 31,881
15 61 Articles of apparel, accessories, knit or crochet
338 40,901 1,902,212 40,563
16 74 Copper and articles thereof
2,980 697,410 34,260 31,280
17 55 Manmade staple fibres
3,812 202,510 234,490 198,698
18 22 Beverages, spirits and vinegar
1,427 114,863 117,360 113,436
19 60 Knitted or crocheted fabric
903 118,458 54,069 53,166
20 71 Pearls, precious stones, metals, coins, etc
409 12,990,067 24,058 23,649
21 54 Manmade filaments
714 501,007 147,356 141,642
22 82 Tools, implements, cutlery, etc of base metal
258 408,106 42,455 42,197
23 72 Iron and steel 1,563 4,447,334 24,862 23,299
24 32
Tanning, dyeing extracts, tannins, derives, pigments etc
10 566,098 20,859 20,849
25 70 Glass and glassware
628 361,540 16,897 16,262
26 68 Stone, plaster, cement, asbestos, mica, etc articles
305 148,420 29,938 29,633
27 94
Furniture, lighting, signs, prefabricated buildings
0 341,291 66,761 66,761
28 96 Miscellaneous manufactured articles
342 177,364 31,091 30,749
29 25 Salt, sulphur, earth, stone,
366 373,540 127,390 127,024

21
plaster, lime and cement
30 17 Sugars and sugar confectionery
0 28,933 96,935 28,933
31 42
Articles of leather, animal gut, harness, travel goods
176 56,387 680,369 56,211
32 13 Lac, gums, resins, vegetable saps and extracts nes
484 32,957 29,389 28,905
33 69 Ceramic products 0 241,105 12,221 12,221
34 95 Toys, games, sports requisites
184 118,931 304,733 118,747
35 48
Paper & paperboard, articles of pulp, paper and board
70 1,127,304 13,153 13,083
36 19
Cereal, flour, starch, milk preparations and products
59 24,728 15,151 15,092
37 99 Commodities not elsewhere specified
62 1,170,339 11,189 11,127
38 07 Edible vegetables and certain roots and tubers
3,323 371,914 43,860 40,537
39 44 Wood and articles of wood, wood charcoal
35 452,092 12,953 12,918
40 88 Aircraft, spacecraft, and parts thereof
0 4,038,428 9,690 9,690
41 38 Miscellaneous chemical products
98 1,149,835 11,519 11,421
42 58 Special woven or tufted fabric, lace, tapestry etc
695 110,697 38,022 37,327
43 33
Essential oils, perfumes, cosmetics, toiletries
0 183,893 7,881 7,881
44 21 Miscellaneous edible preparations
48 36,130 7,539 7,491
45 59
Impregnated, coated or laminated textile fabric
0 474,653 6,538 6,538
46 76 Aluminium and articles thereof
943 701,956 18,112 17,169
47 89 Ships, boats and other floating structures
56 183,629 6,543 6,487
22
48 20 Vegetable, fruit, nut, etc food preparations
783 31,070 17,060 16,277
49 40 Rubber and articles thereof
530 764,186 85,155 84,625
50 03 Fish, crustaceans, molluscs, aquatic invertebrates nes
47 6,633 167,712 6,586
Source: ITC calculations based on COMTRADE statistics.
There is a common belief that substantial trade between India and Pakistan takes place as informal trade. The actual volume of informal trade is unknown but ‘guess work estimates’ vary between US$250mn to US$2bn annually (Taneja 2004). However, Sustainable Development Policy Institute (SDPI), Pakistan, in a recent study has estimated the informal trade between the two countries at US$545mn in 2005. Total informal exports from Pakistan to India are around US$10.5mn. The usual items exported informally from Pakistan are textiles (cloth, bed sheets and prayer mats comprise 90 percent of informal trade) and agricultural products. The informal imports from India amounted to US$534.5mn in 2005.28 Six items constitute 80 percent of the total import value, covering, in order of priority, cloth, tires, pharmaceutical and textiles machinery, cosmetics, livestock and medicines (Khan et. al. in Naqvi and Schuler 2006).
There are reports of significant ‘circular trade’ taking place, especially from India to Pakistan, which is technically an official trade system through the agents working on free ports of Dubai, Singapore, and some of Central Asian States. Lately, there is a ‘resentful’ talk also of the ‘circular’ investments in Pakistan by Indian companies.29 The size of this circular trade is unknown but both informal and circular trade can be seen as pointers for formal trade. There is perhaps a case for lowering the barriers and a relaxation in application of Rules to reduce the incidence of trade diversion. The increase in formal imports from India and fencing by India of almost all the border has diminished the importance of informal and circular trade between the two countries.
As far as the concessions are concerned, the products of Pakistan’s interest such as yarn and fabric are on India’s sensitive list. Man-made staple fibre and other allied products in this category are included in the sensitive list of India. Pakistan does have export potential in the articles of plastics and other items in this category, viz. plates, sheets, film, foil, tape, (HS Code 3920) Tableware, kitchenware, toiletry (HS Code 3924), Plastic packing goods or closures stoppers, lids, caps,( HS Code 3923). SAFTA has no impact on export of this group of products as all of them are on sensitive list. Organic chemicals could be interesting for Pakistan particularly in view of the fact that tariff duty is 13.68 percent. Pakistani products like optical are getting concessional tariff from India except on gas/electricity supply/production meter (HS Code 9028).
Though the low level of Pakistan’s exports to India might principally a result of supply side constraints, yet in Pakistan, there is a feeling among the businesses that Indians are not keen on importing from Pakistan as such, both at the firm as well as institutional levels due to a variety of reasons. With a huge trade deficit with India, which stood at
28 Annual Report of SDPI 2004-2005, www.sdpi.org 29 Sheerin Mazari, The News, January 16, 2008, Islamabad
23
around US$800mn in 2006, this feeling is getting deeper.30 Pakistan expects that the
identification by her of the NTB31, which India has in place, (see Annexure) would pave the way for a more productive engagement between the two countries to enhance the bilateral trade and address BoP problem. The rhetorical answer by the Indians that Pakistan does have BOT problems with other trade partners does not help in any way as the implications of a negative BOT in case of such neighbours are very different which have overlapping production patterns and a chequered political history.
The Indian insistence on making significant efforts in bilateral trade relations conditional on MFN – in a away passing the blame for the slowness of SAFTA process on Pakistan and signing bilateral free trade arrangements (FTAs) with all SAARC members minus Pakistan – and an indirect de-linking of normalisation of trade relations from political disputes is not helping in creating suitable conditions for deepening the trade integration between the two countries for the mutual benefits of ordinary Pakistanis and Indians.
India has been asking Pakistan to accord it the MFN treatment on the basis of reciprocity. Pakistan, however, has been steadily expanding importable items list from India. This positive list format has not been found satisfactory by India and the issue has been repeatedly highlighted by the Indian side, including in the last SAFTA meeting (February 2007). In these formal interactions, Pakistan has been reiterating its stand that that the Indian NTBs and political issues need to be tackled first, before Pakistan could consider granting the MFN status. There is however, a realisation to take a more nuanced approach on the MFN issue, which has assumed a symbolical position for many as the analysts in other SAARC countries consider it as one of the principle ‘tests’ of the SAFTA spirit.
Vast literature on MFN tells us that MFN is a tool of cooperation and works better when it is used in an atmosphere of trust. In an atmosphere of understanding, a country can very well impose voluntary restrictions on itself if it can help improve the trust between the two trade partners. This means the idealistic prescriptions of WTO are played out in a dynamic world. International Trade Theory tells us that reciprocity is not the most important element in bilateral trade in the presence of serious asymmetries between the trading economies. It is more important that the trade should lead to welfare and mutual benefit on reciprocal basis. It is possible that a country can ‘formally’ accord MFN to another country but impose so many barriers that there is little trade. This is also possible that a country does not formally give MFN but takes the measures to enhance the trade.
Non-discrimination is an ideal, to which Pakistan also subscribes and it is moving towards it too. But, we should not forget that MFN is one part of the bilateral trade relations between the two countries. MFN has been crafted as a compliance, which was considered to be of maximum use to a maximum number of countries, i.e. an ‘International Good’ in the utilitarian sense. It was never meant to be a fatality. That is why the possibility of exemptions to protect the national interests was kept. The history of US-China trade relations gives us useful insights on the concept and practice of MFN. It needs not to be a whip in the hands of a bigger trade partner to subdue its week neighbour in the name of sanctity of non-discrimination.
30 Ibid 31 Pakistan submitted a detailed paper in 2007 to SAARC Secretariat, describing the NTB’s present in India. Annexure I is based on this Paper

24
Endorsement of MFN by WTO basically was an ideological statement that trade should be divested from politics, but even WTO hastened to add that it was a destination not the starting point. Economics and politics remain and would continue to be joined at the hip. The Doha Development Agenda (DDA) process itself is a testimony to it. Practically, trade remains attached to so many other ‘considerations’, everywhere in the world. Pakistan subscribes to the MFN principle but as far as granting MFN to India is concerned, Pakistani people are opposed to it for well known reasons and Pakistan government has to respect their concerns. Pakistan government is trying to pave the way for eventually granting MFN and expects that India would help Pakistan government in preparing the ground for it by lowering the NTBs and making faster progress on composite dialogue.
The principle concerns in Pakistan on trade with India are the trade deficit, threats to local industry and the lack of trust between the two countries. Pakistan hopes SAFTA, with an active involvement of India, can address these concerns more than WTO process has managed to do. After coming into force of SAFTA in 2006, we believe it is equally, even more, important to see Pakistan-India trade relations in the context of SAFTA. Perhaps more than WTO, as the SAFTA process is aiming at WTO plus, economic integration. From a development perspective, of course the WTO remains the best-available forum to discipline the use of trade-distorting policies but RTAs can complement the WTO efforts by cooperating on behind-the-border policies, especially on regulation-intensive issues such as services, trade facilitation, and the investment climate. Developing countries like India and Pakistan are likely to have the greatest success in harnessing trade for growth and poverty reduction if they adopt a three-pronged strategy that involves autonomous liberalisation, active multilateralism, and open regionalism. Pakistan is pursuing all the three.
As the evidence shows, the strategy of the expansion of positive list has actually helped India increase its exports from US$166mn in 2002-03 to US$1.26bn in 2006. The positive list is being genuinely expanded by Pakistan and we have shown genuine and keen interest in deepening the economic cooperation in the region. In the backdrop of deepening economic integration in South Asia, it is not the granting of MFN, which is holding SAFTA back, these are the issues such as the NTBs and TBTs, connectivity issues, supply-side constraints, lack of recognition of standards, absence of services and investment from current SAFTA provisions, lack of trust, lack of imagination in developing regional supply chains, which are holding the Region back. But there is a feeling in Pakistan that Indian NTBs are a real obstacle to exports from Pakistan and their removal/elimination should be at the core of discussions as is the case with current Doha Round negotiations as well. Whether under the MFN or preferential trade, existence of NTBs not only limits trade between the trade partners, unless addressed directly, they also defy the primary purpose of engaging in the activity, which is enhancing intra-regional trade between the treaty partners.
There is actually a growing feeling in Pakistan that Pakistan should help jog the plurilateral system of SAFTA into faster and deeper regional integration by showing that the WTO was not the only game in town and help create more powerful blocs that would operate within the WTO system. Political problems notwithstanding, the SAFTA in its present shape is irrelevant in regard to most of the trade between Pakistan and India as Pakistani exporters, in most of the cases prefer to trade under MFN or SAPTA as compared to SAFTA due the negligible margin of preference and coverage as shown in
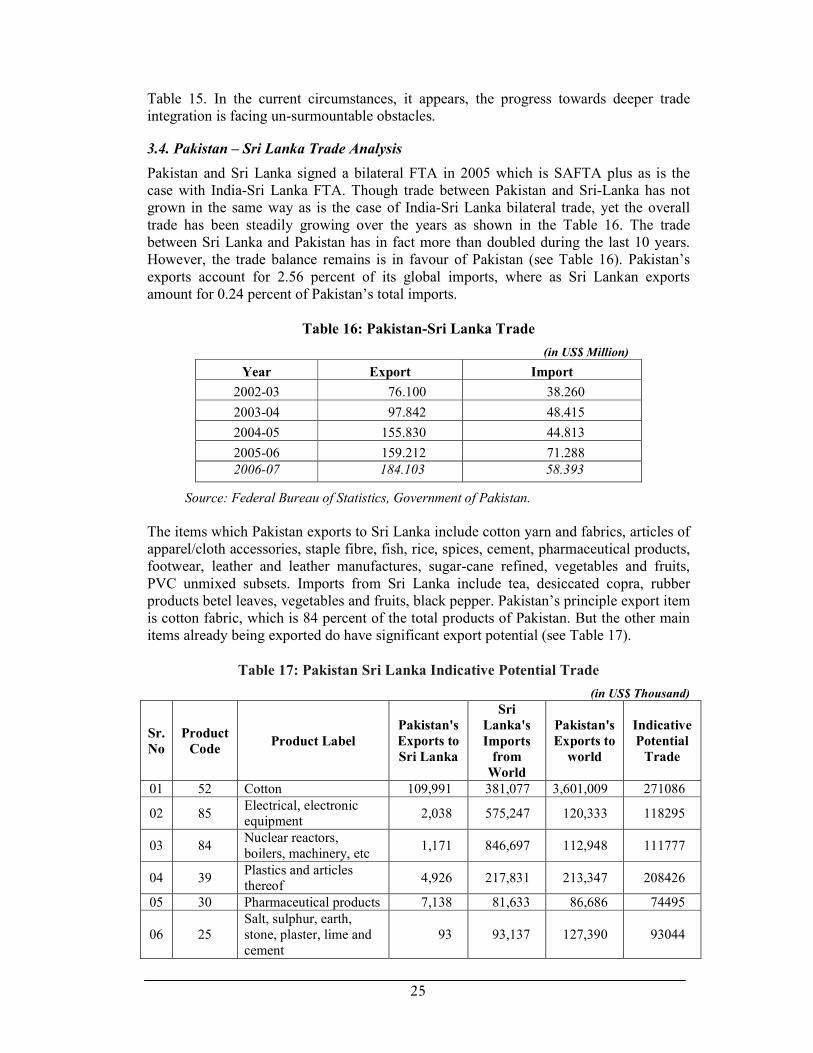
25
Table 15. In the current circumstances, it appears, the progress towards deeper trade integration is facing un-surmountable obstacles.
3.4. Pakistan – Sri Lanka Trade Analysis
Pakistan and Sri Lanka signed a bilateral FTA in 2005 which is SAFTA plus as is the case with India-Sri Lanka FTA. Though trade between Pakistan and Sri-Lanka has not grown in the same way as is the case of India-Sri Lanka bilateral trade, yet the overall trade has been steadily growing over the years as shown in the Table 16. The trade between Sri Lanka and Pakistan has in fact more than doubled during the last 10 years. However, the trade balance remains is in favour of Pakistan (see Table 16). Pakistan’s exports account for 2.56 percent of its global imports, where as Sri Lankan exports amount for 0.24 percent of Pakistan’s total imports.
Table 16: Pakistan-Sri Lanka Trade
(in US$ Million)
Year Export Import
2002-03 76.100 38.260
2003-04 97.842 48.415
2004-05 155.830 44.813
2005-06 159.212 71.288
2006-07 184.103 58.393
Source: Federal Bureau of Statistics, Government of Pakistan.
The items which Pakistan exports to Sri Lanka include cotton yarn and fabrics, articles of apparel/cloth accessories, staple fibre, fish, rice, spices, cement, pharmaceutical products, footwear, leather and leather manufactures, sugar-cane refined, vegetables and fruits, PVC unmixed subsets. Imports from Sri Lanka include tea, desiccated copra, rubber products betel leaves, vegetables and fruits, black pepper. Pakistan’s principle export item is cotton fabric, which is 84 percent of the total products of Pakistan. But the other main items already being exported do have significant export potential (see Table 17).
Table 17: Pakistan Sri Lanka Indicative Potential Trade
(in US$ Thousand)
Sr.
No
Product
Code Product Label
Pakistan's
Exports to
Sri Lanka
Sri
Lanka's
Imports
from
World
Pakistan's
Exports to
world
Indicative
Potential
Trade
01 52 Cotton 109,991 381,077 3,601,009 271086
02 85 Electrical, electronic equipment
2,038 575,247 120,333 118295
03 84 Nuclear reactors, boilers, machinery, etc
1,171 846,697 112,948 111777
04 39 Plastics and articles thereof
4,926 217,831 213,347 208426
05 30 Pharmaceutical products 7,138 81,633 86,686 74495
06 25 Salt, sulphur, earth, stone, plaster, lime and cement
93 93,137 127,390 93044

26
07 55 Manmade staple fibres 1,249 144,883 234,490 143634
08 87 Vehicles other than railway, tramway
3,018 428,073 84,550 81532
09 73 Articles of iron or steel 7,362 113,694 74,362 67000
10 54 Manmade filaments 1,238 161,111 147,356 146118
11 60 Knitted or crocheted fabric
4,516 316,599 54,069 49553
12 90 Optical, photo, technical, medical, etc apparatus
344 97,521 170,606 97177
13 71 Pearls, precious stones, metals, coins, etc
0 307,888 24,058 24058
14 61 Articles of apparel, accessories, knit or crochet
2,164 34,249 1,902,212 32085
15 17 Sugars and sugar confectionery
607 151,275 96,935 96328
16 74 Copper and articles thereof
57 25,859 34,260 25802
17 62 Articles of apparel, accessories, not knit or crochet
986 29,375 1,348,321 28389
18 99 Commodities not elsewhere specified
92 92,022 11,189 11097
19 15 Animal, vegetable fats and oils, cleavage products, etc
0 278,439 99,507 99507
20 22 Beverages, spirits and vinegar
78 26,201 117,360 26123
21 88 Aircraft, spacecraft, and parts thereof
16 39,048 9,690 9674
22 72 Iron and steel 73 111,261 24,862 24789
23 07 Edible vegetables and certain roots and tubers
4,414 76,790 43,860 39446
24 58 Special woven or tufted fabric, lace, tapestry etc
2,140 104,982 38,022 35882
25 69 Ceramic products 14 27,698 12,221 12207
26 21 Miscellaneous edible preparations
39 14,921 7,539 7500
27 19 Cereal, flour, starch, milk preparations and products
102 21,243 15,151 15049
28 63 Other made textile articles, sets, worn clothing etc
2,673 11,007 3,242,514 8334
29 41 Raw hides and skins (other than fur skins) and leather
600 8,169 317,719 7569
30 48 Paper & paperboard, articles of pulp, paper and board
29 171,931 13,153 13124
31 38 Miscellaneous chemical products
116 57,495 11,519 11403
32 94 Furniture, lighting, 0 23,008 66,761 23008

27
signs, prefabricated buildings
33 44 Wood and articles of wood, wood charcoal
0 42,476 12,953 12953
34 32 Tanning, dyeing extracts, tannins, derives, pigments etc
62 58,856 20,859 20797
35 82 Tools, implements, cutlery, etc of base metal
123 16,902 42,455 16779
36 33 Essential oils, perfumes, cosmetics, toiletries
109 28,588 7,881 7772
37 70 Glass and glassware 365 19,124 16,897 16532
38 03 Fish, crustaceans, molluscs, aquatic invertebrates nes
5,121 43,360 167,712 38239
39 64 Footwear, gaiters and the like, parts thereof
629 11,987 135,213 11358
40 59 Impregnated, coated or laminated textile fabric
21 44,760 6,538 6517
41 76 Aluminium and articles thereof
166 39,480 18,112 17946
42 49 Printed books, newspapers, pictures etc
39 16,386 5,090 5051
43 40 Rubber and articles thereof
30 75,633 85,155 75603
44 04 Dairy products, eggs, honey, edible animal product nes
0 176,413 28,625 28625
45 24 Tobacco and manufactured tobacco substitutes
0 30,982 8,202 8202
46 09 Coffee, tea, mate and spices
4,376 16,281 23,487 11905
47 42 Articles of leather, animal gut, harness, travel goods
90 3,885 680,369 3795
48 95 Toys, games, sports requisites
252 14,766 304,733 14514
49 11 Milling products, malt, starches, insulin, wheat gluten
0 6,619 124,545 6619
50 78 Lead and articles thereof 140 4189 5284 4049
Source: ITC calculations based on COMTRADE statistics.
Pakistan has duty free access in respect of many import items under Pakistan-Sri Lanka FTA, which are not being given otherwise under SAFTA. In this regard, the most important item of Pakistan’s interest is the cotton fabric, which is being exported in significant quantities. Pakistan also has duty free access in case of pharmaceutical products though the dressings for medical use are included in the sensitive list of Sri Lanka. Similarly, another important export item i.e., fish is included in sensitive list of Sri Lanka. Plastics and its articles however are included in 100 percent immediate concession list of Sri Lanka. Like all other FTAs, Pakistan –Sri Lanka FTA is also facing teething

28
problems. Pakistan has expressed its concerns regarding the auto sector imports as the capacity of Sri Lanka to manufacture of auto-parts did not exist at the time of negotiations of FTA. It is perhaps the subsequent Indian investment, which had led to the growth of this capacity.
3.5. Trade between Pakistan and Rest of South Asia
If we look at the volume of total trade between Pakistan and rest of South Asia i.e., Bhutan, Nepal, and Maldives during the recent years (2002-03 to 2006-070, it is clear that the trade across these countries is quite minimal. The total trade between Pakistan and these countries has been on average around US$9mn of exports and US$4.16mn imports from these countries. Trade balance has been in favour of Pakistan between 2002-03 to 2006-07 except for the year 2004-05 in which Pakistan had adverse trade balance with all these three countries, and during which Pakistan imported large amount of chemicals from these countries. Table 18 illustrates the import export scenario during the year 2003-03 and 2006-07.
Table 18: Pakistan and Rest of South Asia
(in US$ Thousand) Bhutan Nepal Maldives Year
Exports Imports Exports Imports Exports Imports
2002-03 0.107 0.711 3.076 1.364 3.305 0.072
2003-04 0.377 0.16 4.624 3.43 1.902 0.182
2004-05 0.108 0.511 2.743 3.759 2.56 3.447
2005-06 0.185 0.256 3.126 2.612 2.553 0.148
2006-07 0.01 0.0 1.904 1.39 3.045 0.025
Source: Ministry Of Commerce, Government of Pakistan.
There does exist some trade potential between these countries and Pakistan, which is worth exploring but more conducive conditions need to be created in which more trade taken place especially the conditions for trade facilitation need to be improved.
3.5.1 Pakistan and Nepal Trade Analysis
The Table 19 presents the Pakistan-Nepal trade in global perspectives, whereas Table 20 provides the indicative trade potential for Pakistan in Nepal as per ITC calculations.
Table 19: Pakistan and Nepal Trade in Perspective
(US$ Thousand)
Year
2006
Total
Exports
(Global)
Exports
to
Pakistan/
Nepal
% of
Total
Exports
Total
Imports
(Global)
Imports
from
Pakistan/
Nepal
% of
Total
Imports
Nepal 279,356 4023 1.44 518,518 2425 0.47
Pakistan 16,932,873 2425 0.01 29,825,754 4023 0.01
Source: ITC Calculations based on COMTRADE statistics.

29
Table 20: Pakistan Nepal Indicative Potential Trade
(in US$ Thousand)
Sr.
No.
Product
Code Product Label
Pakistan's
Exports to
Nepal
Nepal's
Imports
from
world
Pakistan's
Exports to
world
Indicative
Potential
1 62 Articles of apparel, accessories, not knit or crochet
140 57,784 1,348,321 57,644
2 85 Electrical, electronic equipment
0 77,951 120,333 77,951
3 84 Nuclear reactors, boilers, machinery, etc
22 48,868 112,948 48846
4 64 Footwear, gaiters and the like, parts thereof
0 25,351 135,213 25,351
5 55 Manmade staple fibres 0 18,299 234,490 18,299
6 61 Articles of apparel, accessories, knit or crochet
0 14,182 1,902,212 14,182
7 99 Commodities not elsewhere specified
0 9,995 11,189 9,995
8 30 Pharmaceutical products 26 16,677 86,686 16,651
9 39 Plastics and articles thereof
47 11,874 213,347 11,827
10 63 Other made textile articles, sets, worn clothing etc
115 9,261 3,242,514 9,146
11 33 Essential oils, perfumes, cosmetics, toiletries
0 7,634 7,881 7,634
12 90 Optical, photo, technical, medical, etc apparatus
177 19,156 170,606 18,979
13 87 Vehicles other than railway, tramway
0 17,098 84,550 17,098
14 88 Aircraft, spacecraft, and parts thereof
0 6,405 9,690 6,405
15 07 Edible vegetables and certain roots and tubers
0 4,715 43,860 4,715
16 52 Cotton 1,478 4,331 3,601,009 2,853
17 94 Furniture, lighting, signs, prefabricated buildings
0 4,751 66,761 4,751
18 10 Cereals 0 1,833 1,152,338 1,833
19 48 Paper & paperboard, articles of pulp, paper and board
13 6,979 13,153 6,966
20 51 Wool, animal hair, horsehair yarn and fabric thereof
0 25,366 6,465 6,465
21 96 Miscellaneous manufactured articles
0 8,696 31,091 8,696
22 08 Edible fruit, nuts, peel of citrus fruit, melons
222 12,500 117,015 12,278
23 73 Articles of iron or steel 0 2,651 74,362 2,651
24 19 Cereal, flour, starch, milk 0 3,127 15,151 3,127

30
preparations and products
25 40 Rubber and articles thereof
22 2,976 85,155 2,954
26 49 Printed books, newspapers, pictures etc
0 3,315 5,090 3,315
27 21 Miscellaneous edible preparations
0 1,594 7,539 1,594
28 17 Sugars and sugar confectionery
0 1,183 96,935 1,183
29 20 Vegetable, fruit, nut, etc food preparations
0 3,611 17,060 3,611
30 59 Impregnated, coated or laminated textile fabric
0 1,503 6,538 1,503
31 54 Manmade filaments 0 1,269 147,356 1,269
32 72 Iron and steel 0 4,100 24,862 4,100
33 12 Oil seed, oleagic fruits, grain, seed, fruit, etc, nes
26 1,793 25,101 1,767
34 95 Toys, games, sports requisites
0 3,726 304,733 3,726
35 42 Articles of leather, animal gut, harness, travel goods
0 3,559 680,369 3,559
36 74 Copper and articles thereof 0 1,348 34,260 1,348
37 09 Coffee, tea, mate and spices
41 1,684 23,487 1,643
38 71 Pearls, precious stones, metals, coins, etc
0 3,365 24,058 3,365
39 58 Special woven or tufted fabric, lace, tapestry etc
0 3,077 38,022 3,077
40 38 Miscellaneous chemical products
0 3,477 11,519 3,477
41 82 Tools, implements, cutlery, etc of base metal
0 1,367 42,455 1,367
42 32 Tanning, dyeing extracts, tannins, derives, pigments etc
0 882 20,859 882
43 34 Soaps, lubricants, waxes, candles, modelling pastes
0 950 2,938 950
44 70 Glass and glassware 0 1,076 16,897 1,076
45 76 Aluminium and articles thereof
0 1,697 18,112 1,697
46 65 Headgear and parts thereof 0 1,626 992 992
47 37 Photographic or cinematographic goods
0 3,477 965 365
48 24 Tobacco and manufactured tobacco substitutes
0 396 8,202 396
49 15 Animal, vegetable fats and oils, cleavage products, etc
0 4,291 99,507 4,291
50 60 Knitted or crocheted fabric
0 596 54,069 596
Source: ITC calculations based on COMTRADE statistics.
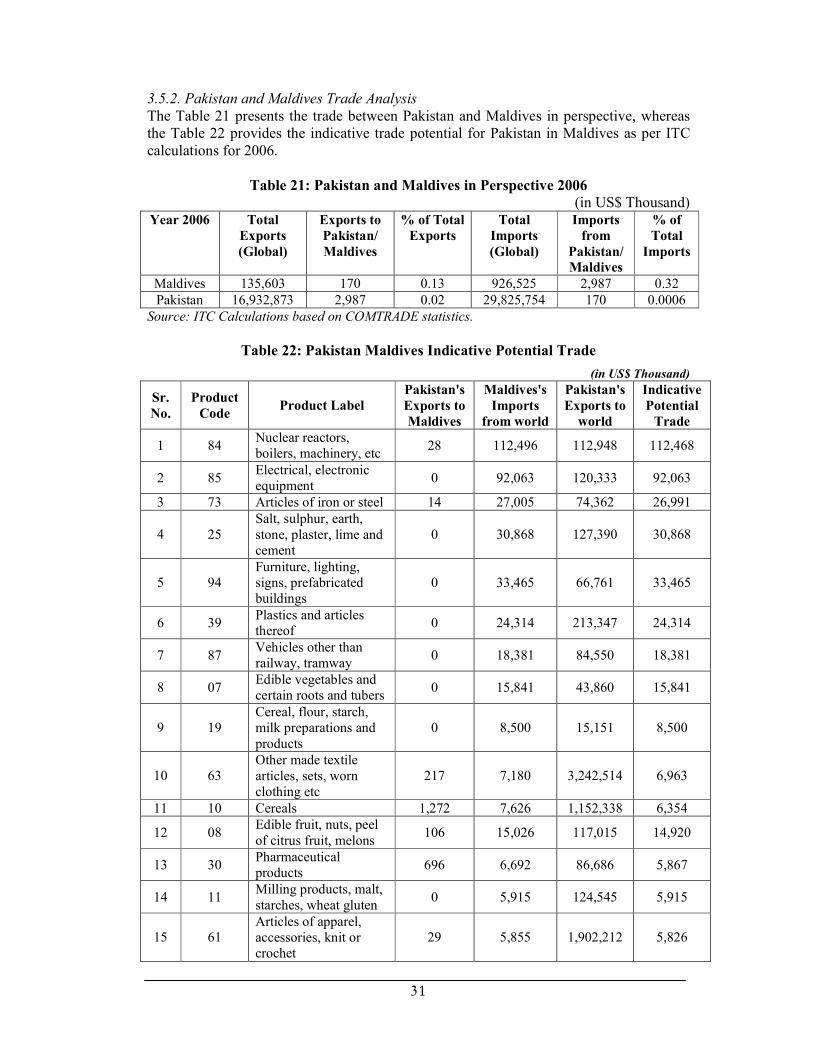
31
3.5.2. Pakistan and Maldives Trade Analysis
The Table 21 presents the trade between Pakistan and Maldives in perspective, whereas the Table 22 provides the indicative trade potential for Pakistan in Maldives as per ITC calculations for 2006.
Table 21: Pakistan and Maldives in Perspective 2006
(in US$ Thousand) Year 2006 Total
Exports
(Global)
Exports to
Pakistan/
Maldives
% of Total
Exports
Total
Imports
(Global)
Imports
from
Pakistan/
Maldives
% of
Total
Imports
Maldives 135,603 170 0.13 926,525 2,987 0.32
Pakistan 16,932,873 2,987 0.02 29,825,754 170 0.0006
Source: ITC Calculations based on COMTRADE statistics.
Table 22: Pakistan Maldives Indicative Potential Trade
(in US$ Thousand)
Sr.
No.
Product
Code Product Label
Pakistan's
Exports to
Maldives
Maldives's
Imports
from world
Pakistan's
Exports to
world
Indicative
Potential
Trade
1 84 Nuclear reactors, boilers, machinery, etc
28 112,496 112,948 112,468
2 85 Electrical, electronic equipment
0 92,063 120,333 92,063
3 73 Articles of iron or steel 14 27,005 74,362 26,991
4 25 Salt, sulphur, earth, stone, plaster, lime and cement
0 30,868 127,390 30,868
5 94 Furniture, lighting, signs, prefabricated buildings
0 33,465 66,761 33,465
6 39 Plastics and articles thereof
0 24,314 213,347 24,314
7 87 Vehicles other than railway, tramway
0 18,381 84,550 18,381
8 07 Edible vegetables and certain roots and tubers
0 15,841 43,860 15,841
9 19 Cereal, flour, starch, milk preparations and products
0 8,500 15,151 8,500
10 63 Other made textile articles, sets, worn clothing etc
217 7,180 3,242,514 6,963
11 10 Cereals 1,272 7,626 1,152,338 6,354
12 08 Edible fruit, nuts, peel of citrus fruit, melons
106 15,026 117,015 14,920
13 30 Pharmaceutical products
696 6,692 86,686 5,867
14 11 Milling products, malt, starches, wheat gluten
0 5,915 124,545 5,915
15 61 Articles of apparel, accessories, knit or crochet
29 5,855 1,902,212 5,826
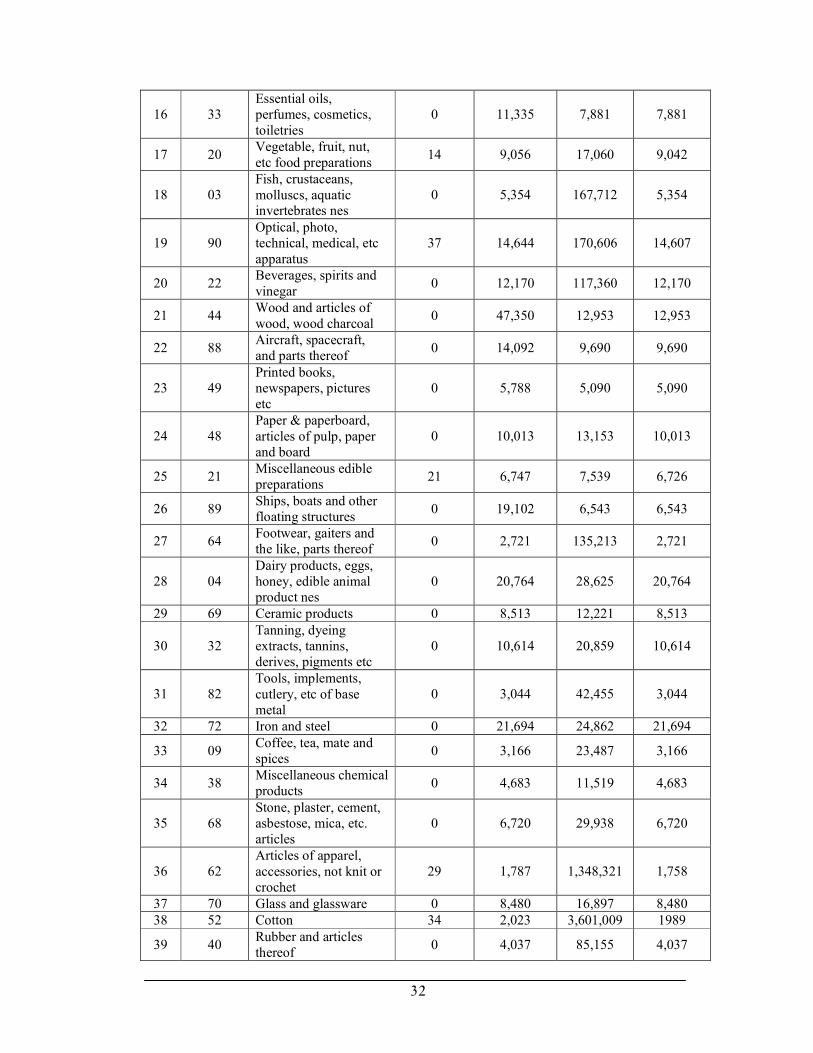
32
16 33 Essential oils, perfumes, cosmetics, toiletries
0 11,335 7,881 7,881
17 20 Vegetable, fruit, nut, etc food preparations
14 9,056 17,060 9,042
18 03 Fish, crustaceans, molluscs, aquatic invertebrates nes
0 5,354 167,712 5,354
19 90 Optical, photo, technical, medical, etc apparatus
37 14,644 170,606 14,607
20 22 Beverages, spirits and vinegar
0 12,170 117,360 12,170
21 44 Wood and articles of wood, wood charcoal
0 47,350 12,953 12,953
22 88 Aircraft, spacecraft, and parts thereof
0 14,092 9,690 9,690
23 49 Printed books, newspapers, pictures etc
0 5,788 5,090 5,090
24 48 Paper & paperboard, articles of pulp, paper and board
0 10,013 13,153 10,013
25 21 Miscellaneous edible preparations
21 6,747 7,539 6,726
26 89 Ships, boats and other floating structures
0 19,102 6,543 6,543
27 64 Footwear, gaiters and the like, parts thereof
0 2,721 135,213 2,721
28 04 Dairy products, eggs, honey, edible animal product nes
0 20,764 28,625 20,764
29 69 Ceramic products 0 8,513 12,221 8,513
30 32 Tanning, dyeing extracts, tannins, derives, pigments etc
0 10,614 20,859 10,614
31 82 Tools, implements, cutlery, etc of base metal
0 3,044 42,455 3,044
32 72 Iron and steel 0 21,694 24,862 21,694
33 09 Coffee, tea, mate and spices
0 3,166 23,487 3,166
34 38 Miscellaneous chemical products
0 4,683 11,519 4,683
35 68 Stone, plaster, cement, asbestose, mica, etc. articles
0 6,720 29,938 6,720
36 62 Articles of apparel, accessories, not knit or crochet
29 1,787 1,348,321 1,758
37 70 Glass and glassware 0 8,480 16,897 8,480
38 52 Cotton 34 2,023 3,601,009 1989
39 40 Rubber and articles thereof
0 4,037 85,155 4,037
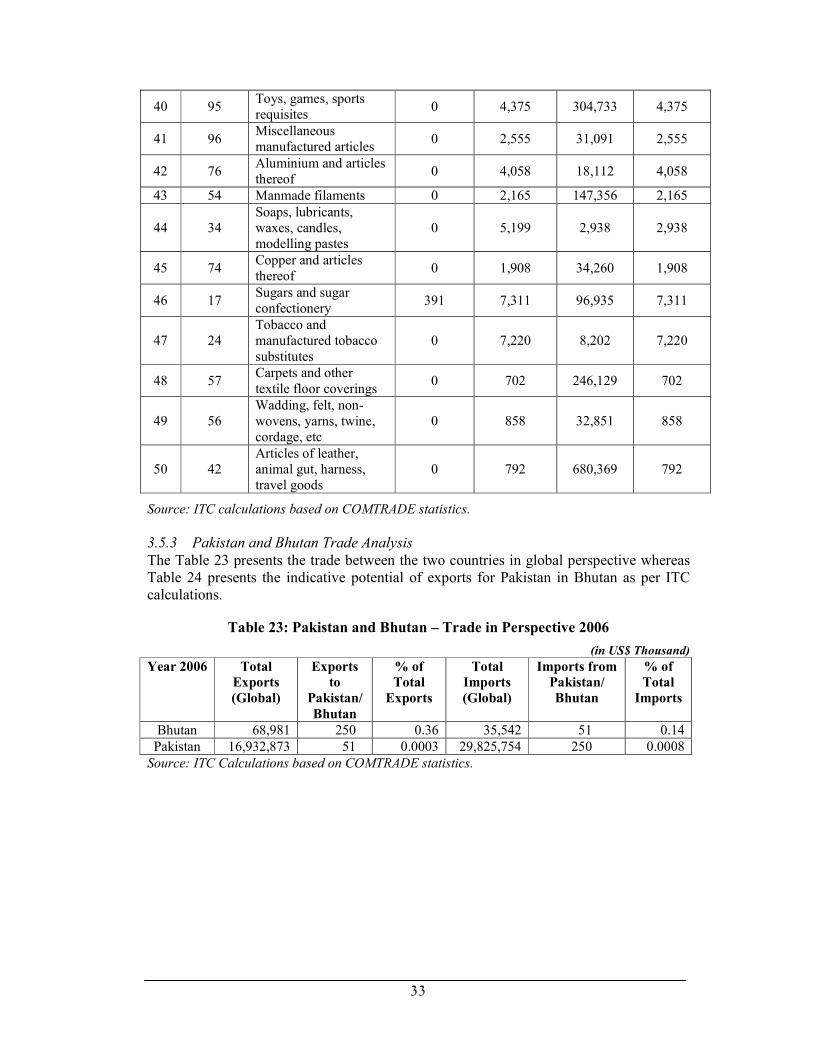
33
40 95 Toys, games, sports requisites
0 4,375 304,733 4,375
41 96 Miscellaneous manufactured articles
0 2,555 31,091 2,555
42 76 Aluminium and articles thereof
0 4,058 18,112 4,058
43 54 Manmade filaments 0 2,165 147,356 2,165
44 34 Soaps, lubricants, waxes, candles, modelling pastes
0 5,199 2,938 2,938
45 74 Copper and articles thereof
0 1,908 34,260 1,908
46 17 Sugars and sugar confectionery
391 7,311 96,935 7,311
47 24 Tobacco and manufactured tobacco substitutes
0 7,220 8,202 7,220
48 57 Carpets and other textile floor coverings
0 702 246,129 702
49 56 Wadding, felt, non-wovens, yarns, twine, cordage, etc
0 858 32,851 858
50 42 Articles of leather, animal gut, harness, travel goods
0 792 680,369 792
Source: ITC calculations based on COMTRADE statistics.
3.5.3 Pakistan and Bhutan Trade Analysis
The Table 23 presents the trade between the two countries in global perspective whereas Table 24 presents the indicative potential of exports for Pakistan in Bhutan as per ITC calculations.
Table 23: Pakistan and Bhutan – Trade in Perspective 2006
(in US$ Thousand)
Source: ITC Calculations based on COMTRADE statistics.
Year 2006 Total
Exports
(Global)
Exports
to
Pakistan/
Bhutan
% of
Total
Exports
Total
Imports
(Global)
Imports from
Pakistan/
Bhutan
% of
Total
Imports
Bhutan 68,981 250 0.36 35,542 51 0.14
Pakistan 16,932,873 51 0.0003 29,825,754 250 0.0008
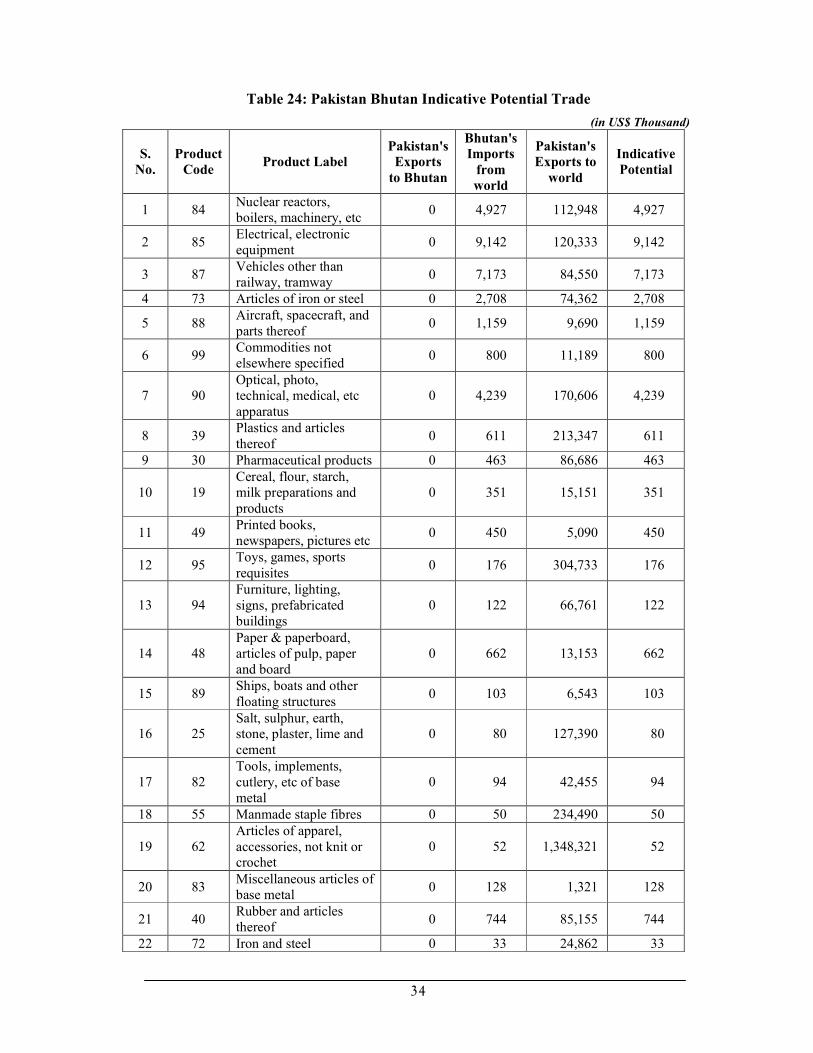
34
Table 24: Pakistan Bhutan Indicative Potential Trade
(in US$ Thousand)
S.
No.
Product
Code Product Label
Pakistan's
Exports
to Bhutan
Bhutan's
Imports
from
world
Pakistan's
Exports to
world
Indicative
Potential
1 84 Nuclear reactors, boilers, machinery, etc
0 4,927 112,948 4,927
2 85 Electrical, electronic equipment
0 9,142 120,333 9,142
3 87 Vehicles other than railway, tramway
0 7,173 84,550 7,173
4 73 Articles of iron or steel 0 2,708 74,362 2,708
5 88 Aircraft, spacecraft, and parts thereof
0 1,159 9,690 1,159
6 99 Commodities not elsewhere specified
0 800 11,189 800
7 90 Optical, photo, technical, medical, etc apparatus
0 4,239 170,606 4,239
8 39 Plastics and articles thereof
0 611 213,347 611
9 30 Pharmaceutical products 0 463 86,686 463
10 19 Cereal, flour, starch, milk preparations and products
0 351 15,151 351
11 49 Printed books, newspapers, pictures etc
0 450 5,090 450
12 95 Toys, games, sports requisites
0 176 304,733 176
13 94 Furniture, lighting, signs, prefabricated buildings
0 122 66,761 122
14 48 Paper & paperboard, articles of pulp, paper and board
0 662 13,153 662
15 89 Ships, boats and other floating structures
0 103 6,543 103
16 25 Salt, sulphur, earth, stone, plaster, lime and cement
0 80 127,390 80
17 82 Tools, implements, cutlery, etc of base metal
0 94 42,455 94
18 55 Manmade staple fibres 0 50 234,490 50
19 62 Articles of apparel, accessories, not knit or crochet
0 52 1,348,321 52
20 83 Miscellaneous articles of base metal
0 128 1,321 128
21 40 Rubber and articles thereof
0 744 85,155 744
22 72 Iron and steel 0 33 24,862 33
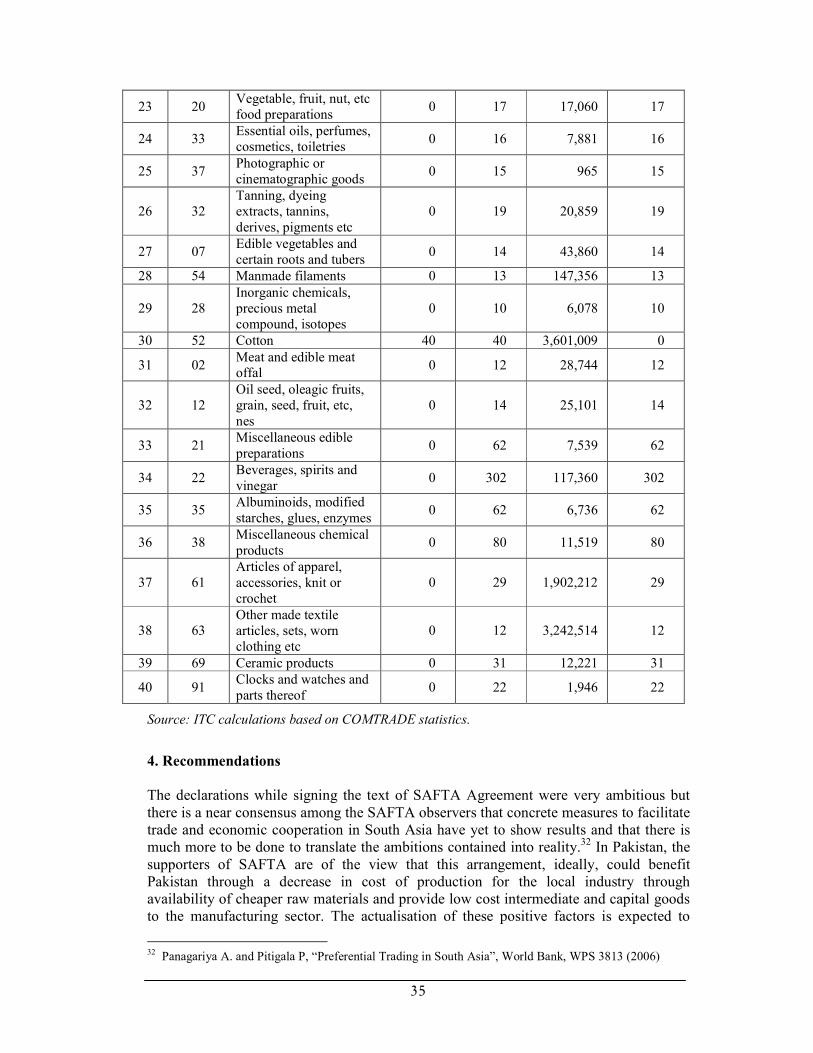
35
23 20 Vegetable, fruit, nut, etc food preparations
0 17 17,060 17
24 33 Essential oils, perfumes, cosmetics, toiletries
0 16 7,881 16
25 37 Photographic or cinematographic goods
0 15 965 15
26 32 Tanning, dyeing extracts, tannins, derives, pigments etc
0 19 20,859 19
27 07 Edible vegetables and certain roots and tubers
0 14 43,860 14
28 54 Manmade filaments 0 13 147,356 13
29 28 Inorganic chemicals, precious metal compound, isotopes
0 10 6,078 10
30 52 Cotton 40 40 3,601,009 0
31 02 Meat and edible meat offal
0 12 28,744 12
32 12 Oil seed, oleagic fruits, grain, seed, fruit, etc, nes
0 14 25,101 14
33 21 Miscellaneous edible preparations
0 62 7,539 62
34 22 Beverages, spirits and vinegar
0 302 117,360 302
35 35 Albuminoids, modified starches, glues, enzymes
0 62 6,736 62
36 38 Miscellaneous chemical products
0 80 11,519 80
37 61 Articles of apparel, accessories, knit or crochet
0 29 1,902,212 29
38 63 Other made textile articles, sets, worn clothing etc
0 12 3,242,514 12
39 69 Ceramic products 0 31 12,221 31
40 91 Clocks and watches and parts thereof
0 22 1,946 22
Source: ITC calculations based on COMTRADE statistics.
4. Recommendations
The declarations while signing the text of SAFTA Agreement were very ambitious but there is a near consensus among the SAFTA observers that concrete measures to facilitate trade and economic cooperation in South Asia have yet to show results and that there is much more to be done to translate the ambitions contained into reality.32 In Pakistan, the supporters of SAFTA are of the view that this arrangement, ideally, could benefit Pakistan through a decrease in cost of production for the local industry through availability of cheaper raw materials and provide low cost intermediate and capital goods to the manufacturing sector. The actualisation of these positive factors is expected to
32 Panagariya A. and Pitigala P, “Preferential Trading in South Asia”, World Bank, WPS 3813 (2006)

36
increase industrial competitiveness, enhance efficiency, provide much broader and deeper market to local producers and lead to lower prices for consumers and create higher disposable incomes in the region as a whole.
Contrasting these promises to be realised in future, the detractors, however, point towards the presence of a large number of limiting factors at present, such as a limited export basket, relatively inefficient and uncompetitive production structure in most of the SAFTA countries, a large number of NTBs and para-tariff barriers, particularly by India, barriers to investment, large scale informal-illegal border trade, poor cross-border trading infrastructures, continuing Indo-Pak political tensions and apprehensions about Indian size and intentions.
33
At the theoretical level, most of the models indicate that elements deemed essential for the success of a regional arrangements like high complementarities of economies, comparative advantage in different goods, difference in factor endowments, economies of scale and capacity to produce differentiated products are lacking in the region and many experts are sure that SAFTA Agreement would lead to trade diversion, and lower levels of efficiency and reduction in welfare in the countries of the region due to relatively high MFN rates and inadequate liberalisation effected by SAFTA. These arguments can not be dismissed out of hand. Each of the SAFTA countries has shielded approximately 20 percent of the tariff lines from liberalisation programme. The sensitive lists include goods from the agriculture sector, textile sector, chemical and leather, and sectors reserved for small scale industries. India has included all the textiles, rice, fruits and leather goods in its sensitive list.
The solutions to SAFTA constraints are well known such as shorter negative lists, deeper cuts in tariff reductions, mandatory tariffs cuts, more flexible RoO, time bound reduction of NTBs, harmonisation of standards, resolution of trade disputes, tapping the potential of investment, reductions in economic welfare would show up principally in reduced customs revenue and terms-of trade losses. The gradual approach being followed for the implementation in different areas might not let the benefits of increased competition, economies of scale and improved efficiencies of import competing firms could outweigh these overall economic costs. The leadership of SAARC countries should give a chance to these solutions by exploring the reasons for the slow progress and isolate the critical issues for giving a strategic push. The following recommendations can possibly help energise the SAFTA process.
4.1. Domestic Reform with Regional Imperatives
The potential of actual concessions should not be dismissed out of hand. The margins of preference could in fact be good enough to boost the intra-regional trade provided the supply side problems, behind the border issues are addressed. The limited tariff reduction can produce substantial firm level stimulus if the structural and institutional problems are identified and rectified, preferably in tandem with each other. Sensitive lists are stuffed with the export items of know potential but there might be many more non-traditional items which could benefit from the SAFTA concessions, which would become deeper from 2008 onwards.
33 Studies include: i) A.R. Kemal, et al, to Strengthen Regional trade cooperation in South Asia, PIDE, Islamabad, 2000. ii) The South Asian Free Trade Area: SAFTA Advantages and Challenges for Pakistan, PILDAT, 2004. iii) A.R. Kemal, SAFTA and Economical cooperation, PIDE, Islamabad, 2003

37
4.2. Domestic Preparedness
Where the delay in concluding DDA has created the opportunity for many countries to attend seriously to the regional integration options, it has also given an opportunity to the countries to prepare for the global integration. It appears that the SAARC countries did not capitalise on this opportunity and now, the economic context of the whole globe is fast changing with the arrival of recession in US. The global slow down would make the stabilisation efforts after a two decades of trade liberalisation, even more difficult. If the SAARC countries prefer to operate in the in the logic of stabilisation, their progress towards SAFTA would become even more hesitant.
4.3. Political Will
Traditionally, if the political will is faltering on regional integration, then business and civil initiatives become crucial but such initiatives would have the limits. Given the historical problems dogging South Asians, it sounds rather idealistic to wish that a new mindset for political elites was engendered in order to foster cooperation. In South Asia, the biases of nurtured by historical perceptions, visa problems, corruption and protracted conflicts continue to overshadow regional trade relations. We believe, the political will at the top did make an emphatic statement by signing SAFTA. We need equally to look elsewhere also for identifying the hesitant regional integrators such as the ‘nationalist’ academicians, technocrats, entrenched bureaucracies and corporate elite who may be less interested in the process due to their short term interests or due to their fixed ideas and parochial fascinations about the future. The political leadership did provide the necessary impetus by providing a road map of SAARC integration. It would be a weakness of the Track I if the principle stakeholders loose interest in the process.
4.4. Need to enhance Efficiency in Exports
Most of the South Asian countries are in-efficient exporters, with poorly performing Business Support Organisations. National governments as well SAARC Secretariat needs to focus on producing efficiencies, particularly at the firm level as well as at the sectoral levels. Though more trade is happening among the countries of the South as compared to earlier times, but still the principle sources of innovation, invention and integration of technologies is still the North. The gap between our academia and business is perhaps as big as always. Developing pro-innovation initiatives would go a long way in promoting the regionalization of supply chain and pave the way for the technology based regional joint ventures, which would be more competitive in the global arena.
4.5. Profit Shifting from International Firms to Regional Firms
At present the intra-industry trade in the principle sectors in different SAARC countries is minimal. Though many studies do not exist on intra-industry trade, it appears our firms trade more with international firms and involve in intense intra-industry competition at the regional level. A genuine profit shifting from global to regional firms can only take place with more intra-trade trade and cooperation, a kind of regional import substitution takes place. The presence of some trade diversion should not stop us from developing regional strategies of long term growth if the welfare gains remain within the region. The greater welfare gains in the long term could offset the short term losses due to trade diversion. But the welfare gains in future could only take place, if the region is going to have a shared future and moves towards a customs union fast enough. Fear of Indian firms’ domination is another ‘orthodoxy’, which needs to be kept away while developing strategies for the success of SAFTA.

38
4.6. Textile Vision for SAARC: South Asia as a Textile and Apparel Hub
South Asia produces more than one third of the global cotton production yet more of the inputs in national textile sectors come from out of the region. The experts have long been suggesting that the countries in the South Asia can form a major textile and apparel hub, provided they can work together to overcome the mutual mistrust and trade barriers against each other. After interacting with the business leaders in textiles, one feels that that there was a serious vision deficit to find innovative imaginative solutions for regionalisation of supply chain in textile and clothing sector. Though SAFTA members are increased the importation of raw materials and intermediate goods from each other in the SAARC region, the scope of trading and cooperation can be enlarged in many other areas too such as research, bio technology, training, exchange of human resource etc.
It is being expected that the inclusion of services and investment in SAFTA would enhance the business opportunities. This might prove to be true in some degree but the most important test and opportunity for the SAFTA process lies in the textile sector. It is not the MFN by Pakistan to India, which is going to give the much-needed impetus to the maximalist visions of the SAFTA process. SAARC countries, along with the ongoing efforts at expanding the scope of the SAFTA process and addressing the constraints and issues in the domain of trade facilitation, need to undertake a big effort in order to make South Asia the textile and apparel hub.
They need to commit to a South Asian Textile Vision 2020 in the form of a separate agreement, focussing on regional cooperation in trade, investment, esearch and development (R&D) and skill development in the textile sector, with a focus more on stabilisation and compensation policies instead of sensitive lists. It would be perhaps more important to first sign an Investment Agreement in the textile sector instead of signing a general agreement on investment, possibly establishing a Fund for investments in the textile sector across South Asia. Textile, in fact, has become a ‘strategy paradox’ for South Asians. It is in textiles that SAFTA would rise or fall. Making textile a champion sector could bring in Maldives and Nepal also in the fast track development in it as well as Afghanistan through the Reconstruction and Opportunity Zones, being negotiated between Pakistan and US these days. Textiles can in fact lead the process of faster but controlled economic integration and needs to be dealt separately and seriously.
4.7. Trans-Frontier Cooperation
In the regions hitherto affected b the conflict or a region with strong sentiments vis-à-vis other communities, carefully designed trans-frontier cooperation can gradually help create the trust and in many cases welfare too by making more efficient trading possible with minimum transportation costs. Trans-frontier cooperation has been given a chance in many areas such as EU and Black Sea Region with positive results. The collaboration and business in terms of services sector can best be actualised if, in the beginning, the provision of services is made in the context of trans-frontier cooperation. The SAARC member countries can identify a few regions for starting concrete initiatives of trans-frontier circulation of goods and services. This can also help improve the ‘connectivity’ which is hampering the smooth flow of trade as in many cases, the border areas do not have the necessary infrastructure to sustain high volume traffic, as is happening in case of cement being transported by road from Pakistan to India via Wagha Border.

39
4.8. Research Support for SAFTA
In the coming years, SAFTA member countries are going to effect deeper tariff cuts. Hopefully they would shorten the sensitive lists also. This would necessitate more research at the sectoral level to measure the impact of the Trade Liberalisation Programme of SAFTA. Such studies, both at the bilateral as well as on the regional level, can supplement the intra-regional studies.
4.9. Strengthening Regional Identity
The presence of a regional identity is usually an essential resource for any meaningful long term cooperation. Though the current perceptions in many South Asian communities about each other are problematic in different ways, there is an incontrovertible evidence that the regions forming South Asia interacted more among each other than any other region/country in the world, economically, politically, socially and culturally. Unfortunately, our dominant discourse is heavily coloured by some reactions developed during the colonial period. Many Indians for example suggest that Pakistan and Bangladesh were essentially a creation of the British, and many Pakistani and Bangladesh consider that the modern Indian state is bent upon becoming another Colonial Empire, shaped on the British colonial empire.
But many more people believe that such arguments and beliefs violate against the historical experience of communities and regions in the Indian sub-continent, prior to British where the communities co-existed either without a central authority or a nominal authority for most of the time. For many the experience of communities and regions through the known history of Indian sub-continent is a positive baggage, which does provide a shared sense of identity too. It is now the desire and willingness of leadership in different areas and spheres of life to project this identity in non-contestational way into the future and embark upon a process of regional cooperation with promise of development to the ordinary people of South Asia and malice towards none – neither within the region nor for the outsiders.
4.10 Overcoming the Difficulties in Enhancing the Cooperation between the Agricultural Sectors
The most neglected area for mutual collaboration in the SAFTA context is the agriculture, which is the most promising also in the context of price escalation of food products and the expected increase in the demand of agri-products with the increasing prosperity in South Asia. The agriculture should interest Indians the most as in the coming days it would be in their national interest to develop reliable supply chains of food items.34
The agricultural sectors in almost all the South Asian countries are still under the shadows of inefficient public sector organisation particularly in Research, Extension and price support and procurement. These sub-sectors are traditionally inward looking and more often than not in the midst of restructuring in a hope to shed the inefficiencies. Developing agriculture in South Asia can not only increase the agricultural productivity, it also has a great potential to reduce poverty and give an impetus to local consumption. There is a need of undertaking a major drive to enhance the cooperation and trading in agriculture elated technologies, agricultural production including livestock, fisheries through joint activities, collaborative research programmes, exchange of scientific
34 MTI Consulting Report on Competitiveness 2008, www.mtiworldwide.com

40
materials, information and personnel. This could be done by identifying an agenda for the SAFTA focus on agriculture in order to give it a big push. The member countries need to accept that their respective institutions in agricultural sector are slow, parochial, outmoded in most of the cases and more often than not are cash starved. Left to themselves they are devoid of imagination and short on ideas of leveraging, as they tend to be very protectionist. There is a need, in the first place, to develop robust agricultural trade policy in each country and, in the second place, seek a regional agricultural trade policy.
4.11. Learning from the History of South-South Cooperation
Both at the track I and II, we need to realise that we are beset with the same old problems, which have been hampering the prospects of South-South cooperation such as lack of trust, tendency to short change, absence of big players, low performance on innovation etc. We need to learn from this experience and move forward with improved strategies. It has been empirically demonstrated that the transfer of resources and technology through South-South joint ventures is more appropriate and cost effective for receiving country than similar transfers affected by Trans-national Corporations (TNCs) based in industrial countries. But despite such empirical evidences, the cooperation among South-South countries has been slow. Recently, the trade flows among South countries have picked up significantly, which is a sign of hope. But this has also accentuated the asymmetries also within the South.
As result the policies and preferences of ‘emerging economies’ can start becoming different from the ‘developing economies’. The emerging economies tend to trade more with each other and are encouraging this trend by signing trans-regional trade agreements. A disregard by the strong emerging economies to the imperative of egalitarian regional development does not augur well for a genuine regional integration and there is a need that the emerging economies such as India and Pakistan balance their trans-regional and ambitions and regional options.
4.12. Need to Bring the Regional Firms at the Centre Stage
Pakistan has considerably lowered its tariff levels and de-regulated almost all the sectors of the economy. This transformation needed an effective judicious institutional response to consolidate the gains and offset the risks. The tariff rationalisation has been well meant but the stabilisation process has been handled perhaps less efficiently. The results and effects of strategic trade policy initiatives in Pakistan have been rather mixed. It is feared that the relative inability of Pakistani firms to benefit from profit shifting vis-à-vis their international competitors, with all these supply side constraints, could soon create a more protective atmosphere, which would be detrimental to regional and/or global integration.
The main challenge SAFTA or for that matter any RTA in South has is to strengthen member’s comparative advantages. This can happen only if their strategic trade policies can help effect significant profit shifting from international firms especially from north to regional firms. The objective for SAFTA should be to help emerge strong regional firms in different sectors. If we look at the trade flows of India in South Asia, India appears to be specialising in a few sectors and we can see the emergence of large firms, with regional and international reach. More benefits can accrue to the other South Asian countries, if the emergence of regional multinationals is accompanied by successful region wide joint ventures (JVs). In a spirit of openness, the Indian firms might also be
41
keen in developing genuine regional partnership instead of developing monopolistic and monopsonic tendencies.
The literature on the performance of region wide JVs and mergers and acquisitions (M&As) in the corporate sector is almost absent in the South Asian context as the regional initiatives are practically non-existent. In fact, the culture and practice of trust and the institutions, handling corporate issues emerging out of the difficulties JV’s face, are week in the national contexts. We have to undertake many more efforts at strengthening the institutional framework to let regional JV’s and M&As work. There is a need to problematise and discuss the issues, which could emerge and their possible solutions now, as SAARC countries are talking about bringing investment and services sector into the ambit of SAFTA, which are expected to have region wide business initiatives in a different way than the trading in merchandise. In other words, we do expect a lot from the inclusion of services and investment in the ambit of SAFTA but, if our preparedness remains week as is the case with merchandise trade, the expansion of SAFTA would perhaps bring very little.
5. Regionalism vs Multilateralism: Choices for Pakistan If we look at Pakistan’s actions and initiatives during the past few years, especially at WTO negotiating tables and through the history of Pakistan’s compliance with WTO process, Pakistan appears to be committed to MTS. But lately, it could be found exploring the benefits regional and/or trans-regional trading agreements can offer. Being a founding member of GATT in 1948 and the WTO in 1995, Pakistan has been a keen supporter of an open, transparent and rules-based MTS. Pakistan has been actively participating in all DDA negotiations but its key interests lie in market access and rules areas. Since 2003, it has taken part in all Ministerial level meetings. It has floated a large number of papers either on its own, or in collaboration with other countries. Its foremost objective in these negotiations has been to ensure removal of tariff peaks and high tariffs on products of its export interest. To this end, Pakistan has been an active player in the NAMA negotiations. It is a common belief in Pakistan that the reason its Commerce Minister was asked by the WTO members to be the NAMA facilitator, at the Hong Kong Ministerial Conference in December 2005, was a recognition of its pre-eminent and constructive role in the NAMA negotiations. But Pakistan has been aware that almost every country in the world is exploring the benefits being offered by regional integration, whatever might be the reasons offered and there is no reason that Pakistan should be left behind.
35
Except in limited academic circles, the popular debate whether regional agreements would be building blocks or stumbling blocks in the way of multilaterism does not really exist in Pakistan. As the developments collectively termed ‘regionalism’ are becoming more and more visible, there is a much keener interest in the process. Recent developments such as the emergence of 27 member EU, American drive for FTAs and its desire to transform North American Free Trade Agreement (NAFTA) into a kind of United Communities of North America, EU’s keenness on signing a Comprehensive Economic Partnership Agreement (CEPA) with India while giving a cold shoulder to Pakistan for the same, are making opinion makers aware that the regionalism, which
35 Trade Policy speech of Pakistan’s Commerce Minister, July 2007, www.commerce.gov.pk

42
initially started with trade integration in most of the cases, has started impacting more and more upon the international political economy structures. In this context SAFTA’s relevance would be put under growing scrutiny in coming years as Pakistan weighs its options. Indian desire to sign up all the SAARC countries minus Pakistan in bilateral FTAs is convincing people in Pakistan of the irrelevance and vacuity of all the voices you hear every now and then, especially in cultural industries of India, for imagining a new south Asia and more importantly of the seeming inability or lack of interest on the part of Indians in addressing the issues of asymmetries in South Asia. Indian assertions on Pakistan’s culpability in slowing down the SAFTA process notwithstanding, there is a growing realization in Pakistan, that the future of SAFTA almost entirely depends on India if South Asia has to become a dynamic regional block like EU or Association of Southeast Asian Nations (ASEAN). For the future of the regional political economy, Pakistanis know that the Indian perspective would be more consequential than theirs and they would be made to wait, watch and guess for formulating their reaction to the future of the region. The theoretical debate of the merits of regionalism and multilateralism apart, in the context of SAFTA, the real difference would be made due to the differing assumptions each individual country would make about the intentions and capacities of the other member countries. There is a feeling in Pakistan that the smaller countries in SAARC want a different kind of regionalism as compared to the Indian notion. But being aware that all the initiative in reality is with India, Pakistan’s positions have become reactive and defensive, which might make a candid debate on a common vision for South Asia more difficult than ever. Looking at the international experience, some regions have emerged primarily as political and diplomatic initiatives such as ASEAN, whereas, on the other pole are the blocks, which had serious political differences, and they put a premium on trade and have been hoping that the increasing mutual benefits from trade would help them develop political common ground also such as EU. Grand rhetorical announcement about the grand future of South Asia apart, SAARC also appears to have started from the trade side and Pakistan would like to emulate the successful emergence of EU as a model of mutually beneficial economic integration, in which enhanced trade and economic integration helps solve the conflicts and in return and at an appropriate time, the member countries were willing to align their concerns of sovereignty with the shred vision of European Communities. Due to persistence of conflict in South Asia and the inability of SAARC members to come up with innovative and imaginative solutions to the problems of asymmetries in South Asia, Pakistan could not be expected to give up some of her sovereignty to consolidate SAFTA as the best option to protect the regional interests in a multi-polar world. In fact, the recent drive by the Indians to sign trans-regional trade agreements aiming at becoming a member of ‘rich boys club has made Pakistanis wary and pessimistic about the regional collaboration, as it wanted SAARC as a whole to have a better bargaining power as regional block. In recognition of the changing power balance at the international level, the recent attempt to reform the Security Council of United Nations gave an opportunity to different regions such as the African Union to assert their collective bargaining power but the Indian

43
insistence to become a member of Security Council with a veto power down the road has brought home the point that India is not all interested in a common identity of South Asia nor does it has a vision of South Asia in which all the members of SAARC could partake. Devoid of any broader, long term hopes or considerations, SAFTA process for Pakistan boils down to a limited exercise in increasing the trade policy space within the region and selectively liberalise some sectors of the economy with an acute defensive sense that SAFTA can possibly produce positive spillovers in the current circumstances. The appearance of a large number of initiatives of trans-regional trade agreements, among the bigger countries in different regions such as India-South Africa, India-South Africa-Brazil etc., prove the predominance of ‘market driven integration’ at the cost of ‘policy’ driven integration. The trade history of the modern world affords many successful examples of ‘policy’ driven integration, which can be more effective with the advantage of geographical proximity. India perhaps is unconsciously following the American example of integrating, especially, isolated smaller countries in a ring of Trade or Investment Agreements, with clear geo-strategic ‘hegemonic’ undertones.36 The tendency is being followed by many other regional powers also, which allow, usually with unilateral zero-rating, the smaller economies to latch on the hub. In many regions of the world, some countries, with significant asymmetries, are willing to benefit from the opportunities offered by the hub as in case of Southern Africa. But for middle sized, middle income countries like Pakistan, such initiatives appear like conscious efforts at the regional marginalisation, re-affirming the fact that in the final analysis politics and economics remain joined at the hip. In the regional context, Pakistan feels that India’s initiatives of signing trans-regional trade agreements with North or emerging South are market driven whereas, within SAFTA, with smaller countries, the unilateral trade liberalisation is ‘politically’ driven, as a result of which Pakistan has left with fewer choices. Pakistan happens to be at the confluence of three regions, i.e. South Asia, Central Asia and Middle East. It is embedded more in South Asia and its strategic location could be a huge advantage to a fast progressing SAFTA. But with the policy space for mutually beneficial economic integration within South Asia shrinking by the day, Pakistan is trying to explore the benefits of regional integration with Central Asia and Middle East on its own as well as with the countries and communities out of these regions. Affirming its historical Central Asian linkages, Pakistan became a member of the Economic Cooperation Organisation (ECO) Trade Agreement (eCOTA) signed by Afghanistan, Iran, Pakistan and Turkey along with six Central Asian states in July 2003. This Agreement, however, has still not entered in force for want of ratification. A more or less similar initiative in the pipeline is the Framework Agreement on the Trade Preferential System among Organisation of Islamic Conference (OIC) member states, which is likely to conclude by January 2009. Pakistan is also engaged in a dialogue for negotiating FTA with Gulf Cooperation Council (Bahrain, Kuwait, Oman, Qatar, Saudi Arabia and UAE). As the negotiations for these plurilateral negotiations are at an early stage and the literature on their potential costs and benefits almost absent, it is hard to dwell upon their significance on the SAFTA process at this point and time. In this connection, Pakistan’s bilateral FTAs, which it lately appears to be pursuing much more vigourously, are more relevant for Pakistan’s role and commitment to SAFTA process.
36 Venaik, A, Masks of Empire, Tulika Books, Chennai, 2007

44
The most significant perhaps in this regard is the FTA with China covering goods as well as investments, which became effective from July 01, 2007. Many of Pakistan exportable products such as textiles, fruits and vegetables, gems and jewellery, engineering goods, leather products, sports goods, surgical goods, marble products and industrial alcohol can enter the Chinese markets at zero duty or concessionary duties. Both the countries have already held three sessions on including services sector in the FTA. PTA with Iran is operative since September 2006. Though no independent studies appear to have been conducted about the actual or projected performance of Pakistan-Iran PTA, but it appears that the impact of this PTA is not significant. The margin of concessions does not seem to be enough to stimulate more trade. For example, in case of textiles, the margin of preference ranges between 15 percent and 20 percent of the applied rate of duty but this size of margin does not appear to be enough to make Pakistan’s export really competitive vis-à-vis its competitors. Pakistan is also working to have bilateral FTAs with major countries of the ASEAN as well as to negotiate a bilateral agreement with the entire association on a 10+1 basis. FTA with Malaysia, covering trade in goods, services, investments and customs cooperation has been recently concluded, and the agreement has entered into force from January 01, 2008. Pakistan is also interested to start negotiations with the EU but it appears EU for the moment is more interested in the bigger market next door. Pakistan has negotiated a PTA of limited import with Mauritius and is hoping to conclude a few more market access initiatives in the coming months. More than 50 percent of Pakistan’s total exports go to US and EU. It has been a long term policy objective of the government of Pakistan to improve market access with these traditional trading partners. But the results in this regard have not always been very positive. A case in point is the GSP scheme of EU, which is discriminatory as similarly placed countries are being treated differently on the basis of a closed list. With the US its single largest trading partner Pakistan is finding it hard to agree to WTO plus conditions to set up Reconstruction and Opportunity Zones in the North West of the country. As for the Investment Agreement with US, Pakistan is facing the typical problems faced by a country from South while signing bilateral agreement with a big partner from North. Despite the presence of a large number of bilateral and multilateral FTAs/PTAs, most of Pakistan’s trade continues to take place out of these arrangements. Pakistan is trying to deepen some of these arrangements but the reality, which is dawning upon Pakistan, after having these shallow RTAs, is that preferential market access is only one part of the problem. It is the general competitiveness of Pakistani products, which is equally important. Pakistani exports have been depending rather heavily on ‘preferences’ and quotas such as GSP, Post 9/11 concessions, MFA etc. If mutual granting of concessions can create trade, it is obviously a better trade policy option. But bigger concessions from its FTA partners would merely be trade diverting if Pakistani products are not very competitive. Much of the trade barriers in the world have already come down. With a breakthrough in DDA or through the web of regional and trans-regional trade agreements, the tariff levels are coming further down, gradually but surely. If Pakistan does not improve the competitiveness of its major export sectors in the near future, the government could possibly support the low productivity in the short term but in the long run, it would be required to pay a heavy political price for getting deeper
45
tariff concessions and support, which might have adverse third country effects but would nonetheless be able to support Pakistani exporters for some time. Pakistan is in the final stages of concluding the structural reforms and a lot depends on the success of the second generation reforms, which could hopefully make the leading Pakistani export sectors more competitive paving the way for Pakistan to benefit from the RTAs signed and going to be signed in the region as well as beyond South Asia. As stated earlier, Pakistan does not have any meaningful preferential agreements with its major trade partners, i.e. US, EU, Japan, Saudi Arabia, UAE etc. We can say that Pakistan actually has not really tasted the benefits of trade integration as such as it is struggling with the after effects of the trade liberalisation it has done till date and is in the midst of developing an effective institutional response not only to stabilise but also to take the process of reform farther. In other words, Pakistan remains more in the logic of stabilisation after the trade liberalisation of the last 20 years as compared to the futuristic logic of economic integration in the region. But externally too, there does not seem to be a big pull towards regional economic integration promising greater trade flows and across the board development within the region and a possible relative decoupling with the North down the road.

46
Annexure I
Non – Tariff Barriers in India
S. No. Description of Product/
Other Aspects (HS
Code, if relevant)
Description of Barriers (including
legislation, if identified)
REMARKS
1. All products Since more than one Ministries/ Departments are involved in the regulation of imports, each has their own sets of rules and procedures. Though this may be true for other countries as well, in case of India there is no single official publication/compendium that might cover all information on tariffs, tax rates and other relevant procedural formalities to facilitate the exporters.
This results in uncertainties and delays; discourages prospective exporters and acts as a NTB.
2. All products The relevant clauses of Indian Customs Act i.e. Section 2(41) and Section 14(1) provide the officers entrusted with evaluation with discretion beyond the international norms and practices. In some cases this discretion is exercised on a country to country basis.
- Unnecessary and multiple queries on bills of entry on Pakistani exports.
Indian Customs Valuation methodology does not reflect actual transactions values and effectively raises tariff rates.
This acts as harassment for exporters.
3. All Products Separate tariffs and Federal excise tax schedules, as well as additional public notifications and notices to determine current tariff and tax rates and or other requirements for imports into India.
- Absence of a simplified and transparent tariff regime acts as NTB.
4. All products - Indian states have also adopted measures which restrict the use, sale and consumption of many other agricultural and industrial products. Full view of these measures is difficult to ascertain for lack of any published or electronically available material.
The lengthy procedures discourage importers.
5. All products In India each state has its own set of rules with regard to inter state movement of goods. Goods moving across the states are also subject to further inspection and even taxes/fees.
The procedures cause waste of time and money.
6. All products In many cases Indian banks do not accept LCs issued by Pakistani banks in favour of general exporters.
In view of this phenomenon, in most of the cases payments between Pakistani exporters and Indian importers are settled through the Asian Currency Union, which adds to the transaction cost and therefore acts as NTB.
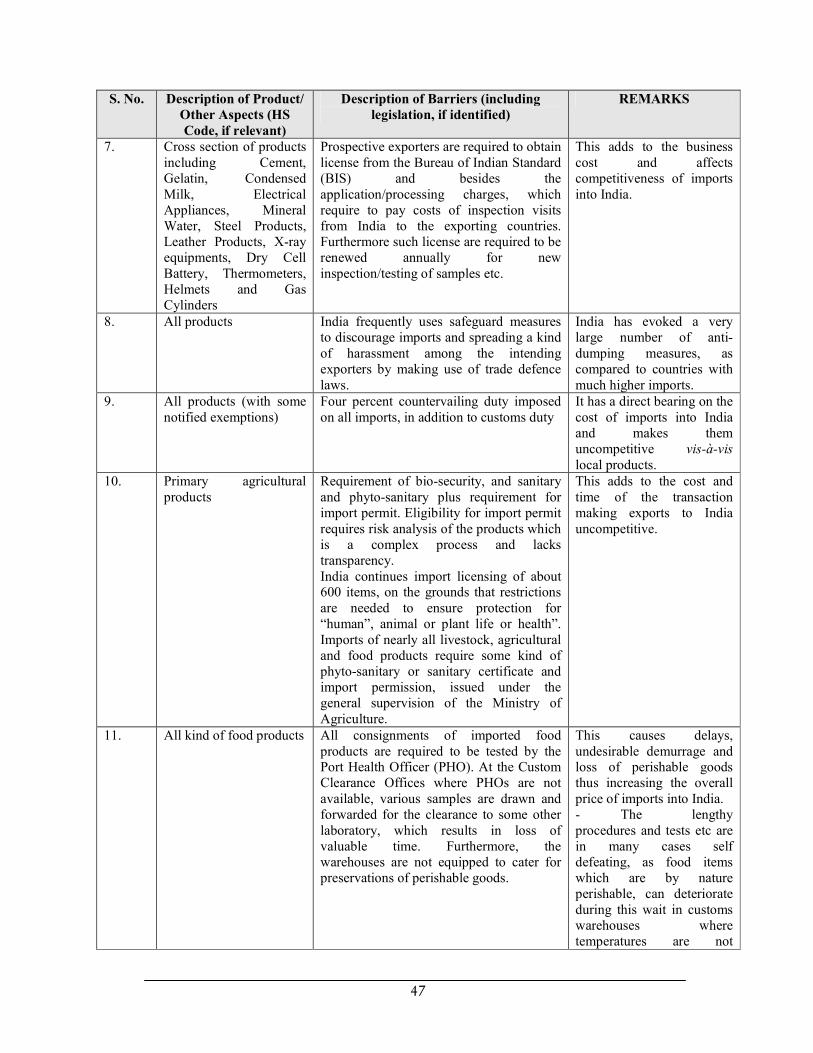
47
S. No. Description of Product/
Other Aspects (HS
Code, if relevant)
Description of Barriers (including
legislation, if identified)
REMARKS
7. Cross section of products including Cement, Gelatin, Condensed Milk, Electrical Appliances, Mineral Water, Steel Products, Leather Products, X-ray equipments, Dry Cell Battery, Thermometers, Helmets and Gas Cylinders
Prospective exporters are required to obtain license from the Bureau of Indian Standard (BIS) and besides the application/processing charges, which require to pay costs of inspection visits from India to the exporting countries. Furthermore such license are required to be renewed annually for new inspection/testing of samples etc.
This adds to the business cost and affects competitiveness of imports into India.
8. All products India frequently uses safeguard measures to discourage imports and spreading a kind of harassment among the intending exporters by making use of trade defence laws.
India has evoked a very large number of anti-dumping measures, as compared to countries with much higher imports.
9. All products (with some notified exemptions)
Four percent countervailing duty imposed on all imports, in addition to customs duty
It has a direct bearing on the cost of imports into India and makes them uncompetitive vis-à-vis local products.
10. Primary agricultural products
Requirement of bio-security, and sanitary and phyto-sanitary plus requirement for import permit. Eligibility for import permit requires risk analysis of the products which is a complex process and lacks transparency. India continues import licensing of about 600 items, on the grounds that restrictions are needed to ensure protection for “human”, animal or plant life or health”. Imports of nearly all livestock, agricultural and food products require some kind of phyto-sanitary or sanitary certificate and import permission, issued under the general supervision of the Ministry of Agriculture.
This adds to the cost and time of the transaction making exports to India uncompetitive.
11. All kind of food products All consignments of imported food products are required to be tested by the Port Health Officer (PHO). At the Custom Clearance Offices where PHOs are not available, various samples are drawn and forwarded for the clearance to some other laboratory, which results in loss of valuable time. Furthermore, the warehouses are not equipped to cater for preservations of perishable goods.
This causes delays, undesirable demurrage and loss of perishable goods thus increasing the overall price of imports into India. - The lengthy procedures and tests etc are in many cases self defeating, as food items which are by nature perishable, can deteriorate during this wait in customs warehouses where temperatures are not

48
S. No. Description of Product/
Other Aspects (HS
Code, if relevant)
Description of Barriers (including
legislation, if identified)
REMARKS
controlled. However, these are very effective as an NTB.
12. All kind of food products A 100 percent check is normally done on food products. The laboratories are meant to conduct the control of compliance, with the Prevention of Food Adulteration Rules, Standards and Measures Rules and other requirements (such as control of the mark of certification for the products subject to compulsory certification or the requirements on non vegetarian symbols or vegetarian symbols and any requirement under other acts such as Meat Food Product Order, 1973, Plants, Fruits and Seeds Order, 1989; the Livestock Act etc). This means that the product composition, the size of packaging as well as the labels are thoroughly checked
As PFA rules are very detailed and complex, inspectors are alleged to use these regulations to discourage imports and this obviously leads to corrupt practices. The lists of rules, regulations and standards of all kinds for food products, especially packaged food are endless.
13. Sensitive items Sensitive items could only be imported from specified ports and land customs stations. (11 customs ports out of total of 21516 and one out of 51 inland container depots).
Clothing accessories could only be imported from five specified ports and two inland container depots.
Exports are restricted and additional costs are to be paid by exporters by diverting cargo to the designated ports.
14. Poultry, dairy products and meat (frozen, chilled or fresh)
Requirement of import permit from the Department of Animal Husbandry & Dairy which is a time consuming process.
Affects cost of imports into India.
15. Processed food products Compliance of Food Adulteration (Prevention) Act 1954 that requires shelf life to be not less 60 percent of original shelf life at the time of import. Determination of shelf life often done arbitrarily and without transparency
This discourages exporters from other countries.
16. Leather, leather goods and melamine products
Requirement of laboratory testing. Samples of export consignment are sent to testing laboratory far away from Customs points.
This causes delays and undesirable demurrage, thus adding affecting competitiveness of imports into India.
17. Pre-packaged products (such processed foods, cosmetics, toiletries, spices, etc)
All prepackaged commodities, imported into India, shall in particular carry the following declarations: (a) Name and address of the importer; (b) Generic or common name of the
commodity packed; (c) Net quantity in terms of standard unit
of weights and measures. If the net quantity in the imported package is given in any other unit, its equivalent
While requirements at (b), (c) and (d) may be justifiable, those at (a) and (e) are difficult to be implemented and add to the time and cost of transactions.

49
S. No. Description of Product/
Other Aspects (HS
Code, if relevant)
Description of Barriers (including
legislation, if identified)
REMARKS
in terms of standard units shall be declared by the importer;
(d) Month and year of packing in which the commodity is manufactured or packed or imported; and
(e) Maximum retail sale price at which the commodity is packaged form may be sold to the ultimate consumer. This price shall include all taxes local or otherwise, freight, transport charges, commission payment to dealers, and all charges towards advertising, delivery, packing, forwarding and the like, as the case may be.
“Rule 32 of the Prevention of Food Adulteration Rules (P.F.A), 1955 deals with packing and labelling of foods. This rule alone has 30 provisos and provisos within provisos. In addition there are also cross references to other rules. These rules prescribe the contents to be specified on the label, the size of the label, the design of the label, the areas specified for display panels, details of colours and flavours, trade name or description of food contained in the package, names of ingredients used in the product by weight and volume etc.” - Goods are cleared only on receipt of the test report. Details in such testing are endemic. No certificate from the country of origin is accepted.
- The results of the laboratory tests cannot be challenged. Separate regulations have been enacted for different food items.
- The rules and regulations are very complicated and detailed. Customs authorities have enormous powers to detain and even completely stop imports for minor infringements of the rules. The procedural formalities take longer time for completion.
18. Textile and textile products
- Following trade restrictive measures are applied to use of AZO dyes in manufacture of fabrics: -
• Pre-shipment inspection certificate from textile testing laboratory accredited to the National Accreditation Agency of the country of
Pakistan has banned the import of AZO dyes but still consignments exported to India are tested.

50
S. No. Description of Product/
Other Aspects (HS
Code, if relevant)
Description of Barriers (including
legislation, if identified)
REMARKS
origin.
• Non-availability of the certificate requires testing from the notified agencies in India for each and every Colour of every consignment.
1. In some cases, even certificates by EU accredited labs on this account have been rejected by Indian Customs and such consignments are subjected to repeat tests in India. Marking requirements for Textile:
• Textile (consumer protection) Regulation of 1988 imposes strict marking requirements for yarns, fibres, fabrics imported into India.
• Following marking are required to be clearly visible on the face plait of each piece of quality.
(a) Name and address of manufacturer and the and the person who causes such manufacture. (b) Description of the cloth e.g. “dhoti”, “sari”, suiting, etc. (c) Sort number of cloth.
• Length in metres and width in centimeters and “fast to normal washing” or “not fast to normal indication.
• To indicate process like pre-shrink or mercerised.
• The words “seconds” or “damage”/”defective piece” when the piece of cloth is specified as such.
• In case the cloth made from manmade fibre or filament yarns the words “made from” followed by the words spun/spun, filament/filament or spun/filament.
• Month and year of packing.
• The exact composition of the cloth expressed in percentage by weight on each of the individual constituents of fabric.
• The marking to be made on alternate meter of the cloth at a higher not exceeding 2. 5 centimeters from the selvage.
• Marking of the words and letters has to be made in Hindi and in English in capital letters.
• The size of character has also been
It takes seven days to three months for testing.
The cost of such tests and procedures represent 10 percent of the value of consignment. The complex set of regulations discourage exporters, effect cost competitiveness of exports to India and delay clearance at the customs stage. There is no written instructions/rules or guidelines for Customs in this regard. Such instructions are given on/for individual consignments. In many cases these restrictions and regulations can result in stoppage of imports into India. In such

51
S. No. Description of Product/
Other Aspects (HS
Code, if relevant)
Description of Barriers (including
legislation, if identified)
REMARKS
specified.
• The consignments are examined/checked 100 percent for verification.
cases these regulations actually work as Quantitative restrictions.
19. Woolen Textiles • In the case of woolen textiles a certificate from brand owners that the product is genuine and the exporters and /or manufacturers have the authority to use the brand name must also accompany A certificate of origin is also required for all woolen textile products, even if no concessions are being claimed.
Additional cost are involved which delay transactions.
20. Pharmaceutical products Stringent requirements of registration of the drug with the Central Drug Standard Control Organisation, which are an arduous and highly time-consuming procedure.
Import licensing for pharmaceuticals was introduced in April, 2003.Foreign manufacturers must register and subject their premises ton inspection along the lines of rules prepared by the BIS.
Affects cost/ competitiveness of exports to India.
21. Automotive Vehicles • New vehicles can only be imported from the country of manufacture and their import is permissible only through three Customs ports at Nhava Sheva, Kolkata and Chennai.
• The second hand or used vehicles imported into India are required to have a minimum roadworthiness for a period of five years from the date of importation into India, with the assurance for providing service facilities within the country during the five-year period from the manufacturer.
• At the time of importation, the importer must have a certificate issued by a testing agency that the second hand or used vehicle being imported into India has been tested immediately before shipment for export to India and that the said vehicle conforms to all the regulations specified in the Motor Vehicles Act, 1988.
• Also, a certification has to be submitted that the said vehicle conforms to the original homologation certificate issued at the time of manufacture. On arrival at the Indian
The complex procedures render imports expensive and waste time.

52
S. No. Description of Product/
Other Aspects (HS
Code, if relevant)
Description of Barriers (including
legislation, if identified)
REMARKS
port but before clearance for home consumption, the importer also has to get the second-hand or used vehicle tested by the Vehicle Research and Development Establishment, or Automotive Research Association of India, or Central Farm Machinery Training and Testing Institute and other agencies specified by the Central Government.
• The certification of road safety tests, emission standards tests and the “Homologation Certificate”, generally require at least six months, of very strenuous and detailed tests.
22. Motorcycles Government of India requires special licenses for importing motorcycles. These licenses are These licenses are virtually impossible to obtain. Import licenses for motor vehicles are granted only to these foreign nationals:- (i) Permanently residing in India; (ii) Working in India from foreign firms
that hold greater than 30 percent equity, or
(iii) Working at Embassies located in India.
Importers of vehicles of any type face restrictive and trade distorting import practices.
23. Consumer goods imported in retail packing
The DGFT notification 44(re)/24.11.2000 on labelling and marking rules for imports issued on 24 November stipulates that maximum retail price (MRP), generic name of product, month and year of entry in trade channel, importer name and address and quantity in standard units must be carried prominently on the “principle display panel” of the packages. The requirement must be met before import clearance from customs.
The stipulation regarding labelling and marking requirements on traded/packaged goods are laid down in a number of Central Acts and Rules. Apart from this, the States have their own regulations in the matter.
24. Rough Marble blocks/slabs
Import of “marble and travertine – crude or roughly trimmed, merely cut, by sawing or otherwise, into blocks or slabs of a rectangular (including square) shape & other calcareous stone” is restricted and subject to import licensing procedures. Applications for such licences are considered by a facilitation committee (an inter-ministerial committee comprising of representatives from various ministries/departments).
The licensing procedure and ceiling for imports are lengthy and cumbersome.

53
S. No. Description of Product/
Other Aspects (HS
Code, if relevant)
Description of Barriers (including
legislation, if identified)
REMARKS
25. Jute bags The government has issued notification under jute and jute textiles control order, 2000 to stipulate that each and every imported jute bag must give the country of origin on the bag and the DGFT code number of the importer. Presumably, the requirement must be met before import clearance at the customs.
Importers are discouraged to source from other countries.
26. Agriculture and fertilisers
The role of State Trading Enterprises (STEs) in India is still very significant and important. India is the principal user of STEs in the region to control imports, notably of rice, wheat, all coarse grains except maize and barley, and copra. Imports of urea and the most important refined petroleum products are also controlled by STEs.
Role of individual importer is restricted.
27. Powdered milk, maize, crude sunflower and sunflower oils, and refined rape, colza and mustered oil
TRQs are being used by India to protect its producers. These were introduced quite recently to permit small quotas of these products to be imported over moderate tariffs, while applying high tariffs, which are generally prohibitive; to imports in excess of the quota amounts. A secondary function of the TRQs is to subsidize parastatal firms, since they are the only entities eligible to apply for them, and they therefore benefit from the economic rents.
Individual importers cannot benefit as they do not qualify for import of these products.
28. All products including agricultural and industrial products
In the Budget 2006-07, Government of India levied special Countervailing Duty (CVD) @ four percent on all imported goods. This levy is also imposed on the landed cost of the goods (i.e. value of goods + basic duty + CVD). Accordingly, in affect the levy is much higher than four
percent.
Theoretically 16 percent CVD is imposed on imports as well as domestic production (excise).
Many sectors like products in chapter 13 (natural produce) are not subject to the levy on local production.
29. Tobacco products, motor spirit, polyester filament yarn, motor vehicles and two wheelers
National Calamity Duty (NCD) is applied to these products.
Additional tariffs add to cost of imported goods.
30. Textiles & Textile articles
Additional duty of excise and the commodity cess are levied as additional duty of customs. The rates of this duty are also not available
-do-
31. Textiles & Textile products
Revised tariff of 2006 also lays down specific duties @ per meter or per kg with the proviso “whichever is higher” on major textile items. These specific rates generally workout to more than 30 percent ad. Val even on high value products. On cheaper
These specific rates seriously discourage cheaper imports and directly protect domestic textile products.
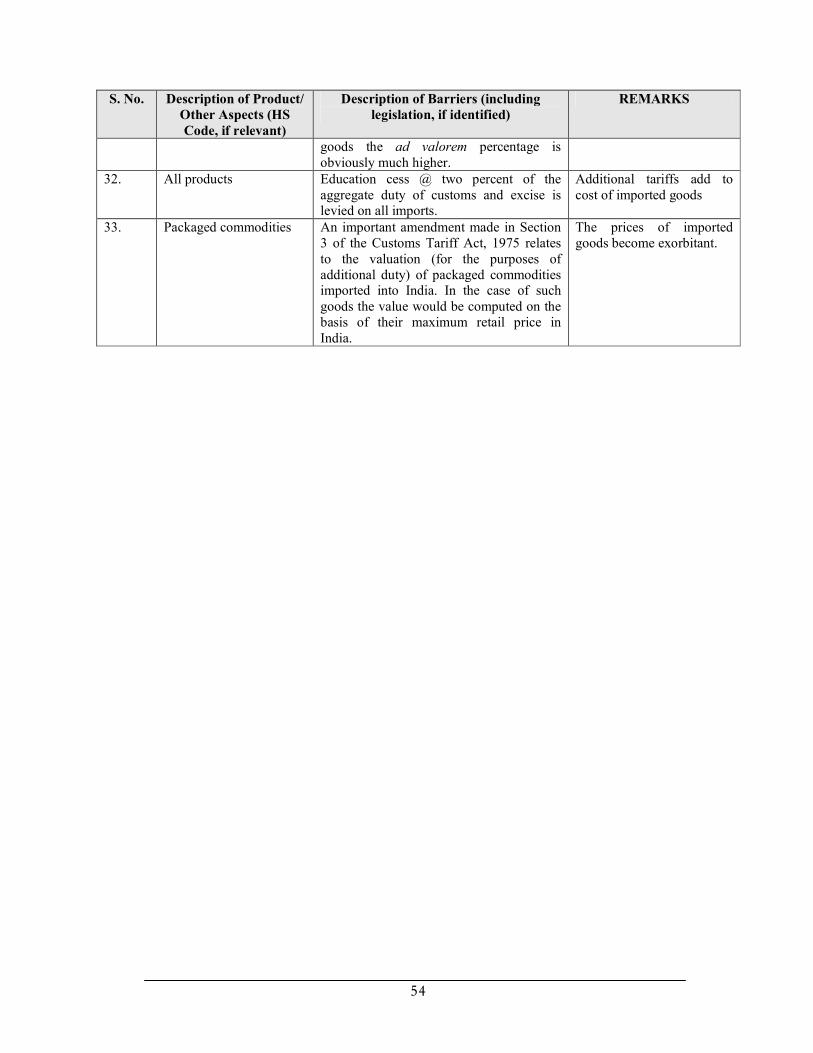
54
S. No. Description of Product/
Other Aspects (HS
Code, if relevant)
Description of Barriers (including
legislation, if identified)
REMARKS
goods the ad valorem percentage is obviously much higher.
32. All products Education cess @ two percent of the aggregate duty of customs and excise is levied on all imports.
Additional tariffs add to cost of imported goods
33. Packaged commodities An important amendment made in Section 3 of the Customs Tariff Act, 1975 relates to the valuation (for the purposes of additional duty) of packaged commodities imported into India. In the case of such goods the value would be computed on the basis of their maximum retail price in India.
The prices of imported goods become exorbitant.