safety performance indicators in the explosives sector · explosives inspectorate and in the...
TRANSCRIPT

Health and Safety Executive
Safety performance indicators in the explosives sector Development of a worked example
Prepared by the Health and Safety Laboratory for the Health and Safety Executive 2012
RR909 Research Report

Health and Safety Executive
Safety performance indicators in the explosives sector Development of a worked example
Colleen Butler BA MSc PhD
with contributions from
Nicola Healey BSc MSc Caroline Sugden BSc MSc MPhil PhD
Harpur Hill Buxton Derbyshire SK17 9JN
The Health and Safety Laboratory (HSL) were originally approached by the Health and Safety Executive (HSE) to assist with the implementation of Safety Performance Indicators (SPIs) within the Explosives industry.
This work builds on the examples and indicators identified in previous work (Ferguson and Nash, 2008), and aimed to encapsulate the types of activities common to a large number of organisations. Previous work to generate Safety Performance Indicators (SPIs) had resulted in little consistency or commonality across the industry group in terms of the leading and lagging indicators developed. It was therefore considered that to engage the sector, a ‘case study’ or worked example should be developed.
The aim of this phase of the project was twofold: (i) to produce a worked example demonstrating the development and application of SPIs within the explosives industry, to help the explosives sector understand the process of developing their own SPIs and (ii) to refine and finalise the worked example using feedback from a sample of industry representatives and inspectors.
This report and the work it describes were funded by the Health and Safety Executive (HSE). Its contents, including any opinions and/or conclusions expressed, are those of the authors alone and do not necessarily reflect HSE policy.
HSE Books

© Crown copyright 2012
First published 2012
You may reuse this information (not including logos) free of charge in any format or medium, under the terms of the Open Government Licence. To view the licence visit www.nationalarchives.gov.uk/doc/open-government-licence/, write to the Information Policy Team, The National Archives, Kew, London TW9 4DU, or email [email protected].
Some images and illustrations may not be owned by the Crown so cannot be reproduced without permission of the copyright owner. Enquiries should be sent to [email protected].
ACKNOWLEDGEMENTS
The authors wish to thank participants from industry who took the time to attend and participate in consultations with HSL, and inspectors for their enthusiasm and willingness to participate in a workshop on SPIs. The time and effort contributed by all is greatly appreciated.
ii

EXECUTIVE SUMMARY
The Health and Safety Laboratory (HSL) were commissioned by the Explosives Inspectorate within the Health and Safety Executive to assist with facilitating the implementation of Safety Performance Indicators (SPIs) within the explosives industry. As part of this facilitation, HSL collaborated with a working group of industry representatives to draft a worked example that showed how SPIs could be developed and applied within the explosives sector. The worked example was refined following feedback from industry representatives and inspectors on its’ relevance and suitability for the industry as a whole.
Aims and Objectives
The aim of this phase of the work was to produce a worked example demonstrating the development and application of SPIs within the explosives industry, to help the explosives sector understand the process of developing their own SPIs to monitor and control major hazards, and help to gain ‘buy-in’ to the implementation of SPIs.
The objectives were as follows:
o To work in collaboration with industry representatives to develop a draft worked example demonstrating the process for developing and implementing SPIs in the explosives industry;
o Consult with five organisations from the explosives industry to collect feedback on the relevance of the draft worked example;
o Obtain feedback from inspectors on the draft worked example;
o Utilise feedback from industry and inspectors to refine the worked example;
o Record the feedback in the form of a report so as to provide an evidence base for the content of the final worked example.
Approach to the project
HSL collaborated with a working group of industry representatives (from large top-tier COMAH sites) to develop an initial draft of a sector specific worked example. HSL visited and consulted with Safety, Health and Environment Managers, Operations Managers, Technical Managers and Safety and Explosives Licence Advisors in five organisations, representative of the diverse range of activities in the explosives industry to obtain feedback on the draft worked example. Feedback from inspectors was obtained from ongoing discussions with the HM Inspector for Health and Safety on Explosives responsible for the SPI portfolio within the Explosives Inspectorate and in the context of an ‘SPI workshop’ with inspectors carried out in March 2010.
Main Findings
A worked example was drafted in collaboration with industry representatives which was based on an explosives waste disposal scenario, and was chosen because it was a common activity for all companies, i.e. all companies have to dispose of waste. Within the worked example, risk control systems, leading and lagging indicators were proposed.
iii

Feedback from the five organisations consulted on the risk control systems, leading indicators and lagging indicators proposed in the draft worked example varied considerably. Some of this variation depended on the size of the organisation and the nature of the operations on site. Feedback from inspectors primarily related to how the supporting information (presented alongside the worked example) should be ‘pitched’ to industry.
The worked example was revised in accordance with feedback and reproduced in the form of a ‘quick guide’ for industry. The main revisions made were:
• Development of a step-by-step ‘quick guide’ similar to the approach taken in HSG254 (‘Developing Process Safety Indicators’, HSE, 2006) and the OECD guidance (‘Guidance on Developing Safety Performance Indicators (OECD, 2008);
• Mapping the ‘quick guide’ onto the HSG254 approach by illustrating steps 2, 3 and 4 to the development of SPIs;
• Inclusion of two example scenarios in the quick guide so as to illustrate the development of SPIs in two types of organisations, i.e. one small lower tier COMAH site where waste disposal was not an everyday activity and one top tier COMAH site with an active burning ground and regular waste disposal activity - this change was made to the worked example following industry consultation which showed that there was considerable variation in the size and nature of operations in the explosives sector and that it may be useful to include an example of a site where there was less emphasis on waste disposal;
• Addition of key messages to highlight the role of SPIs in monitoring and controlling major hazards.
Conclusions
An initial draft worked example was developed by HSL in collaboration with a working group of industry representatives, based on an explosives waste disposal scenario. The industry representatives within the working group were from large top-tier COMAH sites with frequent waste disposal activity. Following industry consultation (with a sample from the explosives sector representative of the diverse range of activities in the industry) and inspector feedback, the worked example was revised to (i) include a scenario that smaller lower tier COMAH sites or sites with infrequent waste disposal could more easily relate to and (ii) be revised with supporting information (presented alongside the worked example) that is ‘pitched’ to industry, in accordance with recommendations from inspectors.
iv

CONTENTS PAGE
1. INTRODUCTION ........................................................................ 1 1.1 Background 1 1.2 Objectives 1
2. METHODOLOGY ....................................................................... 2 2.1 Draft worked example 2 2.2 Visits and consultation with industry 2 2.3 Inspector discussion and feedback 3 2.4 Revision of the worked example 3
3. RESULTS................................................................................... 4 3.1 Stage 1: Consultation with industry 4 3.2 Stage 2: Inspector discussion and feedback 5 3.3 Revised ‘worked example’ 6
4. CONCLUSION ........................................................................... 7
5. REFERENCES ........................................................................... 8
6. APPENDICES ............................................................................ 9 6.1 Appendix A – Typical visit agenda 9 6.2 Appendix B – Agenda for SPI workshop with exposives inspectorate 10 6.3 Appendix C - Draft worked example 11 6.4 Appendix D - Results from Consultation with industry 17 6.5 Appendix E – Revised worked example 25
v

vi

1. INTRODUCTION
1.1 BACKGROUND
The Health and Safety Laboratory (HSL) were originally approached by the Health and Safety Executive (HSE) to assist with the implementation of Safety Performance Indicators (SPIs) within the Explosives industry.
This work builds on the examples and indicators identified in previous work (Ferguson and Nash, 2008), and aimed to encapsulate the types of activities common to a large number of organisations. Previous work to generate Safety Performance Indicators (SPIs) had resulted in little consistency or commonality across the industry group in terms of the leading and lagging indicators developed. It was therefore considered that to engage the sector, a ‘case study’ or worked example should be developed.
The aim of this phase of the project was twofold: (i) to produce a worked example demonstrating the development and application of SPIs within the explosives industry, to help the explosives sector understand the process of developing their own SPIs and (ii) to refine and finalise the worked example using feedback from a sample of industry representatives and inspectors.
1.2 OBJECTIVES
The Health and Safety Laboratory (HSL) was commissioned by HSE to:
o Work in collaboration with industry representatives to develop a draft worked example demonstrating the process for developing and implementing SPIs in the explosives industry;
o Consult with five organisations from the explosives industry to collect feedback on the relevance of the draft worked example;
o Obtain feedback from inspectors on the draft worked example;
o Utilise feedback from industry and inspectors to refine the worked example;
o Record the feedback in the form of a report so as to provide an evidence base for the content of the final worked example.
1

2. METHODOLOGY
2.1 DRAFT WORKED EXAMPLE
HSL collaborated with a working group of industry representatives (from large top-tier COMAH sites), and followed HSG 254 to develop the initial draft of a sector specific worked example, to demonstrate the application of SPIs in an explosives waste disposal scenario (Sugden et al., 2009).
The group was established in May 2007 (coordinated by HSE and HSL) with the aim of sharing experience and practices, to explore how they could develop and extend the use of SPIs across the explosives industry. The group involved 4 explosives companies representing over 20 licensed sites, each undertaking a different range of activities, including: • Transporting explosives to and from the site; • Filling of explosives articles; • Mixing of explosive substances; • Research and development of explosives; and • Storage of completed explosive products.
2.1.1 Explosives waste disposal scenario
The draft worked example was based on an explosives waste disposal scenario because it was considered to be a common activity across the industry. Therefore the worked example represented an explosives waste disposal operation at a production site. In the example, manufacturing has resulted in waste explosives products. These waste products are desensitised, and then transported from the production shops to the burning ground (i.e. the designated disposal area) where the waste products are destroyed using the most appropriate method, based on the nature of the waste material and the location of the disposal site.
The majority of risk controls identified by the working group (e.g. ‘match production rate to disposal rate’, availability of ‘sufficient containers’ and ‘correct labelling of materials’) related to the operation of the burning ground. The risk controls were mapped onto the activities outlined in the scenario, namely: production of waste, transport of waste and disposal site, e.g. burning ground.
Leading and lagging indicators were then identified through consideration of the risk controls, and included in the worked example (See Appendix C).
2.2 VISITS AND CONSULTATION WITH INDUSTRY
2.2.1 Participants
Feedback on the worked example was collected through visits with five organisations representative of the diverse range of activities in the explosives industry. The five organisations included companies with a wide range of activities including the manufacture of explosives for mining, the design and supply of rocket motors, the distribution of fireworks and the provision of blasting services. Companies ranged in size from 15 employees on site to over 300 employees. There was considerable variation in the extent of burning ground activity across the five organisations with some disposing of waste more than once a day and others on an ad hoc basis. Within the organisations consulted, participants had a variety of roles including Safety, Health and Environment Managers, Operations Managers, Technical Managers and Safety and Explosives Licence Advisors. There was considerable variation in their awareness
2

and experience of SPIs. No organisations consulted had a system of safety performance indicators already in place and were chosen for this reason.
2.2.2 Agenda for industry consultation
Each organisation was contacted in advance to arrange a convenient date for HSL to visit. Once dates had been arranged, participants received an outline agenda for the visit (See Appendix A for a typical agenda).
Each visit lasted approximately 4 hours and consisted of:
o Introductions and aims of the work;
o A short site tour (to provide context for later discussions);
o General discussion about SPIs;
o Explanation and discussion of the worked example.
(See Appendix B for the draft worked example discussed with participants).
2.3 INSPECTOR DISCUSSION AND FEEDBACK
Ongoing discussions with the HM Inspector for Health and Safety on Explosives responsible for the SPI portfolio within the Explosives Inspectorate informed changes to the worked example.
Feedback from HM Explosives Inspectors was obtained from an ‘SPI workshop’ with inspectors carried out in March 2010. This workshop, which aimed to engage inspectors on SPIs, provided an opportunity to discuss a draft of the worked example and obtain feedback through its use in a workshop exercise. An agenda for the workshop is shown in Appendix B.
2.4 REVISION OF THE WORKED EXAMPLE
Following industry consultation and inspector feedback and discussion, refinement and modifications were made to the draft worked example (Appendix C). The final worked example is shown in Appendix E.
3

3.1
3. RESULTS
STAGE 1: CONSULTATION WITH INDUSTRY
Participants at all five organisations were asked to consider the risk control systems, the leading indicators and lagging indicators contained within the draft worked example (see Appendix C), and invited to provide feedback on the relevance of these systems to their site and activities. Feedback on the risk control systems, leading indicators and lagging indicators included in the draft worked example varied considerably. Some of this variation depended on the size of the organisation and the nature of the operations on site. Detailed feedback from industry is shown in Appendix D.
Following consultation with industry, the following suggestions were made by the Health and Safety Laboratory regarding the draft worked example:
1. The disposal scenario could be useful as a worked example if the number of indicators is limited to one of the proposed leading indicators and/or one of the proposed lagging indicators as this is more realistic given the use of other indicators that may be implemented across a site;
2. The risk control systems “housekeeping” and “up-to-date procedures” may be useful risk control systems to include in a worked example as they apply to any site. Feedback on these systems also suggested that there are both formal and informal methods of monitoring already in place in organisations;
3. A suggested useful leading indicator is “Change control process correctly implemented and drawings updated”. This was considered important by a number of organisations regardless of their size. This may also be a good indicator considering that it is easier to start using indicators where information can be collected from safety systems that are already in place. Most organisations already have change control systems. Feedback from industry was that they could use some assistance with implementing such an indicator;
4. “Number of times waste disposal does not go as planned due to not following procedures” may be a useful lagging indicator. Use of this indicator could also take advantage of accident/near miss reporting systems already in place. This indicator was described by one Technical Authority on the burning ground as the “greatest cause of accidents at the burning ground”;
5. An alternative useful lagging indicator (as suggested by one burning grounds’ Technical Authority) may be the more general indicator “number of burns that don’t go to plan” as this covers a range of scenarios. This could then be broken down into further categories, e.g. number of burns that don’t go to plan due to incompetence, number of burns that don’t go to plan due to not following procedures, etc;
6. Use of a traffic light system for leading and lagging indicators; 7. Given the range of size and type of organisations within the explosives sector, it is
important that any guidance on SPIs is not prescriptive. Each organisation should be encouraged to consider how to tailor its programmes of work to its own specific needs;
8. The guidance should not prescribe indicators but focus on the process for implementing indicators.
9. It is important to highlight why SPIs are useful; 10. Keep the worked example ‘visual’.
4

3.2 STAGE 2: INSPECTOR DISCUSSION AND FEEDBACK
Following discussions with the HM Inspector for Health and Safety on Explosives responsible for the SPI portfolio within the Explosives Inspectorate and a ‘SPI workshop’ with inspectors, the following feedback/changes were noted and discussed regarding the draft worked example:
• It would be preferable to present the worked example in the context of a step-by-step ‘quick guide’ similar to the approach taken in HSG254 (‘Developing Process Safety Indicators’, HSE, 2006) and the OECD guidance (‘Guidance on Developing Safety Performance Indicators (OECD, 2008). Furthermore, it was only necessary to illustrate steps 2, 3 and 4 in the development of SPIs, consistent with the approach taken in HSG254;
• Given the variation in the size of organisations and the nature of operations within the explosives sector, it was considered that it would be beneficial to illustrate steps 2, 3 and 4 in the context of two types of organisations, e.g. one small lower tier COMAH site where waste disposal is infrequent and one top tier COMAH site with an active burning ground and regular waste disposal;
• Within the ‘quick guide’ it would be useful to:
o Change Table 1 (within Appendix C) into a flow chart;
o Outline the reasons as to why SPIs should be used, that is:
� They provide useful information for control of major hazards and for a sector where there are low frequency, high consequence events;
� Give organisations assurance that systems are working;
� Give the regulator assurance that systems are working – an organisation can demonstrate weak and strong areas using SPI trends to demonstrate effective risk monitoring;
� Give the public assurance.
o Add a page which highlights key messages. For example, in the development of SPIs, it is important to remember that:
� SPIs are all about being able to monitor and improve;
� SPIs should be kept simple;
� SPIs should be meaningful i.e. focused on key elements of major hazard controls on site;
o Not place too much emphasis on whether information is leading or lagging – the most important objective should be coming up with meaningful useful information that helps monitor the safety systems that are in place;
o Include a brief outline of step 5 (Establish data collection and reporting system) and step 6 (Review SPIs) consistent with HSG254;
5

3.3
o Emphasise to industry that it is important for each organisation to develop their own SPIs and that what is presented in the ‘quick guide’ is simply to help them think through the process.
REVISED ‘WORKED EXAMPLE’
Following engagement with industry and inspectors, the ‘worked example’ was revised as a ‘quick guide’ to the development of Safety Performance Indicators in the Explosives Industry using two example scenarios (shown in Appendix E). It includes the following:
• An introduction which defines SPIs, leading and lagging indicators and outlines the rationale for implementing SPIs (as suggested by industry representatives and inspectors);
• An introduction which highlights the importance of organisations developing their own SPIs and the process for the development of SPIs (as suggested by industry representatives and inspectors);
• A page of key messages (as suggested by inspectors);
• A flowchart which summarises the ‘six steps to SPIs’ (as suggested by inspectors and in accordance with industry suggestions to keep the worked example ‘visual’);
• Given the variation in size and nature of operations in the explosives industry, the quick guide illustrates the SPI process in the context of two types of organisation, e.g. one small lower tier COMAH site with infrequent waste disposal and one top tier COMAH site with frequent waste disposal operations – this change was made to the worked example following industry consultation which showed that there was considerable variation in the size and nature of operations in the explosives sector and that it may be useful to include an example of a site where there was less activity in relation to waste disposal;
• The quick guide illustrates steps 2, 3 and 4 of the six steps to SPIs consistent with HSG254 (HSE, 2006);
• The risk control system ‘housekeeping’ was used in ‘Example A’ because, following industry consultation, it was noted that many organisations had both formal and informal methods of monitoring housekeeping already in place and therefore they would be able to easily relate to the use of such a system;
• The risk control system ‘Management of Change’ was used in ‘Example B’. Following industry consultation it was noted that the leading indicator ‘Change control process correctly implemented and drawings updated’ was considered important as was the risk control system ‘up-to-date procedures’. One perspective from industry was that it was critical to have up-to-date procedures particularly with activities relating to the burning ground;
• The guide includes an outline of step 5 (Establish data collection and reporting system) and step 6 (Review SPIs) consistent with HSG254.
6

4. CONCLUSION
A draft worked example demonstrating the development and application of SPIs was produced by a working group of industry representatives (from large top-tier COMAH sites) in collaboration with HSL. The example was based on an explosives waste disposal scenario because it was considered that the majority of the explosives industry are involved in the disposal of explosive materials. This worked example may have been skewed because it was primarily developed by industry representatives from large top tier COMAH sites with a requirement for frequent waste disposal.
Following an industry consultation exercise, it was noted that whilst the majority of industry dispose of waste, the frequency of waste disposal across industry varies considerably and therefore there is much variation in the extent of exposure to risk from waste disposal. For this reason it was considered that the worked example should include a scenario that smaller lower tier COMAH sites or sites with infrequent waste disposal could more easily relate to. Feedback from inspectors indicated how the supporting information (presented alongside the worked example) should be ‘pitched’ to industry.
7

5. REFERENCES
Ferguson, I., Nash, K. (2008) Application of Performance Indicators in the Explosives Sectors HSL Report No. RSU/08/23.
HSE (2006) Step-by-Step guide to developing Process Safety Performance Indicators, HSE/Chemical Industries Association. HSG254.
Organisation for Economic Cooperation and Development (2008) Guidance on developing safety performance indicators related to Chemical Accident Prevention, Preparedness and Response: Guidance for industry. http://www.oecd.org/dataoecd/60/39/21568440.pdf
Sugden, C., Healey, N., Nash, K. & Rushton, P. (2009) Safety Performance Indicators in the Explosives Sector. Presented at Hazards XXI Conference, 9-12 November 2009, Manchester, UK.
8

6.1
6. APPENDICES
APPENDIX A – TYPICAL VISIT AGENDA
Meeting at XXX re: Applying Safety Performance Indicators in the Explosives Industry
PROPOSED AGENDA – TIME and DATE
Attendees: TIME TOPIC/ACTIVITY
10.30-10.40 Introductions
10.40- 11.00 Background to project – Working group developed; Intro to Safety Performance Indicators; Process for developing SPI’s; Objective of project; Objective of today’s meeting
11.00-12.00 Site tour
12.00-12.30 Discussion about Safety Performance Indicators (SPIs). This will involve questions such as:
- What do you think of SPIs? - How would SPIs fit with your current Safety Management
System? - In what kind of scenarios would it be useful to apply SPIs? - What indicators, if any, do you use? Why/Why not? - What information do you collect already? - What barriers are there to you using Safety Performance
Indicators? 12.30-13.00 Lunch
13.00-14.30 Explanation and discussion of a worked example. This will involve looking at proposed leading and lagging indicators in a worked example of an explosives waste disposal scenario. This will involve questions such as:
- Which of these leading and lagging indicators would you use? Why/Why not?
- Is this information realistically available to you? - Is this type of data collected regularly? - Are the suggested indicators meaningful? - How relevant are the SPIs to a range of operations/sites? - Would/could you use this worked example? - Could you use this example to help you develop SPIs for other
parts of your organisation? - Would a workshop/training be useful on learning about SPIs and
HSE’s view on them?
9

6.2 APPENDIX B – AGENDA FOR SPI WORKSHOP WITH EXPOSIVES INSPECTORATE
29th March 2010 – 10:00 – 14:30 Room 6.1.028, HSE, Redgrave Court, Bootle
TIME SUBJECT Speaker/ Facilitator
Duration
10.00 – 10.10 Coffee and general introduction to the workshop • set out what we aim to do; • create realistic expectation about what can
be achieve in this workshop;
Caroline 10 mins
10.10 - 10.25 Introduction to SPIs Colleen 15 mins
10.25 – 11.10 HID Delivery Guide approach to SPIs and SPI progress at AWE, Qinetiq and BAE
Paul Rushton 45 mins
11.10 – 11.40 Experience with SPI’s in SID Jim Stancliffe 30 mins
11.40 – 12.00 Worked example to industry – feedback and results Caroline 20 mins
12.00 – 12.45 Lunch 45 mins
12.45 – 12.50 Introduce exercise Caroline 5 mins
12.50 – 13.35 Exercise (2 groups, 1 with site A, 1 with site B) Task is for each group to produce lagging and leading indicators for ‘their site’ (linking them back to risk control systems) and justification for each indicator chosen
ALL 45 mins
13.35 – 13.55 Feedback - Critique of indicators – problems you might anticipate with chosen indicators
ALL 20 mins
13.55 – 14.20 Discussion points: 1. Is the worked example appropriate for
stakeholders? 2. Pros and cons of SPIs for the explosives
sector 3. What is extent of challenge rolling it out? 4. What else would you like to cover on SPIs? 5. Indicators for competence
ALL 25 mins
14.20 – 14:30 Any questions? Wrap up Caroline/Paul 10 mins
Proposed groups for exercise: (~ 10 participants expected)
Group using Site A scenario Group using Site B scenario Paul Rushton Caroline Sugden
Colleen Butler
10

6.3 APPENDIX C - DRAFT WORKED EXAMPLE
Worked example from HSL
HSL and HSE developed a sector specific worked example to demonstrate the application of SPIs in an explosives waste disposal scenario. This work builds on the examples and indicators identified in a previous study (Ferguson and Nash, 2008) and aims to encapsulate the types of activities common to a large number of organisations.
6.3.1 Method HSL followed HSE guidance on developing performance indicators, which recommends the following steps:
Table 1 Process for developing performance indicators
Decide the scope of the measurement system. Consider what can go wrong and where
Select the organisational level Identify the scope of the measurement system: � Identify incident scenarios – what can go
wrong? � Identify the immediate causes of hazard
scenarios � Review performance and non-
conformances
Identify the risk control systems in place to prevent a major accident. Decide on the outcomes for each and set a lagging indicator
What risk control systems are in place?
Describe the outcome
Set a lagging indicator
Follow up derivations from the outcome
Identify the critical elements of each risk control system (i.e. those actions or processes which must function correctly to deliver the outcomes) and set leading indicators
What are the most important parts of the risk control system? Set leading indicators
Set tolerances
Follow up derivations from tolerances
Establish the data collection and reporting system Collect information – ensure information/unit of measurement is available or can be established
Decide on presentation format
Review
Review performance of the process management system
Review the scope of the indicators
Review the tolerances (adapted from table 1, p5 HSG 254)
6.3.2 Scenario The worked example represents a safe explosives waste disposal operation at a production site. In the example, manufacturing has resulted in waste explosives products. These waste products are desensitised, and then transported from the production shops to the burning ground (i.e. the designated disposal area) where the waste products are destroyed using the most appropriate method, based on the nature of the waste material and the location of the disposal site.
11

6.3.3 Risk Controls Figure 1 shows the key risk controls identified in the development of the worked example, these were mapped onto the activities of a production site, namely: production of waste, transport of waste and disposal site, e.g. burning ground.
Warehouse
Production of waste
Transport
Burning Ground
housekeeping
equipment peforming as expected
culture of safety up to date procedures
physical separation controls
competent operators
clearly defined roles and responsibilites
waste appropriately labelled
timely delivery of waste
match production to waste disposal
correctly labelled material
sufficient containers
Risk Controls
Figure 1 Explosives Risk Control Systems
The risk controls required from the production facility, with respect to its contribution to disposal, were ‘match production rate to disposal rate’, the availability of ‘sufficient containers’, and correct labelling of materials. The necessity of matching production to waste production is essential to avoid the build-up and backlog of material. This can present risks by increasing the waste inventory, and good practice controls the size of the waste backlog.
Insufficient containers could cause problems in that the incorrect container could lead to confusion, contaminants and potentially problems with escalated or retarded events. Similarly it is important that the material is correctly labelled, in terms of its composition and weight. Transport was not viewed as a significant contributor to the waste disposal risk, however the timely delivery of waste and return of containers to production is a risk control measure.
The majority of risk controls were linked to operation of the burning ground, and include:
12

• A culture of safety, such that all involved understand the risks and behave safely, as well as having expectations about the physical working conditions (e.g. housekeeping) and compliance with procedures;
• Systems for ensuring that the ‘right people are doing the right things at the right time’, including clearly defined roles and responsibilities, competent and trained operators, and up-to-date procedures;
• Equipment factors, including equipment performing as expected and adequate and appropriate physical separation, e.g. barriers and interlocks.
Following the definition of the risk controls, the various stages in the life cycle were again considered and the various indicators proposed following the process outlined in Table 1.
13

6.3.4 Lagging Indicators Figure 2 displays the lagging indicators that show ‘when a desired safety outcome has failed, or has not been achieved’. The majority of these lagging indicators are linked to reported incidents/accidents during disposal activities; the exception is the indicator linked to a failure during an emergency exercise.
Warehouse
Production of waste
Transport
Number of times waste is disposed of incorrectly
due to lack of competence
Number of times waste disposal does not go as
planned due to not following procedures
Percentage of incidents due to failure of safety critical equipment (e.g.
firing boxes, firing circuit, barriers etc)
Percentage of incidents due to changes of
processes and equipment
Number of times waste disposal does not go as planned due to a breakdown in communication
Lagging Indicators
systems Burning Ground
Percentage of the staff Number of times who take the correct disposals do not occur as
action in the event of an planned due to emergency inadequate procedures
Figure 2 Lagging Indicators
The ability to use these as more sophisticated performance measures relies on the extent of use of the reporting system and the quality of their investigation. For example if the investigation does not identify the root causes of the incident and uncover the systematic and cultural issues lying behind the active fault then the performance indicators will be unsophisticated and will probably identify human error as the main cause.
As can be seen there are very few lagging indicators compared to the number of risk control systems in place. This is a common finding, and is one of the reasons leading indicators were suggested (HSE, 2006) to provide assurance before incidents or failure occur.
14

6.3.5 Leading Indicators Figure 3 was developed by considering all the risk control systems outlined in Figure 1 and using these as prompts to identify those indicators that would demonstrate whether a particular risk control system was successfully controlling the risks. The leading indicators are a mix of generic safety management indicators, and more specific indicators referring to specific risk controls at the worksite.
percentage of waste Quantity of waste
Warehouse
Production of waste
Transport
Burning Ground
awaiting disposal
Percentage of waste correctly labelled
returned by burning ground due to incorrect
labelling Percentage of downtime
due to insufficient containers
Proportion of observations that are non
compliant with defined procedures
Percentage of staff working in waste disposal
who have the required
Percentage of safety critical equipment
covered by the appropriate support
regime (e.g. maintenance schedules)
Percentage of maintenance activities
carried out to timetable
Percentage of systems which functioned to the desired performance
standard
Proportion of procedures that are usable and
workable
Change control process correctly implemented &
drawings updated
Proportion of procedures that reflect up to date risk
assessments
Percentage of disposals where authorisation to start the activity was
complete prior to disposal
Percentage of line management tours completed versus
planned
Number of emergency exercises completed
versus planned
Percentage of staff who take the correct action in the event of an exercise
Frequency of clean-up of burning ground
Leading Indicators
level of competence necessary for the safe Number of management Percentage of disposal of explosives housekeeping tours procedures that are
considered satisfactory reviewed and revised to programme
percentage of safety No. of times burning Percentage of post-critical equipment that ground found dirty at disposal checks reaches the necessary start of operation undertaken to ensure standard that the site is left safe
Figure 3 Leading Indicators
The indicators were developed around the following headings:
• Staff competence; • Operating procedures; • Inspection and Maintenance; • Management of change; • Definition of safe work methods;
15

• Communication; • Supervision; • Matching disposal to waste generation rate; • Safety culture; • Emergency arrangements; • Housekeeping.
16
6.4 APPENDIX D: RESULTS FROM CONSULTATION WITH INDUSTRY
6.4.1 Risk Control Systems
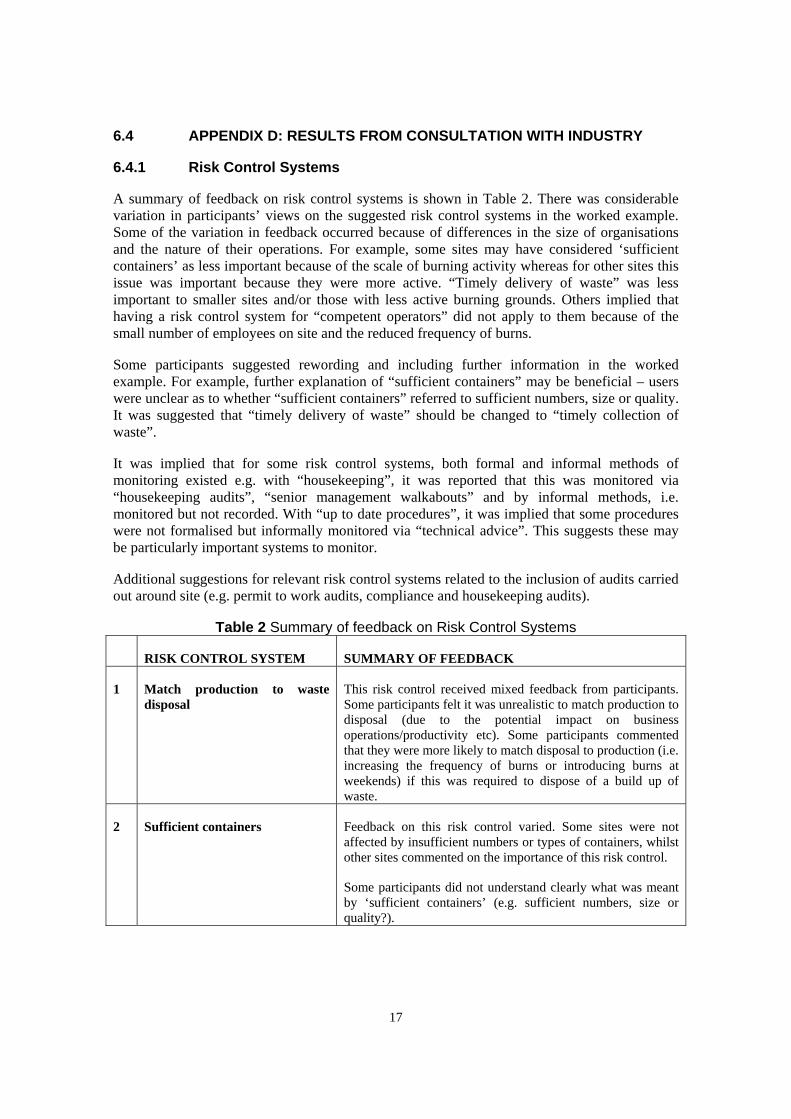
A summary of feedback on risk control systems is shown in Table 2. There was considerable variation in participants’ views on the suggested risk control systems in the worked example. Some of the variation in feedback occurred because of differences in the size of organisations and the nature of their operations. For example, some sites may have considered ‘sufficient containers’ as less important because of the scale of burning activity whereas for other sites this issue was important because they were more active. “Timely delivery of waste” was less important to smaller sites and/or those with less active burning grounds. Others implied that having a risk control system for “competent operators” did not apply to them because of the small number of employees on site and the reduced frequency of burns.
Some participants suggested rewording and including further information in the worked example. For example, further explanation of “sufficient containers” may be beneficial – users were unclear as to whether “sufficient containers” referred to sufficient numbers, size or quality. It was suggested that “timely delivery of waste” should be changed to “timely collection of waste”.
It was implied that for some risk control systems, both formal and informal methods of monitoring existed e.g. with “housekeeping”, it was reported that this was monitored via “housekeeping audits”, “senior management walkabouts” and by informal methods, i.e. monitored but not recorded. With “up to date procedures”, it was implied that some procedures were not formalised but informally monitored via “technical advice”. This suggests these may be particularly important systems to monitor.
Additional suggestions for relevant risk control systems related to the inclusion of audits carried out around site (e.g. permit to work audits, compliance and housekeeping audits).
Table 2 Summary of feedback on Risk Control Systems
RISK CONTROL SYSTEM SUMMARY OF FEEDBACK
1 Match production to waste disposal
This risk control received mixed feedback from participants. Some participants felt it was unrealistic to match production to disposal (due to the potential impact on business operations/productivity etc). Some participants commented that they were more likely to match disposal to production (i.e. increasing the frequency of burns or introducing burns at weekends) if this was required to dispose of a build up of waste.
2 Sufficient containers Feedback on this risk control varied. Some sites were not affected by insufficient numbers or types of containers, whilst other sites commented on the importance of this risk control.
Some participants did not understand clearly what was meant by ‘sufficient containers’ (e.g. sufficient numbers, size or quality?).
17

RISK CONTROL SYSTEM SUMMARY OF FEEDBACK
3 Correctly labelled material Feedback on this risk control varied. One perspective was that labelling was less important. Another perspective was that this was important and one of the reasons cited was the detailed policies/guidance on the information recorded on labels (e.g. weight, material, series and sub series). Others commented on labelling laws and the importance of standardised information on labels. In some cases this information fed into a more comprehensive stock monitoring/management system across the site.
4 Timely delivery of waste Some participants commented that although this risk control was important, there was a tendency for waste ‘delivery’ to be controlled by the burning ground (i.e. waste is collected by the burning ground once they are ready to dispose of it). Some participants suggested this risk control could be modified to reflect this (e.g. ‘timely collection of waste’).
Other sites did not consider this an issue because of the distances involved on site and the relative inactivity of the burning ground (e.g. low quantities of waste produced resulting in less frequent burns).
5 Housekeeping Some participants commented that this was critical and one reason given for this was because poor housekeeping could result in contamination or mixing of explosive materials. Some commented that they monitored this through housekeeping audits and senior management walkabouts or informally.
6 Culture of safety This risk control was considered important by some participants. One reason given for its importance was because it was believed to support maintenance management, good leadership, training and competency.
7 Up to date procedures One perspective was that this was “critical” particularly with activities relating to the burning ground. Another comment was that there was “no formalised procedure” for some of the “technical advice”.
8 Equipment performing as expected
One perspective was that, in theory, this risk control was critical (e.g. in terms of performance of interlocks), however in reality, waste disposal at the burning ground, by its nature, involved very limited technology or equipment.
Some participants identified the ignition source (electronic system/igniter chord) as a source of potential failure, though it was also considered that such systems are designed to ‘fail safe’ and for this reason were not considered ‘critical’. Another commented that “cameras [at the burning ground] need to be working”.
18

RISK CONTROL SYSTEM SUMMARY OF FEEDBACK
9 Waste appropriately labelled Some participants commented that this was an important risk control. Others commented that this risk control was not distinct from the risk control ‘labelling of materials’, and suggested that these could be combined in the worked example.
10 Competent operators There was recurrent feedback that this risk control was crucial, particularly in the waste disposal scenario (e.g. operation of the burning ground). One comment was that there had been “a lot of work on competency assessment”. Some participants who considered this as crucial highlighted the importance of “on the job experience”. Others commented that they had 1 or 2 staff who were qualified and trained.
11 Clearly defined roles and responsibilities
This risk control was considered important by some participants. One of the reasons given for this was that a “clear chain of command” was in place and that there was a “technical” role and an “operations” role.
12 Physical separation controls There was recurrent feedback that this risk control was important. However there was some confusion over what was meant by ‘physical separation controls’ i.e. whether it referred to physical separation of quantities or ‘segregation’ of explosive materials from each other and/or from people. It was suggested that this risk control could be explained further.
6.4.2 Leading Indicators
A summary of feedback on leading indicators is shown in Table 3. There was considerable variation in the feedback from the five organisations consulted on several of the proposed leading indicators. Organisations varied in whether they had information related to the indicators available, whether they collected the information if it was available to them, and how useful they thought the information would be to them if they were to begin to collect it.
Some differences in feedback may be attributed to the size of organisations as this tended to determine the extent of activity in relation to waste disposal. For example, with the leading indicators “% of staff who take the correct action in the event of an exercise” or “% of staff working in waste disposal who have the required level of competence necessary for the safe disposal of explosives”, some participants considered them non-applicable or implied they would not be useful because of the size of their operation.
None of the organisations consulted were collecting information on some of the indicators, e.g. % of downtime due to insufficient containers, % of waste returned by burning ground due to incorrect labelling, % of waste correctly labelled, % of systems which functioned to the desired performance standard, proportion of procedures that are usable and workable, frequency of clean-up of burning ground, etc (see Table 3).
There was recurrent feedback regarding the importance of the indicator “Change control process correctly implemented and drawings updated”. Change control was considered an important issue but there was some concern about how to measure it and implement indicators that could be monitored e.g. one organisation commented that “this is a huge issue for us but wouldn’t know how to measure it”. Similarly, in discussions on the indicator “% of staff working in waste disposal who have the required level of competence necessary for the safe disposal of
19

explosives”, there was widespread agreement on the importance of having competent staff. There was some concern about its usefulness as an indicator due to the size of organisations and the small number of staff working on waste disposal. It was evident from discussions that there were difficulties associated with measures of competence.
It was implied by some participants that some indicators would not help them monitor safety e.g. with the indicator “% of systems which functioned to the desired performance standard”, there was a comment that an ignition system was in place but that “there are very few incidents or misfires”. Similarly, with the indicator “number of times burning ground found dirty at start of operation”, one comment implied it was not useful as it “would always indicate 0”.
Table 3 Feedback on Leading Indicators included in Worked Example
LEADING INDICATOR SUMMARY OF FEEDBACK
1 Quantity of waste awaiting disposal
Feedback on this indicator was varied. Organisations either did not record the information, recorded the information but didn’t use it or recorded the information and used it in some way.
2 % of downtime due to insufficient containers
Feedback was consistent in that no organisations recorded this information or regarded it as important. Others thought it was not applicable.
3 % of waste returned by burning ground due to incorrect labelling
Feedback was consistent in that no organisations collected this information. There was some variation in how useful it was considered – one perspective was that it would be useful information but it would be expected to be raised as a near miss. Another perspective was that it was not collected because it was not considered a problem.
4 % of waste correctly labelled
No organisations collected this information. Views were that it was ‘useful’ or that ‘we don’t calculate as it’s basically 100%’.
5 % of disposals where authorisation to start the activity was complete prior to disposal
Perspectives on this indicator varied. It was considered a useful measurement but not realistic because it can only ‘be checked in real time with live audits’. Another perspective was that it would not be useful because authorisation is not required for routine burns but only when the Research and Development Chemist visits. Others did not identify it as a useful indicator in their organisation.
6 % of staff who take the correct action in the event of an exercise
Views on this indicator differed. One view was that it would be a useful measurement but it is not realistic when applied to waste disposal because they “don’t do many exercises”. One comment was that “it would be better to use this measure generally across the site rather than just for disposal.” Others did regard this information as useful and commented that it was collected during regular emergency exercises (about 4 times a year). Others viewed it as not applicable or not useful for their organisation and suggested one of the reasons for this was related to the size of the organisation.
7 % of line management tours completed versus planned
Feedback varied on this indicator. One perspective was that this information was collected regularly and considered useful. Others either did not record the information or only collected it on an ad-hoc basis. Another was that it is not a useful indicator.
20

LEADING INDICATOR SUMMARY OF FEEDBACK
8 % of maintenance activities carried out to timetable
Perspectives on this varied. The information was considered important by some but not specifically in relation to the burning ground. Others did not identify it as a useful indicator.
9 % of systems which functioned to the desired performance standard
Feedback was consistent in that no organisations collected this information. One reason given for this was because “the systems are not in place to chart performance against anything”. Another organisation commented that they “have an ignition system but there are very few incidents or misfires”.
10 Number of emergency exercises completed versus planned
Feedback was varied. Some said the information was “available and collected” and others thought it did not apply to them or didn’t identify it as a useful indicator to include.
11 Proportion of procedures that are usable and workable
Information was not collected by any organisation on this indicator. One perspective was that this was “not useful as an ongoing indicator”. Others commented that “it might be useful but there are lots of procedures on site” or “data could be gathered but there are 30/40 procedures”. Others did not identify it as a useful indicator.
12 Change control process correctly implemented and drawings updated
There was recurrent feedback that this information was considered important but there were some concerns about how to implement it. Comments included “this is critical and would be very useful but implementation of it would be difficult or “this is a huge issue for us but wouldn’t know how to measure it”. One perspective was that it was not applicable because “there are not many changes from one day to the next”.
13 % of safety critical equipment covered by the appropriate support regime (e.g. maintenance schedules)
No organisations had a system in place to collect this information. Some commented that they planned to collect the information and stated that they thought it was “…very useful and critical. This is something which should be measured.” Another commented that they aspired towards “planned preventative maintenance” but there was “endless debate about what safety critical is”. A contrasting view was that it was not very applicable because “there is limited safety critical equipment here”.
14 Proportion of procedures that reflect up to date risk assessments
Feedback differed between organisations. Information was collected and useful or it was considered it may be useful but was not collected. Others thought that it was not applicable because “Risk Assessments rarely change so it won’t tell you much”. Others didn’t identify it as a useful indicator.
15 Frequency of clean-up of burning ground
No organisations recorded this information but some indicated that they had information available on this because of “weekly checks” carried out. Others commented on the importance of checks to ensure that there are “no hotspots or contaminants”. Another perspective was that this indicator was not applicable because checks are carried out on a “regular rota”.
16 Proportion of observations that are non-compliant with defined procedures
No organisations had this information available or collected it. One perspective was that it was a “useful measurement but not realistic”. Another commented that it “could be worth doing as a walkabout or by video”. Others did not identify it as a useful indicator.
21

LEADING INDICATOR SUMMARY OF FEEDBACK
17 % of staff working in waste disposal who have the required level of competence necessary for the safe disposal of explosives
Feedback varied on this indicator. Organisations agreed on the importance of having competent staff but responses varied with regard to how useful an indicator it would be. One organisation thought it would not be useful as an indicator because their “staff numbers are so small.” Others commented that it would always indicate 100%. One perspective was that it would be useful as they have “staff results kept on file but scores were not recorded centrally”.
18 % of procedures that are reviewed and revised to programme
Feedback varied on this indicator. One perspective was that the information was available but not always collected. Others commented that “this is never a big task” and “nothing changes so there is nothing to indicate”.
19 Number of management housekeeping tours considered satisfactory
Feedback varied on this indicator. Those who regarded this as important information to collect suggested they could use this information in a traffic light system where the red actions would be a useful indicator A “satisfactory” tour would have to be defined. Others commented that this information was recorded for the Safety Health and Environment Committee when burning ground personnel undertake workplace inspections. Others considered it not applicable to them.
20 Number of times burning ground found dirty at start of operation
No organisations collected this information. Feedback on this indicator varied. One perspective was that it would be a useful indicator but it needs to be specified what is meant by “dirty”. Another comment was that “it would always indicate 0.”
21 % of safety critical equipment that reaches the necessary standard
There was widespread agreement that this would not be a useful indicator. One reason given for this was because it would always indicate 100% because procedures would deem any faulty critical equipment out of action. Others commented that this indicator was not applicable because they “don’t really have any safety critical equipment”.
22 % of post disposal checks undertaken to ensure that the site is left safe
No organisations recorded this information but some reported that post disposal checks are done informally. One perspective was that the usefulness of this as an indicator would vary according to type and size of site.
6.4.3 Lagging Indicators
A summary of feedback on lagging indicators is shown in Table 4. As with feedback on risk control systems and leading indicators, feedback on lagging indicators from the five organisations varied. There was variation in whether organisation’s had information related to the indicators available, whether they collected the information if it was available to them, and how useful and meaningful they thought the information would be to them if they were to begin to collect it.
There was recurrent feedback that any “lagging” information collected was in the form of incidents and near miss reports. There was also recurrent feedback that some of the indicators proposed, though regarded as useful, (e.g. “Number of times waste disposal does not go as
22

planned due to not following procedures” or “Number of times waste is disposed of incorrectly due to lack of competence”), would be difficult to implement because management may not find out about incidents where waste disposal didn’t go as planned due to incompetence or non-compliance.
Additional lagging indicators were suggested. These included “% of burns not completed on schedule” and “number of burns that don’t go to plan”. One organisation suggested monitoring whether high priority actions following accident investigations have been addressed.
6.4.4 Usability of worked example/guidance
A number of suggestions were made to ensure the usability of any worked examples and guidance produced. One suggestion was to keep the worked example visual. Another suggestion was to clarify how a proportion/percentage for an indicator can be derived. A third suggestion was to explain the implications of having a low or high percentage for a given indicator. These suggestions were not adopted in the final ‘quick guide’ as it was considered important to keep it concise.
6.4.5 Getting industry engagement
A number of suggestions were made that may help to engage the industry. It was suggested that it is very important to explain why SPIs are useful – one perspective was that some barriers may exist to adopting SPIs as operators may feel like they have to gather a lot of extra data or that SPIs are being introduced to monitor their ‘productivity’. Another suggestion was that if particular SPIs were to be imposed, it would be important to present safety cases outlining why they should be implemented. However, there was never an intention to impose SPIs and therefore this was not deemed necessary.
Table 4 Feedback on Lagging Indicators included in Worked Example
LAGGING INDICATOR SUMMARY OF FEEDBACK
1 Number of times waste disposal does not go as planned due to not following procedures
Feedback varied on this indicator in that only some organisations attempted to record this information. Others thought it would be useful but questioned how it could be implemented because of the difficulties associated with finding out if disposal didn’t go to plan due to non-compliance. Another commented that this was the “greatest cause of accidents at the burning ground”.
2 Number of times waste is disposed of incorrectly due to lack of competence
No organisations specified that they recorded this information but organisations repeatedly commented that it was important. There was some concern that management may not find out that waste had been incorrectly disposed of due to lack of competence.
3 % of incidents due to changes of processes and equipment
Feedback varied on its usefulness. Those who thought it may be useful commented that it would require them to go through incident reports to collect information. Those who thought it was not useful commented that it was not an issue for their burning ground.
4 % of incidents due to failure of safety critical equipment e.g., firing boxes, firing circuit, barriers etc.)
No organisations collected this information. One commented that it would be “difficult to work out how meaningful it would be.”
23

LAGGING INDICATOR SUMMARY OF FEEDBACK
5 Number of times waste disposal does not go as planned due to a breakdown in communication systems
No organisations recorded this information. One commented that it would be difficult to implement because management may not find out. Another commented that a burning ground incident had occurred where lack of communication was identified as the cause.
6 % of the staff who take the correct action in the event of an emergency
One perspective was that this indicator would not be useful because “there are not enough emergencies to have meaningful statistics.” Another comment was that “not many staff would react inappropriately”. Others commented that it didn’t apply to them.
7 Number of times disposals do not occur as planned due to inadequate procedures
Feedback varied on this. One perspective was that it was not applicable. Those who thought it might be a useful measure questioned whether it was necessary as it was thought that it would arise as an issue on a job safety audit. Another organisation commented that this information was recorded and that it would almost be 0.
24

6.5 APPENDIX E – REVISED WORKED EXAMPLE
DEVELOPING SAFETY PERFORMANCE INDICATORS in THE EXPLOSIVES INDUSTRY: A QUICK GUIDE
25

26

Developing Safety Performance Indicators In The Explosives Industry
A Quick Guide V
Health and Safety Executive

Developing Safety Performance Indicators in the Explosives Industry Contents

V Contents
Introduction........................................................................................................................................ 4
Key Messages.................................................................................................................................... 5
Six Steps to safety performance indicators........................................................................................... 6
Example Scenarios.............................................................................................................................. 7
Taking Step 2 Consider what can go wrong and where...................................................................... 8
Taking Step 3.1 and 3.2 Identify the risk control systems and describe the outcome............................ 9
Taking Step 3.3 and 3.4 Set a lagging indicator and follow up deviations............................................. 11
Taking Step 4 Identify critical elements of each risk control system and set leading indicators................ 13
Step 5 Establish the data collection and reporting system....................................................................15
Step 6 Review................................................................................................................................... 15
References.......................................................................................................................................... 16
Developing Safety Performance Indicators in the Explosives Industry Contents

V Introduction
In major hazard industries, where accidents are low frequency and high consequence events, it is critical to monitor major hazards. Safety Performance Indicators (SPIs) are a potential solution for monitoring safety in such high hazard industries. They are a useful way of 'flagging up' potential problem areas so that any required improvements can be made thereby preventing the occurrence of major incidents or accidents on site.
What are Safety Performance Indicators?
The term “Safety Performance Indicators” (SPIs) is used to mean observable measures that provide insights into the concept of safety, which is inherently difficult to measure (OECD, 2008). They are safety measures put in place to monitor and analyse safety before and after an accident has occurred. There are two types of SPIs, lagging indicators (also known as outcome indicators) and leading indicators (also known as activities indicators).
Leading and lagging indicators
Leading indicators are proactive measures which enable analysis of safety before an accident or incident occurs. A leading indicator can help measure the extent to which a particular safety practice is successful. An example of a leading indicator may be “audit scores” or “number of housekeeping tours”.
Lagging indicators are reactive measures which enable analysis of safety after an accident or an incident occurs. An example of a lagging indicator may be “number of accidents” or it may be more specific e.g. “frequency at which a particular system or control fails”.
Why use SPIs?
SPIs are useful for a number of reasons. They can: 1. Give critical information about whether major hazards are being controlled; 2. Enable the identification of weak and strong areas of safety via trends in SPI data. This means that
industry can: a. Provide a quick ‘evidence base’ for the regulator; b. Identify key areas for improvement;
3. Enable industry to give the public reassurance that major hazards are safely controlled.
What is in this guide?
This guide describes the main steps for developing SPIs in the context of the explosives industry. These steps are recommended in HSE’s guidance “Developing process safety indicators” (HSE, 2006).
This guide will focus on the process for implementing safety performance indicators. Given the range of size and type of organisations within the explosives sector, this guide is not prescriptive and will not specify which indicators to use. Each organisation is encouraged to consider how to tailor its programmes of work to its own specific needs.
The “Guidance on developing Safety Performance Indicators” (OECD, 2008) uses a similar process to that explained here and provides a useful introduction to the concept and implementation of SPIs.
Developing Safety Performance Indicators in the Explosives Industry Introduction 4

V Key Messages
n SPIs are a useful tool to enable monitoring of major hazards. Monitoring is a critical element in effectively controlling major accident hazards. The objective of monitoring is to:
Give critical information about whether major hazards are being controlled;
Enable the identification of weak and strong areas of safety via trends in SPI data.
n The most important consideration is that SPIs are of practical benefit in informing decisions/ actions to be taken. Collected SPI data is useless unless it is actually used to monitor and improve health and safety performance.
n When devising your own SPIs remember that they should:
Be specific to site;
Be focused on key elements of major hazard controls;
Inform decisions on actions/improvements;
Be simple;
Be meaningful.
n An effective set of indicators is likely to include both leading and lagging indicators.
5 Introduction Developing Safety Performance Indicators in the Explosives Industry

STEP 4Set leading indicators:4.1 Identify important parts of risk
control systems;4.2 Set le ading indicators;4.3 Set tolerances;4.4 Follow up deviations.
V Six Steps to Safety Performance Indicators
The figure below (Figure 1) shows the six steps to the implementation of safety performance indicators as suggested in HSE’s guidance “Developing Process Safety Indicators” (HSE, 2006). Although these steps are described sequentially it may be more appropriate to take some steps before others or carry out some steps at the same time. This guide will demonstrate steps 2, 3 and 4 and include a summary of steps 5 and 6.
STEP 2 Identify what can go wrong and where: 2.1 Select organisational level 2.2 Identify what can go wrong 2.3 Identify immediate causes 2.4 Review performance
STEP 3 Set lagging indicators: 3.1 Identify risk control systems; 3.2 Describe the outcome; 3.3 Set lagging indicators; 3.4 Follow up deviations.
STEP 5Establish data collecting andreporting system:5.1 Ensure data is available;5.2 Decide on presentation format.
STEP 5Establish data collecting and reporting system: 5.1 Ensure data is available; 5.2 Decide on presentation format.
STEP 6 Review: 6.1 Meaningfulness of indicators; 6.2 Tolerance levels; 6.3 Do indicators reflect risks.
STEP 5
Establish data collecting and reporting system: 5.1 Ensure data is available; 5.2 Decide on presentation format.
STEP 4 Set leading indicators: 4.1 Identify important parts of risk
control systems; 4.2 Set leading indicators; 4.3 Set tolerances; 4.4 Follow up deviations.
Establish SPI team and support: 1.1 Appoint a champion; 1.2 Set up a team; 1.3 Involve senior management.
STEP 1
Figure 1. Six Steps to the development of SPIs (adapted from HSE, 2006)
Developing Safety Performance Indicators in the Explosives Industry Introduction 6

V Example Scenarios
The example scenarios, site A and site B, are used in this guide to help explain the types of issues different size explosives companies may be faced with when implementing SPIs. There is an emphasis on activities related to the disposal of waste explosives by burning, but the principles apply to all explosives activities.
Site A
Background
Site A is a small, single site manufacturer of shotgun cartridges. It is a lower tier COMAH site. The 20acre site consists of three main areas, a manufacturing facility (where most of the 22 staff on site carry out their daily work), a storage facility with 4 magazines and a burning ground with one burning bay for disposal of waste propellant and cartridges, and one burning cage. Waste disposal is not an everyday activity but tends to be carried out on an ad hoc basis.
The site’s Quality Manager had recently attended an industry/regulator workshop on SPIs. The manager considered that his site may benefit from the information a small number of targeted indicators could provide. The manager discussed his plans with the company’s director. With the support of his director, he identified an experienced operator who was familiar with different areas of the site, and they worked together to develop their own plan for SPIs.
Site B
Background
Site B is a large manufacturer of rocket motors. It has an area of approximately 140 acres with 180 people on site (mostly in the factory and administration buildings). The site consists of a propellant operations and manufacturing area, a magazine area, hardware operations and administration building. It has a very active burning ground with four separate burning bays where an average of 4/5 burns of waste explosives take place each day.
The site’s Safety, Health and Environment Manager recently decided to undertake an SPI Programme and endeavoured to have a programme in place in the next 6 months. The company decided to implement an SPI Programme to help assess and monitor the safety of their production and storage site and have taken on board HSE’s views that SPIs are essential to the safety management of any major hazards site.
7 Quick Guide Developing Safety Performance Indicators in the Explosives Industry

Example Scenarios
V Taking Step 2 Consider what can go wrong and where
Site A 2.1 Selecting the organisational level The manager and his director agreed to identify indicators at site level due to the small size of their company and the highly specific nature of activities on site.
2.2.1 What can go wrong? The manager and operator considered what could go wrong on the site, and agreed that incident scenarios on site include a major ignition in the manufacturing area where approximately 0.5 tonnes of Hazard Type 3 propellant may be present.
2.2.2 What are the immediate causes? One of the possible causes of an ignition that escalates beyond the immediate vicinity relate to cleanliness in the manufacturing area. This could be exacerbated by:
n Propellant being left uncleaned from the loading machines in the manufacturing area;
n Loading machines that haven’t been cleaned of grease and dust; The importance of not exceeding storage limits according to hazard type, segregating incompatible explosives and excluding sources of ignition were also discussed as being critical.
Site B 2.1 Selecting the organisational level Due to the large size of site B’s company, organisational level indicators had already been determined and were cascaded downwards through the management chain. These included indicators related to leadership visibility, competence of personnel and management of change.
2.2.1 What can go wrong? The SPI team agreed that an area of particular risk relates to the manufacture and control of new propellant formulations, particularly with regard to the disposal of novel explosive substances where the behaviour of the explosive may not yet have been fully characterised. This could potentially lead to an escalating event i.e. deflagration to detonation transition (DDT), secondary explosions, larger fireball, or noisier than expected events or a retarded event i.e. a part burn or misfire.
2.2.2 What are the immediate causes? Explosion/fire involving new and unclassified explosives may occur due to:
n Inappropriate risk assessments being used for the disposal of novel explosives; n Inappropriate procedures being used for the disposal of novel explosives; n Lack of clarity about staff responsibilities (e.g. preparation of waste for disposal) due to
recent restructuring of the organisation.
Developing Safety Performance Indicators in the Explosives Industry Quick Guide 8

VIdentify the risk control systems Taking Step 3.1 and 3.2 and describe the outcome
Site A 3.1 What risk control systems are in place? The work group identified the company’s reliance on a number of risk controls on the site to prevent a fire in the manufacturing or storage areas (e.g. Figure 2). For simplicity, this example will focus on the importance of good housekeeping. Housekeeping, as a risk control system, was defined as the orderliness and cleanliness of the workplace. The manager and the operator agreed on the importance of holding regular workplace inspections every month so as to monitor housekeeping and identify areas in need of improvement.
3.2 Describe the outcome* The team agreed that this risk control system was in place so as to ensure:
n General cleanliness in the manufacturing and storage areas; n Spills are dealt with promptly; n Fire exits and routes are clear; n Explosives are stored safely, in the correct locations and within the specified limits; n Waste is not allowed to accumulate, is kept safely and with proper segregation
and identification; n Trimmed grass and hedges and removal of obstructions at the burning ground.
Site B 3.1 What risk control systems are in place? The site has a number of risk control systems in place (see Figure 2). For simplicity, this example will focus on the ‘Management of change’ risk control system. The SPI team agreed that the system for the control of change was critical because of the importance of monitoring 1) the effect of recent significant restructuring and downsizing of their organisation 2) the ongoing requirement for the disposal of new and unclassified propellant formulations and 3) any significant ongoing temporary/ permanent changes on site.
3.2 Describe the outcome* The SPI team agreed that the desired safety outcome for successful management of change was that following a staff, process or plant change, the risk of an incident/accident on site is not increased or created. More specifically:
n All stages of the procedure for the manufacture and control of new and unclassified propellant formulations are carried out: 1) explosives defined 2) test requirements agreed at safety review group meeting 3) trials and tests undertaken to characterise the new formulation and 4) explosives classified.
* It may be difficult to “describe the outcome”. To do this, it might be useful to consider asking and answering the following questions: n Why do we have this risk control system? n What does it deliver in terms of safety? n What would the consequence be if we didn’t have this system in place?
9 Quick Guide Developing Safety Performance Indicators in the Explosives Industry

re ouse
Management ofchange
Housekeeping
V
Identify the risk control systems Taking Step 3.1 and 3.2 and describe the outcome
Match waste disposal to production
Manufacturing Area
Timely collection of waste
Materials appropriately
labelled
Transport
Culture of safety
Equipment performing as expected
Competent operators
Physical separation controls (e.g. segregation of
explosive materials from people and each other)
Clearly defined roles and responsibilities
Risk Control Systems
Wa h
Sufficient containers (e.g. sufficient
numbers, size or quality
Burning Ground
Up to date procedures
Figure 2 Possible risk control systems in place at any explosives company
Developing Safety Performance Indicators in the Explosives Industry Quick Guide 10

Vlagging indicator and Taking Step 3.3 and 3.4 Set a
follow up deviations
Site A 3.3 Set a lagging indicator Following further discussions, the manager and the operator considered some lagging indicators (Figure 3) that may be suitable. These included:
n Number of ignitions during loading; n Number of incidents/near misses where poor housekeeping was a contributing factor;
It was decided that the most useful lagging indicator would be “Percentage of incidents/near misses attributed to poor housekeeping” as this could apply across the site (e.g. cleanliness and orderliness of the manufacturing, storage and burning ground areas). They also thought that it would be more useful to monitor ‘incidents/near misses’ and not ‘ignitions’ because of the rare occurrence of ignitions.
3.4 Follow up deviations from the outcome The manager and operator discussed how this indicator would be monitored (e.g. how the information would be collected, held, and used (including ‘who’ would be responsible). They decided that the information would be collected on a monthly basis, by the operator using a ‘Workplace Inspection Checklist’ and results published on main noticeboards. They also agreed that every second month the manager would accompany the operator on workplace tours.
Site B 3.3 Set a lagging indicator The SPI team tried to identify what measure would be precise enough “to highlight trends in safety over time or deviations from safety expectations that require action”. Suitable lagging indicators may be:
n Percentage of incidents/near misses which occurred where the cause was identified as being due to changes in processes, personnel and equipment;
n Number of escalated/retarded events at the burning ground; It was decided that “percentage of incidents/near misses which occurred where the cause was identified as being due to changes of processes, personnel and equipment” was more appropriate because such changes were more of a common occurrence than the number of escalated/retarded events and therefore more suitable for monitoring.
3.4 Follow up deviations from the outcome TThe SPI team proposed to install a system on their intranet whereby the Project Manager for each change implemented has an action to investigate if all four stages of a change control procedure are not followed.
11 Quick Guide Developing Safety Performance Indicators in the Explosives Industry

re ouse
o
o
o o
Percentage of incidents or nearmisses attributed
to poorhousekeeping
Vlagging indicator and Taking Step 3.3 and 3.4 Set a
follow up deviations
No. of times waste disposal does not go as planned due to
contaminated waste
No. of times waste disposal does not go as
planned due to not following procedures
No. of times waste is disposed of incorrectly due to lack of competence
No. of times waste disposal does not go as
planned due to a breakdown in
communications systems
Percentage of staff who take the correct action in the
event of an emergency
No. of times disposals do not occur as planned due to
inadequate procedures
Percentage of incidents r near
misses due to change in pr cesses, pers nnel r equipment
Manufacturing Area
Lagging Indicators
Transport Wa h
Burning Ground
Figure 3 Possible lagging indicators in place at any explosives company
Developing Safety Performance Indicators in the Explosives Industry Quick Guide 12

VIdentify critical elements of each risk controlTaking Step 4 system and set leading indicators
Site A 4.1 What are the most important parts of the risk control system? It was agreed that housekeeping inspections during workplace tours would provide a useful source of information on the status of housekeeping around the site. The manager suggested that slight changes to the existing workplace tours would enable the collection of useful SPI information without having to drastically alter what they were doing already.
4.2 Set leading indicators (see Figure 4 for some examples) The “Number of management housekeeping inspections considered satisfactory” was identified as an appropriate leading indicator.
4.3 Set tolerances** They defined what they meant by “satisfactory” housekeeping tours and decided to use a simple traffic light system where they determined green, amber and red levels for each housekeeping tour. They decided that >90% was green, 8090% was amber and <80% was red and should be flagged up for further action.
4.4 Follow up deviations from tolerances** They discussed what actions they would expect should the indicator fall below 80%.
Site B 4.1 What are the most important parts of the risk control system? The SPI team agreed that it was critical that any temporary or permanent changes e.g., to plant installation, tooling, disposal of new and unclassified propellant formulations are:
n Defined; n Risk assessed before plant change (new risk assessment completed); n Documented (and new procedures written up if required); n Authorised before being implemented (e.g. within a safety review group); n Checked after the change has been implemented.
4.2 Set leading indicators Some leading indicators suggested by the SPI team were:
n Percentage of change control processes correctly implemented and drawings updated;
n Proportion of procedures that reflect up to date risk assessments; n Percentage of plant change actions undertaken where authorisation was given before implementation.
The “percentage of change control process correctly implemented and drawings updated” was chosen as it could encompass all five stages required for a change to be implemented (stages outlined in 4.1).
**Steps 4.3 and 4.4 are shown in “Site A” example only. A similar traffic light system as suggested in the Site A example could also be applied to Site B.
13 Quick Guide Developing Safety Performance Indicators in the Explosives Industry

re ouse
o o
o o
w
No. of management housekeeping tours
considered satisfactory
V
Identify critical elements of each risk controlTaking Step 4 system and set leading indicators
Percentage of disposals where authorisation to start the activity was complete prior to disposals
Quantity of waste awaiting disposal
Proportion of procedures that are usable and workable
Percentage of line management tours
completed versus planned
No. of emergency exercises completed
versus planned
No. of times disposals do not occur as planned due to
inadequate procedures
Percentage of change c ntr l
pr cesses c rrectly implemented &
dra ings updated
Percentage of safety critical equipment covered by the appropriate support regime (e.g
maintenance schedules).
Percentage of maintenance activities carried
out to timetable
Proportion of observations that are non compliant with defined
procedures
Percentage of staff who have the required level of
competence
Frequency of cleanup of burning ground
Proportion of procedures that reflect up to date risk
assessments
No. of times burning ground found dirty at start of operation
Percentage of post disposal checks undertaken to ensure that
the site is left safe
Manufacturing Area
Transport Wa h
Burning Ground
Leading Indicators
Percentage of waste returned by burning ground due to
incorrect labelling
Figure 4 Possible leading indicators in place at any explosives company
Developing Safety Performance Indicators in the Explosives Industry Quick Guide 14

V Step 5 Establish Data Collection And Reporting System
n The information and data required for all SPIs should be collected on an agreed regular basis;
n It is advisable to appoint one person to ensure data is collected, compile reports to inform management of data and highlight any deviations from tolerance levels to management;
n Presentation of data should be summarised in a single sheet and kept as clear and simple as possible. Any deviations from tolerance levels should be highlighted. A traffic light system (green – ok, amber – slight deviations, red – large deviations) is a useful way to present data;
n If a traffic light system is used, it is important to be mindful that aggregate scores can result in an “all green” or “all red” outcome on an indicator. It may be useful to adopt a weighting system so that the overall results reflect a true picture of safety performance.
V Step 6 Review
Senior managers should review the entire SPI programme routinely. This review should address the following:
n Are the chosen indicators meaningful and useful? i.e. is useful information being collected that can be acted upon.
n Are the tolerances levels appropriate? For example, if a traffic light system was chosen to rate housekeeping tours (>90% is green, 8090% is amber and <80% is red) should these percentages be changed? Are the levels too lenient/too stringent?
n Do the indicators reflect the main risks? They may need to be changed because of:
n the introduction of new, high risk processes;
n improvement programmes;
n alteration in plant design;
n reduction of staff/loss of competence in certain areas.
15 Quick Guide Developing Safety Performance Indicators in the Explosives Industry

V References
Health and Safety Executive (2006) Developing Process Safety Indicators: a StepbyStep guide for Chemical and Major Hazard Industries. HSG254. HSE Books
Organisation for Economic Cooperation and Development (2008) Guidance on Developing Safety Performance on, Preparedness and Response: Guidance for Industry. indicators related to Chemical Accident Preventi
Developing Safety Performance Indicators in the Explosives Industry Quick Guide 16

V Notes

V Notes

rown opyright
esigne n pro u e y
isu l resent tion ervi es
Health and Safety Executive
© C C 2010
D d a d d c d b V a P a S c , HSL

Published by the Health and Safety Executive 02/12

Health and Safety Executive
Safety performance indicators in the explosives sector Development of a worked example
The Health and Safety Laboratory (HSL) were originally approached by the Health and Safety Executive (HSE) to assist with the implementation of Safety Performance Indicators (SPIs) within the Explosives industry.
This work builds on the examples and indicators identified in previous work (Ferguson and Nash, 2008), and aimed to encapsulate the types of activities common to a large number of organisations. Previous work to generate Safety Performance Indicators (SPIs) had resulted in little consistency or commonality across the industry group in terms of the leading and lagging indicators developed. It was therefore considered that to engage the sector, a ‘case study’ or worked example should be developed.
The aim of this phase of the project was twofold: (i) to produce a worked example demonstrating the development and application of SPIs within the explosives industry, to help the explosives sector understand the process of developing their own SPIs and (ii) to refine and finalise the worked example using feedback from a sample of industry representatives and inspectors.
This report and the work it describes were funded by the Health and Safety Executive (HSE). Its contents, including any opinions and/or conclusions expressed, are those of the authors alone and do not necessarily reflect HSE policy.
RR909
www.hse.gov.uk