safety in pressure testing - institution of chemical engineers and loss... · safety in pressure...
TRANSCRIPT
ICHEME SYMPOSIUM SERIES NO. 141
SAFETY IN PRESSURE TESTING
G Saville, B Skillerne de Bristowe & S M Richardson, Department of Chemical Engineering, Imperial College, London SW7 2AZ
Quantitative determination of the consequences of a pressure vessel failure should form part of the hazard assessment prior to conducting pressure testing.
A method has been developed for the determination of possible fragment and supersonic shock generation during pressure vessel failure and the protection needed to contain them.
Keywords: Safety, pressure testing, fragment, shock, protection.
INTRODUCTION
All items and equipment which operate at pressures above ambient need to be tested before use, to check that they function correctly, but more importantly, to check that, as far as this is possible, they are safe to use. Pressure testing can be divided into two types, those which are carried out at or below the design working pressure and those which are carried out at a substantially higher pressure. The former are generally concerned, in some way, with demonstrating that the equipment functions correctly. The latter are very much more concerned with seeking out serious flaws in the design or manufacture of the equipment.
The hazard posed by a pressure test is a combination of the energy stored in the pressurised fluid in the equipment and the degree of ignorance about the suitability of the equipment to contain pressure. This leads us to suggest that no pressure test should be conducted without first performing a hazard assessment. In the case of small items which pose little hazard, this might be conducted very quickly and could indicate that very little protection is needed during the test. For others, very much more serious work may be required and it could point to the need for large fixed test facilities.
The object of this paper is provide information relevant to the performance of the hazard assessment and to indicate the measures which can be taken to reduce a hazardous operation to a low risk one. Issues which will be considered include the determination of the energy stored in a pressurised system, how that energy will be released in a failure and how it can be contained. We limit consideration to metallic pressure equipment, although such equipment may contain windows and sight glasses provided that this non—metallic part does not represent a major part of the equipment.
HAZARD ASSESSMENT
We divide pressure tests into the following types, in order of decreasing hazard: • Research proof test: one carried out on a new design of vessel, or where metallurgical data such as creep rates and fatigue life are to be determined, or where autofrettage is carried out on a thick—wall vessel to increase its working pressure or to enhance its resistance to fatigue. • Proof test: one carried out when a vessel is built to an established design and applied when the vessel is first fabricated or significantly modified or repaired.
437

ICHEME SYMPOSIUM SERIES NO. 141
• Leak test or function test: one carried out to test the correct functioning of the equipment after it has first undergone a proof test.
The two main hazards during pressure testing are the formation of missiles and the generation of a shock wave (a pressure wave which moves at supersonic speeds) following failure of some part of the system. The failure can be of the item being tested, clamping equipment holding it in place or the source of pressurising fluid. Experimental evidence, Esparza and Baker (1), indicates that shock waves are not formed when the pressurising medium is a compressed liquid, the disturbance created is only a sound wave — a loud bang - which does very little damage although the use of ear defenders may be indicated. On the other hand, shock waves are the norm when pressurising with a gas or a saturated volatile liquid. In contrast, missiles can be generated whatever the pressurising medium.
The hazard assessment must determine all possible missiles and their speeds and the magnitude of any shock for the test in question. In the case of a research proof test, this will include every conceivable missile; all modes of failure must be considered possible. In the case of an ordinary proof test of a production item, the quality control measures exercised during its production may enable one to consider some failure modes as of negligible probability. This will almost certainly be the case when doing a function test.
STORED ENERGY
The damage caused by a pressure vessel failure is largely determined by the amount of energy stored at the time of failure. In the absence of chemical reactions, the main source of energy is the fluid expansion energy, Ex. We estimate this energy release by assuming that the expansion process is thermodynamically reversible and sufficiently rapid for there to be negligible heat transfer to the surroundings. The process is, therefore, isentropic and:
Ex = -AU (1)
Figures 1 to 4 show Ex for nitrogen and various liquids for a range of pressures up to 10 kbar when expansion is to atmospheric pressure.
FRAGMENTATION
The size and initial speed of fragments formed by a pressure vessel when it fails depend on the mode of failure. We can classify the relevant modes of failure as: • complete fragmentation due to brittle fracture, usually into a large number of fragments; • complete destruction of the vessel in a ductile manner, usually into a small number of rather large fragments: a typical example would be a large welded vessel where failure begins in a longitudinal seam, extends from end to end of the vessel and then runs around the circumferential seams joining the cylinder to the domed end—caps; • loss of a major section of the vessel in a ductile manner: a typical example would be failure of the circumferential weld between the cylinder and one end cap; • loss of a closure, such as a manhole in a large welded vessel or an end closure in a vessel where the closure gives essentially full—bore access to the vessel; • loss of a plug or other small closure, which gives only limited access to the vessel.
In the last three cases, failure leads to the production of two fragments, one small and one large. If the large fragment is sufficiently massive or is adequately anchored, it may not move at all, so that only one genuine fragment is produced. On the other hand, an inadequately anchored larger fragment may have the characteristics of a rocket.
The most common pressurising fluids are water, hydraulic oil and a gas such as air or nitrogen. Figures 1 to 4 show that very much more energy is contained in a vessel pressurised with gas than one pressurised with liquid. Other things being equal, this means that fragment velocities will be largest when a gas is used as pressurising medium.
438
ICHEME SYMPOSIUM SERIES NO. 141
Total failure due to brittle fracture
Although pressure vessels should never be made of a brittle material, mistakes can be made, whether during stock control or fabrication. It could also be that a vessel intended for high temperature use is made from a material with poor low temperature properties and is tested on a cold day with the temperature below the brittle—ductile transition temperature. Low vessel—wall temperatures may also be generated during depressurisation of a vessel filled with gas or a volatile liquid. In a research proof test, brittle failure should be assumed to be the norm, whatever the material.
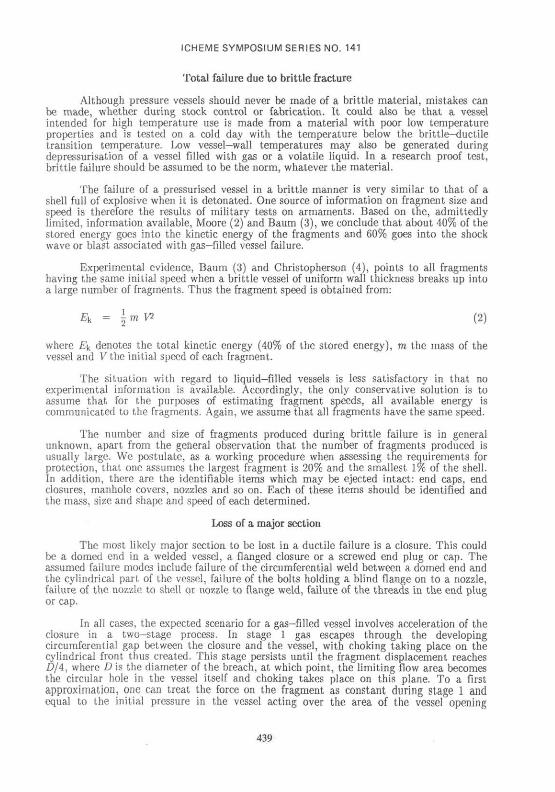
The failure of a pressurised vessel in a brittle manner is very similar to that of a shell full of explosive when it is detonated. One source of information on fragment size and speed is therefore the results of military tests on armaments. Based on the, admittedly limited, information available, Moore (2) and Baum (3), we conclude that about 40% of the stored energy goes into the kinetic energy of the fragments and 60% goes into the shock wave or blast associated with gas—filled vessel failure.
Experimental evidence, Baum (3) and Christopherson (4), points to all fragments having the same initial speed when a brittle vessel of uniform wall thickness breaks up into a large number of fragments. Thus the fragment speed is obtained from:
£k = \ m W (2)
where E^ denotes the total kinetic energy (40% of the stored energy), m the mass of the vessel and Kthe initial speed of each fragment.
The situation with regard to liquid—filled vessels is less satisfactory in that no experimental information is available. Accordingly, the only conservative solution is to assume that for the purposes of estimating fragment speeds, all available energy is communicated to the fragments. Again, we assume that all fragments have the same speed.
The number and size of fragments produced during brittle failure is in general unknown, apart from the general observation that the number of fragments produced is usually large. We postulate, as a working procedure when assessing the requirements for protection, that one assumes the largest fragment is 20% and the smallest 1% of the shell. In addition, there are the identifiable items which may be ejected intact: end caps, end closures, manhole covers, nozzles and so on. Each of these items should be identified and the mass, size and shape and speed of each determined.
Loss of a major section
The most likely major section to be lost in a ductile failure is a closure. This could be a domed end in a welded vessel, a flanged closure or a screwed end plug or cap. The assumed failure modes include failure of the circumferential weld between a domed end and the cylindrical part of the vessel, failure of the bolts holding a blind flange on to a nozzle, failure of the nozzle to shell or nozzle to flange weld, failure of the threads in the end plug or cap.
In all cases, the expected scenario for a gas—filled vessel involves acceleration of the closure in a two—stage process. In stage 1 gas escapes through the developing circumferential gap between the closure and the vessel, with choking taking place on the cylindrical front thus created. This stage persists until the fragment displacement reaches D/4, where D is the diameter of the breach, at which point, the limiting flow area becomes the circular hole in the vessel itself and choking takes place on this plane. To a first approximation, one can treat the force on the fragment as constant during stage 1 and equal to the initial pressure in the vessel acting over the area of the vessel opening
439

ICHEME SYMPOSIUM SERIES NO. 141
(assuming that the volume of gas in the vessel is sufficiently large for this to be reasonable). During the second stage, the situation is more complex since the jet leaving the choked vessel opening will undergo expansion downstream and exert a varying force on the fragment which will depend on the relative dimensions of the vessel opening and the fragment as well as on the properties of the fluid.
Moore (2) proposed that the initial closure acceleration should be treated as being maintained until the fragment is clear of the vessel by an amount equal to the diameter of the hole left in the vessel, that is, the initial pressure within the vessel is maintained on the underside of the closure fragment until this clearance is reached. The total distance over which this force would operate would therefore be the diameter of the hole plus any additional travel which the closure would have to make before a clear leakage gap was formed (this latter would thus be very important for screwed plug closures but irrelevant for domed ends on a welded vessel). Experiments, Baum (5), suggest that this is a reasonable approximation, even if conservative in some cases.
Tn the case of a liquid—filled vessel, the fluid pressure within the vessel will decay very much more rapidly than when it is gas-filled. Therefore, the assumption that the acceleration of the closure remains constant until a gap equal to one diameter has opened up may no longer be true. The assumption will be closest to being valid when the volume of the vessel is very large compared with the volume swept out by the closure during its escape. This suggests the following procedure to evaluate the speed of the closure: • evaluate the speed assuming the material within the vessel is a gas; • assume that the whole of the stored energy within the vessel (based on a liquid—filled vessel) is converted into kinetic energy of the closure and hence determine a speed; • take the actual speed as the smaller of the above two speeds.
Speed of a rocketing fragment
An analysis of the rocketing motion of a vessel which has lost its end can be undertaken by assuming a two—stage process: • in stage I, which incorporates the period when expansion waves move up and down the vessel: assume that conditions in the vessel do not differ significantly from the initial conditions; this stage lasts until the vessel has lifted by a height equal to a quarter of its diameter: thereafter the area for efflux becomes constant at the cross-sectional area of the vessel; • in stage II, assume that there is reversible adiabatic (isentropic) decay of pressure of a perfect gas inside the vessel; this stage lasts until the acceleration of the vessel reaches zero and its velocity is a maximum.
If in addition it is assumed that gravitational effects are negligible and flow out of the vessel is choked, it can be shown that the maximum velocity Vmax of the vessel is given by:
k(/?-i)Al2
O sLL.1 K [7+lJ
1-0 -(7+i) /n
Here: a = po
P = ?; Pa
+ ?
4 m [m/s2);
(3)
^ W ^ N *
440
ICHEME SYMPOSIUM SERIES NO. 141
Po is the initial pressure in the vessel (Pa); pa is the ambient pressure (Pa); To is the initial temperature (K); L is the inside length of the vessel (m); D is the inside diameter of the vessel (m); m is the mass of the vessel (kg); Cd is the discharge coefficient (—): a value of unity is suggested; 7 is the specific heat ratio of the gas (—); Mis the molar mass of the gas (kg/kmolel; R is the universal gas constant (8.3143 K/mole-K).
Loss of a plug or small closure
The situation is similar to that for loss of a major section except that the volume of the vessel is so large that there is negligible loss of pressure until the plug is well removed from the vessel. The force on the plug is therefore maintained at a higher level for a rather longer period of time. Experiments conducted into this situation, Baum (6), are consistent with the assumption that the full system pressure remains acting on the plug until the clearance between the tail end of the plug and the breach in the vessel reaches twice the diameter of the plug. In the absence of any information to the contrary, we propose using this same procedure for liquid filled vessels as well but with the proviso that the total kinetic energy of the missile should not exceed the stored energy of the fluid in the vessel.
PROTECTION AGAINST FRAGMENT PERFORATION
Most work on missile perforation of targets is of ordnance origin, although in recent years, the importance of 'industrial missiles' and the damage which they can cause to plant has been recognised and some research has been directed to this, mostly by the nuclear industry. This distinction is important since fragments (missiles) produced by failure of pressurised equipment tend to have speeds which rarely exceed 500 m/s, whereas ordnance missiles tend to have speeds in excess of 500 m/s. The mechanism of penetration and perforation at lower speeds (a few hundreds of m/s) is not the same as at nearer 1000 m/s, thus making the extrapolation of ordnance results to lower speeds a somewhat uncertain operation.
Protection provided by steel
A number of empirical correlations can be found on the penetration and perforation of steel by projectiles. Generally each covers a limited range of variables and use outside the range of fitting is dangerous in the extreme. However, given sufficient of these correlations, it is possible to develop an overall safety envelope around them. The actual development of such an envelope is complicated by paucity of published experimental results and the incomplete knowledge of the range of applicability of the correlations available.
We considered correlations by Recht, by DeMarre and by the Ballistics Research Laboratory (BRL) (all quoted by Recht (7)), by the Stanford Research Institute and by NDRC (both quoted by Tulacz (8)). A comparison of published experiments for industrial type missiles with these correlations indicated that the DeMarre and SRI correlations were unacceptable as they underpredicted perforation thicknesses in several cases, second best were the Recht and NDRC correlations, but the BRL correlation always predicted the largest perforation thickness over a very wide range of variables and was, in general, closest to the experimental values where these were available. The BRL correlation in SI units is:
t = 4.9x10⁻⁷ (M 1̂ )0-667 / d (4)
441
ICHEME SYMPOSIUM SERIES NO. 141
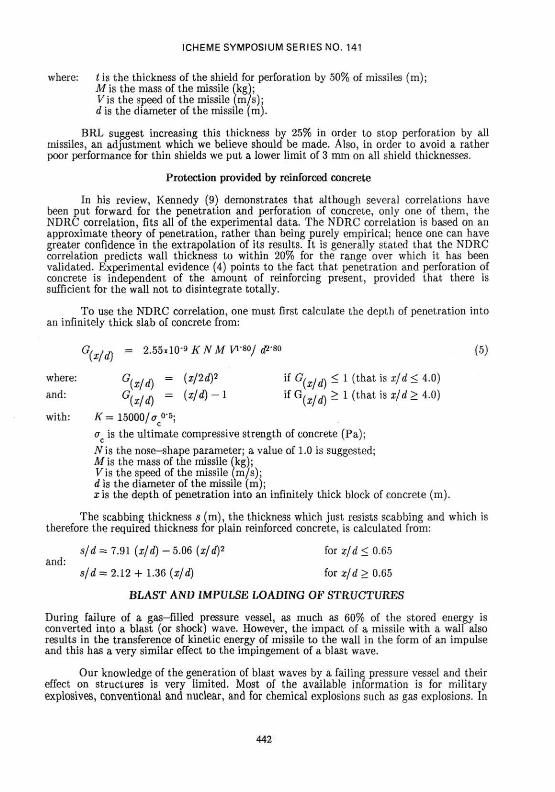
where: t is the thickness of the shield for perforation by 50% of missiles (m); M is the mass of the missile (kg); Vis the speed of the missile (m/s); d is the diameter of the missile (m).
BRL suggest increasing this thickness by 25% in order to stop perforation by all missiles, an adjustment which we believe should be made. Also, in order to avoid a rather poor performance for thin shields we put a lower limit of 3 mm on all shield thicknesses.
Protection provided by reinforced concrete
In his review, Kennedy (9) demonstrates that although several correlations have been put forward for the penetration and perforation of concrete, only one of them, the NDRC correlation, fits all of the experimental data. The NDRC correlation is based on an approximate theory of penetration, rather than being purely empirical; hence one can have greater confidence in the extrapolation of its results. It is generally stated that the NDRC correlation predicts wall thickness to within 20% for the range over which it has been validated. Experimental evidence (4) points to the fact that penetration and perforation of concrete is independent of the amount of reinforcing present, provided that there is sufficient for the wall not to disintegrate totally.
To use the NDRC correlation, one must first calculate the depth of penetration into an infinitely thick slab of concrete from:
G(x/d) = 2.55x10⁻⁹ A" tf A/V>-80/«p-80 (5)
where: G(x/d) = (z/2t02 if G(x/d) - ! ( t h a t i s xld - 4 '°)
and: G(x/d) = ^ ^ ~~ l if G(x/d) - l ( t h a t i s xld - 4'0^
with: K= 15000/ a0-5;
o is the ultimate compressive strength of concrete (Pa);
//is the nose—shape parameter; a value of 1.0 is suggested; Mis the mass of the missile (kg); Vis the speed of the missile (m/s); d is the diameter of the missile (m); xis the depth of penetration into an infinitely thick block of concrete (m).
The scabbing thickness s (m), the thickness which just resists scabbing and which is therefore the required thickness for plain reinforced concrete, is calculated from:
s/d = 7.91 (x/d) - 5.06 {x/df for x/d < 0.65 and:
s/d = 2.12 + 1.36 {x/d) for x/d > 0.65
BLAST AND IMPULSE LOADING OF STRUCTURES
During failure of a gas-filled pressure vessel, as much as 60% of the stored energy is converted into a blast (or shock) wave. However, the impact of a missile with a wall also results in the transference of kinetic energy of missile to the wall in the form of an impulse and this has a very similar effect to the impingement of a blast wave.
Our knowledge of the generation of blast waves by a failing pressure vessel and their effect on structures is very limited. Most of the available information is for military explosives, conventional and nuclear, and for chemical explosions such as gas explosions. In
442
ICHEME SYMPOSIUM SERIES NO. 141
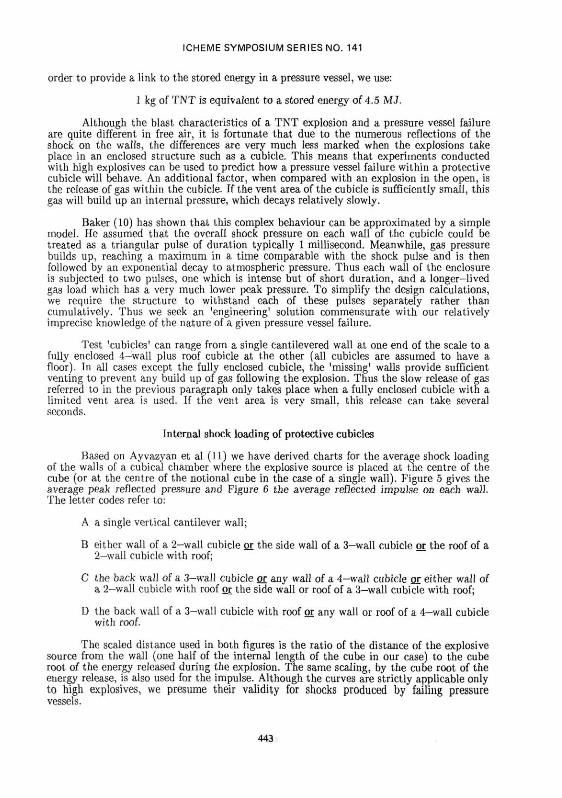
order to provide a link to the stored energy in a pressure vessel, we use:
1 kg of TNT is equivalent to a stored energy of 4.5 MJ.
Although the blast characteristics of a TNT explosion and a pressure vessel failure are quite different in free air, it is fortunate that due to the numerous reflections of the shock on the walls, the differences are very much less marked when the explosions take place in an enclosed structure such as a cubicle. This means that experiments conducted with high explosives can be used to predict how a pressure vessel failure within a protective cubicle will behave. An additional factor, when compared with an explosion in the open, is the release of gas within the cubicle. Tf the vent area of the cubicle is sufficiently small, this gas will build up an internal pressure, which decays relatively slowly.
Baker (10) has shown that this complex behaviour can be approximated by a simple model. He assumed that the overall shock pressure on each wall of the cubicle could be treated as a triangular pulse of duration typically 1 millisecond. Meanwhile, gas pressure builds up, reaching a maximum in a time comparable with the shock pulse and is then followed by an exponential decay to atmospheric pressure. Thus each wall of the enclosure is subjected to two pulses, one which is intense but of short duration, and a longer-lived gas load which has a very much lower peak pressure. To simplify the design calculations, we require the structure to withstand each of these pulses separately rather than cumulatively. Thus we seek an 'engineering' solution commensurate with our relatively imprecise knowledge of the nature of a given pressure vessel failure.
Test 'cubicles' can range from a single cantilevered wall at one end of the scale to a fully enclosed 4—wall plus roof cubicle at the other (all cubicles are assumed to have a floor). Iu all cases except the fully enclosed cubicle, the 'missing' walls provide sufficient venting to prevent any build up of gas following the explosion. Thus the slow release of gas referred to in the previous paragraph only takes place when a fully enclosed cubicle with a limited vent area is used. If the vent area is very small, this release can take several seconds.
Internal shock loading of protective cubicles
Based on Ayvazyan et al (11) we have derived charts for the average shock loading of the walls of a cubical chamber where the explosive source is placed at the centre of the cube (or at the centre of the notional cube in the case of a single wall). Figure 5 gives the average peak reflected pressure and Figure 6 the average reflected impulse on each wall. The letter codes refer to:
A a single vertical cantilever wall;
B either wall of a 2-wall cubicle or the side wall of a 3-wall cubicle or the roof of a 2—wall cubicle with roof;
C the back wall of a 3—wall cubicle or any wall of a 4—wall cubicle or either wall of a 2-wall cubicle with roof or the side wall or roof of a 3-wall cubicle with roof;
D the back wall of a 3-wall cubicle with roof or any wall or roof of a 4—wall cubicle with roof.
The scaled distance used in both figures is the ratio of the distance of the explosive source from the wall (one half of the internal length of the cube in our case) to the cube root of the energy released during the explosion. The same scaling, by the cube root of the energy release, is also used for the impulse. Although the curves are strictly applicable only to high explosives, we presume their validity for shocks produced by failing pressure vessels.
443
ICHEME SYMPOSIUM SERIES NO. 141
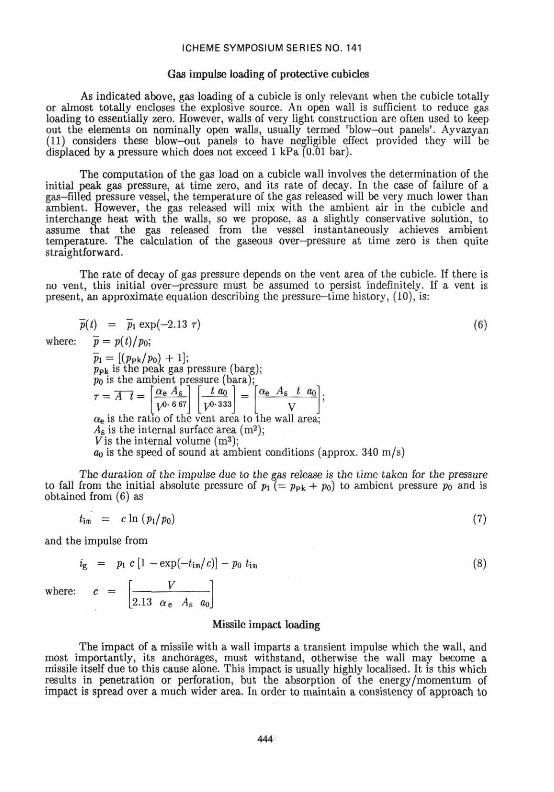
Gas impulse loading of protective cubicles
As indicated above, gas loading of a cubicle is only relevant when the cubicle totally or almost totally encloses the explosive source. An open wall is sufficient to reduce gas loading to essentially zero. However, walls of very light construction are often used to keep out the elements on nominally open walls, usually termed 'blow-out panels'. Ayvazyan (11) considers these blow-out panels to have negligible effect provided they will be displaced by a pressure which does not exceed 1 kPa (0.01 bar).
The computation of the gas load on a cubicle wall involves the determination of the initial peak gas pressure, at time zero, and its rate of decay. Iu the case of failure of a gas-filled pressure vessel, the temperature of the gas released will be very much lower than ambient. However, the gas released will mix with the ambient air in the cubicle and interchange heat with the walls, so we propose, as a slightly conservative solution, to assume that the gas released from the vessel instantaneously achieves ambient temperature. The calculation of the gaseous over—pressure at time zero is then quite straightforward.
The rate of decay of gas pressure depends on the vent area of the cubicle. If there is no vent, this initial over—pressure must be assumed to persist indefinitely. If a vent is present, an approximate equation describing the pressure—time history, (10), is:
p(t) = p, exp(-2.13 T)
where: p = p(t)/p0;
Pi = [(Ppk/Po) + 1]; pPk is the peak gas pressure (barg); Po is the ambient pressure (bara);
(6)
= J~t = ae Af yO- 6 67
tao yO-333
«e A$ I flo
V oe is the ratio of the vent area to "the wall area"; ^s is the internal surface area (m2); Vis the internal volume (m3); OQ is the speed of sound at ambient conditions (approx. 340 m/s)
The duration of the impulse due to the gas release is the time taken for the pressure to fall from the initial absolute pressure of p\ (= pPk + po) '•« ambient pressure po and is obtained from (6) as
iim = c In (pi/po)
and the impulse from
ig = px c [1 - expHim/c)] - po t-m
V
(7)
(8)
where: c =
-2.13 ae As oo
Missile impact loading
The impact of a missile with a wall imparts a transient impulse which the wall, and most importantly, its anchorages, must withstand, otherwise the wall may become a missile itself due to this cause alone. This impact is usually highly localised. It is this which results in penetration or perforation, but the absorption of the energy/momentum of impact is spread over a much wider area. In order to maintain a consistency of approach to
444
ICHEME SYMPOSIUM SERIES NO. 141
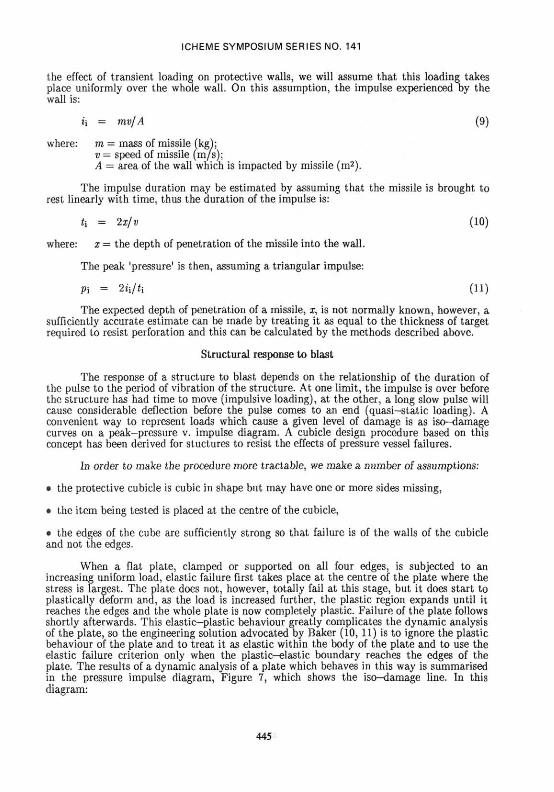
the effect of transient loading on protective walls, we will assume that this loading takes place uniformly over the whole wall. On this assumption, the impulse experienced by the wall is:
j'i = mv/A (9)
where: m = mass of missile (kg); v — speed of missile (m/s); A = area of the wall which is impacted by missile (m2).
The impulse duration may be estimated by assuming that the missile is brought to rest linearly with time, thus the duration of the impulse is:
t\ = 2x1 v (10)
where: x — the depth of penetration of the missile into the wall.
The peak 'pressure' is then, assuming a triangular impulse:
Pi = 2n/ii (11)
The expected depth of penetration of a missile, x, is not normally known, however, a sufficiently accurate estimate can be made by treating it as equal to the thickness of target required to resist perforation and this can be calculated by the methods described above.
Structural response to blast
The response of a structure to blast depends on the relationship of the duration of the pulse to the period of vibration of the structure. At one limit, the impulse is over before the structure has had time to move (impulsive loading), at the other, a long slow pulse will cause considerable deflection before the pulse comes to an end (quasi—static loading). A convenient way to represent loads which cause a given level of damage is as iso—damage curves on a peak-pressure v. impulse diagram. A cubicle design procedure based on this concept has been derived for stuctures to resist the effects of pressure vessel failures.
In order to make the procedure more tractable, we make a number of assumptions:
• the protective cubicle is cubic in shape but may have one or more sides missing,
• the item being tested is placed at the centre of the cubicle,
• the edges of the cube are sufficiently strong so that failure is of the walls of the cubicle and not the edges.
When a flat plate, clamped or supported on all four edges, is subjected to an increasing uniform load, elastic failure first takes place at the centre of the plate where the stress is largest. The plate does not, however, totally fail at this stage, but it does start to plastically deform and, as the load is increased further, the plastic region expands until it reaches the edges and the whole plate is now completely plastic. Failure of the plate follows shortly afterwards. This elastic—plastic behaviour greatly complicates the dynamic analysis of the plate, so the engineering solution advocated by Baker (10, 11) is to ignore the plastic behaviour of the plate and to treat it as elastic within the body of the plate and to use the elastic failure criterion only when the plastic-elastic boundary reaches the edges of the plate. The results of a dynamic analysis of a plate which behaves in this way is summarised in the pressure impulse diagram, Figure 7, which shows the iso—damage line. In this diagram:
445
ICHEME SYMPOSIUM SERIES NO. 141
X = length of each side of plate (m); h = thickness of plate (m) p = peak impulse pressure (Pa); i= impulse (Pa-s); d = density of plate (kg/m3); E = Young's Modulus of elasticity of plate (Pa); (7y = dynamic (or, conservatively, static) yield strength of plate (Pa); / = a numerical factor which equals 0.48 for a square plate.
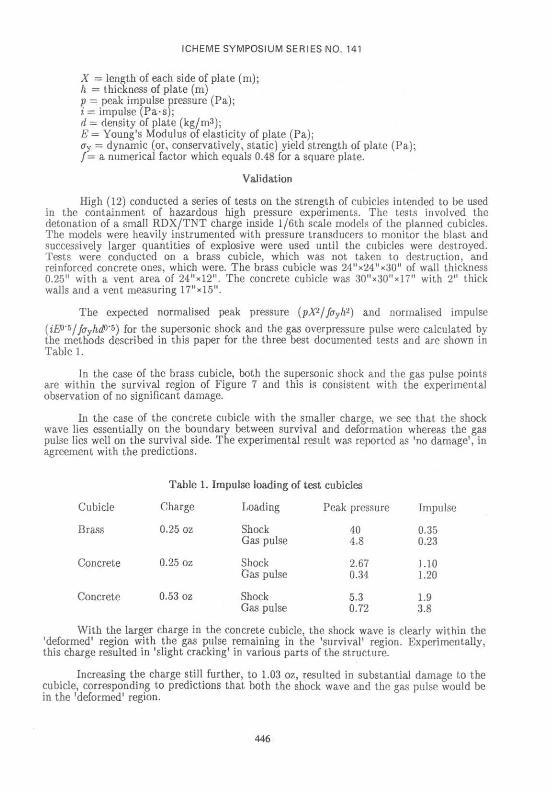
Validation
High (12) conducted a series of tests on the strength of cubicles intended to be used in the containment of hazardous high pressure experiments. The tests involved the detonation of a small RDX/TNT charge inside l/6th scale models of the planned cubicles. The models were heavily instrumented with pressure transducers to monitor the blast and successively larger quantities of explosive were used until the cubicles were destroyed. Tests were conducted on a brass cubicle, which was not taken to destruction, and reinforced concrete ones, which were. The brass cubicle was 24"x24"x30" of wall thickness 0.25" with a vent area of 24"xl2". The concrete cubicle was 30"x.30"xl7" with 2" thick walls and a vent measuring 17"xi5".
The expected normalised peak pressure (pX2/fcryh2) and normalised impulse
(iE°'5/fayhd°'5) for the supersonic shock and the gas overpressure pulse were calculated by the methods described in this paper for the three best documented tests and are shown in Table 1.
In the case of the brass cubicle, both the supersonic shock and the gas pulse points are within the survival region of Figure 7 and this is consistent with the experimental observation of no significant damage.
In the case of the concrete cubicle with the smaller charge, we see that the shock wave lies essentially on the boundary between survival and deformation whereas the gas pulse lies well on the survival side. The experimental result was reported as 'no damage', in agreement with the predictions.
Table 1. Impulse loading of test cubicles
Cubicle
Brass
Concrete
Concrete
Charge
0.25 oz
0.25 oz
0.53 oz
Loading
Shock Gas pulse
Shock Gas pulse
Shock Gas pulse
Peak pressure
40 4.8
2.67 0.34
5.3 0.72
Impi
0.35 0.23
1.10 1.20
1.9 3.8
With the larger charge in the concrete cubicle, the shock wave is clearly within the 'deformed' region with the gas pulse remaining in the 'survival' region. Experimentally, this charge resulted in 'slight cracking' in various parts of the structure.
Increasing the charge still further, to 1.03 oz, resulted in substantial damage to the cubicle, corresponding to predictions that both the shock wave and the gas pulse would be in the 'deformed' region.
446
ICHEME SYMPOSIUM SERIES NO. 141
These results indicate that this method has predicted the onset of failure in the reinforced concrete cubicle with remarkable precision. The experimental results also indicate that on a 'once in a lifetime' basis, a reinforced concrete cubicle should be able to withstand an energy release of about 4 times that which it can sustain without showing obvious signs of damage and which may, therefore, withstand the loading repeatedly.
CONCLUSION
Quantitative procedures have been developed to assess the fragments and shock produced during the failure of a pressure vessel and to determine the protection needed to contain them. It is suggested that these considerations should form part of a hazard assessment when conducting pressure testing.
ACKNOWLEDGEMENT
The information presented in this paper is taken from a report entitled 'Pressure test safety' prepared by the authors for the Health and Safety Executive during 1996.
REFERENCES
1. Esparza, E.D. and Baker, W.E., 1977, Measurement of blast waves from bursting frangible spheres pressurised with flash evaporating vapour or liquid, NASA Contractor Renort 2811. Contract NSG-3005, NASA.
2. Moore, C.V., 1967, The design of barricades for hazardous pressure systems, Nucl. Engng and Design. 5: 81-97.
3. Baum, M.R., 1984, The velocity of missiles generated by the disintegration of gas—pressurized vessels and pipes, Trans. ASME. J. Pressure Vessel Technology. 106: 362-36S.
4. Christopherson, D.G., 1945, Structural defence, Home Office. London. 5. Baum, M.R., 1995, Rupture of a gas-pressurised cylindrical vessel: the velocity of a
detached end—cap, J. Loss Prev. Process Ind.. 8: 149—161. 6. Baum, M.R., 1993, Velocity of a single small missile ejected from a vessel containing
high pressure gas, J. Loss Prev. Process Ind.. 6: 251—264. 7. Recht, R.F., 1970, Containing ballistic fragments, Third Int. Conf. on High Pressure,
pg 50, Inst. Mech. Engrs. 8. Tulacz, J. and Smith, R.E., 1980, Assessment of missiles generated by pressure
component failure and its application to recent gas-cooled nuclear plant design, Nucl. Energy. 19: 151-164.
9. Kennedy, R.P., 1976, A review of procedures for the analysis and design of concrete structures to resist missile impact effects, Nucl. Engng & Design. 37: 183-203.
10. Baker, W.E., Cox, P.A., Westine, P.S.. Kulesz, J.J. and Strehlow, R.A., 1983, Explosive Hazards and Evaluation, Elsevier. Amsterdam.
11. Ayvazyan, H., Dede, M., Dobbs, N., Whitney, M., Bowles, P. and Baker, W.E., 1986, Structures to resist the effects of accidental explosions, vol II, Blast, fragment and shock loads, Special publication ARLCD—SP—84001, US Army armament research, development and engineering center. Army engineering directorate, Dover, N.J., (NIST document no. AD-A176 673).
12. High, W.G., 1967, The design and scale model testing of a cubicle to house oxidation or high pressure equipment, Chem. fc Ind.. 899—910.
447
n
s
ICHEME SYMPOSIUM SERIES NO. 141
Figure 1 Fluid expansion energy for nitrogen
Figure 2 Fluid expansion energy for nitroge
j= i * » •
p
i R
X
rlu
i
25
20
15
10
5
0
.£
2 • " -
energ
y
c o
xpansi
2
0 5 0 1 0 0 1 5 0 2 0 0
Pressure / bar
100
75
50
25
y\
1 0 0 0 2 0 0 0 3 0 0 0 4 0 0 0
Pressure / bar
Figure 3 Fluid expans ion energy for l iquids
Figure 4 Fluid expansion energy for liquid
to
i a x 0) "D 3 &T. : ^ ercury
y 5̂
100
5 0 0
Pressure / bar
1 0 0 0
i a X
a)
•g
D II
5 10
Pressure / kbar
448
ICHEME SYMPOSIUM SERIES NO. 141
Figure 5
Peak pressure inside
a cubicle
1 0 0 0 0
1 0 0 0
1 0 0
100
<D 10
1 1
0.1
; ^
N
'V V"
\ \ . . . . N^;::::::::::;::::::::?:
\ ° Y \ \ :
\ \ \ \
• * •
-r
0.05 0.1 1
Scaled distance / m/MJ1'3
Figure 6
Impulse inside
a cub ic le
0 . 0 5 0.1 1
Scaled distance / m/MJ1/3
ICHEME SYMPOSIUM SERIES NO. 141
Figure 7 Pressure-impulse diagram for plates
S ft 3 UJ
3
I 2 "O 0 co
1 1 o 2
0
L I
Surv
)efor
ive
n :
0 1 2 3 4 5
Normalised pressure (PXVfcrh2)
450