safety driven performance, lloyd’s register, october, 2013, houston, texas, usa daryl attwood phd...
TRANSCRIPT

Safety Driven Performance, Lloyd’s Register, October, 2013, Houston, Texas, USADaryl Attwood PhD
Occupational accidents –
a holistic approach
Daryl Attwood, PhD
* Based on research conducted at Memorial University of Newfoundland, Canada

OIL AND GASLLOYD’S REGISTER EMEA
Safety Driven Performance, Lloyd’s Register, October, 2013, Houston, Texas, USADaryl Attwood PhD
Safety notes
• No alarm tests are expected, so any heard are real
• Evacuation routes
• Muster location
OIL AND GASLLOYD’S REGISTER EMEA
Safety Driven Performance, Lloyd’s Register, October, 2013, Houston, Texas, USADaryl Attwood PhD
Lloyd’s Register
• Celebrated 250th anniversary in 2010.
• Lloyd’s coffee house – London – not the insurance company
• Primary objective – safety of people in the industries we serve.
• Began with ships – now in many industries, including a significant oil and gas presence.
OIL AND GASLLOYD’S REGISTER EMEA
Safety Driven Performance, Lloyd’s Register, October, 2013, Houston, Texas, USADaryl Attwood PhD
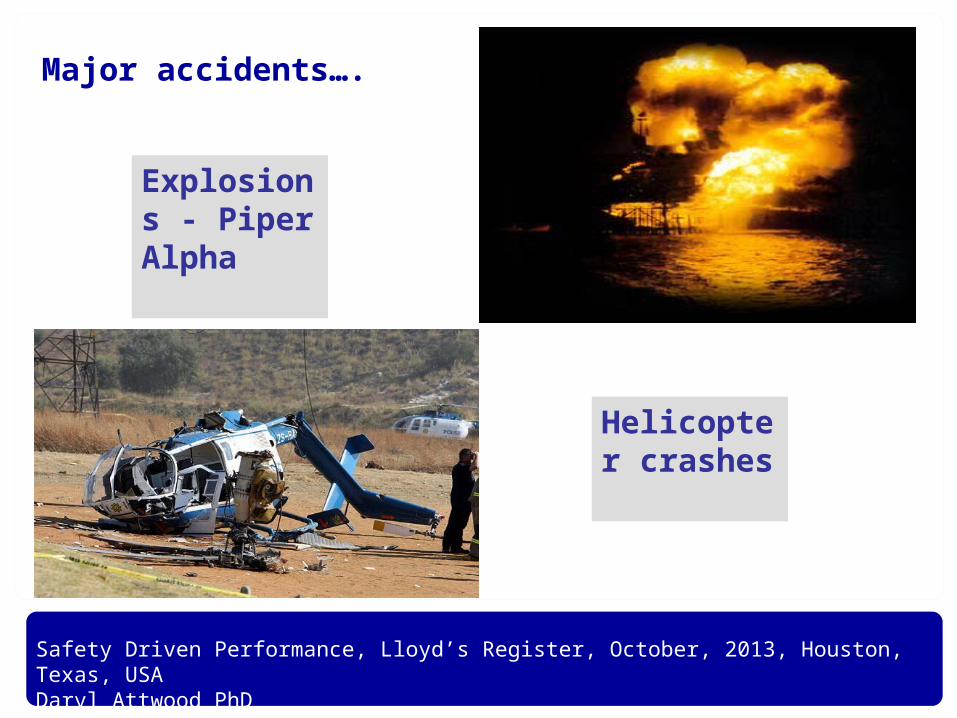
Major accidents….
Explosions - Piper Alpha
Helicopter crashes
OIL AND GASLLOYD’S REGISTER EMEA
Safety Driven Performance, Lloyd’s Register, October, 2013, Houston, Texas, USADaryl Attwood PhD
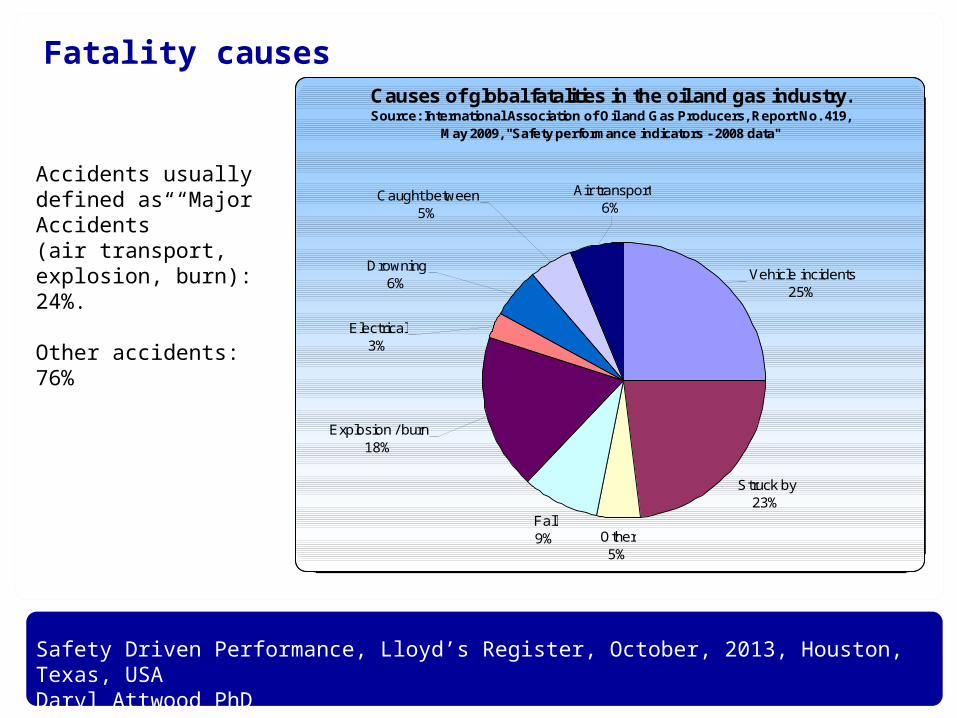
Fatality causesCauses of global fatalities in the oil and gas industry. Source: International Association of Oil and Gas Producers, Report No. 419,
May 2009, "Safety performance indicators - 2008 data"
Struck by23%
Other5%
Fall9%
Air transport6%
Explosion / burn18%
Electrical3%
Drowning6%
Caught between5%
Vehicle incidents25%
Accidents usually defined as “Major Accidents”(air transport, explosion, burn): 24%.
Other accidents: 76%

OIL AND GASLLOYD’S REGISTER EMEA
Safety Driven Performance, Lloyd’s Register, October, 2013, Houston, Texas, USADaryl Attwood PhD
Occupational accidents – trips, falls, etc.….
OIL AND GASLLOYD’S REGISTER EMEA
Safety Driven Performance, Lloyd’s Register, October, 2013, Houston, Texas, USADaryl Attwood PhD
Direct causes? Quality of safety equipment? Weather
conditions? Safety behaviour?
Occupational accident root causes………
Something even broader?Cultural / Regional differences?Global Fatal Accident Rate (FAR) = 3.1Middle East = 2.4, Africa, 4.4, South America
5.2
Financial pressure on corporations?
Organisational issues? Training? Procedures? Corporate safety
culture?Lost time incident frequency (LTIF) ranged
from 0.00 to 3.96
FAR = Fatal accidents per 100 million hours workedLTIF = Fatalities + lost workday cases per one million hours worked
OIL AND GASLLOYD’S REGISTER EMEA
Safety Driven Performance, Lloyd’s Register, October, 2013, Houston, Texas, USADaryl Attwood PhD
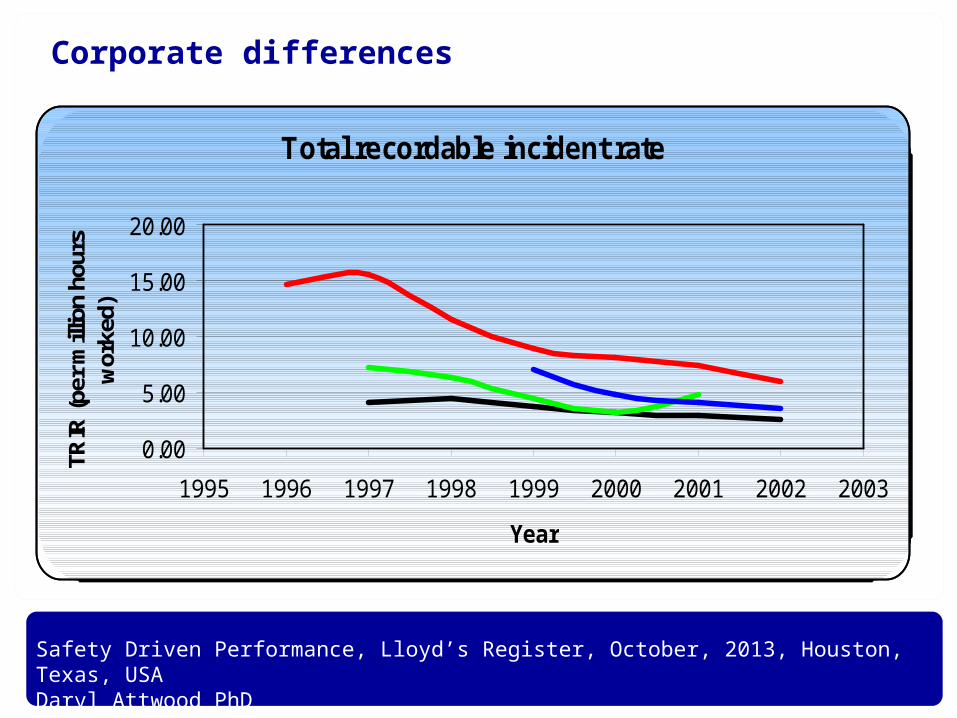
Corporate differences
Total recordable incident rate
0.00
5.00
10.00
15.00
20.00
1995 1996 1997 1998 1999 2000 2001 2002 2003
Year
TRIR
(per
mill
ion
hour
s w
orke
d)
OIL AND GASLLOYD’S REGISTER EMEA
Safety Driven Performance, Lloyd’s Register, October, 2013, Houston, Texas, USADaryl Attwood PhD
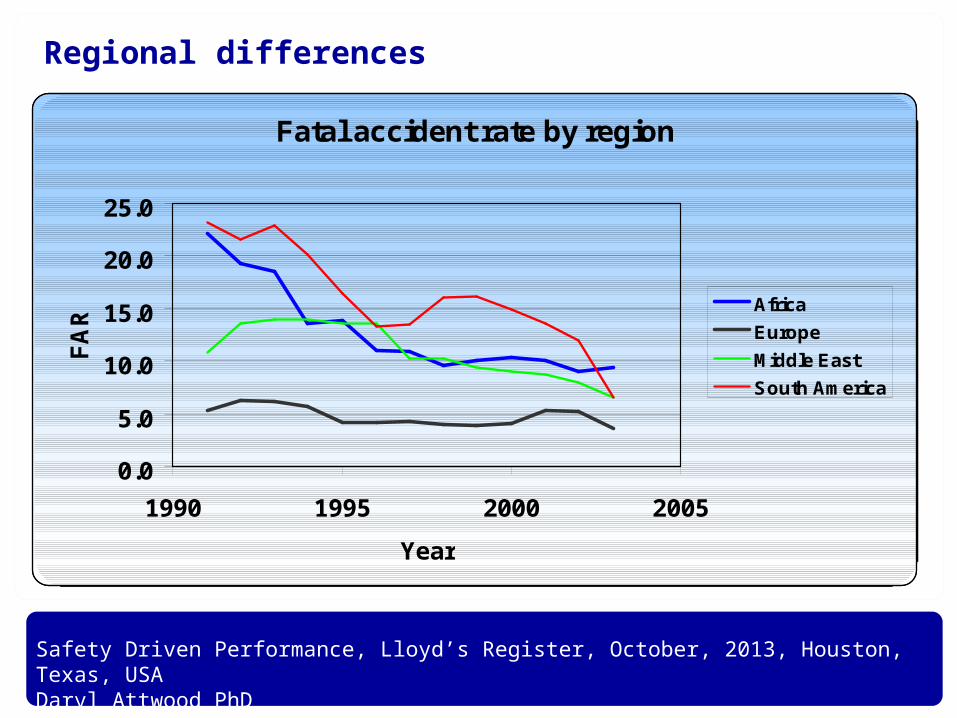
Regional differences
Fatal accident rate by region
0.0
5.0
10.0
15.0
20.0
25.0
1990 1995 2000 2005
Year
FA
R
Africa
Europe
Middle East
South America
OIL AND GASLLOYD’S REGISTER EMEA
Safety Driven Performance, Lloyd’s Register, October, 2013, Houston, Texas, USADaryl Attwood PhD
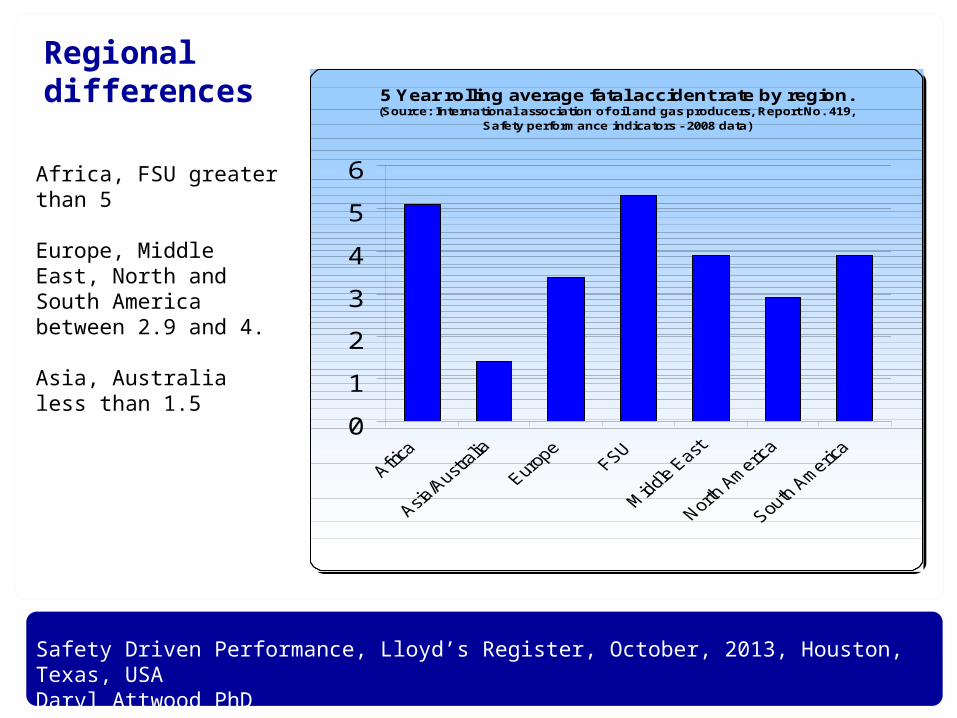
Regionaldifferences 5 Year rolling average fatal accident rate by region.
(Source: International association of oil and gas producers, Report No. 419, Safety performance indicators - 2008 data)
0
1
2
3
4
5
6Africa, FSU greater than 5
Europe, Middle East, North and South America between 2.9 and 4.
Asia, Australia less than 1.5
OIL AND GASLLOYD’S REGISTER EMEA
Safety Driven Performance, Lloyd’s Register, October, 2013, Houston, Texas, USADaryl Attwood PhD
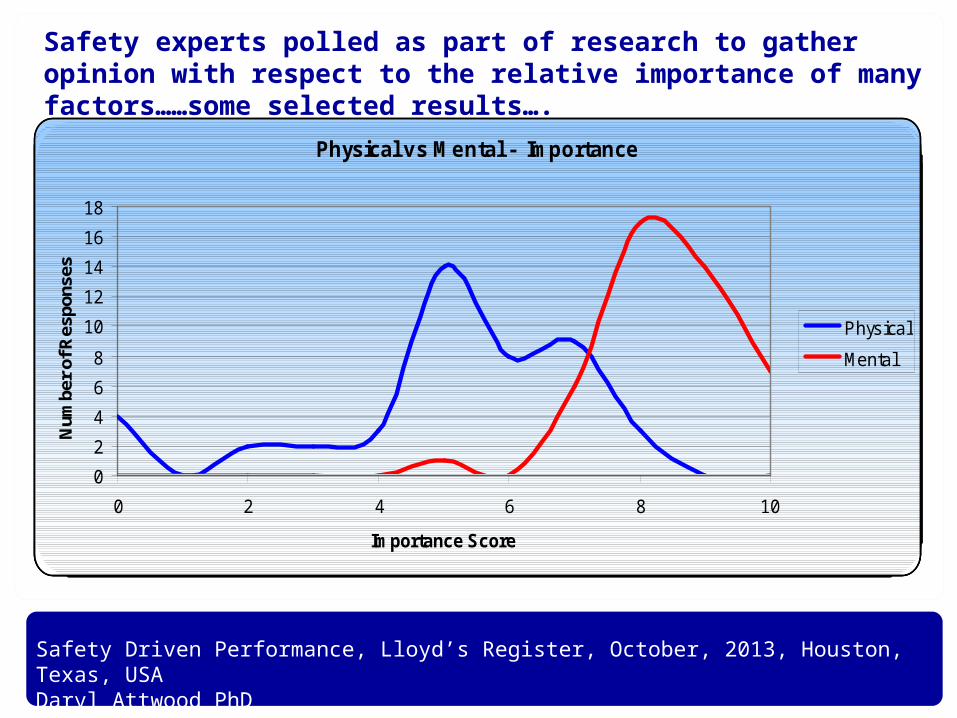
Safety experts polled as part of research to gather opinion with respect to the relative importance of many factors……some selected results….
Overall Importance Frequency
0
2
4
6
8
10
12
14
16
18
0 2 4 6 8 10
Importance Score
Nu
mb
er o
f R
esp
on
ses
External
Organisational
Direct
Physical vs Mental - Importance
0
2
4
6
8
10
12
14
16
18
0 2 4 6 8 10
Importance Score
Num
ber
of R
espo
nses
Physical
Mental
OIL AND GASLLOYD’S REGISTER EMEA
Safety Driven Performance, Lloyd’s Register, October, 2013, Houston, Texas, USADaryl Attwood PhD
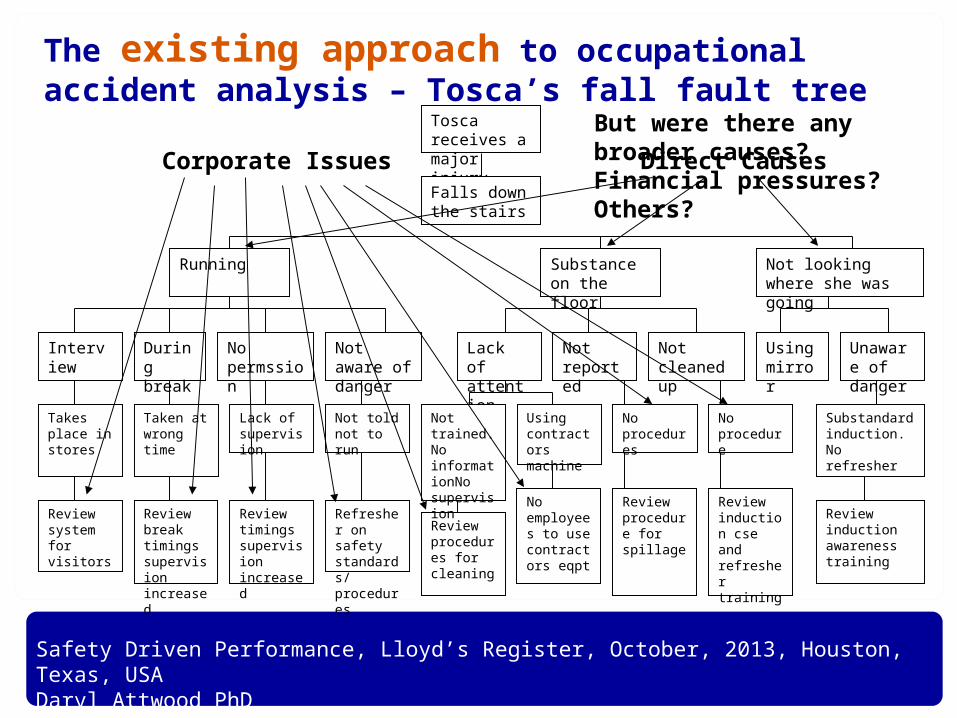
Tosca receives a major injury
Falls down the stairs
Not looking where she was going
Not reported
Lack of attention
Not aware of danger
No permssion
Substance on the floor
Duringbreak
Interview
Running
No employees to use contractors eqpt
Using contractors machine
Review procedures for cleaning
Not trained. No informationNo supervision
Refresher on safety standards/procedures
Not told not to run
Lack of supervision
Review timings supervision increased
Review break timings supervision increased
Taken at wrong time
Review system for visitors
Takes place in stores
No procedures
Review procedure for spillage
Review induction awareness training
Review induction cse and refresher training
Substandard induction. No refresher
No procedure
Using mirror
Not cleaned up
Unaware of danger
The existing approach to occupational accident analysis – Tosca’s fall fault tree
Direct CausesCorporate Issues
But were there any broader causes? Financial pressures? Others?

OIL AND GASLLOYD’S REGISTER EMEA
Safety Driven Performance, Lloyd’s Register, October, 2013, Houston, Texas, USADaryl Attwood PhD
A holistic approach to occupational accident analysis
External influence
Corporate influence
Direct factors
OIL AND GASLLOYD’S REGISTER EMEA
Safety Driven Performance, Lloyd’s Register, October, 2013, Houston, Texas, USADaryl Attwood PhD
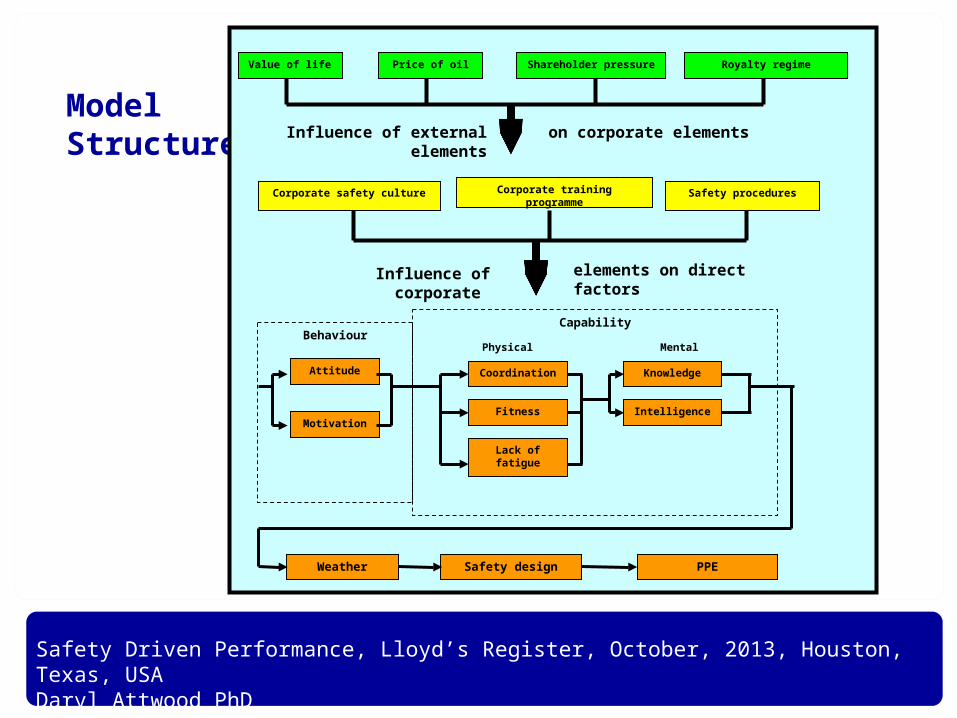
ModelStructure
Capability
MentalPhysical Behaviour
Attitude
Motivation
Coordination
Fitness
Lack of fatigue
Knowledge
Intelligence
Weather Safety design PPE
Value of life Price of oil Shareholder pressure Royalty regime
on corporate elementsInfluence of external elements
Corporate safety culture Corporate training programme Safety procedures
Influence of corporate elements on direct factors

OIL AND GASLLOYD’S REGISTER EMEA
Safety Driven Performance, Lloyd’s Register, October, 2013, Houston, Texas, USADaryl Attwood PhD
Model running mechanism
1. Calibration against an existing, known result.
2. Compare performance of case under consideration with base
case for each element.
3. Re-run model using adjusted component reliabilities – this
generates actual prediction for the case under consideration.
OIL AND GASLLOYD’S REGISTER EMEA
Safety Driven Performance, Lloyd’s Register, October, 2013, Houston, Texas, USADaryl Attwood PhD
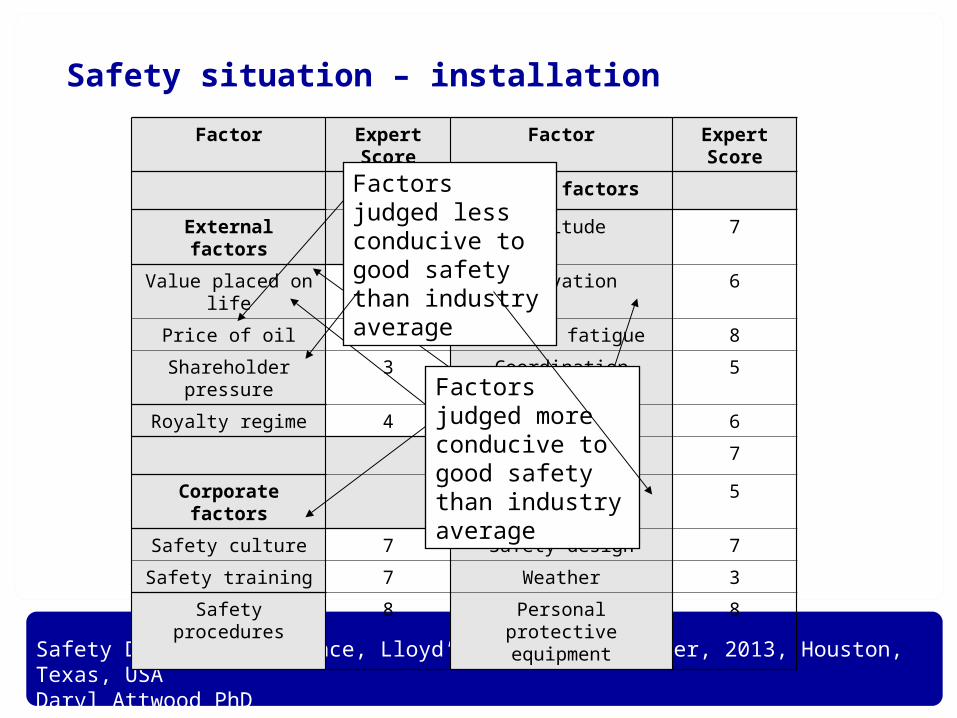
Safety situation – installation
Factor Expert Score Factor Expert Score
Direct factors
External factors Attitude 7
Value placed on life 9 Motivation 6
Price of oil 10 Lack of fatigue 8
Shareholder pressure 3 Coordination 5
Royalty regime 4 Fitness 6
Knowledge 7
Corporate factors Intelligence 5
Safety culture 7 Safety design 7
Safety training 7 Weather 3
Safety procedures 8 Personal protective equipment
8
Factors judged more conducive to good safety than industry average
Factors judged less conducive to good safety than industry average
OIL AND GASLLOYD’S REGISTER EMEA
Safety Driven Performance, Lloyd’s Register, October, 2013, Houston, Texas, USADaryl Attwood PhD
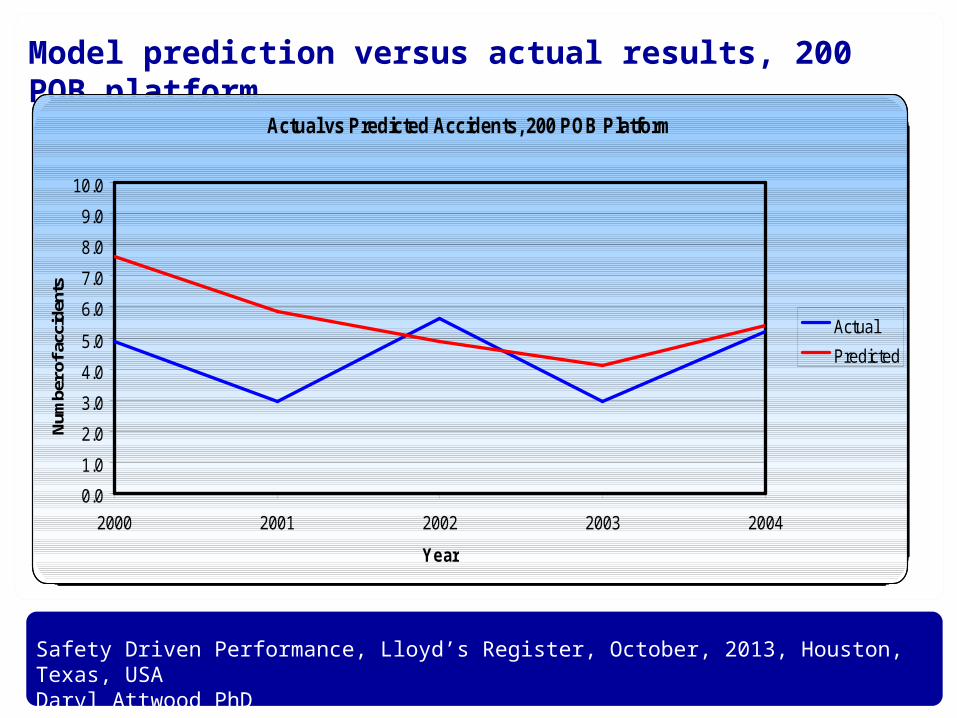
Model prediction versus actual results, 200 POB platform
Actual vs Predicted Accidents, 200 POB Platform
0.0
1.0
2.0
3.0
4.0
5.0
6.0
7.0
8.0
9.0
10.0
2000 2001 2002 2003 2004
Year
Num
ber o
f acc
iden
ts
Actual
Predicted
OIL AND GASLLOYD’S REGISTER EMEA
Safety Driven Performance, Lloyd’s Register, October, 2013, Houston, Texas, USADaryl Attwood PhD
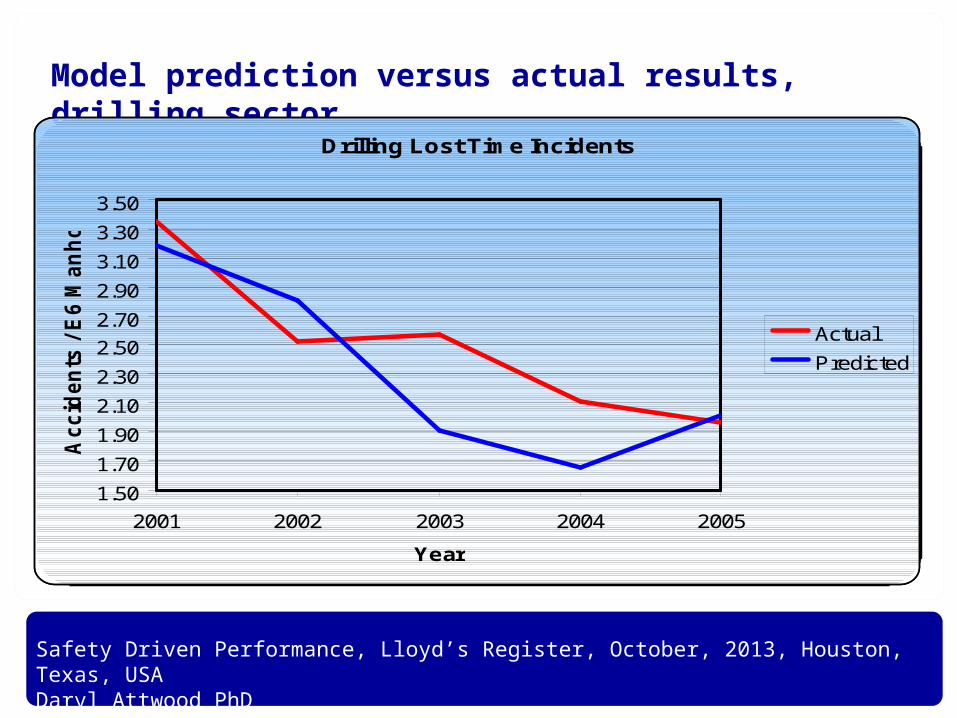
Model prediction versus actual results, drilling sector
Drilling Lost Time Incidents
1.50
1.70
1.90
2.10
2.30
2.50
2.70
2.90
3.10
3.30
3.50
2001 2002 2003 2004 2005
Year
Accid
en
ts / E
6 M
an
ho
urs
Actual
Predicted
OIL AND GASLLOYD’S REGISTER EMEA
Safety Driven Performance, Lloyd’s Register, October, 2013, Houston, Texas, USADaryl Attwood PhD
Model Uses
• Predict accident numbers or frequencies on new installations
• Study the effect of changes in individual safety program
elements on safety results
• Establish key performance indicator targets for staff and
contractor organisations.

OIL AND GASLLOYD’S REGISTER EMEA
Safety Driven Performance, Lloyd’s Register, October, 2013, Houston, Texas, USADaryl Attwood PhD
Model use in predicting probability of number of accidents
Proability of accidents
0
0.05
0.1
0.15
0.2
0.25
0.3
0.35
0 1 2 3 4 5 6
Number of accidents
Pro
abili
ty

Safety Driven Performance, Lloyd’s Register, October, 2013, Houston, Texas, USADaryl Attwood PhD
Occupational accidents –
a holistic approach
Daryl Attwood, Ph D
* Based on research conducted at Memorial University of Newfoundland, Canada