safe transitions from automated to manual driving - … · non-automated : full control -...
TRANSCRIPT
Safe Transitions From Automated to Manual Driving Josef Nilsson
Outline
• Vehicle automation • Experiments of driver takeover when
automation fails • Improving safety of driver takeovers • Conclusions and future work
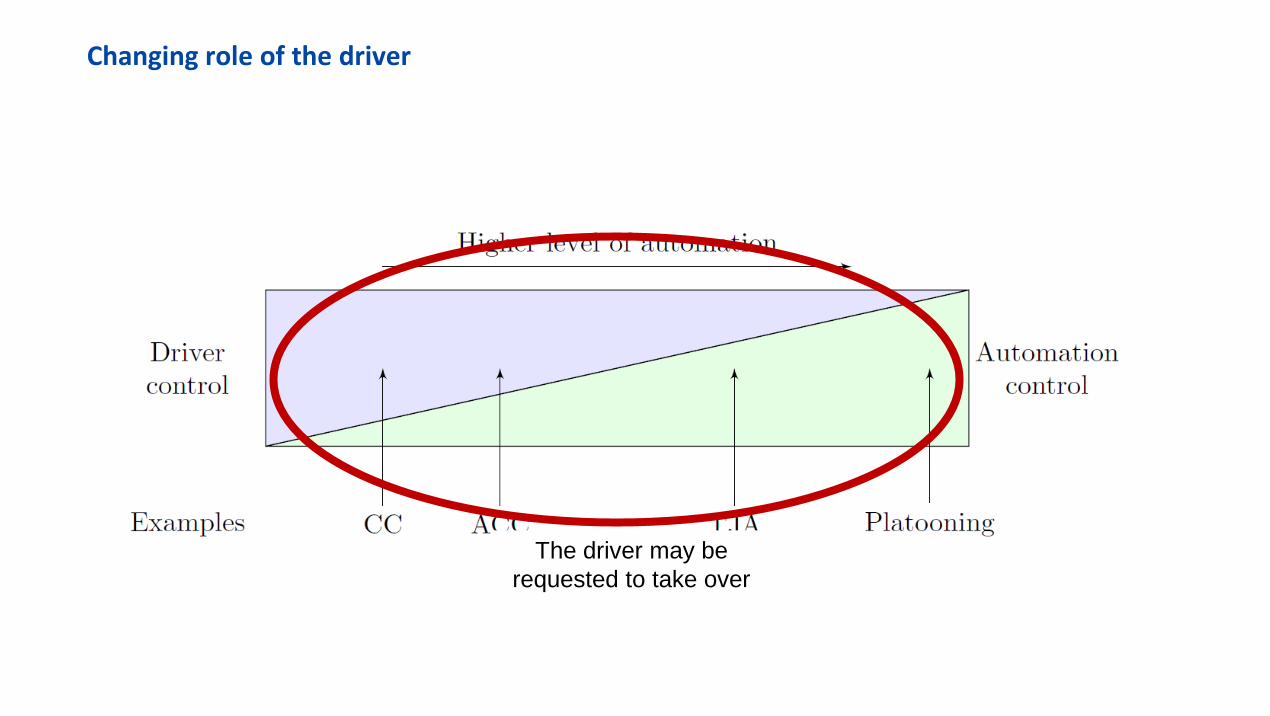
Changing role of the driver
The driver may be requested to take over
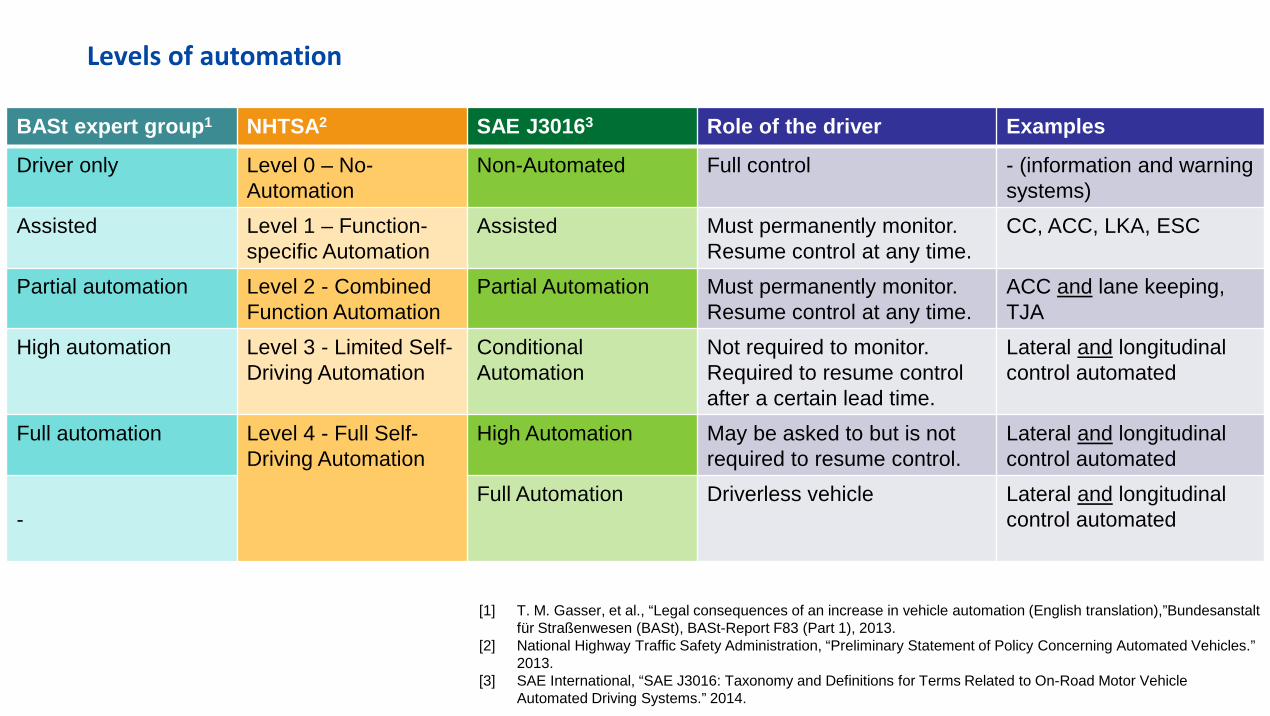
Levels of automation
BASt expert group1 NHTSA2 SAE J30163 Role of the driver Examples
Driver only Level 0 – No-Automation
Non-Automated Full control - (information and warning systems)
Assisted Level 1 – Function-specific Automation
Assisted Must permanently monitor. Resume control at any time.
CC, ACC, LKA, ESC
Partial automation Level 2 - Combined Function Automation
Partial Automation Must permanently monitor. Resume control at any time.
ACC and lane keeping, TJA
High automation
Level 3 - Limited Self-Driving Automation
Conditional Automation
Not required to monitor. Required to resume control after a certain lead time.
Lateral and longitudinal control automated
Full automation
Level 4 - Full Self-Driving Automation
High Automation
May be asked to but is not required to resume control.
Lateral and longitudinal control automated
-
Full Automation
Driverless vehicle
Lateral and longitudinal control automated
[1] T. M. Gasser, et al., “Legal consequences of an increase in vehicle automation (English translation),”Bundesanstalt für Straßenwesen (BASt), BASt-Report F83 (Part 1), 2013.
[2] National Highway Traffic Safety Administration, “Preliminary Statement of Policy Concerning Automated Vehicles.” 2013.
[3] SAE International, “SAE J3016: Taxonomy and Definitions for Terms Related to On-Road Motor Vehicle Automated Driving Systems.” 2014.

WHAT HAPPENS WHEN DRIVERS ARE REQUIRED TO TAKE OVER WHEN AUTOMATION FAILS?
STUDY #1
How do drivers respond to failures of longitudinal automation provided by an ACC?
Publication: J. Nilsson, N. Strand, P. Falcone, and J. Vinter, “Driver performance in the presence of adaptive cruise control related failures: Implications for safety analysis and fault tolerance,” in Proc. 2013 43rd Annu. IEEE/IFIP Conf. Dependable Syst. Networks Work., 2013, pp. 1–10.
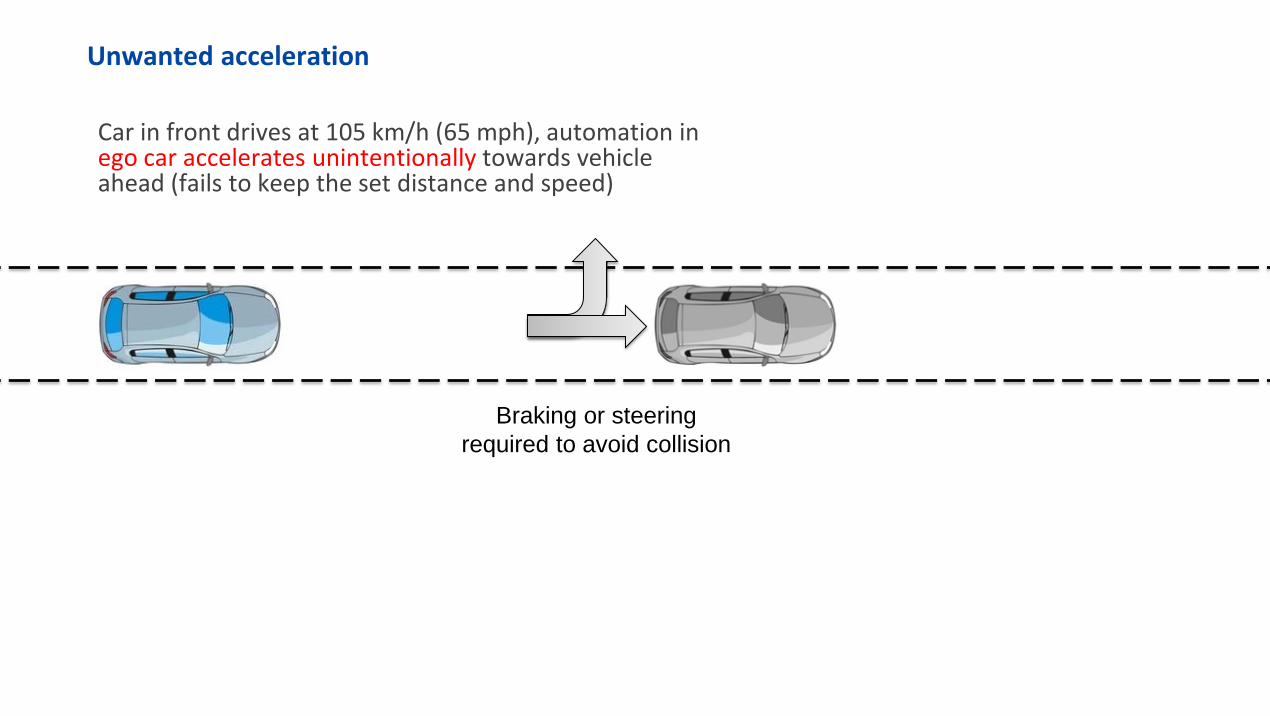
Unwanted acceleration
Braking or steering required to avoid collision
Car in front drives at 105 km/h (65 mph), automation in ego car accelerates unintentionally towards vehicle ahead (fails to keep the set distance and speed)
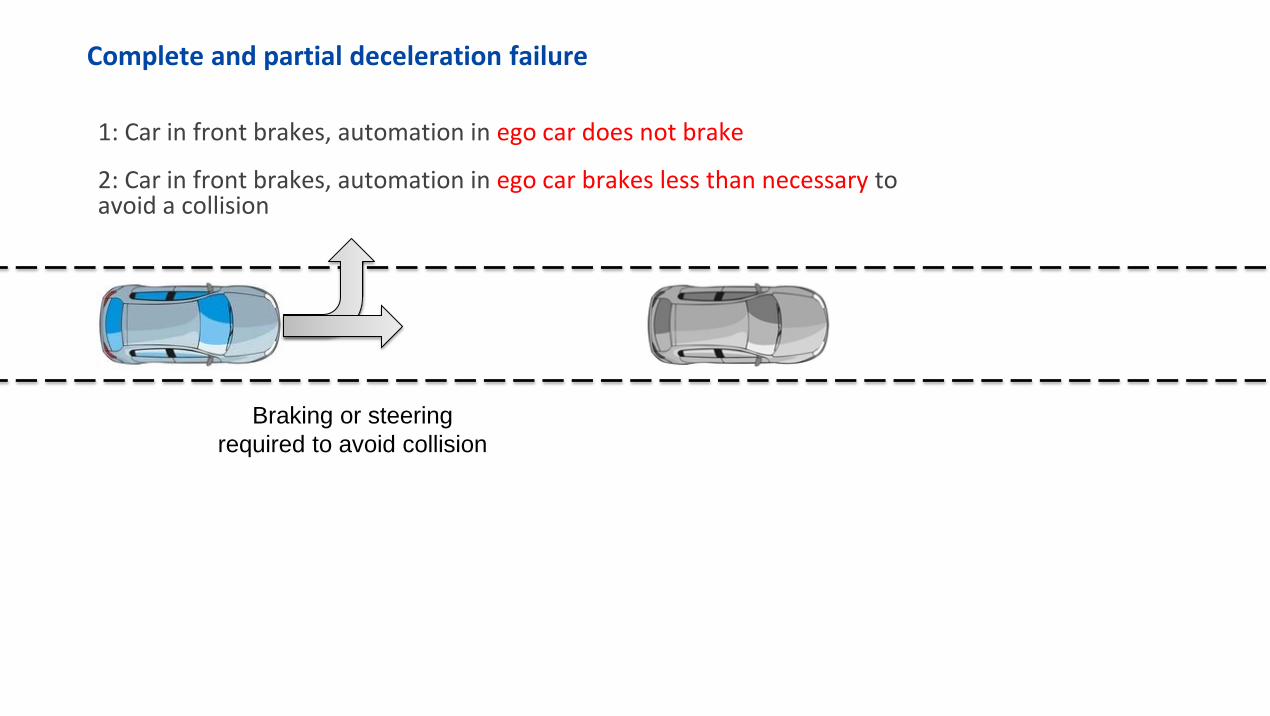
Complete and partial deceleration failure
Braking or steering required to avoid collision
1: Car in front brakes, automation in ego car does not brake
2: Car in front brakes, automation in ego car brakes less than necessary to avoid a collision

Results
0% 20% 40% 60% 80% 100%
Unwanted acceleration
Complete deceleration faliure
Partial deceleration failure
Strategy/Outcome
Missing data Aborted Changed lane Slowed down Collision0
0,5
1
1,5
2
2,5
MTTC MTHW
Minimum Time-Headway (MTHW) and Minimum Time-To-Collision (MTTC)
Complete deceleration failure Partial deceleration failure
𝑡𝑇𝑇𝑇 = 𝑑𝑣𝑠
: Time-Headway
𝑡𝑇𝑇𝑇 = �𝑑
𝑣𝑠−𝑣𝑡
∞𝑖𝑖𝑣𝑠 > 𝑣𝑡𝑜𝑡𝑜𝑜𝑜𝑜𝑖𝑜𝑜
: Time-To-Collision
Average collision speed: 36 km/h
82 km/h

STUDY #2
How does level of automation influence how drivers respond to failures?
Publication: N. Strand, J. Nilsson, I. C. M. Karlsson, and L. Nilsson, “Semi-automated versus highly automated driving in critical situations caused by automation failures,” Accepted for publication in Transp. Res. Part F Traffic Psychol. Behav.

Complete and partial deceleration failures
Braking required to avoid collision
CDF: Car in front brakes, automation in ego car does not brake
SDF: Car in front brakes, automation in ego car brakes less than necessary (~30% of full brake capacity) to avoid a collision
MDF: Car in front brakes, automation in ego car brakes less than necessary (~60% of full brake capacity) to avoid a collision
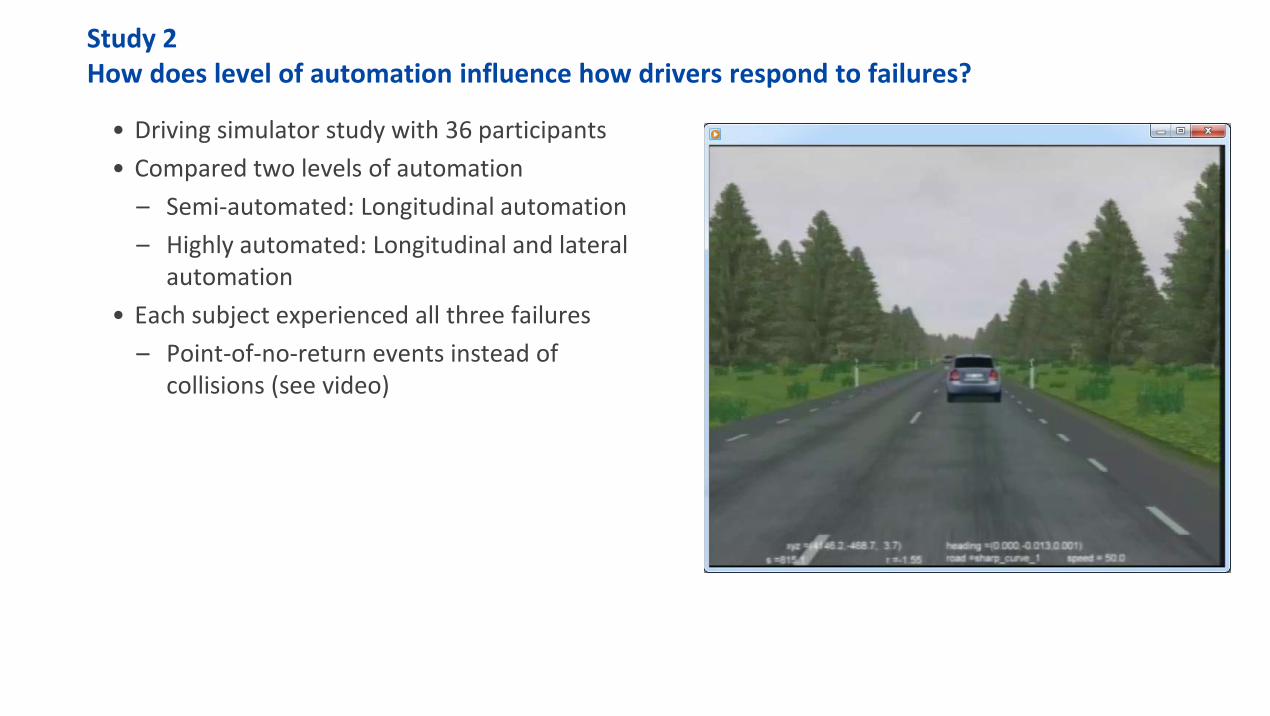
Study 2 How does level of automation influence how drivers respond to failures?
• Driving simulator study with 36 participants • Compared two levels of automation
– Semi-automated: Longitudinal automation – Highly automated: Longitudinal and lateral
automation • Each subject experienced all three failures
– Point-of-no-return events instead of collisions (see video)
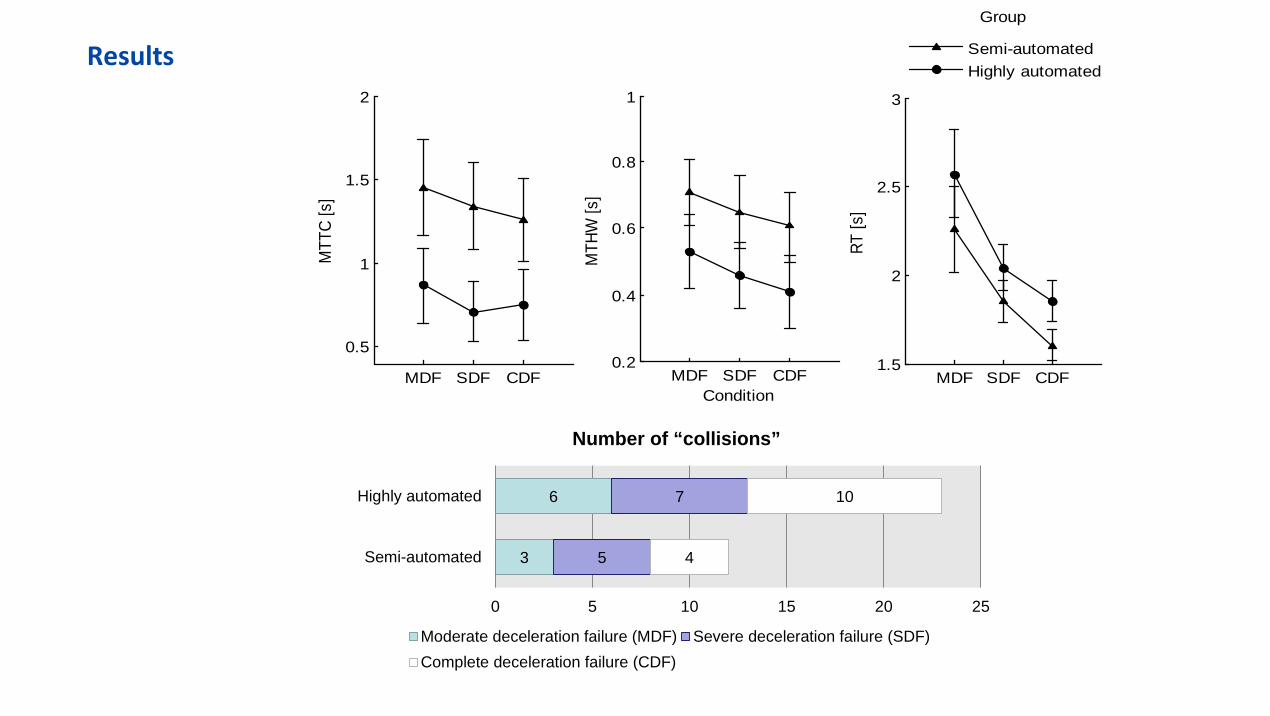
3
6
5
7
4
10
0 5 10 15 20 25
Semi-automated
Highly automated
Number of “collisions”
Moderate deceleration failure (MDF) Severe deceleration failure (SDF)Complete deceleration failure (CDF)
MDF SDF CDF
0.5
1
1.5
2
MTT
C [s
]
MDF SDF CDF0.2
0.4
0.6
0.8
1
Condition
MTH
W [s
]
MDF SDF CDF1.5
2
2.5
3
RT [s
]
Semi-automatedHighly automated
Group
Results
IMPROVING SAFETY OF TRANSITIONS FROM AUTOMATED TO MANUAL DRIVING
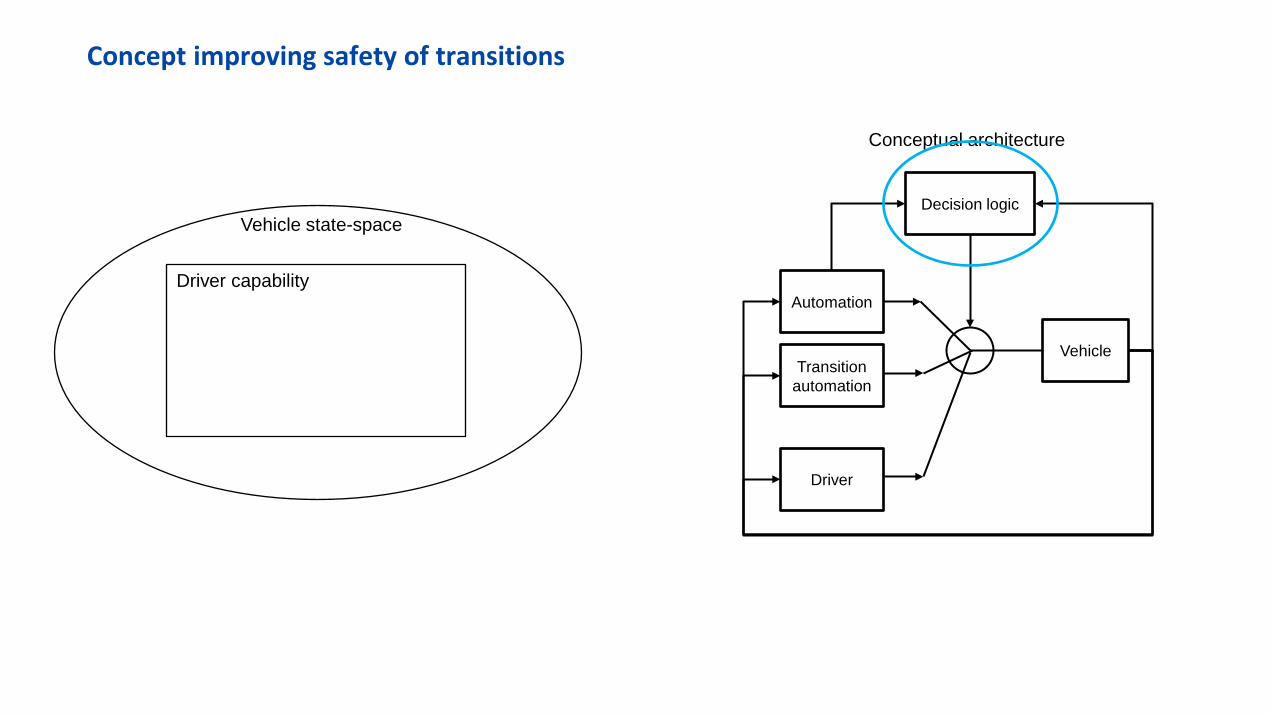
Concept improving safety of transitions
Driver capability
Vehicle state-space
Automation
Transition automation
Decision logic
Vehicle
Driver
Conceptual architecture
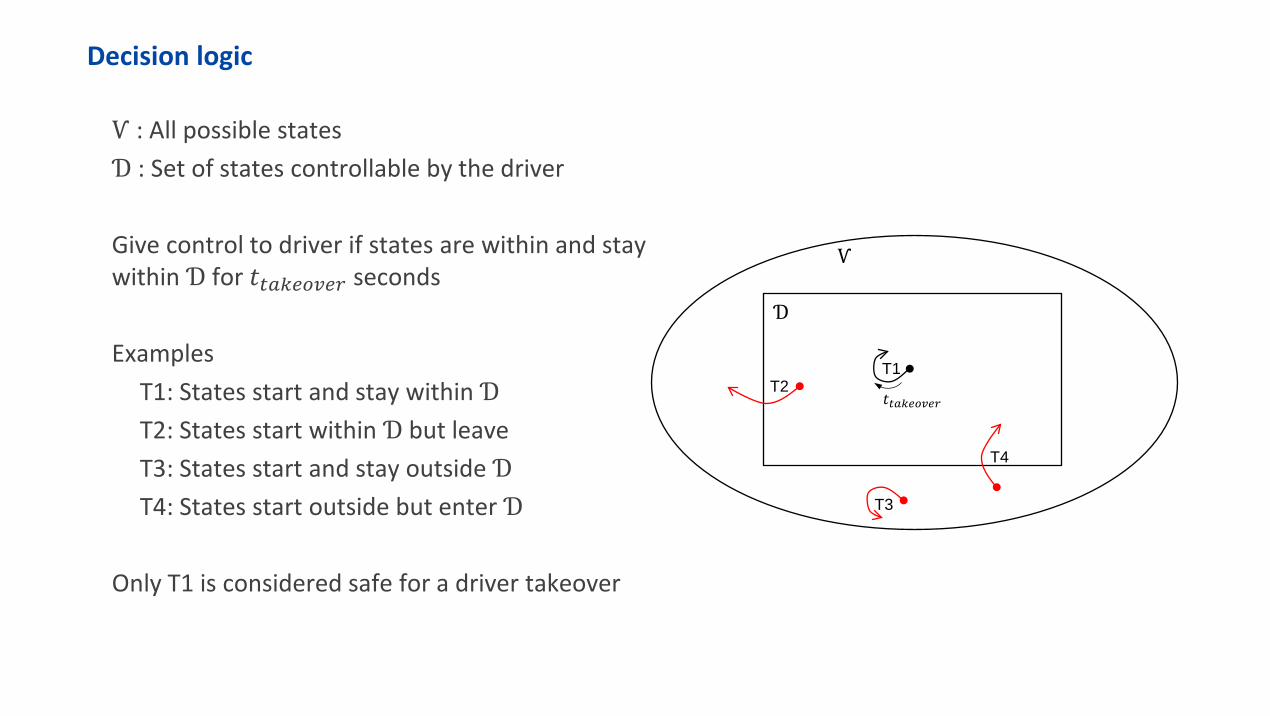
Decision logic
Ѵ : All possible states Ɗ : Set of states controllable by the driver Give control to driver if states are within and stay within Ɗ for 𝑡𝑡𝑡𝑡𝑡𝑡𝑣𝑡𝑡 seconds Examples T1: States start and stay within Ɗ T2: States start within Ɗ but leave T3: States start and stay outside Ɗ T4: States start outside but enter Ɗ Only T1 is considered safe for a driver takeover
T1 T2
Ɗ
Ѵ
T3
T4
𝑡𝑡𝑡𝑡𝑡𝑡𝑣𝑡𝑡

Demonstration on longitudinal automation (adaptive cruise control)
𝑎𝑠 𝑣𝑠
𝑎𝑡 𝑣𝑡
𝑑
𝑎 : longitudinal acceleration 𝑣 : longitudinal velocity 𝑑 : inter-vehicle distance

Procedure to estimate driver capability
Collect and filter out relevant data
from manual driving
Estimate distribution
functions system states
Identify bounds of driver capability at predefined limits in
distributions
0 1 2 3 40
0.5
1
tTHW
p
0 5 10 15 20 250
0.2
0.4
0.6
tTTC
p
-1.5 -1 -0.5 0 0.5 1 1.50
0.5
1
ah
p
0 1 2 3 4THW
0 20 40 60 80 100TTC
-2 -1.5 -1 -0.5 0 0.5 1 1.5 2ah
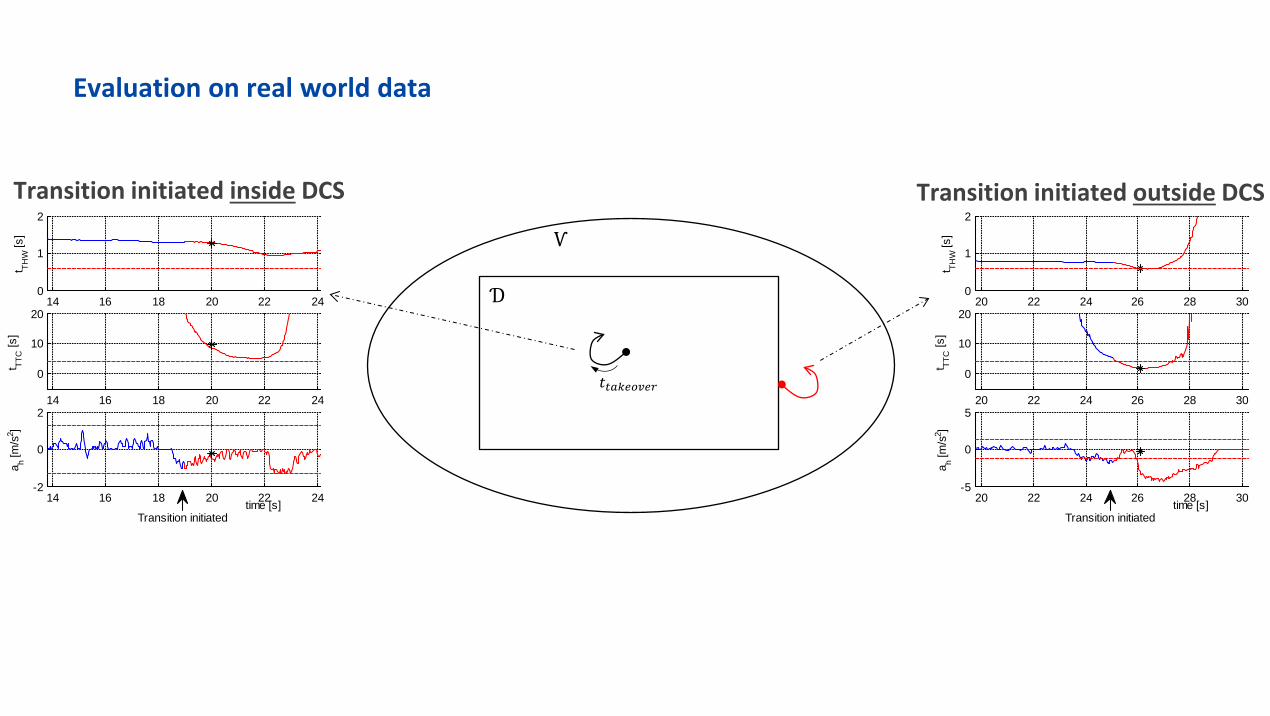
Evaluation on real world data
Transition initiated inside DCS
14 16 18 20 22 240
1
2
t THW
[s]
14 16 18 20 22 24
0
10
20
t TTC [s
]
14 16 18 20 22 24-2
0
2
a h [m/s
2 ]
time [s]Transition initiated
Transition initiated outside DCS
20 22 24 26 28 300
1
2
t THW
[s]
20 22 24 26 28 30
0
10
20
t TTC [s
]
20 22 24 26 28 30-5
0
5
a h [m/s
2 ]
time [s]Transition initiated
Ɗ
Ѵ
𝑡𝑡𝑡𝑡𝑡𝑡𝑣𝑡𝑡

Conclusions and future work
• Drivers are more successful in controlling longitudinal automation failures when lateral automation is
a manual task
• Partial deceleration failure may be less controllable than complete deceleration failure
• Driver capability estimation is a promising tool for preventing unsafe transitions to manual driving
• Need to further investigate what makes a transition to manual driving safe

Acknowledgements
Paolo Falcone, Chalmers University of Technology Jonny Vinter, SP Technical Research Institute of Sweden Niklas Strand, VTI The Swedish National Road and Transport Research Institute MariAnne Karlsson, Chalmers University of Technology Lena Nilsson, VTI The Swedish National Road and Transport Research Institute [email protected]