safe-following distances based on the car-following model
TRANSCRIPT

PIARC International Seminar on Intelligent Transport System (ITS) In Road Network Operations August 14, 2006 to August 16, 2006
Kuala Lumpur, Malaysia
Dr. Ponlathep Lertworawanich, THAILAND
1
SAFE-FOLLOWING DISTANCES BASED ON
THE CAR-FOLLOWING MODEL
Ponlathep Lertworawanich, Ph.D.
Bureau of Road Research and Development Department of Highways
Sri-Ayudhaya Road, Ratchatevi Bangkok 10400 Thailand
Email: [email protected]
ABSTRACT Nowadays transportation forms an integral part of social activities. Unfortunately, one
of the by-products of modern transportation is the price that society pays for injury and loss of life. In Thailand there are more than 100,000 traffic accidents and traffic-related casualties of approximately 12,000 deaths per year. Regardless of which formula one uses to compute the monetary loss and the physiological and psychological stress due to these accidents, the true cost to society is so great that it defies comprehension.
Even though there is no specific statistic in Thailand, it is thought that rear-end
collision is the most common type of road accidents. Therefore, the aim of this research is to mitigate or reduce the severity and the number of road accidents, especially rear-end collisions by introducing a safe-following distance concept. This research developed a methodology to estimate the safe car-following distance for a speed range from 80 to 120 km/h within which speeds are commonly observed on the national highways of Thailand. The proposed is based on the maximum likelihood estimation and perturbation technique to derive the safe following distance. In order to bring the findings of this research into practice, the “dot” tailgating treatment marking is developed as a safety countermeasure for assisting drivers in establishing the recommended following distance. 1. INTRODUCTION
A lot has happened in the world. The dramatic political events, complex changes in the global economy, and major advances in information and technology have been perceived. It is very likely that such developments will continue in the days and years ahead. Yet, even as we step toward the future, important ethical and social issues of human rights, consumer awareness, environmental protection, health, and education remain of pressing concern. Nowadays transportation forms an integral part of social activities. Unfortunately, one of the by-products of modern transportation is the price that society pays for injury and loss of life. No one who lives in a motorized society can fail to be concerned about the enormous human cost of traffic crashes. In Thailand there are more than 100,000 traffic accidents and traffic-related casualties of approximately 12,000 deaths per year. These numbers are very likely to escalate with the welcomed economic growth. Regardless of which formula one uses to compute the monetary loss and the physiological and psychological stress due to these accidents, the true cost to society is so great that it defies comprehension.

PIARC International Seminar on Intelligent Transport System (ITS) In Road Network Operations August 14, 2006 to August 16, 2006
Kuala Lumpur, Malaysia
Dr. Ponlathep Lertworawanich, THAILAND
2
The Department of Highways (DOH) is responsible for planning, designing, constructing, and maintaining national highways throughout Thailand. It is therefore the urgent obligations of the DOH to provide both safe and efficient land transport to the public simultaneously. Even though there is no specific statistic in Thailand, it is thought that rear-end collision is the most common type of road accidents. Many people have experienced the frustration of traveling behind slow-moving vehicles. Under these conditions, many drivers, especially aggressive drivers, are tempted to follow more closely than they should. This practice, commonly referred to as “tailgating,” is risky and can lead to rear-end collisions or other accidents. When drivers tailgate, they significantly reduce their stopping distance or the distance needed to come to a complete and safe stop. Apparently, the more space drivers allow between their vehicles and the vehicles in front of them, the more time they have to see a hazard and react safely.
Car-following theory is one of the most widely used models to explain how vehicles follow one another in a traffic stream. The theory was first developed in the 1950s and continues to be developed today. In general, the relative simple and common driving task of one vehicle following another on a straight roadway where there is no passing can be categorized in three specific subtasks:
• Perception: the driver collects relevant information mainly through the visual channel. This information arises primarily from the motion of the lead vehicle and the driver’s vehicle.
• Decision Making: a driver interprets the information obtained by sampling and integrates it over time in order to provide adequate updating of inputs.
• Control: The skilled driver can execute control commands with dexterity, smoothness, and coordination, constantly relying on feedback from his own responses which are superimposed on the dynamics of car-following system.
These can be illustrated in Figure 1
FIGURE 1: Diagram of Car-following Components
As a result, if one can profoundly gain an insight into the car-following behaviors,
there should be a way to mitigate and/or reduce the severity or the number of road accidents, especially rear-end collisions. The objectives of this research are:
• To review the literature on car-following models, and road safety, • To collect and analyze traffic data such as speeds and flows on the National
Highway 7 or Chon Buri Motorway, • To calibrate the GM 5th car-following model using a macroscopic approach, • To analyze stability of the calibrated GM 5th car-following model,

PIARC International Seminar on Intelligent Transport System (ITS) In Road Network Operations August 14, 2006 to August 16, 2006
Kuala Lumpur, Malaysia
Dr. Ponlathep Lertworawanich, THAILAND
3
• To provide the recommended following distance and a guideline for implementing the recommended following distance on national highways.
In the remainder of this paper, the proposed methodology to calibrate the GM 5th car-following model followed by the stability analysis of the car-following model based on the perturbation technique are presented. The calibration results, and their application to estimate the recommended following distance including a guideline for field implementation are discussed. The final conclusions and recommendations for future research are provided. 2. LITERATURE REVIEW There have long been many researchers investigating car-following models as they constitute the interaction among vehicles in the car-following mode. Car-following models are also one of the major ingredients of any traffic simulation models. It is found that most car-following models attempt to describe acceleration characteristics of the following vehicles in response to the change in motions of the leading vehicles. The GM car-following models are the most remarkable of all. There have been up to five versions of the GM models proposed since the 1950s. The parameter calibrations for these models are usually conducted using linear and nonlinear regression techniques. Maximum likelihood estimation to calibrate the models was proposed by Subramanian (1996) but the formulation of the GM 5th model was incorrectly specified. There are also other types of car-following models such as psycho-physical and fuzzy-logic-based models but only a few of these have broadly been used in practice. Reaction time for a car-following maneuver is the time lag between the detection of a stimulus and the application of the response. Further distinction is made in human factor research between reaction time and response time. The latter includes the duration of the response itself, while the former does not. Several studies have been conducted to estimate drivers’ reaction times. Their results are summarized in the following table. The mean reaction times identifies in literature are rarely greater than 1.50 seconds.
TABLE 1: Summary of Reaction Time Estimation Results
Study Mean Reaction Time (seconds)
Ranjikar et.al (2002) 1.23- 1.33 Gurusinghe et.al (2001) 1.50
Fambro et al (1998), Review 1.28 Fambro et al (1998) 1.10 Lerner et al (1995) 1.31
Ahmed (1999) 1.34
Traffic stability conditions of the car-following models have been analyzed. There are two types of stability, namely 1) local stability, and 2) asymptotic stability. Asymptotic stability is more frequently discussed in literature as it provides information on interactions of each vehicle in the platoons. A Laplace Transforms technique is applied to determine stability conditions of traffic but limited to linear car-following models. In conclusions, the GM 5th model with an appropriate calibration method can be a good representative of the interaction of traffic in a car-following mode.

PIARC International Seminar on Intelligent Transport System (ITS) In Road Network Operations August 14, 2006 to August 16, 2006
Kuala Lumpur, Malaysia
Dr. Ponlathep Lertworawanich, THAILAND
4
3. METHODOLOGY
This section presents a methodology to calibrate the GM 5th car-following model
based on the maximum likelihood estimation concept (MLE). As there always exists the relationship between car-following models and traffic stream models, first the macroscopic traffic stream model corresponding to the GM 5th car-following model is derived. Then, an error term is introduced into the relevant traffic stream model and assumed to be normally distributed so that macroscopic traffic data can be used to calibrate model parameters. Second, using the so-called perturbation technique the calibrated model is investigated to obtain a traffic stability condition.
3.1 Maximum Likelihood Estimation of the Car-following Model The speed-density relationship derived from the GM 5th car-following model is rewritten as follows.
ij
ifi k
kvv ε
βγ
+
−⋅=
−− 11
1
1 (1)
where,
density jammed theis k
speed flow-free theis v
interval observed i the toingcorrespond error term theis
interval observed th i at the stream trafficofdensity average theis
interval observed th i at the stream trafficof speed average theis
j
f
thi
i
i
k
v
ε
The error term is assumed to be i.i.d. normally distributed.
222
1
21)(
],0[~
2
2
ief
N
i
i
εσ
πσε
σε
−
⋅=
(2)
=
= otherwisejiif
ji 0 ),(coυ
2σεε (3)

PIARC International Seminar on Intelligent Transport System (ITS) In Road Network Operations August 14, 2006 to August 16, 2006
Kuala Lumpur, Malaysia
Dr. Ponlathep Lertworawanich, THAILAND
5
Therefore, the likelihood function of N observation intervals is given by the product of Equation (2).
)kk
vvσ
(
)πσ(
)kk
vvσ
(πσ
kvffkvL
βγ
j
ifi
N
iN
N
i
βγ
j
ifi
N
i
N
iiiijf
2
11
1
21 22
1
2
11
1
22
1 1
2
12
1exp
2
1
12
1exp2
1
),( )( ),,,,(
−−⋅−⋅=
−−⋅−⋅=
==
−−
=
=
−−
= =
∏
∏
∏ ∏εσγβ
The log-likelihood is then given by:
2
1
11
1
222 1
21)2ln(
2),,,,(ln ∑
=
−−
−−⋅−−=
N
i
βγ
j
ifijf k
kvvNkvL
σπσσγβ (4)
Maximizing ln L(-) results in the MLE estimates of the model parameters, 2,,,, σγβ jf kv . In order to obtain standard errors of each parameter, information matrix, which is the negative of the expectation of the second order derivatives of the corresponding log-likelihood function, Equation (4), must be computed. This provides the lower bound for the standard errors of the parameters. After the calibration of the car-following parameters, the next step is to analyze the stability condition. 3.2 Stability Analysis of the Car-following Model Tailgating can produce particularly catastrophic results when a platoon of many consecutive tailgaters forms. This is because of intrinsic platoon dynamics which may amplify distances as they propagate down a line of vehicles. If the lead vehicle of a many vehicle platoon slow down gently and then regains its previous speed, the second vehicle may respond by slowing down more rapidly (depending on parameters such as reaction time and headway). The third vehicle will then be confronted with a more rapidly decelerating lead vehicle, so that as we progress down the platoon, each vehicle produces larger deceleration, until eventually braking capability is exceeded. For a sufficiently long platoon of vehicles with identical following parameters, a multiple-vehicle pile-up becomes inevitable. An individual driver in a platoon following at a large headway may damp out the disturbance so that no collisions occur. In general, the consequence of insufficient distances within vehicle platoons may be rear-end collisions, which are one of the most prevalent types of accidents in Thailand. Insufficient distances result from the inadequacy, partly due to human errors, of the drivers to maintain a distance which is adjusted to the speed. Hence, the safety of traffic flow could be enhanced if

PIARC International Seminar on Intelligent Transport System (ITS) In Road Network Operations August 14, 2006 to August 16, 2006
Kuala Lumpur, Malaysia
Dr. Ponlathep Lertworawanich, THAILAND
6
the drivers were provided with information about the safe following distance. In this section, the formulation to estimate the following distance that guarantee asymptotic stability of traffic is derived.
For the ease of analysis, the governing equation of the car-following model (1) can be rewritten as follows
))()(())()(()(
)( 11
11 tXtX
tXtXTtX
TtX nnnn
nn +
+
++ −
−+
=+ &&&
&&γ
βα (5)
To examine the stability we perturb the equilibrium solution with a small deviation term ε as shown below.
),()( tntvnbtX n ε+⋅+⋅= (6) Where,
condition statesteay thefromdeviation theis
statesteady at stream trafficof speed theis v
statesteady at vehicleseconsecutiv obetween tw distance average theis b
tat time len th vehic theof distance traveled theis )(
ε
tX n
In order to analyze the relative magnitude of the deviation between two consecutive vehicles in the car-following mode, we assume that ti
n eftn ωε ⋅=),( . Substitute Equation (6) into Equation (5), we obtain the following.
λωλ
ωλω
αλεελε
εεεαε
εεεε
εαε
ω
ωωω
γ
β
γ
β
γ
β
+⋅=
=−=⋅
⋅+−=++
+−⋅
=++
+−+−++++⋅
=++
+
++
Tin
n
itωnnn
titin
Ti
eiff
efε(n,t)ffeiefie
bvtntnTtn
vbtntnb
vTtn
tntntntnb
TtnvTtn
1
112 . since )]()[()(
][][ as define usLet )},1(),({),1(
. and tocompared when small very is since )},1(),({][
][),1(
)},1(),({)],1(),([
)],1([),1(
&&&&
&&&&
&&&
&&
Using the Euler’s formula, we obtain

PIARC International Seminar on Intelligent Transport System (ITS) In Road Network Operations August 14, 2006 to August 16, 2006
Kuala Lumpur, Malaysia
Dr. Ponlathep Lertworawanich, THAILAND
7
λωω
ωωλω
ωωωωωλω
ωωωωλλ
λωωωωλ
λωωωλ
2Tsin
sin2
cossinsin2
1)cos()sin(
;1
sincos
)sin(cos
2
2222
22
21
1
1
≤
≤
+≤
≤+−
≤
+−=
+⋅+⋅=
+
+
+
T
TTT
TTff
TTiff
TiTiff
n
n
n
n
n
n
Taking the limit of ω approaching zero, then we observe that stability occurs when
21or
21
'
≤⋅⋅
≤⋅
Tb[v]α
T
γ
β
λ (7)
Based on the perturbation technique, the stability condition of the GM 5th car-following model is derived. Equation (7) is the stability condition, which applies to all vehicles in a platoon at any given point in time and guarantees asymptotic stability of traffic flows.
4. CALIBRATION RESULT AND ITS APPLICATION The National Highway 7 was selected as the study facility because of its high volume
and prevailing speed. The National Highway 7 or Chon Buri Motorway as it is commonly referred to, is a primary freeway facility located east of the Bangkok, and serves as a major corridor for local, regional, and national travels. Directional travel lanes along the Chon Buri Motorway are divided by grass medians. The posted speed limits on the Chon Buri Motorway are 120 km/h for passenger cars and 100 km/h for trucks, and 80 km/h for tractor-semitrailer combination trucks. Traffic volumes on the Chon Buri Motorway system are generally heavy during weekend morning and afternoon peak periods, and breakdowns in traffic flow are typical during these peak times. It is not uncommon for congested conditions to persist for several hours.

PIARC International Seminar on Intelligent Transport System (ITS) In Road Network Operations August 14, 2006 to August 16, 2006
Kuala Lumpur, Malaysia
Dr. Ponlathep Lertworawanich, THAILAND
8
FIGURE 2 : Map of the Study Facility
The Study Site is located in the vicinity of the Rest Area or Bang Pa Kong Interchange at km 50+000 toward Chon Buri. At this site, there are two eastbound travel lanes. Two detectors were installed approximately 200-meters downstream of the acceleration lane.
Study Site km 50+000

PIARC International Seminar on Intelligent Transport System (ITS) In Road Network Operations August 14, 2006 to August 16, 2006
Kuala Lumpur, Malaysia
Dr. Ponlathep Lertworawanich, THAILAND
9
FIGURE 3: Snapshot of the Study Site
FIGURE 4: Schematic of the Study Site
Each detector station can continuously provide information on speeds, flows, densities, and proportions of heavy vehicles of the oncoming traffic in 5-minute intervals. Complete data sets were available for two days (March 23-24 and April 12-13, 2006). Free-flow speeds during off-peak periods were found to be 95 km/h. The percentage of heavy vehicles in the traffic stream in the area of the study site is roughly 5 percent. The study site regularly operates under uncongested conditions. Variations of the traffic demands and speeds throughout the study period resulted in different flows every day of the study. In addition, the speed-flow curve for this study site is developed and used as the basis for the GM car-following model calibration. Apparently, free-flow speed of the study site is approximately 95 km/h with the maximum observed flow of 1700 veh/h/ln. However, congested traffic conditions were not observed during the course of data collection.
From Bangkok
From Rest Area
To Chon Buri
KM 50+000
DETECTORS
200 METERS
N
Detector Location

PIARC International Seminar on Intelligent Transport System (ITS) In Road Network Operations August 14, 2006 to August 16, 2006
Kuala Lumpur, Malaysia
Dr. Ponlathep Lertworawanich, THAILAND
10
Speed-Flow Curve of the Traffic on the National Highway 7 toward Chon Buri
0.0
20.0
40.0
60.0
80.0
100.0
120.0
140.0
0 200 400 600 800 1000 1200 1400 1600 1800
Flow Rate (veh/h/ln)
Spee
d (k
m/h
)
FIGURE 5: Speed-Flow Curve of the Traffic at the Study Site
According to the maximum likelihood estimation technique, the parameter values are obtained through maximizing the log-likelihood function. Estimation results are provided in Table 2. The standard errors of each parameter are estimated using the Cramer-Rao lower bound, which provides a lower bound for the variance of any unbiased estimators.
TABLE 2: Car-following Parameter Estimation Based on MLE
Parameter Mean Standard Error t-ratio
σ2 33.646 2.238 15.034
vf 95.716 0.080 1,196.450
kj 116.067 1.482 78.318
γ 4.510 0.042 107.143
β 0.990 0.00002 49500.000
Apparently from the results, each parameter is statistically different from zero at 95% level of confidence as all t-ratios are greater than 1.96. The free-flow speed is approximately 96 km/h with the jammed density of 116 veh/km/ln. This is corresponding to a minimum spacing of 8.6 meters. Nonetheless, more data are needed to verify the significance of the jammed density because in this study only traffic data from the uncongested-regime are available in the calibration process. In this study, it is assumed that the drivers’ reaction time is 1.50 seconds because it is a conservative value of the reaction times according to the literature. Comparison among the well-known following distance rules is presented in Figure 6.

PIARC International Seminar on Intelligent Transport System (ITS) In Road Network Operations August 14, 2006 to August 16, 2006
Kuala Lumpur, Malaysia
Dr. Ponlathep Lertworawanich, THAILAND
11
Following Distances Based on Different Car-Following Models
0.00
10.00
20.00
30.00
40.00
50.00
60.00
70.00
80.00
0 10 20 30 40 50 60 70 80 90 100 110 120 130 140
Speed (km/h)
Follo
win
g D
ista
nce
(m)
Pipes'Forbes'Calibrated GM2-second Rule
Safe Following Distance (m)
Speed (km/h) Pipes'* Forbes'* Calibrated GM 2-second Rule 0 5.00 5.00 0.00 0.00 10 8.13 9.17 31.52 5.56 20 11.25 13.33 36.70 11.11 30 14.38 17.50 40.12 16.67 40 17.50 21.67 42.74 22.22 50 20.63 25.83 44.88 27.78 60 23.75 30.00 46.71 33.33 70 26.88 34.17 48.32 38.89 80 30.00 38.33 49.76 44.44 90 33.13 42.50 51.06 50.00 100 36.25 46.67 52.26 55.56 110 39.38 50.83 53.36 61.11 120 42.50 55.00 54.39 66.67 130 45.63 59.17 55.35 72.22
* Assume average vehicle length of 5 meters.
FIGURE 6: Comparison of Recommended Following Distances
Based on Different Models There are four models considered namely, 1) Pipes’s model, 2) Forbes’s model, 3) two-second rule, and 4) our calibrated GM model. When speeds are lower than 90 km/h, the recommended following distances of the calibrated GM model are greater than those of the other models. However, when speeds are greater than 90 km/h, except for the Pipes’ and the Forbes’s model, the recommended following distances of the calibrated GM model are lower than those of the two-second rule. It is worth noting that the calibrated GM model provides better estimates of the following distances since other models do not account for unstable behaviors of drivers. The calibrated model is also based on traffic information collected in
Recommended following distances

PIARC International Seminar on Intelligent Transport System (ITS) In Road Network Operations August 14, 2006 to August 16, 2006
Kuala Lumpur, Malaysia
Dr. Ponlathep Lertworawanich, THAILAND
12
Thailand. The following distances are recommended for the speed range from 80 to 120 km/h at which the data are collected. This speed range is commonly observed on national highways.
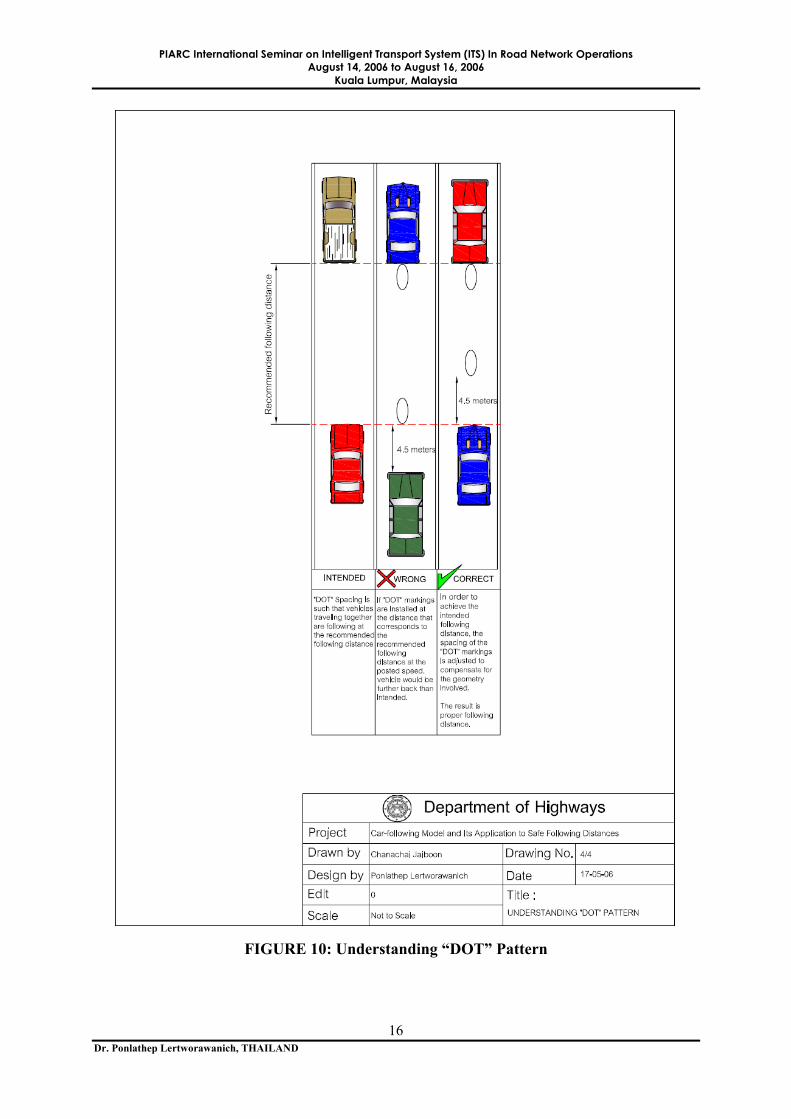
In order to bring the findings of this research into practice, the “dot” tailgating treatment marking is deployed as a safety countermeasure for assisting drivers in establishing recommended following distances. This treatment should be promoted in sections of roads or corridors with higher than average numbers of crashes linked to aggressive driving or tailgating and where traffic congestion is not anticipated. Markings are spaced such that a minimum of two markings separate vehicles, which allows for a recommended distance between them. A guideline for implementing this “dot” tailgating treatment marking is created in a form of drawings. Please note that these drawings are not an ultimate recommendation for practice but it is merely meant to be a starting point for a better research and implementation (please see Figure 7 for details).
Following the same terminology used in FHWA (2003), there are some terms denoted in the guideline drawings
1. Comprehension Time (seconds): Amount of time required for driver to comprehend the meaning of the markings.
2. Perception and Reaction Time (seconds): Indicates time required for an average driver on target roadway to perceive that an action is required and to begin that action. Typical value is 2.5 seconds (from Green Book 2004). This P/R time is different from the reaction time in a usual car-following maneuver.
3. Adjustment Time (seconds): Amount of time provided for the following driver to gauge and adjust the distance between their vehicle and the lead vehicle.
4. Effective Time (seconds): Length of time for which the pattern maintains an effort on the driver. Relates to how long the driver can maintain the distance after leaving the pattern.
5. Posted Speed Limit (km/h): related to the posted speed limit on the target roadway. 6. Marking Spacing, S (meters): this distance reflects the spacing between two pavement
markings within the pattern such that vehicle will traverse two markings in the following time. Value is equal to the recommended following distance from Figure 6 less the vehicle correction.
7. Vehicle Correction (meters): the distance vehicle must be away from the nearest dot to allow the dot to be visible from the drivers’ eye position. This value assumed to be 4.5 meters measured from the bumper to the edge of the dot marking as shown in Figure 9.
8. Number of Markings in Pattern: the number of markings at the marking spacing that can be placed in the length of roadway required to travel at the posted speed for the total required comprehension, perception and reaction, and adjustment times. Value is that length (meters) divided by marking spacing (meters).
9. Pattern Length, L (meters): the distance from the center of the first marking in the pattern to the center of the last marking in the pattern. Value is the number of markings, less one, times marking spacing.
10. Pattern Spacing, X (meters): the distance a vehicle will travel between marking patterns. Relates to effective time such that the effect of the previous set of markings will just begin to fade as driver encounters the next set. Value is posted speed limit times effective time.

PIARC International Seminar on Intelligent Transport System (ITS) In Road Network Operations August 14, 2006 to August 16, 2006
Kuala Lumpur, Malaysia
Dr. Ponlathep Lertworawanich, THAILAND
13
FIGURE 7: Sign and Pattern Layout

PIARC International Seminar on Intelligent Transport System (ITS) In Road Network Operations August 14, 2006 to August 16, 2006
Kuala Lumpur, Malaysia
Dr. Ponlathep Lertworawanich, THAILAND
14
FIGURE 8: Typical “DOT” Marking

PIARC International Seminar on Intelligent Transport System (ITS) In Road Network Operations August 14, 2006 to August 16, 2006
Kuala Lumpur, Malaysia
Dr. Ponlathep Lertworawanich, THAILAND
15
FIGURE 9: “DOT” Tailgating Treatment
PIARC International Seminar on Intelligent Transport System (ITS) In Road Network Operations August 14, 2006 to August 16, 2006
Kuala Lumpur, Malaysia
Dr. Ponlathep Lertworawanich, THAILAND
16
FIGURE 10: Understanding “DOT” Pattern

PIARC International Seminar on Intelligent Transport System (ITS) In Road Network Operations August 14, 2006 to August 16, 2006
Kuala Lumpur, Malaysia
Dr. Ponlathep Lertworawanich, THAILAND
17
5. CONCLUSIONS AND FUTURE RESEARCH
A rear-end collision, often called simply rear-end, is a traffic accident where a vehicle impacts the vehicle in front of it. Typical scenarios for rear-ends are: i) a sudden deceleration by the first car, for example, to avoid someone crossing the street, ii) the following car that does not have the adequate time to brake and impacts the first and iii) at a road junction the following car accelerates more rapidly than the leading. Upon the completion of this research, the following conclusions were drawn:
• The GM 5th car-following model was calibrated based on a macroscopic traffic stream model using traffic data collected at the Nation Highway 7.
• MLE technique can be used to calibrate the GM 5th car-following model. • The perturbation technique can be used to derive the asymptotic stability condition of
the GM 5th car-following model. • The recommended following distance was developed from a speed range from 80
km/h to 120 km/h with guideline drawings for field implementation.
In addition, the following research needs to enhance the analyses of the car-following models for estimating safe following distances are identified as follows:
• Conduct an extensive data collection effort that can provide information on speeds and flows from both expressways and arterials so that both congested and uncongested traffic data are available.
• Conduct data collection using an aerial photograph technique so that microscopic information such as location, speed and acceleration of each vehicle at the study site can be evaluated.
• Develop a methodology based on panel data analysis in such a way that drivers’ reaction times can be calibrated.
• Experiment with the “dot” tailgating treatment marking to evaluate its effectiveness in practice.
• Integrate the findings of this research into future editions of the DOH standard drawings after the experiment indicates the effectiveness of the “dot” tailgating treatment marking.

PIARC International Seminar on Intelligent Transport System (ITS) In Road Network Operations August 14, 2006 to August 16, 2006
Kuala Lumpur, Malaysia
Dr. Ponlathep Lertworawanich, THAILAND
18
REFERENCES Ahmed K.I., Modeling drivers’ acceleration and lane changing behaviors. PhD thesis, Department of Civil and Environmental Engineering, MIT, 1999. Brackstone, M. and McDonald, M. (1999), Car Following: A Historical Review. Transportation Research Part F: Traffic Psychology and Behaviour, 1, 2, pp.181-196. Darroch, J.N., and Rothery, R.W. (1973). Car-Following and Spectral Analysis. Proceeding of the 5th International Symposium on the Theory of Traffic Flow and Transportation, pp.47-56. Fambro D.B., Koppa R.J., Picha D.L. and Fitzpatrick K. (1998), Driver perception-brake response in stopping sight distance situations. Transportation Research Record 1628, pp. 1-7. Forbes, T.W. (1963), Human Factor Considerations in Traffic Flow Theory. Highway Research Record 15, pp.60-66. Gurusinghe, G.S., Nakatsuji, T., Azuta, Y., Ranjitkar, P., Tanaboriboon, Y. Multiple Car Following Data Using Real Time Kinematic Global Positioning System, 81st TRB Annual Meeting, Washington D.C., 2002, Preprint CD-ROM. Gurusinghe, G.S., Nakatsuji, T., Tanaboriboon, Y., and Suzuki, J. (2001). A Car-Following Model Incorporating Excess Critical Speed Concept. Journal of Eastern Asia Society for Transportation Studies, 4(2), pp.171-183. Gazis, D.C., Herman, R., Rothery, R.W. (1961), Nonlinear Follow-the-leader Models of Traffic Flow. Operations Research 9, pp.545-567. Holland, E.N. (1998), A Generalized Stability Criterion for Motorway Traffic. Transportation Research Part B: Methodology 32, pp.141-154. Kohler, U. (1973). Stability of Vehicle Platoons. Proceeding of the 5th International Symposium on the Theory of Traffic Flow and Transportation, pp.39-55. Lerner N., Huey R., McGee H. and Sullivan A. (1995), Older driver perception-reaction time for intersection sight distance and object detection. Report FHWA-RD-93-168, Federal Highway Administration, U.S. Department of Transportation, Washington DC. Leutzbach, W. (1988), An Introduction to the Theory of Traffic Flow, Springer-Verlag, Berlin. May, A.D. (1990). Traffic Flow Fundamentals, Prentice Hall, Englewood Cliffs, New Jersy. Pindyck, R.S., and Rubinfeld, D.L. (1981). Econometric Models and Economic Forecasts, McGraw-Hill, New York. Pipes, L.A. (1953), An Operational Analysis of Traffic Dynamics. Journal of Applied Physics, 24, pp.274-281.

PIARC International Seminar on Intelligent Transport System (ITS) In Road Network Operations August 14, 2006 to August 16, 2006
Kuala Lumpur, Malaysia
Dr. Ponlathep Lertworawanich, THAILAND
19
Ranjitkar P., Nakatsuji, T., Gurusinghe, G.S., Azuta, Y. Car Following Experiments Using RTK GPS and Stability Characteristics of Followers in Platoon, 7th International Conference on Applications of Advanced Technology in Transportation, Boston, 2002, Preprint CD-ROM. Subramanian, H. Estimation of Car-Following Models, M.S. thesis, Department of Civil and Environmental Engineering, MIT, 1996. Winsum, W.V. (1999). The Human Element in Car Following Models. Transportation Research Part F: Traffic Psychology and Behaviour 2, pp.207-221.