sadc regional vulnerability assessment and analysis … to the development of these ... urban...
TRANSCRIPT

1
SADC Regional Vulnerability Assessment and Analysis (RVAA) Programme
Urban Vulnerability Assessment and Analysis Guidelines
September 2015
Ver. 1.0
2
Acknowledgements
The SADC RVAA PMU wishes to acknowledge and thank the many people who have contributed to the development of these guidelines. The contributions from the Urban Assessment Technical Working Group have been instrumental in the process of developing the guidelines, starting with a consultation in Sandton, Republic of South Africa in 2013, and later a consultation in Cape Town in 2014. The urban assessments carried out by national vulnerability committees in Malawi, Swaziland and Zimbabwe played an important part in the conceptualization of the document. In a
consultative process, members of the National Vulnerability Assessment Committees have provided comments that have been invaluable for the process. The development of this guidance document is work in progress. It is envisaged that the document will be updated and expanded, based on the experiences of the NVACs in carrying out urban vulnerability assessment and analysis in the region in 2015 and 2016, leading to a final document.
SADC RVAA PMU

3
Acronyms: ACF Action Contre la Faim
CARI Consolidated Approach to Reporting Food Insecurity
CFSVA Comprehensive Food Security and Vulnerability Assessment
CSI Coping Strategies Index
CSI Coping Strategies Index
COE Centre of Excellence
DEM Digital Elevation Model
DTM Digital Terrain Model
EFSA Emergency Food Security Assessment
EMMA Emergency Market Mapping and Analysis
FDG Focus Group Discussion
FEWSNET Famine Early Warning Systems Network
HEA Household Economy Approach
IHM Individual Household Method
IPC Integrated Food Security Phase Classification
MFIRA Market Information and Food Insecurity Response Analysis
NSO National Statistics Office
NVAC National Vulnerability Assessment Committee
PCMMA Pre-Crisis Market Mapping and Analysis
RVAA Regional Vulnerability Assesment Analysis
RVAC Regional Vulnerability Assesment Commitee
SLF Sustainable Livelihoods Framework
TGS Technical Guidance Sheet
UVAA Urban Vulnerability Assessment and Analysis
VAA Vulnerability Assessment and Analysis
VAC Vulnerability Assessment Committee
WASH Water, Sanitation and Hygiene

4
Contents
1.0 Background 5
1.1 The Growing Need for Urban Vulnerability Assessments 5
1.2 The Role of the SADC Regional Vulnerability Assessment and
Analysis Programme in Urban Vulnerability Assessments 5
2.0 Urban Vulnerability Assessment & Analysis Guidelines 6
2.1 Purpose 6
2.2 Scope and Limitations 6
3.0 Conceptual Framework 7
3.1 The Sustainable Livelihoods Framework 7
3.2 Food and Nutrition Security Conceptual Framework 8
4.0 Current Assessment and Methodological Approaches 9
4.1 Rural versus Urban differences 12
4.2 Adapting Current Assessment to the Urban Setting 14
4.3 Integration of Nutrition, Gender, HIV and Health in Urban VAA 17
5.0 Steps to Undertaking Urban Assessments 17
5.1 Step 1: Defining Objectives 17
5.2 Step 2: Engaging with Partners 19
5.3 Step 3: Defining the type of Assessment 20
5.4 Step 4: Setting up an Assessment and Analysis Framework 21
5.5 Step 5: Data Collection 27
5.6 Step 6: Analysis and Data Processing 28
5.7 Step 7: Report Structure and Format 28
5.8 Step 8: Dissemination and Reporting 29
5.9 Step 9: Monitoring and Evaluation 29
Annexes 31
5
1.0 Background
1.1 The Growing Need for Urban Vulnerability Assessments
Despite economic advances in many parts of the Region, livelihood vulnerability and food insecurity continue to afflict millions of southern Africans. Poverty, climate change, economic shocks, lack of education and skills, and lack of employment opportunities are some of the key increasingly major causes of this vulnerability and a growing threat to any sustainable future for socio-economic development in the Region.
The efforts of SADC, Governments and their partners in socio-economic development and in humanitarian relief have, in recent years, largely concentrated their focus on rural populations. The rationale for this has been based on a perception that a greater proportion of the southern African population living in rural settings were significantly poorer than their urban counterparts. However, there are increasingly larger numbers of poor people existing in urban areas, with sub-Saharan Africa predicted to have over half of its population living in urban areas by 2030 with southern Africa recording one of the fastest growing urban populations. Projected population growth rates by UN-Habitat suggest that Sub-Saharan Africa has both the highest annual urban growth rate and the highest slum growth rate in the world, of 4.58% and 4.53% respectively. Rapid urbanisation in low- and middle- income countries has already increased the number of highly vulnerable urban communities living in informal settlements, many of which are exposed to a range of discrete or multi hazard events.
The rapid increases in the urban population is making livelihood opportunities and services fall short of many people’s minimum livelihood needs in these areas. As a result, urban support groups and residents are applying increasing pressure on local authorities and governments to pay more attention to the urban poor. In response, governments are becoming increasingly aware of their social obligations to provide for their citizens, beyond traditional rural settings to large and complex urban environments.
There is growing realisation that individual and household level poverty reflects the conditions of their livelihoods as a whole, and that a range of livelihood vulnerabilities can lead to shortfalls in access to key services and basic needs including food and nutritional security. To design and better inform appropriate programmes and policies
that lead to improvement of regional livelihoods, policy makers and planners; relief agencies; governments; multilateral organisations and donor agencies must therefore, monitor and understand a host of factors that influence the sustainability or vulnerability of livelihoods. It is widely recognised that vulnerability in urban areas is highly complex. Poverty eradication efforts need to be informed by more robust and systematic urban assessment and analysis frameworks and approaches.
1.2 The Role of the SADC Regional Vulnerability Assessment and Analysis Programme in Urban Vulnerability Assessments
The goal of the SADC RVAA programme is to reduce poverty and livelihood vulnerability through climate resilient livelihoods in the SADC region. The purpose of the SADC RVAA program is to enhance regional and national response to climate change, poverty and livelihood vulnerability. The development of an urban vulnerability assessment and analysis framework will facilitate the Region and Member States NVACs in the application of this goal and purpose to both rural and urban contexts.
The inclusion of urban vulnerability assessment within NVAC activities will considerably strengthen the understanding of livelihoods and poverty in the region. Support to the development of urban livelihood baselines and to regular and rapid urban VAA will considerably augment national capacity for evidence-based planning, responses and interventions in urban areas. The programme will increasingly be able to engage high-level political stakeholders and urban authorities to inform national responses to livelihood vulnerability and food insecurity in both rural and urban contexts.
In addition to regularly producing rural VAA reports for recommendations for long and short-term policy actions, we look forward to the inclusion of urban areas and their populations into this agenda.
This framework represents a continuing commitment to engage in capacity building of national vulnerability assessment committees (NVACs). It is expected that the regional Centres of Excellence (CoE) will become engaged in capacity building for urban VAA.
SADC RVAA strategic thinking around addressing urban vulnerability and the accumulated

6
experience in conducting rural assessments to support harmonized VAA in both rural and urban areas dates back to 2010 when a review of options for harmonization of assessment approaches was undertaken. In 2011, the SADC RVAA programme hosted a technical seminar of agencies and academic institutions, which were developing assessment methods, approaches and tools in the area of Urban Vulnerability Analysis – measurements and modelling. The main purpose of the seminar was to bring together technical partners to share emerging analytical tools as well as their experiences in carrying out urban assessments and linking their findings to policy and programming uptake. The seminar also explored potential strategies for undertaking future urban assessments in collaboration with NVACs interested in such activities. In December 2013, a three day technical workshop organised by the SADC RVAA Urban Vulnerability Assessment Technical Working Group was organised for the purposes of sharing experiences, methodologies and a draft framework for conducting urban assessments was subsequently developed providing an opportunity for harmonising approaches, methodologies and tools.
An Urban Training of Trainers workshop was called in mid-February 2015 by SADC to help NVACs across the region understand what practical implications urban assessments will have on their work specifically in regard to conducting both wide and multifaceted vulnerability assessments or specialized food security and nutrition assessments. The participants to this TOT were selected by the NVACs with immediate interest in engaging in urban VAA and their profiles included experts in various areas of interest for urban VAA, but above all they were officers or technicians with solid experience in carrying out rural and urban assessment of various nature in their respective countries. Two independent consultants hired by SADC led the training, with the support from two members of the urban technical working group (OXFAM and WFP). The ToT was held in Swaziland from 9-19 Feb 2015. The content of this document also reflect substantially the key recommendations that further emerged during the TOT.
The development of this guidance document is work in progress. It is envisaged that the document will be updated and expanded, based on the experiences of the NVACs in carrying out urban vulnerability assessment and analysis in the region in 2015 and 2016, leading to a final document.
2.0 Urban Vulnerability Assessment & Analysis Guidelines
2.1 Purpose
The purpose of the guidance document is to support Member State NVACs with a harmonised framework for integrating a range of tools and approaches for vulnerability assessments in urban and peri-urban contexts. The dynamic nature of vulnerability in urban areas demands assessments that transcend singular notions or measurements. Issues of mobility and urban growth in part underpin this complexity. Urban VAA can, thus, take a wide range of scope and coverage. For the SADC RVAA Programme, the main objective is to support harmonized VAA in both rural and urban areas. In this regard, the organising theme of the guidelines is around food and nutrition security although the guidelines are broad enough for NVACs or any stakeholder to use them for themed sectorial assessments focusing for example on poverty, climate change, water and sanitation or others.
The guide document provides a framework within which urban food and nutrition assessments can be explored but does not prescribe any particular methodology or tools but rather a mix of several depending on the specific Member states context. This comes from a realisation that there are a number of substantive and methodological issues associated with conducting food and nutrition security assessments in urban areas using a single approach as many are still exploratory and require further testing and elaboration. The guidance also provides a format for arranging and structuring an urban assessment including identifying materials that are available and used by various organisations. The proposed sequence of steps will allow the user to take a logical approach to designing and implementing an assessment with appropriate methodologies.
2.2 Scope and Limitations
While the guidelines can be used as reference and resource material for step-by-step conducting of the various forms of urban vulnerability assessments, their focus is mainly on livelihoods and food and nutrition security. The focus aligns the guidelines to the rural vulnerability assessments that NVACs have been carrying out. It is hoped that once fully developed and integrated, NVACs will soon provide vulnerability assessment outcomes that cover entire populations of their citizenry.
7
The SADC RVAA Programme acknowledges that whilst food and nutrition insecurity should be at the core of UVAA, it is critical that other multi-sectoral issues and variables are also considered as core part of the baseline and regular monitoring assessments. These include: General livelihoods, urban poverty, health, water,living environment, sanitation and hygiene (WASH), education, safety nets, employment, infrastructure and access to social services. So while adopting the organizing
3.0 Conceptual Framework
3.1 The Sustainable Livelihoods Framework
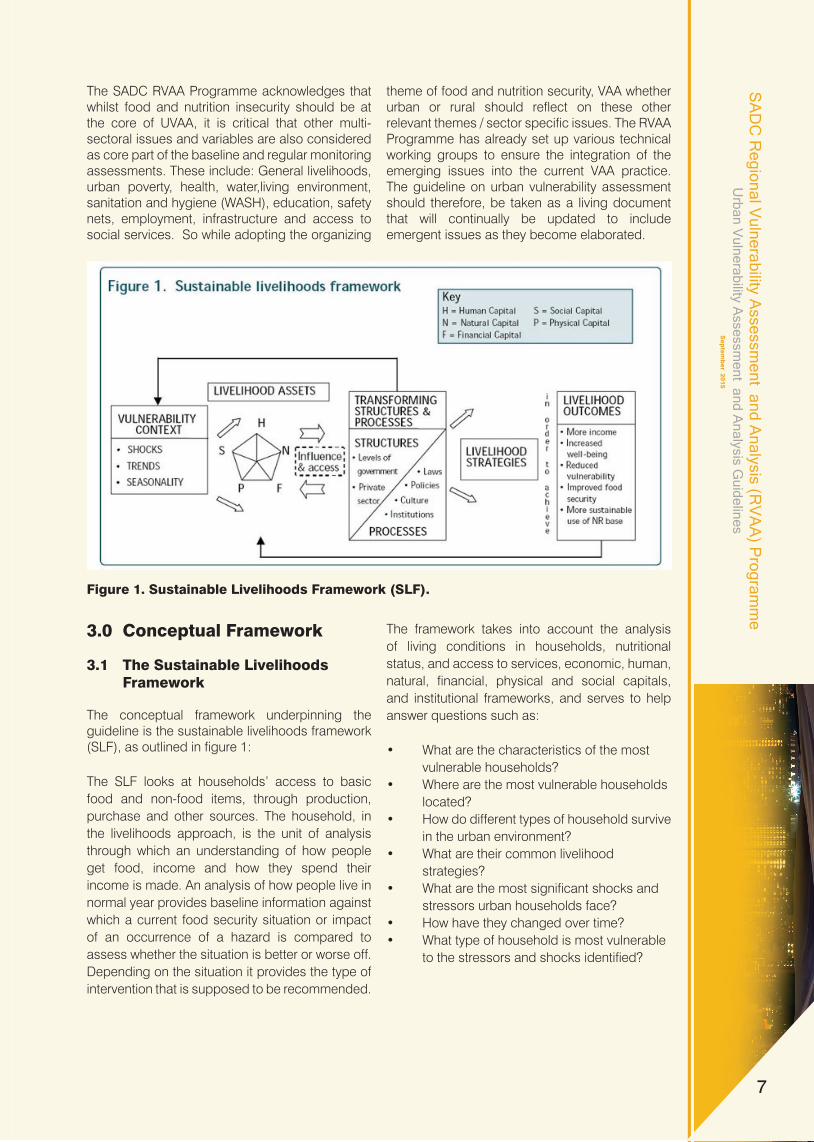
The conceptual framework underpinning the guideline is the sustainable livelihoods framework (SLF), as outlined in figure 1:
The SLF looks at households’ access to basic food and non-food items, through production, purchase and other sources. The household, in the livelihoods approach, is the unit of analysis through which an understanding of how people get food, income and how they spend their income is made. An analysis of how people live in normal year provides baseline information against which a current food security situation or impact of an occurrence of a hazard is compared to assess whether the situation is better or worse off. Depending on the situation it provides the type of intervention that is supposed to be recommended.
theme of food and nutrition security, VAA whether urban or rural should reflect on these other relevant themes / sector specific issues. The RVAA Programme has already set up various technical working groups to ensure the integration of the emerging issues into the current VAA practice. The guideline on urban vulnerability assessment should therefore, be taken as a living document that will continually be updated to include emergent issues as they become elaborated.
Figure 1. Sustainable Livelihoods Framework (SLF).
The framework takes into account the analysis of living conditions in households, nutritional status, and access to services, economic, human, natural, financial, physical and social capitals, and institutional frameworks, and serves to help answer questions such as:
• What are the characteristics of the most vulnerable households? • Where are the most vulnerable households located? • How do different types of household survive in the urban environment? • What are their common livelihood strategies? • What are the most significant shocks and stressors urban households face? • How have they changed over time? • What type of household is most vulnerable to the stressors and shocks identified?
8
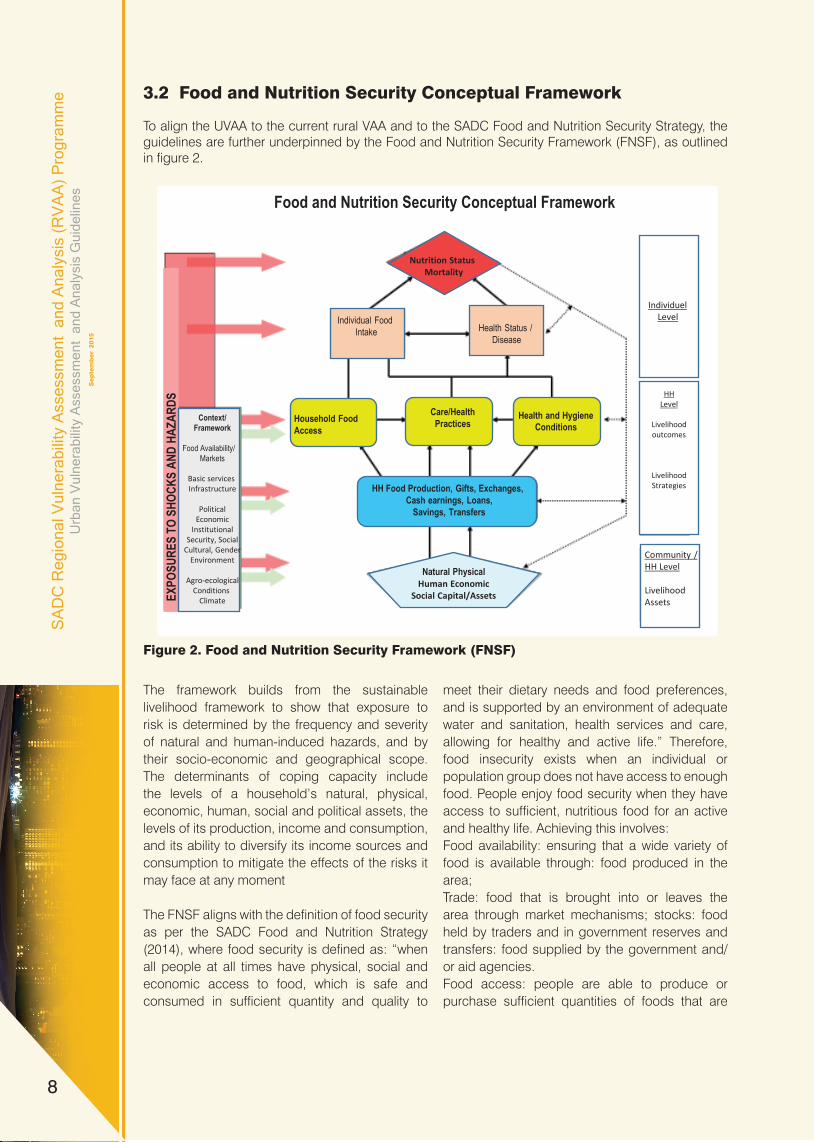
The framework builds from the sustainable livelihood framework to show that exposure to risk is determined by the frequency and severity of natural and human-induced hazards, and by their socio-economic and geographical scope. The determinants of coping capacity include the levels of a household’s natural, physical, economic, human, social and political assets, the levels of its production, income and consumption, and its ability to diversify its income sources and consumption to mitigate the effects of the risks it may face at any moment
The FNSF aligns with the definition of food security as per the SADC Food and Nutrition Strategy (2014), where food security is defined as: “when all people at all times have physical, social and economic access to food, which is safe and consumed in sufficient quantity and quality to
3.2 Food and Nutrition Security Conceptual Framework
To align the UVAA to the current rural VAA and to the SADC Food and Nutrition Security Strategy, the guidelines are further underpinned by the Food and Nutrition Security Framework (FNSF), as outlined in figure 2.
meet their dietary needs and food preferences, and is supported by an environment of adequate water and sanitation, health services and care, allowing for healthy and active life.” Therefore, food insecurity exists when an individual or population group does not have access to enough food. People enjoy food security when they have access to sufficient, nutritious food for an active and healthy life. Achieving this involves:Food availability: ensuring that a wide variety of food is available through: food produced in the area;Trade: food that is brought into or leaves the area through market mechanisms; stocks: food held by traders and in government reserves and transfers: food supplied by the government and/or aid agencies.Food access: people are able to produce or purchase sufficient quantities of foods that are
Figure 2. Food and Nutrition Security Framework (FNSF)
Food and Nutrition Security Conceptual Framework
Nutrition Status Mortality
Individual FoodIntake Health Status /
Disease
Household FoodAccess
Care/HealthPractices
Health and Hygiene Conditions
HH Food Production, Gifts, Exchanges, Cash earnings, Loans,
Savings, Transfers
Natural PhysicalHuman Economic
Social Capital/AssetsEXPO
SURE
S TO
SHO
CKS
AND
HAZA
RDS
Context/Framework
Food Availability/Markets
Basic services Infrastructure
PoliticalEconomic
InstitutionalSecurity, Social
Cultural, GenderEnvironment
Agro-ecologicalConditions
Climate
IndividuelLevel
HH Level
Livelihood outcomes
Livelihood Strategies
Community /HH Level
Livelihood Assets

9
nutritionally adequate and culturally acceptable, at all times through one or a combination of own home production and stocks, purchases, barter, gifts, borrowing and food aid.
Food utilization refers to households’ use of the food to which they have access, and individuals’ ability to absorb and metabolize the nutrients – the conversion efficiency of the body. Food utilization includes: the ways in which food is stored, processed and prepared, including the water and cooking fuel used, and hygiene conditions; feeding practices, particularly for individuals with special nutrition needs, such as babies, young children, the elderly, sick people, and pregnant or lactating women; the sharing of food within the household, and the extent to which this corresponds to individuals’ nutrition needs - growth, pregnancy, lactation, etc. and the health status of each member of the household.
While it is essential to ensure food availability at national level, other underlying factors can limit household access to food particularly in an urban context, which include income levels or access to markets to enable the purchase of food, limited employment opportunities and safety nets provided by the government. The availability of food at national and household level does not guarantee food security as socio-economic relations mediate its allocation. Food security is also determined by how the households utilise
the food. By focusing on how food availability, accessibility and utilisation is secured, as well as the stability of the three, it is possible to understand how worsening livelihoods have impacted on food security in urban areas.
4. Current Assessment and Methodological Approaches
The SLF and FNSF frameworks are both generic in nature and need to be further specified into the various forms of assessments considered relevant for urban assessments in the region. Several approaches have been used to conduct vulnerability assessments in urban areas and the major ones include Household Economy Approach (HEA), Individual Household Method (IHM), Emergency Food Security Assessments (EFSA) and use of secondary data and analysis. Given the complexity and dynamics of urban populations and settings it has been concluded that no particular approach on its own is able to comprehensively address the diversity of urban contexts as well as the food security and vulnerability conditions. Countries that have undertaken successful urban assessment exercises have used a combination of approaches and methods. The different approaches suggested in this guideline need to be tested and validated during field work and adapted to suit particular country situations. A brief summary on the strength and weakness of each are given in Table 1 below.
10
ways in which food is stored, processed and prepared, including the water and cooking fuel used, and hygiene conditions; feeding practices, particularly for individuals with special nutrition needs, such as babies, young children, the elderly, sick people, and pregnant or lactating women; the sharing of food within the household, and the extent to which this corresponds to individuals’ nutrition needs -‐ growth, pregnancy, lactation, etc. and the health status of each member of the household.
While it is essential to ensure food availability at national level, other underlying factors can limit household access to food particularly in an urban context, which include income levels or access to markets to enable the purchase of food, limited employment opportunities and safety nets provided by the government. The availability of food at national and household level does not guarantee food security as socio-‐economic relations mediate its allocation. Food security is also determined by how the households utilise the food. By focusing on how food availability, accessibility and utilisation is secured, as well as the stability of the three, it is possible to understand how worsening livelihoods have impacted on food security in urban areas.
4. Current Assessment and Methodological Approaches The SLF and FNSF frameworks are both generic in nature and need to be further specified into the various forms of assessments considered relevant for urban assessments in the region. Several approaches have been used to conduct vulnerability assessments in urban areas and the major ones include Household Economy Approach (HEA), Individual Household Method (IHM), Emergency Food Security Assessments (EFSA) and use of secondary data and analysis. Given the complexity and dynamics of urban populations and settings it has been concluded that no particular approach on its own is able to comprehensively address the diversity of urban contexts as well as the food security and vulnerability conditions. Countries that have undertaken successful urban assessment exercises have used a combination of approaches and methods. The different approaches suggested in this guideline need to be tested and validated during field work and adapted to suit particular country situations. A brief summary on the strength and weakness of each are given in Table 1 below.
Table 1: Strengths and weaknesses of methodological approaches and tools
Approach Strengths Weaknesses and gaps WFP – EFSA/ CFSVA: Approach based on the adapted household food security conceptual framework Technical Guidance Sheet (TGS) on urban food and nutrition security provides specific guidance relative to urban contexts.
Quantitative analysis: TGS addresses issues related to food security Indicators (FCS, income, expenditures, CSI etc.). Sampling methodology: The TGS provides practical indications on how to deal with issues related to sampling Traders’ survey: assess market and traders’ capacity to respond to increased demand of basic goods and relative constraints. Suitable for slow-‐onset emergencies. SWOT analysis and participatory response analysis. Suitable for urban contexts as they allow taking a wide range of response options
Qualitative analysis: TGS lacks practical indications on how to systematically integrate and conduct qualitative analysis in urban contexts. Context analysis: Lack of methodological tools and practical indications to assess urban contexts in specific typologies. Selection of vulnerable areas: Lack of indication (process / criteria indicators) to identify vulnerable areas in a city. Market. Lack of appropriate guidance to integrate market analysis, particularly in sudden-‐onset emergencies. No guidance on how to assess non-‐food markets Response analysis framework – need

10
11
into account and involve stakeholders. Used for both Baseline with wide set of indicators and for regular assessment with limited set of indicators (CARI)
further guidance on the selection of appropriate responses including aspects of no-‐harm, reduction of risks, cost-‐effectiveness.
OXFAM GB HEA approach: food security baselines and monitoring. FAST (Food Security Assessment Tool) tool provides a basic methodological framework to assess food security in different emergency-‐typologies. Response Analysis framework
FAST approach based on food security typologies. Urban typology could be added to the framework. Political economy approach –suitable to assess the complex political environment in urban contexts. Response analysis framework – comprehensive tool that can be adapted to urban contexts. It includes components of risk analysis, do not harm, cost/benefits analysis, institutional analysis in the decision of appropriate response options.
No guidance on how to conduct EFSL (Emergency Food Security and Livelihood) assessments in urban contexts, when HEA is not feasible. FAST does not include urban typology. Lack of field practice: Political economy approach and response analysis framework have not been piloted in urban contexts. Quantitative analysis: No guidance /methods on how to conduct quantitative analysis in urban contexts (both food security and markets).
Household Economy Approach The HEA guide for practitioners dedicates a chapter for adaptation to urban contexts
Provides examples of criteria used in previous urban assessments to monitor food security. It gives a broad introduction to the issues and challenges in urban contexts. Clear indication to shift the enquiry from sources of food and income (rural) to expenditure and income patterns.
Urban individuals and households are very heterogeneous in terms of their livelihoods and vulnerabilities which make livelihood zoning, wealth ranking and market analysis very complex. Urban adaptation leaves practitioners to make adjustments to context. It requires specific training and expertise difficult to be widely applied by agencies HEA analysis is based on tracking income and expenditure changes – this can be more difficult in urban contexts.
ACF Urban Guidelines Identification of Vulnerable People in urban environments These guidelines are specific to urban contexts. The analytical approach is based upon the sustainable livelihoods framework
Urban mapping: the approach is well developed with clear criteria and indicators and a process to map vulnerability areas. Analysis of urban institutions and services: the guide presents qualitative tools to assess formal and informal actors, services, institutional structures and power relations. Context analysis checklist – the guidelines provide checklists and sources to assess the macro-‐economic factors, and the role of public policies, governance, health services and social capital.
Food Security Indicators and analysis – it does not provide any guidance on how to adapt/use quantitative indicators and how to analyse findings Market analysis is limited to a few questions to traders on the impact of high food prices. (The guidelines seem developed for the food crisis context – slow onset crises) Response analysis. There is no guidance on how to conduct response analysis
IFRC Food Security Guidelines Global Food Security
Participatory tools. IFRC guidelines give good examples about how / when to use participatory tools (even if they are not specific to
IFRC has not developed technical guidance on urban food security assessments.

11
Adapted from Pantaleo Creti, 2010: Review of existing approaches, methods and tools used by Humanitarian agencies to measure livelihoods, food insecurity and vulnerability in urban contexts.
11
into account and involve stakeholders. Used for both Baseline with wide set of indicators and for regular assessment with limited set of indicators (CARI)
further guidance on the selection of appropriate responses including aspects of no-‐harm, reduction of risks, cost-‐effectiveness.
OXFAM GB HEA approach: food security baselines and monitoring. FAST (Food Security Assessment Tool) tool provides a basic methodological framework to assess food security in different emergency-‐typologies. Response Analysis framework
FAST approach based on food security typologies. Urban typology could be added to the framework. Political economy approach –suitable to assess the complex political environment in urban contexts. Response analysis framework – comprehensive tool that can be adapted to urban contexts. It includes components of risk analysis, do not harm, cost/benefits analysis, institutional analysis in the decision of appropriate response options.
No guidance on how to conduct EFSL (Emergency Food Security and Livelihood) assessments in urban contexts, when HEA is not feasible. FAST does not include urban typology. Lack of field practice: Political economy approach and response analysis framework have not been piloted in urban contexts. Quantitative analysis: No guidance /methods on how to conduct quantitative analysis in urban contexts (both food security and markets).
Household Economy Approach The HEA guide for practitioners dedicates a chapter for adaptation to urban contexts
Provides examples of criteria used in previous urban assessments to monitor food security. It gives a broad introduction to the issues and challenges in urban contexts. Clear indication to shift the enquiry from sources of food and income (rural) to expenditure and income patterns.
Urban individuals and households are very heterogeneous in terms of their livelihoods and vulnerabilities which make livelihood zoning, wealth ranking and market analysis very complex. Urban adaptation leaves practitioners to make adjustments to context. It requires specific training and expertise difficult to be widely applied by agencies HEA analysis is based on tracking income and expenditure changes – this can be more difficult in urban contexts.
ACF Urban Guidelines Identification of Vulnerable People in urban environments These guidelines are specific to urban contexts. The analytical approach is based upon the sustainable livelihoods framework
Urban mapping: the approach is well developed with clear criteria and indicators and a process to map vulnerability areas. Analysis of urban institutions and services: the guide presents qualitative tools to assess formal and informal actors, services, institutional structures and power relations. Context analysis checklist – the guidelines provide checklists and sources to assess the macro-‐economic factors, and the role of public policies, governance, health services and social capital.
Food Security Indicators and analysis – it does not provide any guidance on how to adapt/use quantitative indicators and how to analyse findings Market analysis is limited to a few questions to traders on the impact of high food prices. (The guidelines seem developed for the food crisis context – slow onset crises) Response analysis. There is no guidance on how to conduct response analysis
IFRC Food Security Guidelines Global Food Security
Participatory tools. IFRC guidelines give good examples about how / when to use participatory tools (even if they are not specific to
IFRC has not developed technical guidance on urban food security assessments.
12
Guidelines (GFSG) – include 2-‐pages on urban food security assessments.
urban contexts) List of responses. GFSG provide a list of possible food security responses to urban households.
Oxfam/IRC Market Mapping & Analysis Emergency Market Mapping and Analysis (EMMA) Pre-‐Crisis Market Mapping & Analysis (PCMMA)
Approach suitable to urban contexts and both sudden and slow onset emergencies. Tools – can be used individually and are: qualitative, simple, easy to interpret It guides the analysis of non-‐food markets – i.e. labour markets It provides criteria and methods to select critical markets Response analysis options – taking into account appropriate responses based on market systems functionalities.
EMMA is suitable for sudden onset emergency – other market tools (PCMMA, MIFIRA, Traders’ Surveys) are more suitable for in depth assessments.
MIFIRA (Market Information and Food Insecurity Response Analysis) CARE Market analysis tools – analyses food markets & provides information on appropriate responses & local food sources.
It links macro, meso and micro level analysis. Response analysis framework – includes appropriateness of responses but also source of food.
Not suitable for sudden onset emergency. Requires high technical expertise – therefore less suitable to be integrated in urban food security assessments. It focuses only on food markets – does not respond to the need to assess other critical market systems in urban contexts.
FAO/ WFP /FEWSNET The Integrated Food Security Phase Classification (IPC)
The IPC tools and procedures are compatible with whatever data collection systems, methodological approaches, and institutional arrangements exist in-‐county, and allow comparison of findings over time and across countries.
Relies on secondary data which, if it is of poor quality, limited scope and/or questionable accuracy limits the accuracy of any analysis that can be done with it. The area outcomes of nutritional status and mortality rates need adaptation for urban areas Given massive heterogeneity in urban areas an overall classification using IPC may be difficult
IHM (Individual Household Method) Developed to overcome the limitations of the Household Economy Approach
Extends the use of income based poverty measures to urban areas, and to a wider range of development activities such as the design of cash transfer programmes, water etc Specialised IHM software for data checking and rapid data analysis has been developed
Still needs further pilot, scaling up and adoption
Adapted from Pantaleo Creti, 2010: Review of existing approaches, methods and tools used by Humanitarian agencies to measure livelihoods, food insecurity and vulnerability in urban contexts.

12
4.1 Rural versus Urban differences
Several NVACs in the SADC Region have developed the technical capacity and skills to carry out rural vulnerability assessments to a high level of quality, and their assessments form the authoritative information on vulnerability in rural areas. However, when entering into urban assessments, it should be noted that many factors make the assessment more complex as follows:
13
4.1 Rural versus Urban differences Several NVACs in the SADC Region have developed the technical capacity and skills to carry out rural vulnerability assessments to a high level of quality, and their assessments form the authoritative information on vulnerability in rural areas. However, when entering into urban assessments, it should be noted that many factors make the assessment more complex as follows: Table 2: Examples of Rural – Urban Differences
Issue
Urban
Rural
Own food production Lower importance in urban areas High importance
Markets More prominent role as household depend on markets
Less prominent role as households produce (part of) own food
Access to basic services High importance, particularly in high density areas
Lower importance
Housing costs May be high and thus restrict access to other basic needs
Low importance
Transport services May be significant part of household expenditure
Existence of infrastructure may be an issue
Water provision May be at high cost – people in unserviced slums areas may pay the highest price for e.g. water
May be more or less free
Insecurity May impact on household ability to earn an income
May be less important
Activities on margins of the law
Prostitution, petty crime, and similar may be more important for vulnerable households
May be less important
Spatial definition May extend to include urban sprawl and peri-‐urban areas that provide specific challenges in terms of the financing of basic services
May require less attention in rural areas
Environmental issues May be critical where population density is high and solid waste and sewerage services are unable to match needs, increasing risk of disease
May be less critical in the short term
Casual labour Without access to land, households may be more dependent on casual labour in e.g. construction which again requires specific skill sets
Households may be less dependent on casual labour as own food production forms part of food income
Institutional framework
A larger number of institutions and service providers have to be taken into account in understanding urban livelihoods; regulatory frameworks may be specific to capitals and larger towns while smaller towns may be governed by a different set of regulatory frameworks.
Fewer institutions and regulatory frameworks involved

13
The overview below displays a few examples of the differences faced when applying rural participatory methods in urban settings.
14
The overview below displays a few examples of the differences faced when applying rural participatory methods in urban settings. Tools
Urban
Rural
Mapping � Boundaries unclear (where does a neighborhood end and another start)
� Big events remembered � Range and complexity of infrastructure:
different roads, schools, municipal buildings, busstops, etc.
� Village boundaries clear � God knowledge of ownership � Some infrastructure (road,
electricity, etc.) � Maybe one school, if it all
Historical profile � Hard to define neighborhood as separate from city: tendency to combine two as one
� Knowledge of recent history of neighborhood
� Little long term knowledge – high turnover of people
� Defined place within which things happen
� Better long term knowledge, with more established families
Institutional analysis � Lots of institutions: school, police, NGOs, welfare institutions, etc
� Wide recognition of agency names but little understanding of the role of most of them
� Little personal contact with most agencies e.g. NGO vehicles driving through
� Fewer institutions known about but a greater depth of understanding of those that are known about
Economic activity analysis � Not possible to generalize about a neighborhood – ‘urban anonymity’
� Commuting reduces local knowledge: People may live in an neighborhood but work elsewhere and vice versa
� Numerous kinds of jobs: probably almost as many as can be thought of within the area
� Wide range of activities, skilled to unskilled, professional to manual etc (however high unemployment)
� Seasonality is an issue for casual workers, who find more manual outside work in the summer
� More choie of jobs with wider range of skills
� Welfare locally available, e,g, local soup kitchens
� Narrower range of activities � Seasonality based on agricultural
calendar � Limited choice of livelihood
activities: less types of work, etc. � More gender-‐based activities in
economic activities
Livelihoods profile � Difficult to generalize � Wider range of livelihood categories as
households livelihoods are more diversified
� Differences more discernible � May have very few categories as
people have similar strategies

14
4.2 Adapting Current Assessment to the Urban Setting 4.2.1 Household Economy Approach
The Household Economy Approach (HEA) was developed in the early 1990s by Save the Children-UK in order to improve the ability to predict short-term changes in access to food. Other agencies, such as the Food Economy Group (FEG), FEWSNET, ACF and Oxfam, have since worked on the development of HEA, making it useful in a wide range of settings. An understanding of livelihoods is at the heart of HEA, leading to its application beyond emergency food needs. The HEA Analytical Framework defines the information that needs to be gathered, specifies the way in which it should be analysed and answers a particular set of questions linked to response. The HEA Analytical Framework does not provide a limitation on how field information is gathered and can be implemented using a number of different field methods, including both household questionnaires and Rapid Rural Appraisal. The HEA framework was designed with focus on rural livelihoods, hence very applicable in conducting vulnerability assessments in rural areas. A challenge is HEA’s overdependence on focus group discussions to capture data. This works for areas with uniform livelihoods or population distribution.
Depending on local conditions, HEA may not adequately capture the diverse and often
multi-fold livelihood dynamics people living in urban settings face. Due to the wide range of employment opportunities (both formal and informal) available in urban settings livelihoods in a household are not unimodal but rather vary by individual, an aspect that a typical HEA approach would not clearly capture. In addition, the rate of in and out migration and the security challenges faced by urban dwellers, especially in high density areas, reduce substantially the amount of shared knowledge about other households’ multiple long term and short term formal and informal strategies, There is need to adapt the framework to make it applicable to urban settings.
Another challenge for the application of HEA in the urban context is the notion that there are areas or zones within a city within which people broadly share the same patterns of livelihood. This simply may not be the case. The challenge in the urban context is the variations in livelihood strategies within an area. In such circumstances, alternatives to area-based targeting will need to be developed. To adapt HEA for urban setting, it has been recommended that the approach use other criteria such as income levels, community assets, and settlement patterns. HEA groups together using local definitions of wealth and quantifies their livelihood assets. This allows one to disaggregate the population and indicate who and how many are vulnerable. Further suggestions on adapting HEA to the urban setting are presented in the following (Table 3).
16
Table 3: Adaptability of HEA to urban contexts Approach Key features Adaptability to urban areas HEA Livelihood zoning and wealth breakdown is a
challenge in urban areas due to heterogeneity of income and expenditure sources among households. The challenge in the urban context is the variations in livelihood strategies within an area.
Use other criteria such as income levels, community assets, and settlement patterns.
Expenditure patterns at comparable levels of income tend to be similar but in an urban setting the level of cash income is the primary determinant of wealth. The total income depends on a number of factors. Key among them is type of income generating activity, number of economically active individuals and number of income sources.
Use income ranges; expenditure patterns; type and number of assets etc.
The problem specification is based on a reference and consumption year which may be less relevant in urban setting.
Use the past twelve months before the assessment unless under special circumstances
The HEA also has limited focus on other important indicators such as health, nutrition, and education amongst others.
HEA should be used alongside other methods and approaches
4.2.2 Individual Household Method1 The Individual Household Method (IHM) is a standardized approach to collecting information on household income, sources of income, household membership, asset holdings, standard of living and other supporting data. The method was developed to overcome the limitations of the Household Economy Approach, which uses a simplified data set (income estimates for wealth groups in an asset based wealth distribution), with the specific objectives of extending the use of income based poverty measures to urban areas, and to a wider range of development activities such as the design of cash transfer programmes, the affordability of water, housing, health and other services and many other applications. In addition, IHM seeks to overcome difficulties in the collection of reliable household income data such as 'self-‐provisioning' and multiple small income sources by using a technique, which aims to systematically minimise known sources of error. Specialised IHM software has been written, designed for data checking and rapid data analysis. IHM was piloted in an urban setting in Windhoek, Namibia, in 2011.2 The pilot was implemented successfully with no major challenges encountered. IHM still has challenges of scalability when applied to large area/scale assessments. Capacity building and access to its software remains a challenge as not many NVACs are familiar with the approach.
1 For more details on the methodology visit Evidence for Development Website -‐ http://www.efd.org/our-‐work/methods/ 2 Seaman et al., 2011, A pilot urban survey and field training in Section 4A, Okahandja Park, Windhoek 14-‐18 March 2011, Namibia Vulnerability Assessment Committee, Evidence for Development, Chancellor College, SADC RVAA Programme.

15
4.2.2 Individual Household Method
The Individual Household Method (IHM) is a standardized approach to collecting information on household income, sources of income, household membership, asset holdings, standard of living and other supporting data. The method was developed to overcome the limitations of the Household Economy Approach, which uses a simplified data set (income estimates for wealth groups in an asset based wealth distribution), with the specific objectives of extending the use of income based poverty measures to urban areas, and to a wider range of development activities such as the design of cash transfer programmes, the affordability of water, housing, health and other services and many other applications.
In addition, IHM seeks to overcome difficulties in the collection of reliable household income data such as ‘self-provisioning’ and multiple small income sources by using a technique, which aims to systematically minimise known sources of error. Specialised IHM software has been written, designed for data checking and rapid data analysis. IHM was piloted in an urban setting in Windhoek, Namibia, in 20112. The pilot was implemented successfully with no major challenges encountered. IHM still has challenges of scalability when applied to large area/scale assessments. Capacity building and access to its software remains a challenge, as not many NVACs are familiar with the approach.
4.2.3 Emergency Food Security Assessments (EFSA)The UN World Food Programme with other partners has developed the Emergency Food Security Assessment (EFSA) methodology, which has been found to be applicable in urban areas and also in non-emergency settings. An EFSA can be designed in such a way as to address urban food security, livelihoods and nutrition assessment focused on urban centres with particular emphasis on analysis on households, neighbourhoods and local shops and markets rather than macroeconomic issues. There are examples of assessments that have followed a purposive sampling approach based on well-defined criteria that enable valid extrapolation of results at town levels relevant for decision-making and programming. This approach can enable the estimation of varying levels of severity for comparison and targeting purposes, and the understanding of processes contributing to food insecurity, through the obtaining of statistically representative data.
1For more details on the methodology visit Evidence for Development Website - http://www.efd.org/our-work/methods/ 2Seaman et al., 2011, A pilot urban survey and field training in Section 4A, Okahandja Park, Windhoek 14-18 March 2011, Namibia Vulnerability Assessment Committee, Evidence for Development, Chancellor College, SADC RVAA Programme.3http://www.wfp.org/content/mvam-mobile-voice-technology-food-security-data-collection
The EFSA uses the food consumption score (FCS) and the coping strategy index (CSI) to assess a household’s food insecurity and severity, amongst other indicators. The CSI captures both consumption and livelihood coping strategies to better understand how households are coping with adverse scenarios and how adverse scenarios are impacting their livelihood. EFSA also collects dietary diversity data and income expenditure data to enhance understanding of a household’s food access constraints and possible limitation. It is important to specify that EFSA is not limited to the household setting but can also be used to analyse livelihood data for an individual through the quantitative nature of the data collected.
The EFSA can also pay particular attention to the relationship between household food insecurity and (i) child malnutrition (chronic and acute), and (ii) access and performance of local markets. A combination of purposive and random sampling is applied. Secondary data and maps enable the identification of neighbourhoods within selected towns. Primary data collection is conducted in randomly selected ‘sub-neighbourhoods’ where multiple sources of information, data collection techniques (interviews, discussions) and tools (questionnaires, checklists) can be used to make sure that the data collected is reliable and reflects the true situation on the ground.
EFSA tool can be undertaken at household and individual level and through recent innovations (through mobiles) is able, albeit in a somewhat reduced format, to be undertaken in difficult to reach areas. Successful use of the mVAM (mobile VAM) tool has been tested in urban settings in Ebola affected areas in Liberia, Sierra Leone and Guinea Bissau, in urban contexts in DRC and in Somalia3.
A market component can be included in the EFSA and a more in-depth trader’s assessment can be undertaken which is compatible with the EFSA quantitative data gathered. Data gathered through these tools will expose livelihood constraints, security concerns as well as market supply and demand factor limitations hereby enabling facilitated intervention modality selection.
EFSA has several weaknesses as follows: • On qualitative analysis: it lacks practical indications on how to systematically integrate and conduct qualitative analysis in urban contexts. • On context analysis: there is a lack of methodological tools and practical indications to assess urban contexts in specific typologies.

16
• On selection of vulnerable areas: Lack of indication (process / criteria indicators) to identify vulnerable areas in a city. • On markets: it lacks appropriate guidance to integrate market analysis, particularly in sudden-onset emergencies. No guidance
4.2.4 Secondary data use and analysis
The use of secondary data and its analysis refers to the use of data gathered by someone else for a different purpose and the re-analysis of existing data. Heaton defines secondary analysis as ‘the use of existing data collected for the purposes of a prior study, in order to pursue a research interest which is distinct from that of the original work’, but suggests that it is most commonly associated with the secondary analysis of quantitative data (1998)4 .
At least five key issues need to be kept in mind when embarking upon such an approach:1. Data availability – know what is available and where to find it;2. Data relevance – data must be relevant to your problem and situation;
on how to assess non-food markets. • On response analysis framework: it needs further guidance on the selection of appropriate responses including aspects of no-harm, reduction of risks, cost- effectiveness.
3. Data accuracy – need to understand accuracy and meaning of the data;4. Data sufficiency – often must supplement secondary data with primary data or judgement to completely address the problem; and5. Ethical use of data – does the use of the data require having consent for the analysis and if so has this been received. It is of fundamental importance that the researchers are ‘ethically aware’ and are able to make decisions that are located in the context of the research.
Since the use of secondary data means that the user did not collect the data, it is imperative that they fully understand the meaning and accuracy of the data before it can be intelligently used. This usually requires knowledge about when,
4Heaton, J. (1998) Secondary analysis of qualitative data, Social Research Update, Issue 22, University of Surrey.3http://www.wfp.org/content/mvam-mobile-
18
� On markets: it lacks appropriate guidance to integrate market analysis, particularly in sudden-‐onset emergencies. No guidance on how to assess non-‐food markets.
� On response analysis framework: it needs further guidance on the selection of appropriate responses including aspects of no-‐harm, reduction of risks, cost-‐effectiveness.
The following are some of the suggestions for adapting EFSA to UVAA: Table 4: Adaptability of EFSA to urban contexts
Approach Key features Adaptability to urban areas EFSA The EFSA can also pay particular attention to the
relationship between household food insecurity and (i) child malnutrition (chronic and acute), and (ii) access and performance of local markets. A combination of purposive and random sampling is applied. Secondary data and maps enable the identification of neighborhoods within selected towns. Primary data collection is conducted in randomly selected ‘sub-‐neighborhoods’ where multiple sources of information, data collection techniques (interviews, discussions) and tools (questionnaires, checklists) can be used to make sure that the data collected is reliable and reflects the true situation on the ground.
An EFSA can be designed in such a way as to address urban food security, livelihoods and nutrition assessment focused on urban centers with particular emphasis on analysis on households, neighborhoods and local shops and markets rather than macroeconomic issues. There are examples of assessments that have followed a purposive samp-‐ling approach based on well-‐defined criteria that enable valid extrapolation of results at town levels relevant for decision-‐making and prog-‐ramming. This approach can enable the estimation of varying levels of severity for comparison and targeting purposes, and the under-‐standing of processes con-‐tributing to food insecurity, over obtaining statistically representative data.
4.2.4 Secondary data use and analysis The use of secondary data and its analysis refers to the use of data gathered by someone else for a different purpose and the re-‐analysis of existing data. Heaton defines secondary analysis as ‘the use of existing data collected for the purposes of a prior study, in order to pursue a research interest which is distinct from that of the original work’, but suggests that it is most commonly associated with the secondary analysis of quantitative data (1998)4. At least five key issues need to be kept in mind when embarking upon such an approach: 1. Data availability – know what is available and where to find it;
4 Heaton, J. (1998) Secondary analysis of qualitative data, Social Research Update, Issue 22, University of Surrey.

17
where and why it was collected and by whom. This requires finding complete documentation of the data or securing details from the source of data. For example, most standard government data providers have extensive documentation on methods and data reliability.
There are at least four different types of secondary data, all of which are likely to be needed for Urban VAA and are relatively easily available at district level. They are: demographic data; official government records; maps; and general knowledge. These are not the only types of secondary data, which may be used, but they give some indication of the range of information available from secondary sources.
Demographic data is data on the size and structure of a population, including the total population, household size, distribution by age and sex, past and future rates of growth, fertility and mortality, migration and population density. This sort of information is frequently required for a variety of different planning purposes at district level. Sometimes the need is for aggregate data for the district as whole, sometimes for data disaggregated on the basis of administrative subdivision or social group, and sometimes for data just for one area or community.
One of the most useful potential sources of information for UVAA is the official records that all government agencies at district level are required to keep and submit periodically to their national counterparts. These records usually take two main forms: reports on activities and problems and statistical returns. This information is primarily intended for national planning and monitoring purposes.
Maps are an important way of presenting data for district planning, especially as a means of conveying information or stimulating discussion at meetings of civil servants, local politicians and/or the general public. Since they portray data in a visual form, they are simpler and clearer than written reports or statistical tables and even people who are not familiar with maps can quickly learn to understand them. They are particularly useful in indicating the degree and form of variation within the district and the relationship between different sectoral activities within a particular geographical area.
Another very valuable source of information for UVAA is the considerable amount of general knowledge about the district, which those involved in planning inevitablyhave, especially if they have
lived or worked in the area for many years. This sort of information is frequently used for planning purposes, but often more or less unconsciously. For example, when a government officer makes an initial proposal for a project which they consider necessary or contributes to a discussion on someone else’s proposal at a planning meeting, it is more than likely that he will be drawing upon his general knowledge of the area.
NOTE The choice of methods ultimately will depend on information need, availability of resources and expertise versus time available. Each NVAC should decide on a particular methodological approach or a combination of the approaches based on its needs but following the Guidelines for harmonisation purposes. 4.3 Integration of Nutrition, Gender, HIV and Health in Urban VAA
NVACs have started integrating nutrition, gender, HIV and health into rural assessments. It is recommended that the same should be applied to all urban assessments. The SADC RVAA Programme has developed the Guidance on Integrating Nutrition, Gender and HIV into VAA, which must be used alongside this guidance document. The former is applicable to all the main assessment approaches discussed in section 4.2.
5. Steps to Undertaking Urban Assessments
5.1 Step 1: Defining Objectives
Setting the objectives is the first step in the urban vulnerability assessment framework. The objectives define the parameters and data to be collected. Define the objectives of the assessment as early as possible in the process to guide selection of tools and methods. Objectives will delineate the focus of the data collection and ensure the team does not waste time collecting irrelevant information, and conversely ensure collection of relevant data that will shed light on the assessment objectives.
• Critical questions to guide the development of objectives may be as follows: • Should the assessment mainly monitor the number of vulnerability people and the nature of their vulnerability? • Is the objective also to identify underlying causes and drivers of vulnerability? • Should the assessment provide recommendations?

18
• If so, is it for policymakers at national/ municipal level?
Other questions that may help define the objectives are:
• Is it a baseline assessment that should provide the background information on a “normal year and situation” for comparison with assessments in years to come? • Or is it an assessment in response to an emergency where impact of increasing food prices in urban areas and impact on food insecure populations should be defined? • Is it a comprehensive assessment of an entire city?
Comprehensive Food Security and Vulnerability Analysis (CFSVA) and Nutrition Assessment Kenya, WFP 2010:
The objective was to analyze the food security, nutritional status and vulnerability of the urban population of Kenya, to provide baseline information to the policy-makers and practitioners, and to identify interventions. For the purpose of this study, high-density, low-income urban areas only were considered. The specific objectives were to:• Characterize food insecurity, vulnerability, and malnutrition patterns in the low-income, high-density of urban household settings. • Identify the main problems and priorities for addressing food insecurity and malnutrition within the low-income, high-density urban households; • Evaluate the on-going response activities and similar interventions, their scale, location, im pacts and gaps; • Establish a hierarchy of key food security problems within urban high-density, low-income households and subsequently develop a response analysis; • Evaluate the dynamics of rural-urban migration in low-income, high-density, urban areas; • Establish a baseline that will inform future urban food insecurity and malnutrition monitoring, analysis and reporting specifically devised for the low-income, high-density, urban house holds.
Bosasso Urban Household Economy Study, A special report by the Famine Early Warning Systems Network (FEWSNET – Somalia), USAID/FEWSNET, 2009.
The primary objectives of the study were the following: • Strengthen FEWSNET’s early warning capability in Somalia by deepening current under standing of the dynamics o food security issues for Bosasso urban populations and of link ages with neighboring rural communities and with the wider Somali context. • Train participants from key partners (which usually participate in FSNAU and FEWSNET seasonal assessments) in basic urban HEA information gathering and analysis. • Identify important monitoring indicators and propose ways monitoring can inform the analy sis of urban vulnerability to shocks. • Analyze and more fully understand urban livelihood trends that are relevant to other countries in the region of interest to FEWSNET (Kenya, Ethiopia, and Djibouti).
• Does it focus on specific zones where vulnerability is expected to be critical? • Is it a regular vulnerability assessment with monitoring of pre-defined indicators? • Is it specific monitoring of e.g price development in anticipation of a crisis? • Does it serve to analyse specific indicators in WASH, nutrition, or other sectors?
After secondary data collection and interviews with urban partners, it can be sensible to review the objectives to ascertain if original objectives remain valid. The objectives can again be pinned out in specific objectives based on the need for data and information, as required. A few examples are presented in the following:

19
PORT-AU-PRINCE URBAN BASELINE, An Assessment of Food and Livelihood Security in Port-au-Prince, USAID 2009
The aim of the present urban livelihoods baseline study was to fill this gap and provide detailed information on income, food sources and expenditure patterns of households in the poorer areas of the city…the current assessment aimed to develop an up-to-date understanding of how the urban poor are living. The expected outputs were: • to generate baseline livelihoods information that can be used to better understand vulnerability in urban areas and to inform early warning systems and future development programs. • to develop a common analytical framework for monitoring food and livelihood security in urban populations.
A number of references provide guidance for analyzing the urban context including the political economy and can be used to help set objectives. The following are some of the examples:
• The Action against Hunger (ACF) urban guidelines5 provide a list of secondary sources (master plans and national policies) from which to gather information related to public policies and urban planning.
• IFRC/ICRC emergency guidelines provide review of participatory tools that can be adopted to capture people’s perceptions on the role and power of institutions and governance. The guidelines are however not specific to urban contexts.
• Oxfam GB Food Security Assessment Tool (FAST) recommends adopting a ‘political economy’ analysis as an approach to assess contexts characterized by complex political situations, conflict and governance crisis. The political approach examines questions such as why certain groups have either more or less access to assets, services and economic opportunities than others.
• The WFP Technical Guideline Sheet6, assists in understanding the status of key institutions in urban contexts. This includes the factors that determine which urban poor households have access to them and why. However, the guide does not indicate the information needs and how to gather and analyze information on policies, institutions and governance in urban contexts.
NOTE: The urban context is characterized by the existence of illegal immigrants and Internally Displaced Persons (IDPs) which often do not want to be identified. Guidelines on how the
status of these people and their livelihoods can be captured using participatory methods that are not discriminatory from the larger population. In an urban setting, the context analysis should also include examination of macro-economic conditions particularly focusing on how regional markets are structured and how they operate and the degree of integration and the CARE MIFIRA provides guidance on the macro scale analysis of major markets within a country and their relation to regional markets.
5.2 Step 2: Engaging with Partners
The VACs have clear mandates and experience of the implementation of rural vulnerability assessment and analysis. As responsible organizations and as informed by their national and local contexts, NVACs and Urban authorities need to take lead on key decisions on the objectives / scope / focus for UVAA. It is also important for UVAA practitioners to recognize and take into account the broad set of institutions, partners and processes that affect the lives of individuals and households in urban settings. Critically these partners must be engaged to refine and preferably narrow down the scope and focus to what is possible and feasible. These partners include municipal, provincial, and national agencies for social services, housing, markets, trade, health, education, water, sanitation, sewerage, environment, policing and security, roads and lighting, etc. Institutions of higher learning and research as well as religious communities may well be engaged in providing services for vulnerable populations, supporting specific urban projects or programmes targeting specific populations and so should also be consulted. Other urban players include key private sector service providers including urban transport and financial services companies. Elsewhere, NGOs, UN-agencies, humanitarian partners in
5ACF, 2011: Identification of vulnerable people in urban environments: Assessment of sustainable livelihoods and urban vulnerabilities6WFP, 2008: Technical Guidance Sheet- Urban Food Security and Nutrition Assessments, 2008

20
emergency assessments, among others may have significant urban remits.
After defining broad and specific objectives, an analysis and planning matrix should be developed. This will outline what information and how much data is required to service planned key analyses and to be able to derive agreed indicators. Subject to the context and needs, the matrix should provide information on alternative best methods for measuring and defining each of the variables and an analysis plan.
Cooperation between agencies and vulnerable communities / groups is critical for successful urban VAA. It is important to share information and facilitate teamwork with these authorities / agencies and map out the role and support that NVACs can provide to the urban context. What is the additional value for national and municipal level decision makers and the vulnerable urban
5.3 Step 3: Defining the type of Assessment
At least three broad different types of assessments are possible as reflected in figure 3. The differences relate to the scope, depth and are ultimately determined by the goals and objectives of the assessment.
Fig 3: Relationship between various types of urban assessments.
populations from engaging in urban VAA? This clarification of roles and mandates will help to focus the scope of the urban VAA onto key areas where data and analysis is lacking.
Urban assessments should logically start with introductory meetings with the most important of these agencies, which in many cases will be housed under a municipality. Explaining the work of the NVAC, its context and its mandate will be critical, by the sharing of examples of the rural assessments and printed information that outlines the NVAC purpose, its institutional set up and methods of work. A workshop is an efficient way of engaging with a number of stakeholders at one time. Moreover, special attention needs to be given to establishing entry points with communities and their representatives through the use of appropriate tools for participatory process approaches.

21
5.3.1 Baseline Assessment
This is quite wide in its scope and would typically cover a large number of variables and indicators and is conducted at normal times and not during a crisis. As an illustration, in HEA, a baseline assessment provides a basic description of how typical households living at different levels of wealth survive; how they obtain food, how they generate income, and how they organize their patterns of expenditure compiled for a defined 12-month period or ‘reference’ year. The preparation of an urban HEA baseline7 involves the following steps:• A review of secondary sources• An urban zoning exercise• Community-level interviews to establish the wealth breakdown• Household representative interviews to establish expenditure and income patterns at household level for different wealth groups• Interviews with selected key informants to generate information on relevant related issues, including the status of the macro- economy, provision of services (water, sanitation, education, health, electricity), the prevalence of HIV/AIDS, etc.• Analysis of field data and compilation of the baseline picture
Similarly, the Comprehensive Food Security and Vulnerability Analysis (CFSVA) provides an in-depth picture of the food security situation and the vulnerability of households by answering questions on the following:
• who are the food-insecure and vulnerable people? • How many are there? Where do they live? • Why are they food-insecure? • And what is the appropriate assistance to reduce their vulnerability and food insecurity?
A Pre-Crisis Market Assessment and Analysis (PCMMA) is a good way to complement these two approaches as it provides a comprehensive understanding of critical markets’ dynamics in a normal situation and how these dynamics are likely to evolve during a crisis.
It is recommended that for the baseline assessment, a combination of multiple approaches and methods should be used in order to capture the width and depth of the complex issues facing the urban poor. The steps recommended below for setting up an assessment and analysis framework
must be applied in this case for a best practice baseline assessment.
5.3.2 Regular/ Seasonal Assessment
The second level assessments could be to service the needs of ongoing monitoring and evaluation of urban vulnerability conditions in a range of urban contexts. The use of secondary data is imperative in this regard.
5.3.3 Rapid/Emergency Assessment
The third type of assessment would be the need to conduct a rapid–response to onset of a sudden shock–type of urban vulnerability assessment. In an emergency, widespread human, material, economic or environmental damage threatens human lives and livelihoods and under such situations some vulnerable groups are usually unable to cope. In this context, assessments are conducted to assess how the problem has affected the ability of households and groups to make ends meet, with a focus on a particular dimension which can be food, nutrition, access to markets, health or broader vulnerability.
In an urban context, an assessment undertaken in a crisis context could be carried out to address several objectives: e.g. estimation of the severity of a particular vulnerability situation, projection of future vulnerability, identification of most vulnerable population groups, most vulnerable services expected to be affected in accessibility or quality under a particular shock and identification of appropriate interventions. If the PCMMA (or other market information) was not included in the baseline assessment, carrying out an EMMA would be a good way to improve the understanding of the impact of the shock on urban households food and nutrition security.
5.4 Step 4: Setting up an Assessment and Analysis Framework
Setting up an assessment and analysis framework is a pre-requisite for any type of assessment. In the case of a baseline it requires a longer process than in other cases. The assessment framework includes steps from meeting partners and creating a task force, brainstorming sectoral and overall key issues, choosing objectives, preparing the analysis plan, the concept note and the terms of reference as well as designing tools. The following are the steps to consider:
7Practitioner’s Guide to HEA Chapter 6 – Adaptations of HEA

22
5.4.1 Set up a Technical Working Group: Assessments always benefit more from all partners’ expertise. This is more relevant when undertaking comprehensive baselines or regular assessments. Engaging with partners ensures access to a wide range of expertise and sectoral secondary information, triangulation and improvement of methods, transparency and more credibility of the exercise (Refer to 5.2 for a fuller discussion on this process). Undertaking a baseline requires a multifaceted team of experts in both qualitative and quantitative methods and above all technical staff able to discuss not only sectoral issues but see the value of interacting with other sectors. Tasks that would benefit from partners engagement include among others the following: i) brainstorm the issues and objectives of the study;
5.4.2 Prepare Concept Note
A concept note is a short, succinct expression of the intended assessment. It provides a brief outline of the proposed research. The concept note should spell out the research problem, outlining the background, methodology and location of the assessment; introduce the principal researcher and other researchers involved in the project, their qualifications, and their previous research experience and publications; and should not contain a detailed literature review and a budget. An example of a framework for a concept note is:
• Research Title - The title should focus the reader’s attention on the essential theme of the proposed research - what are you researching? Have a concise and focused title. Be short, preferrably not more than one line.• Research Problem - A short summary of the
ii) help prepare the terms of reference of the research team; iii) design of sampling strategy; iv) support logistics of the assessment; v) provide enumerators and analysts and peer review the findings.
The other key aspects to preparing a best practice urban assessment exercise include;
a) creation of a dedicated technical working group which will; b) refine objectives and select themes and prepare the analysis plan that includes choice of methods, tools and procedures, including quality control. The Technical working group will also plan the logistics.
research problem. What do you want to find out? What will you know after doing this research? What are the research questions?• Background - A concise review of the main research work and current issues in the specific subject area. What is already known about this specific subject? This is not a literature review; you do not need to do one for a concept note.• Methodology - Outline the proposed methodology. How will you conduct the research? If fieldwork is involved, indicate where it will take place and if there is a special reason why you have chosen this location.• Principal Researcher (and other researchers, if applicable) - Provide name(s) and full contact details. Briefly state qualifications and research experience of all researchers. • Project Timeframe - Proposed project start date and duration of the project.
25
In an urban context, an assessment undertaken in a crisis context could be carried out to address several objectives: e.g. estimation of the severity of a particular vulnerability situation, projection of future vulnerability, identification of most vulnerable population groups, most vulnerable services expected to be affected in accessibility or quality under a particular shock and identification of appropriate interventions. If the PCMMA (or other market information) was not included in the baseline assessment, carrying out an EMMA would be a good way to improve the understanding of the impact of the shock on urban households food and nutrition security.
5.4 Step 4: Setting up an Assessment and Analysis Framework Setting up an assessment and analysis framework is a pre-‐requisite for any type of assessment. In the case of a baseline it requires a longer process than in other cases. The assessment framework includes steps from meeting partners and creating a task force, brainstorming sectoral and overall key issues, choosing objectives, preparing the analysis plan, the concept note and the terms of reference as well as designing tools. The following are the steps to consider:
5.4.1 Set up a Technical Working Group: Assessments always benefit more from all partners’ expertise. This is more relevant when undertaking comprehensive baselines or regular assessments. Engaging with partners ensures access to a wide range of expertise and sectoral secondary information, triangulation and improvement of methods, transparency and more credibility of the exercise (Refer to 5.2 for a fuller discussion on this process). Undertaking a baseline requires a multifaceted team of experts in both qualitative and quantitative methods and above all technical staff able to discuss not only sectoral issues but see the value of interacting with other sectors. Tasks that would benefit from partners engagement include among others the following:
i) brainstorm the issues and objectives of the study; ii) help prepare the terms of reference of the research team; iii) design of sampling strategy; iv) support logistics of the assessment; v) provide enumerators and analysts and peer review the findings.
The other key aspects to preparing a best practice urban assessment exercise include; a) creation of a dedicated technical working group which will; b) refine objectives and select themes and prepare the analysis plan that includes choice of methods, tools and procedures, including quality control. The Technical working group will also plan the logistics. Table 4. Diagrammatic representation of an analysis framework plan is below
Assessment Design and Analysis Framework Plan
Overall Objective of the Assessment/ Study
Specific Objective 1 (See what it said about how to define objectives)
Themes Indicators Variables and Data Required
Availability of Secondary Sources
Reliability of Secondary Data
Primary Data Sources
…..
…..

23
5.4.3 Refine Specific Objectives
• It is important to review and refine the research objective in the exercise of drafting the concept note. What is/are the key objective(s) of the assessment?
• What is it that you plan to accomplish?
One principal objective may be enough, and more than three major objectives would probably be too many. Objectives should be listed in order of importance (primary, secondary). An important aspect that defines the validity of the objectives is the extent at which it incorporates the consensual view or understanding of the partners of what is it that needs to be researched. The choice of objective must be taken seriously as it will define the success of the research and also the ownership of the study. More often a careless definition of objectives has resulted in study conclusions that do not respond to anybody’s information interest, or at best fall short of addressing what really partners would like to know as a main priority; therefore it is recommended that time should be spent in brainstorming the sectoral interest and jointly find common goals for research. There are different good practices in doing this and it can involve the brainstorming of existing short term and long term/ chronic problems and setting up of problem prioritization that could lead to the study research objectives; but also sectors may have done their homework and just share within the committee the sectoral hypothesis for research that would be sanctioned by the wider group. 5.4.4 Define Outputs
The next stage involves identification and defining of the expected outputs from the assessment. These outputs should be clearly linked to the product of the assessment, briefly defined as a process of investigation leading to new insights about a particular urban space. It therefore should be clearly linked to the goal and objectives of the assessment and the initial context analysis. The assessment outputs should be appropriate for the needs of various decision makers – as the final products of the assessment in order to be effectively utilised. This means that the assessment team must truly understand their end users’ needs—their challenges, issues, constraints, and priorities. Again this issue is best
addressed by extending the assessment planning to truly involve all partners.
When defining outputs the guiding questions NVACs should bear in mind that users would like to see some answers to the following questions:• What threshold defines vulnerability in that particular urban area?• Who is vulnerable to the particular shock? • How many people are vulnerable to the shock?• How can the vulnerable be located within the urban setting?• What are the underlying causes of vulnerability and, whenever possible?• What can be done to address their vulnerability? In the short term and in the longer term?• Any additional question that may be of interest to key partners
5.4.5 Define Indicators/thresholds The SADC RVAC has been working towards having a common set of food security and vulnerability indicators since the genesis of vulnerability assessments in the region. The SADC RVAC urban vulnerability technical working group has developed a preliminary list of indicators under four themes
Theme 1: Food access, availability and markets;Theme 2: Livelihood zoning and risk mapping;Theme 3: Socio-economic data; andTheme 4: Health and nutrition.
At the 2013 urban vulnerability assessment workshop, the indicators/thresholds were further discussed culminating in an agreement that the core indicators/thresholds should be organised in two ways:
a) Using the pillars of food security, namely availability; access and markets; utilization (including nutrition, HIV and AIDS, WASH) and stability (socio-economic indicators and the context analysis) and;
b) Taking into consideration the need to understand the broad sustainable livelihood realm, including all contextual factors that contribute to vulnerability in urban areas.
As a guiding principle, indicators/thresholds should be linked to the goal and identified objective of the assessments and include the agreed core or non-negotiable indicators/thresholds.

24
Indicators/thresholds in each country should also take local and national context into account. In most countries data required for populating indicators/thresholds can be obtained from a number of sources including registers, censuses and representative surveys. Key criteria for using a particular source include the level at which it is reported, the frequency of collection and the level of accuracy. Another key factor is whether it is defined as a national or official statistic.
Indicator/thresholds frameworks are used to identify a logical set of core indicators/thresholds and facilitate their interpretation (Sengestam, 2002)8 . Two of the more commonly used indicator frameworks are the Drivers-Pressure-State-
The thematic or issue-based framework groups indicators according to particular themes. This framework is better suited than the DPSIR framework when having a national focus, assessing development progress and linking indicators to policy processes and targets reflected as outcomes. The advantage of the thematic framework is that it receives great support by government departments as they are more easily understood and communicated. Such frameworks should be considered by the NVACs to enable the interpretation of the data accessed through the various mechanisms described in previous sections.
Figure 4: Drivers-Pressure-State-Impact-Response (DPSIR) framework with example indicators
Impact-Response (DPSIR) or Pressure-State-Response (PSR) and Thematic Frameworks. The DPSIR framework provides a structure to try and get a more holistic understanding of the causal linkages between particular indicators/thresholds and the social, economic and environmental situations in an area. This is demonstrated in Figure 4. Drivers describe the driving forces that can cause a particular state reflected as an output or outcome indicator. Pressure indicators describe the human activities that exert pressures on the environment while state indicators describe the “present state” or status quo of factors being reviewed. A response indicator describes the policies and interventions used to address a particular situation.
5.4.6 Defining methods and tools for different variables
The choice of methods and tools for any urban vulnerability assessment would be informed by the objectives of the assessment and the related information requirements and indicators/thresholds as driven by the main goals or objectives of the specific assessment. Each of these types of assessments would have their specific cluster of information requirements and would lead to choices about specific methods and tools as illustrated below:
8Segnestam, L., 2002. Indicators of Environment and Sustainable Development: Theories and Practical Experience. Paper no. 89, Environmental Economics Series, The World Bank Environment Department, Washington D.C., USA.

25
5.4.6.1 Baselines assessments
Baseline urban vulnerability assessment would be comprehensive in its focus and cover a wide range of situational and livelihood informed information. Baseline urban vulnerability assessments need to take account of the basic understanding of what constitutes vulnerability in the urban contexts. Conceptually vulnerability is a function of exposure to risks and shocks, the sensitivity of the population or sub groups of the urban population and their adaptive capacity to the range of shocks and possible changes to the livelihoods, the wider physical/natural environment, local economic and macro-economic contexts and changes.
Urban vulnerability baselines therefore need to generate information and understanding about what shocks and exposure can occur currently and in the future, i.e. the degree to which different parts of the urban fabric and the populations that they support are exposed to different kinds of unique urban-based or located hazards. The second part requires the generation of information on the sensitivity of these areas and their populations to be affected adversely or not by current and or future hazards. And finally, there is need to generate information on what constitutes the adaptive capacity of the system and the populations therein to be able to adjust to shocks and to moderate the damage or consequence of both current and future hazards including the possibility of taking advantages of beneficial changes when they arise (Livelihood Zoning and Hazard Mapping).
The preceding information would then provide the urban profile into which further socio-economic information/indicators the differing key livelihood / income / expenditures / access to social service groups / population cohorts can be situated. These could be based or generated through different methods derived for e.g. focus group discussions with different community-ranked wealth groups or on the basis of household or individual questionnaire surveys. Guidelines for Urban baseline assessments therefore need to be more broadly guided by sustainable livelihoods approaches (Livelihoods Profiling).
While the choice of methods should be informed by a conceptual plan that responds to the objective of the study it is best practice and usually recommended that a combination of both qualitative and quantitative methods be applied. Successful urban baseline assessment exercises
have combined the following:• Well guided desk review• Exploratory rapid assessment• Simultaneous qualitative and quantitative research within the same sample frame• Institutional assessment
5.4.6.1.1 Desk Study:A desk study is an integral part of the baseline exercise and has the purpose of informing or improving the understanding of prevailing vulnerability conditions while also helping identify information or data gaps to be addressed through primary data collection within the thematic area of interest. With the desk study the team will identify and justify information needs, choice of variables and methods of data collection; the study will also provide preliminary indications of prevailing context from which the sampling strategies will be decided; it will provide initial indication of historic trends and map of hazard and their impacts; it will allow for decision about indicators that are used in trend analysis as well as inclusion of new indicators.
5.4.6.1.2 Exploratory Rapid Assessment:The exploratory rapid assessment may or may not be necessary depending on how much information was gathered through the desk review. It is meant to support effort towards deciding on suitable methods and designing a good primary data collection and choice of instruments. In the case of assessment in urban settings some practitioners (Kenya KFSSG, 2010) recommend that exploratory studies be undertaken anyway due to high level of turnover and population mobility. There are situations where exploratory research help safeguard against possible deviations on achievement of baseline study goals. The main tools used in exploratory research are; a) focus group questionnaire; b) expert or institution survey (asking questions to/interview experts and / or institutions representatives), and; c) open ended random interviews at small scale (this will specially be useful when preparing a quantitative questionnaire).
By contrast, the monitoring of urban vulnerability contexts might be able to focus on a much more limited number of key indicators geographically focused on known ‘hot spots’ or pockets of highly vulnerable populations? A separate review and consolidation of existing methods and tools is needed so that it can feed into the guidelines.

26
From this analysis, the guidelines will then advise on the strengths and weaknesses of the different range of methods and tools that can be applied in urban vulnerability assessment contexts.
Sampling and its role in the context of urban vulnerability assessment is important. Therefore, a narrowly focused survey of prices or dietary diversity indicators could not really constitute an urban vulnerability assessment or contribute to an urban vulnerability assessment, unless the evidence is carefully situated in a well-informed sampling design. The latter is dependent on the identification of groups of analysis which are informed by the broad objectives of the assessment but must also be located into the highly diverse (spatial and socio-economic) contexts of relative exposure to urban risks / shocks, the relative sensitivity of different population groups to these shocks and in relation to their relative adaptive capacities.
Therefore it is critically important that there is a good and thorough understanding of the degree to which there is homogeneity within and between urban centers and within and between different livelihood groups in order to allow appropriate levels of disaggregation between different categories of urban settlements and socio-economic groups.
5.4.6.2 Rapid/Emergency assessments
In the case of a rapid onset crisis that was linked to a collapse in access to food and other essential services what methods and tools would be suitable in this context? Possible illustrative tools relevant to a more emergency / humanitarian assistance focused assessment could be the following:• Food Consumption Scores and Dietary Diversity Indicators• Coping Strategy Indexes• Consolidated Approach for Reporting Indicators of Food Security (CARI)• The need to rapidly assess current household expenditures• The need to monitor price rises• The need to monitor food stocks • Availability of food and other essential items and services• Traders capacities to provide theseFor each of these and other relevant methods and
tools guidelines on the application in the urban context should be supplied. This should be a tips and traps guide on what to look out for and the dos and don’ts and the need to adapt the specificities of the tools to the urban context. For example what constitutes a typical basket of food in one urban context may be different from that of another country and quite different from that considered to be appropriate for a rural assessment.
5.4.6.3 Sampling Approach
The stated objectives and goals should direct the choice of what sample approach or combination of approaches should be followed. The rule of thumb says that it is the level of generalizability that will assist the combination or use of a particular approach as well as the size. Always bear in mind that a larger sample size usually translates to a larger budget and more time. It is strongly recommended that the NVACs work very closely with the statistics bureaus, other research institutions and those who may be generating regular poverty data for urban areas in order to harmonize the sampling in such a way that the results or subsequent information can be comparable where possible.
5.4.7 Assess Secondary Information
As indicated earlier, secondary data is data that has been collected, collated and analyzed by other agencies, institution or bodies. The process of secondary data collection and analysis should involve people with different perspectives and competencies. People may undertake the collection of the secondary with limited research training if the information needs, the process and the communication channels are well structured, while data analysis will require more experienced people. The following steps are suggestions about how secondary data collection and analysis may proceed:
1. Collect data at national level (in depth reports available on the web or at country level) and afterwards look for disaggregated data for the population group or affected geographic area.

27
2. Categorize the data collected according to the area of interest such as group, area and sector concerned; capacity, risk, need or response related information, to facilitate the information flow throughout the process.
3. Identify information gaps and “known unknowns” that may guide further data collection.
4. Look for important and relevant quantitative information such as census, humanitarian profile, pre-disaster data sets, health statistics, demographic data, etc. Use snowball effects by using the references generally placed at the end of collected reports and documents to guide to more in depth research.
5. Build your information network by identifying key resources at local, national, and regional level that can support and contribute to the data collection. When searching for secondary data or questioning the quality of a source that you have already collected, seek advice from sector specialists and other experts with local knowledge. For local level information and data, NGOs or local contacts might also have small libraries that provide additional information or local contact that can facilitate information and relevant data.
5.4.8 Defining Team Composition
Under team composition, issues to be considered include partnerships, expertise required and capacity building needs, communication with stakeholders, community mobilization, technological as well as financial requirements and other logistical concerns. A clear distinction should be made between the overarching assessment team and the data collection team.
The composition of the field team should be multi-sectoral (municipalities, government, private sector, UN, NGOs, CSO, and FBO etc.) and reflect the expertise needed for the assessment. Due to the complex and diverse nature of the urban context, the team has to include an overall manager (We recommend this to be the NVAC Chairperson), assessment supervisors, GIS/ Remote Sensing /Weather Specialist, nutritionists, social development (WASH, health, gender) specialist, markets specialists, agriculturalists and analysts. Ideally, the team should be comprised of both men and women.
A preparatory training workshop with the team
members is mandatory at this stage. During the training, the data collection tools may need to be translated and adjusted after the field testing exercise. If and when possible the tools should be present at training after translation. It is desirable that role-play be undertaken using translated tools and testing should possibly just refine them. The assessment coordinators chosen will play an important role of supervising the teams and taking an overview of the data that is collected and the progress of the fieldwork. Furthermore, he or she should encourage team briefings in the evenings to sum up the days’ work.
5.5 Step 5: Data Collection
At this stage, it is also important to consider arrangements around, transportation, accommodation, allowances and security matters. Security is particularly important in an urban context if field work is taking place in urban slums where there may be security problems. In certain urban contexts, the arrival of the team members may be regarded with suspicion and hence the need for notifying local authorities in advance.
Traditional quantitative and qualitative data collection instruments can be applied in urban areas. The ACF technical guide provides insights on how the questionnaire can be used in a baseline assessment in collecting meta data, demographic profiles, socio-economic data, information on access to food and health status.
There are various approaches to data collection depending on the chosen methodology. Key issues to consider include:
• Tools selection and instrument design: questionnaires, guidelines, measurements amongst others;• Equipment: various scales and measuring tools for anthropometric measurements, electronic data collection devices including Smart Phones, GPS, tablets, laptops, mobile technology, printers amongst others; • Logistics: vehicles; identification and public awareness of assessment, logistical support including allowances amongst others; • Human Resources: field supervisors, enumerators, assessment coordinators, logs coordinators, nutritionists, amongst others; • Processing: work plan agreed in advance before field work including details about who is doing what, where, when and how. In terms
28
of processing, the need for appropriate software, equipment amongst others.• Data cleaning: the process of detecting and correcting (or removing) corrupt or inaccurate records from a record set or database. After cleansing, a data set will be consistent with other similar data sets in the system. The inconsistencies detected or removed may have been originally caused by user entry errors, by corruption in transmission or storage, or by different definitions of similar entities in different stores.
5.6 Step 6: Analysis and Data Processing
While the guideline adopts food and nutrition security as its organizing theme, a broad range of multi-sector issues, evidence and variables should inform UVAA analysis. An appropriate multi-sector analysis has to inform the ‘baseline’ and ‘regular monitoring’ assessments.
The sustainable livelihoods and food and nutrition security conceptual frameworks adopted by the guideline must therefore comprehensively inform analyses around the organising theme of food and nutrition security. Section 3.1 and 3.2 guides the questions and minimum analysis.
Moreover, evidence building and analysis plans must be informed by a comprehensive understanding of the current of range policies, sector entry points, programme interventions and their instruments9. They should be informed by the detailed workings of urban contexts and seek to understand how they collectively impact on exposure to hazards, influence livelihood options and ultimately affect the food and nutrition status of communities, household and individuals as one key outcome.
Thirdly, UVAA analyses and the generation of recommendations must be able to inform interpretations of the effectiveness of current policy and instruments, identify mechanisms for their improvement and serve to highlight policy gaps or potentials or additional instruments or areas of intervention.
Data processing is a phase that addresses the collection and storage of data. Data analysis involves the analysis of data once the storage issues have been dealt with. These two phases often demand distinctive set of technical skills.
Data processing involves taking raw data from the operational systems and moving it to data storage systems. Most vulnerability assessments use a database or statistical analysis program such as Microsoft Excel, SPSS, LIAS or Single Zone Spreadsheets for HEA etc that they can format to fit their needs in order to organize their data effectively. The availability of software (SPSS, Stata; ArcView; Open Source) for analysis is important in a rural setting as it is in an urban context. A team of analysts with relevant expertise and report writing need to be sources either among partners or from supporting agencies.
Capacity building for further analysis that goes beyond descriptive statistics but also looks at causal analysis of underlying factors is essential in an urban context. Detailed analysis of specialized sectors such as health and nutrition will require specialized skills.
5.7 Step 7: Report Structure and Format
5.7.1 Defining the Audience
The complexity and detail of the report produced depends on the objectives of the assessment. It is important that the report is produced timely and is in a format that meets the needs of the intended technical and political audience. Policy makers in Municipalities, government departments etc require a different level of detail than programme managers and implementers on the ground. For maximum impact, it is important to consider who is going to receive your report and tailor it to meet their unique needs.
It is important to reflect on the purpose, the use of the data results and more importantly ensuring the information is addressed at meeting the needs that triggered the assessment. The report on the findings should be delivered in a neutral way but that clearly lays out the results in simple text and that describes the statistics using clear graphics (tables, graphs, etc.). Putting the results of the study into perspective by integrating previous survey findings or results that show the impact of the data gathered, this specifically will be useful if using this report for advocacy or policymaking.
Once the draft report is prepared, including results from the secondary data and primary data analysis, the best practice recommends to share with all partners involved in the assessment. The
9I.e. The current socio-economic contexts, the policies, programmes and on-going interventions that impact (positively or negatively) on livelihoods, employment, urban poverty levels, health status, access to infrastructure such as electricity grid / water and sanitation (WASH) and access to social services. The latter needs to include social protection and safety-nets (e.g. child support grants, pensions and public works and others), subsidy policies (e.g. on staples foods / energy / public transport / fuel / housing etc.), education programmes (e.g. school feeding), health sector programmes (e.g. anti- and post-natal care, support to HIV affected), infrastructure and other relevant issues.
29
final report should be the product of a transparent process and final agreements among partners but it should be mainly based on sound analysis and present the numbers as they appear. The report should remain concise and clear and include how the goals and specific objectives were met.
5.7.2 Overall report format
No matter which type of report is produced it is essential that information be presented in a combination of graphics format or tabular representation. Often, trends and patterns are more obvious and recommendations more effective when presented visually.
The report should begin by stating the problem statement and underlying hypothesis, assessment objective, sampling and methodology used. This will help the users to understand what the assessment entailed. Additionally, the report should have a description of the analysis, results and conclusions in adequate detail to meet the needs of the intended users. Finally, the recommendations should be presented next ensuring that they fall within the scope of the assessment objectives and supported by the data collected.
5.7.3 Packaging and Presentation Formats
Knowledge products and knowledge management: Key to this is ensuring that the VAC becomes a more valued partner of the government and other stakeholders by producing useful products that can strengthen the function and effectiveness of officials. The RVAC can facilitate the creation of these products based on the data and indicators secured in the inner spheres of operation by either commissioning such products through allocation of a dedicated fund to specialist researchers or undertake such analysis itself. These products need to be “universally accessible” and regularly available - and thus avoid an overly academic or technical analysis.
Similarly, data collected by VACs should be available to all via a centralized system based on a web portal. All information relating to the data must be available including the methodology, instruments, GIS coordinates to enable VACs to learn, replicate and repeat at various levels. The function of the RVAC would be to “pull this all together” and essentially allow comparisons of
the VACs. These comparisons would be available through the knowledge products in the form of maps, policy briefs, and graphics amongst others with succinct information presented in usable and useful forms.
5.8 Step 8: Dissemination and Reporting
5.8.1 Defining the Strategy for Dissemination
The assessment can be summarized as a process of “data collection with a purpose”, which implies that a very clear strategy should be in place to ensure that the various outputs are aligned with the intended purpose. This is essential if the emerging recommendations are going to direct action. This therefore revisits a key guiding question of the process of what is the purpose of the assessment, who will use the results and in what way?
Effective dissemination of results means that the right people get the right information in a timely manner and in the right format. The overall goal of disseminating results is to encourage others to take action. For example, the format for managers would likely consist of simple one or two pagers – and more technical audiences would receive a format or a final report with technical details in addition to the options discussed in this section. The underlying principles of communicating and disseminating results are:
• Focus on action;• Study audience background, needs, interests, concerns, and plans;• Simplify your message: key points only;• Report in many different ways: written products, personal briefings, meetings, seminars, workshops, and videotape; and • Look for chances to report results.
5.9 Step 9: Monitoring and Evaluation
Monitoring and Evaluation should be a key component of the UVAA process and enshrined within the overall M&E strategy of the NVAC. The evaluation will focus on two aspects, first the achievement of the assessment objectives as set out under Step 1 and secondly an evaluation of the usefulness of results and uptake of recommendations from the assessment by key stakeholders and policy makers. Reviewing achievement of the assessment objectives

30
should generate lessons that should inform future assessments in terms of structure, strategies/methodologies and scope. An evaluation of the uptake of recommendations or use of results by stakeholders will be key in ensuring that there is alignment between the demand for evidence that informs policy and the generation of such evidence through UVAA.
Annexes:
1 Common Terms and Definitions2 Data required for livelihoods assessment baselines3 Urban Vulnerability Mapping4 Sources of Food, Sources of Income, and Patterns of Expenditure5 Hazard Mapping and Response Strategies6 Market Analysis7 Institutional Mapping8 Useful Approaches for Urban Vulnerability Assessments
31
single, sequential, or combined in their origin and effects. They are characterized by their location, intensity, frequency, and probability.
Household - A group of people, each with different abilities and needs, who live together most of the time and contribute to a common economy, and share the food and other income from this.
Impacts - The term impacts is reserved to refer to the significant consequences of an event or initial direct effect at the household level (e.g. crop failure, intervention program, etc). Impacts can be either intended or unintended, and can be positive or negative. For example, if local demand for a specific commodity is not met or not met at reasonable cost, some households in the area may face food deficits. In this case, food deficits are an impact of inadequate or unaffordable food supplies.
Indicators - Are the variables used to measure progress toward specific goals or to gage the progression toward some expected end. They can be quantitative and/or qualitative. Indicators are used to monitor progress during the life of an activity or event, or to measure overall performance for long-term results. For example, significant variation in prices over a season can be an indicator of poor temporal market allocations.
Livelihoods - The means by which households obtain and maintain access to essential resources to ensure their immediate and long-term survival
Livelihood Protection Threshold - The total income required to sustain local livelihoods. This means total expenditure to: (i) ensure basic survival (i.e. all items covered in the survival threshold), (ii) maintain access to basic services e.g. health and education, (iii) sustain livelihoods in the medium to longer term e.g. purchase of seeds or veterinary drugs, and (iv) achieve a minimum locally acceptable standard of living e.g. purchase of basic clothing or coffee/tea.
Livelihood security - Ensured access to sufficient resources to ensure immediate and long term survival for all people at all times.Vulnerability - People are vulnerable if they are expected to be unable to cope with a defined hazard; for example, they are vulnerable to crop failure if such a hazard is likely to reduce their access to food or cash below a defined threshold.
ANNEXES FOR URBAN VULNERABILITY ASSESSMENT
Annex 1: Glossary
Baseline - The quantified analysis of sources of food and income and of expenditure for households in each wealth group over a defined reference period
Coping capacity - The capacity of households to diversify and expand access to various sources of food and income, and thus to cope with a specified hazard
Chronic food insecurity -- A household is chronically food insecure when it consistently fails to meet its minimum energy requirements
Effects - Are the consequences of an event on aspects of people’s lives and their environment (such as production, markets, livestock, employment, etc.) that are expected to have food security implications on households at some point (typically between now and the next agricultural season). Effects can be either direct or indirect. Direct effects are directly linked to the hazard (for example, in a particular district, rainfall of 50 percent below normal results in 20 percent crop failure. The crop failure is a direct effect of the rain failure). Indirect effects are indirectly linked to the hazard (for example, in this particular district, rain failure results in 20 percent crop failure, which increases demand for purchased grains on the local market. The increased demand is an indirect effect of the rain failure.). Effects can be positive or negative – with most hazards there are people who would benefit as well as people who suffer.
Food Security - Secure access by all people at all times to a sufficient quantity and quality of food for an active and healthy life.
Hazard - Is a potentially damaging physical event, phenomenon and/or human activity, which may cause the loss of life or injury, property damage, social and economic disruption or environmental degradation. Hazards can include latent conditions that may represent future threats and can have different origins: natural (geological, hydro-meteorological and biological) and/or induced by human processes (environmental degradation and technological, political, economic or social threats). Hazards can be
32
Normal conditions - Framework, baseline, reference period that describes typical conditions, relationships and dynamics.
Outcomes - Are short-, intermediate-, or longer-term anticipated changes that result from the course of events described in a scenario. They are the ultimate result of the effects and impacts of a given event. Outcomes are measured at the point when all responses (e.g., household coping or “expansion” has taken place, markets have responded, expected changes in governmental and non-governmental programs have occurred). This is a somewhat artificial point in time because, in reality, situations continue to evolve or change. But, here it pertains to the course of events contained within a scenario. Outcomes may be intended or unintended, positive or negative. For example, a negative outcome of a food security emergency, if no action is taken, could be malnutrition among poor urban households in X city, or livelihoods insecurity among poor rural farmers in Y district.
Outcome analysis - An analysis of how access to food and cash for a specific vulnerable will be affected by a defined hazard, and of the extent to which other food or cash sources can be added or expanded, or non-essential expenditure reduced, to make up the initial shortages
Problem Specification - The translation of a hazard such as drought into economic consequences at household level.
Projected Outcome - A quantified estimate of access to food and cash, taking into account the shock and household responses to it, in relation to a survival and livelihoods protection threshold.
Reference Period - A defined period (typically 12 months) to which the baseline information refers, needed in order to analyse how changes in the future (in production, for example) can be defined in relation to the baseline
Response - Is any action taken before, during, or after a food security threat is identified that is taken with the intention to prevent or mitigate food insecurity or vulnerability to food insecurity and to avoid loss of life or livelihoods. Reponses can come from local governments, communities and civil society, the private sector, non-governmental organizations, multilateral organizations, and other regional and international sources.
Scenario - Is a description of a possible course of events which is formed by reasonable assumptions that are based on existing conditions, past experiences or projections. Scenarios are used to estimate the potential impacts of key conditions on populations (for example, a river floods, covering a nearby town and wiping out the local population’s crop).
Scenario Analysis - A quantified estimate of access to food and cash arising from an outcome analysis, taking into account the effects of the hazard and household responses to it, for each of the wealth groups
Shock - As applied to food security analysis, a shock is an unexpected event that has an impact on the food security of a particular (affected) population group. For example, a failed harvest or rising food prices are examples of shocks that can negatively impact the food security of certain population groups.
Survival threshold - The total food and cash income required to cover the food and non-food items necessary for survival in the short term. It includes (i) 100% of minimum food energy needs; (ii) the costs associated with food preparation and consumption; and (iii) where applicable, the cost of water for human consumption
Triggers - Identify circumstances or events that are likely to indicate changes in a situation, or set in motion some course of events. For example, reduced or erratic rainfall could be triggers for drought; low-level inter-communal violence may be a trigger for conflict; sustained storms may be a trigger for flooding; flooding that causes crop losses may be a trigger for a response, etc.
Vulnerability Assessment and Analysis (VAA) - Is the process of developing an understanding of a problem (household vulnerability) through data collection from primary and secondary sources (including field work), as well as quantitative and qualitative analysis of the data collected. The results of this process form the basis of understanding vulnerability to food insecurity and should play a role in the development of a plan of action.

33
40
ANNEX 2: List of possible sources for secondary data for urban assessments URBAN VULNERABILITY MAPPING/ZONING
Type of Information
What you really need Possible sources
Satellite images Administrative boundaries Physical geography – topography rivers, Maps showing: � Areas prone to flooding � Gradient � Pollution � Population density Infrastructure – road/railway Services (electricity, piped water)
Government Planning Dept. Google Earth SADC RVAA PMU Ministry of Transport Utilities companies
Demographic
Maps of enumeration areas Administrative units for urban area Population density HH composition Dependency ratio/crowding index;
National census/statistical office/Household surveys
Housing Settlement type -‐ planned housing/informal; Housing quality -‐ material used/building standards; Rent levels; Distance to main places of employment
National census/ statistical office; UNHABITAT Rapid City Profiles; Housing Corporations; Government plans (national/municipal); Ministry of planning and Economic Development ; Housing surveys; NGOs (Slum/shack dwellers international); Ministry of urban planning department; Building codes; estate agents’ reports
Access to services
Road systems -‐ paved/ track, passable throughout the year;
National government plans (municipal/district level); Housing
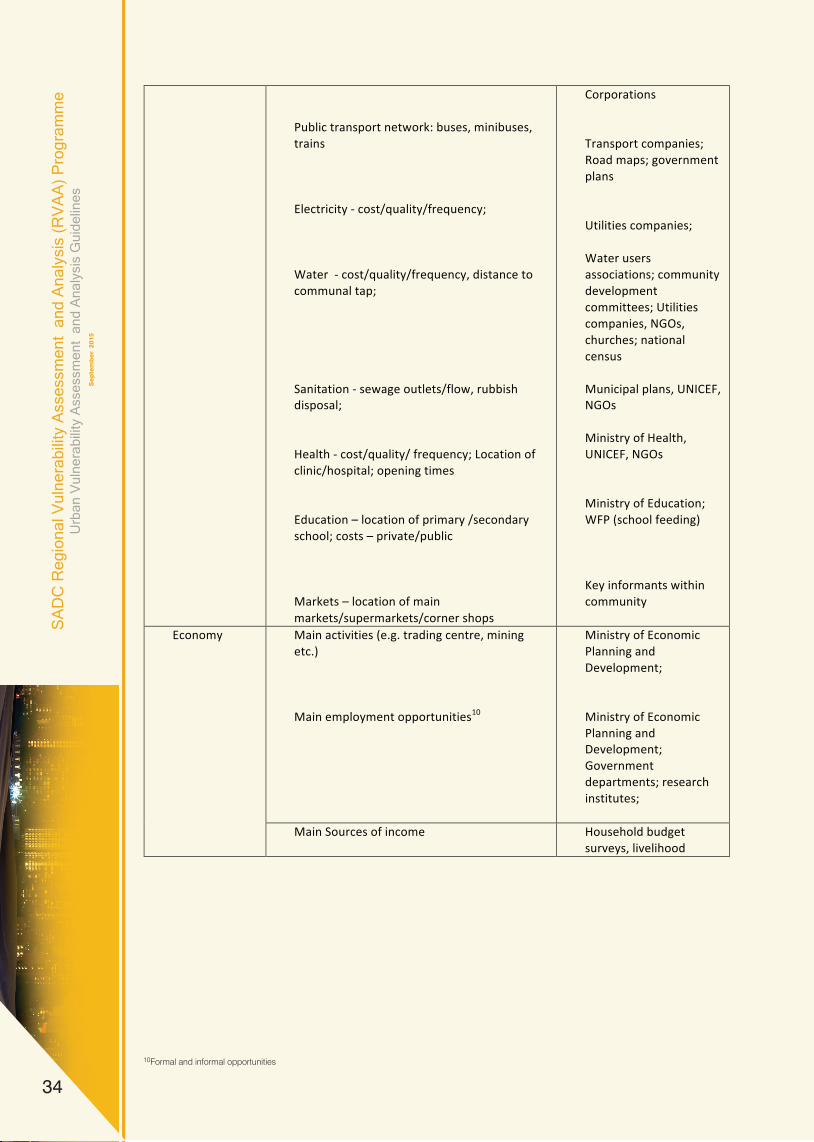
34
10Formal and informal opportunities
41
Public transport network: buses, minibuses, trains Electricity -‐ cost/quality/frequency; Water -‐ cost/quality/frequency, distance to communal tap; Sanitation -‐ sewage outlets/flow, rubbish disposal; Health -‐ cost/quality/ frequency; Location of clinic/hospital; opening times Education – location of primary /secondary school; costs – private/public Markets – location of main markets/supermarkets/corner shops
Corporations Transport companies; Road maps; government plans Utilities companies; Water users associations; community development committees; Utilities companies, NGOs, churches; national census Municipal plans, UNICEF, NGOs Ministry of Health, UNICEF, NGOs Ministry of Education; WFP (school feeding) Key informants within community
Economy
Main activities (e.g. trading centre, mining etc.) Main employment opportunities10
Ministry of Economic Planning and Development; Ministry of Economic Planning and Development; Government departments; research institutes;
Main Sources of income
Household budget surveys, livelihood
10 Formal and informal opportunities

35
42
Relative Importance of different household livelihood strategies
surveys, government surveys, HEA reports,
CONTEXT POLICY National government commitments to urban
planning and regeneration PRSPs, National Strategic Development Plan
Social Protection Policies
Type of social protection transfers in place (pension/child benefit etc.); Eligibility; # of recipients;
Ministry of Social Welfare
Economic Policy
Inflation rates (5-‐10 years); Food price trends; Foreign exchange rate; Level of government subsidies on essential items e.g. cooking fuel, transport
Ministry of Economic Development
Urban planning
Land rights; Settlement Upgrading Programmes Plans for urban expansion /regeneration;
National Strategic Development Plan; Construction companies UNHABITAT Rapid City Profiles Ministry of Land, Housing and Urban Development; World Bank, DFID, ADB
Street vendors regulations, tax
ECONOMY Prices Trends in cereal prices (world /domestic) since
2004 Trends in fuel prices (world and domestic) since 2004 Inflation CPI
Ministry of Planning and Economic Development; Ministry of Finance; City council
Market price information
Trends in staple food prices over past 5-‐10 years;
Food security surveys; national census/ statistical office; NGOs

36
11There is little consistency over definition of ‘urban’ so in order to work out the % of population that is urban, VAC teams will need to define urban - a settlement of over 10 000 or 20 000 – and make calculation from wider statistics 12If possible including spatial and socio-economic disparities in morbidity
43
Cooking fuel prices wage rates (past 5 – 10 years)
market price monitoring ;
Employment Employment figures by sector; unemployment figures Sources of income Livelihood activities – seasonal changes Informal economy: � Street vendors: regulations, tax
Household budget surveys; Ministry of Economic Planning; government departments, household budget surveys;
Trade links Main trade links flows of goods – staples and other significant commodities
Ministry of Finance -‐ import/export figures; quotas
SOCIAL Demography Age/sex ratios
Urban population as % of total11 Migration: rural-‐urban trends; Out migration; Refugees/IDPs
Population census Household livelihoods surveys, Afrobarometer, UNHCR, government
Health Trends in morbidity12 HIV prevalence
Ministry of Health, UNAIDS, NGOs; National Aids Commission;
Nutrition Changes in patterns of acute malnutrition related to specific events (e.g. market shocks)
Ministry of Health, UNICEF, NGOs
Community cohesion
Presence of gated communities Type of leadership -‐ customary/religious;unions; political parties Ethnic/religious composition
Local government reports (social services); NGOs National census; local government reports; Local government; UNHCR
11 There is little consistency over definition of ‘urban’ so in order to work out the % of population that is urban, VAC teams will need to define urban -‐ a settlement of over 10 000 or 20 000 – and make calculation from wider statistics 12 If possible including spatial and socio-‐economic disparities in morbidity

37
ANNEX 3: PRELIMINARY MAPPING OF URBAN VULNERABILITY
Aim: To conduct a preliminary mapping of urban vulnerability. This exercise can be conducted with different groups of key informants, which can then be brought together into one map.
Who is involved: Vulnerability assessment team/ Local authorities, CBOs and key informants who know the city/town well.
Expected Outputs:• Preliminary vulnerability map of the city/ town with accompanying table indicating main characteristics of different zones, name of neighbourhood in the zone.
• Table showing urban population broken down between main administrative units within the urban area
Time required: ½ day
Resources: Maps of the city/town showing:• Population: density, refugees/IDPs, • Housing: land tenure (formal/informal), rent, planned future developments• Infrastructure: roads, rail, public transport, markets, recreational spaces/parks• Services: health, water, sanitation, electricity
Government documents - National population and Housing census, urban planning documents, UN reports – UNHABITAT, UNICEF, WHO, FAO, WFP, UNDP
NGO project reports – FEWSNET
NB: Some of the information listed above will not be available and certain information will not be available at the scale needed. It is useful to re confirm accuracy of secondary data with government representatives and key informants.
Tracing paperColoured pens/pencilsBlu tack
What to do:
Step 1: Categorise neighbourhoods by wealth (better off, middle, poor)
Step 2: Identify the main sources of employment - both formal and informal (e.g. markets and shopping areas, industrial zones, agricultural zones, harbour, peri-urban area)
Step 3: List main vulnerabilities according to locally defined criteria (e.g. overcrowding, poor access to health services, poor sanitary environment)
Step 4: Identify most vulnerable areas according to criteria defined in step 3.
Step 5: Basic description of each zone’s characteristics (see table below)
Questions to have in mind during the vulnerability mapping exercise:• Are all households part of the urban economy?• Are some households mainly dependent on land and livestock in peri urban areas? • Is the city/town one livelihood zone or more than one? • Can the city/town be divided into discrete neighbourhoods with different characteristics? • Are there particularly poor or well off areas that can be considered separately?
44
Refugees/IDPs – numbers and location Networks – community/family, urban-‐rural linkages; Crime/violence levels
Social services, NGOs, UN agencies; church Municipal police services*
Institutions List of urban institutions working on vulnerability reduction in city/town
Ministry of Social welfare; NGOs, etc.
NB: Some of the information listed above will not be available and certain information will not be available at the scale needed. It is useful to re confirm accuracy of secondary data with government representatives and key informants.

38
13See ACF 2010 Identification of Vulnerable People in Urban environments
46
Step 5: Basic description of each zone’s characteristics (see table below) Questions to have in mind during the vulnerability mapping exercise: � Are all households part of the urban economy? � Are some households mainly dependent on land and livestock in peri urban areas? � Is the city/town one livelihood zone or more than one? � Can the city/town be divided into discrete neighbourhoods with different characteristics? � Are there particularly poor or well off areas that can be considered separately? Example of table describing zones from vulnerability mapping13 Vulnerability Level
Type of neighbourhood
Characteristics Neighbourhood(s)
EA #/name
e.g. Very high
Inner city informal settlement
Minimal/non-‐existent services Few/no job prospects High transport cost (time/cash) to places of work High density, low quality housing Mainly tenants sharing houses High levels of pollution
High
Average
Low
Very low
13 See ACF 2010 Identification of Vulnerable People in Urban environments

39
ANNEX 4: HEA LIVELIHOOD PROFILING: SOURCES OF FOOD, SOURCES OF INCOME AND PATTERNS OF EXPENDITURE
Expected Outputs
• Table/bar chart indicating main sources of
food and description of seasonal variation
• Table/bar chart indicating main sources of
income and description of seasonal variation
• Table quantifying income levels earned from
different sources
• Bar chart indicating typical expenditure
patterns
• Calculation of minimum expenditure baskets
(survival and livelihood protection) for typical
household [TO VERIFY HH COMPOSTION
and SIZE]
• Analysis of rural –urban linkages
SOURCES OF FOOD
Aim: To find out main sources food for different wealth groups and to understand seasonal variations in access to food. To find out the extent to which households are able to benefit from linkages with family in rural areas.
Who is involved? Representatives of wealth groups as identified during wealth breakdown exercise. At least half should be women or have a separate group of women.
What to do: 1. Ask participants what the main sources of staple food (cereals, pulses etc.) were over last 12 months. Make sure they have included all staple food brought into the home by women and children.
2. Checklist: purchase14, gifts, exchange, credit etc.
3. Ask participants to divide up 100 beans, representing all staple food consumed within the household within last 12 months. What proportion comes from each source described?
Quantifying purchased food15 Find out what the main staples are that are purchased. Ask participants for the quantity purchased. At what price? Find out as much as possible about the changes in the prices and how this impacts upon households.
14Includes street food and food purchased to cook at home15This can be used to triangulate food expenditure information - see below.
47
ANNEX 4: HEA LIVELIHOOD PROFILING: SOURCES OF FOOD, SOURCES OF INCOME AND PATTERNS OF EXPENDITURE Expected Outputs § Table/bar chart indicating main sources of food and description of seasonal variation § Table/bar chart indicating main sources of income and description of seasonal variation § Table quantifying income levels earned from different sources § Bar chart indicating typical expenditure patterns § Calculation of minimum expenditure baskets (survival and livelihood protection) for typical
household [TO VERIFY HH COMPOSTION and SIZE] § Analysis of rural –urban linkages SOURCES OF FOOD Aim: To find out main sources food for different wealth groups and to understand seasonal variations in access to food. To find out the extent to which households are able to benefit from linkages with family in rural areas. Who is involved? Representatives of wealth groups as identified during wealth breakdown exercise. At least half should be women or have a separate group of women. What to do: 1. Ask participants what the main sources of staple food (cereals, pulses etc.) were over last 12
months. Make sure they have included all staple food brought into the home by women and children.
2. Checklist: purchase14, gifts, exchange, credit etc. 3. Ask participants to divide up 100 beans, representing all staple food consumed within the
household within last 12 months. What proportion comes from each source described? Example Table to describe food sources and seasonal changes Food source (describe) % Additional comments Seasonal change e.g. market purchase
85
Includes street food. Estimates that half of food purchased is from street vendors
Prices fluctuate throughout the year
e.g. gifts from family in rural areas
10
Family in rural areas bring maize once/year
Once/year
e.g. exchange for working
5
TOTAL 100
14 Includes street food and food purchased to cook at home

40
SOURCES OF INCOME
Aim: To find out main typical sources of income and quantify income levels for different wealth groups and to understand seasonal variations in access to income.
Who is involved? Representatives of wealth groups as identified during wealth breakdown exercise. At least half should be women, or have a separate group with women only.
What to do: 1. Brainstorm what the main sources of income were over the last 12 months.
2. Ask participants to describe them. Check that income from women (and children) and extended family members who may be living in the ‘household’ have been included.
3. Ask the group to divide up 100 beans to represent all the different sources of income brought into the household.
4. Using proportional piling, find out what
proportion of total income is derived from different sources.
NB: There are likely to be many different sources of income for one household, which may be relevant for different members at different times of year. In order to capture all the possible sources, and to quantify the income gained from each source throughout the year, it is important to address each one in turn, taking sufficient time to ensure nothing is forgotten. You will need to keep reminding participants that you are looking to find out about a ‘typical’ household.
Checklist of common income sources in urban areas:• Labour exchange• Salaried employment • Remittances• Self-employment (this includes things like handicrafts, brewing, charcoal making);• Small business & petty trade (street vendors, market stall holders, taxi drivers, taxi conductors)• Sale of own production (e.g. vegetables)• Gifts (rural –urban linkages)• Credit
Table to describe income sources and seasonal changes
48
Quantifying purchased food15 Find out what the main staples are that are purchased. Ask participants for the quantity purchased. At what price? Find out as much as possible about the changes in the prices and how this impacts upon households. Staple Quantity Cost Additional notes e.g. maize
1kg/day/household of 6
1 kg = 50 MK x 30 days = 1500 MK/month (low season = 8 months) 1kg x 60 Mk x 30 days = 1800 MK/month (high/lean season = 4 months)
e.g. impact of price change on hh.
SOURCES OF INCOME Aim: To find out main typical sources of income and quantify income levels for different wealth groups and to understand seasonal variations in access to income. Who is involved? Representatives of wealth groups as identified during wealth breakdown exercise. At least half should be women, or have a separate group with women only. What to do: 1. Brainstorm what the main sources of income were over the last 12 months. 2. Ask participants to describe them. Check that income from women (and children) and extended
family members who may be living in the ‘household’ have been included. 3. Ask the group to divide up 100 beans to represent all the different sources of income brought into
the household. 4. Using proportional piling, find out what proportion of total income is derived from different
sources. NB: There are likely to be many different sources of income for one household, which may be relevant for different members at different times of year. In order to capture all the possible sources, and to quantify the income gained from each source throughout the year, it is important to address each one in turn, taking sufficient time to ensure nothing is forgotten. You will need to keep reminding participants that you are looking to find out about a ‘typical’ household.
15 This can be used to triangulate food expenditure information -‐ see below.
49
Checklist of common income sources in urban areas: • Labour exchange • Salaried employment • Remittances • Self-‐employment (this includes things like handicrafts, brewing, charcoal making); • Small business & petty trade (street vendors, market stall holders, taxi drivers, taxi conductors) • Sale of own production (e.g. vegetables) • Gifts (rural –urban linkages) • Credit Table to describe income sources and seasonal changes Income source (describe) % Additional comments Seasonal change e.g. petty trade
25 Buys tomatoes in bulk from supermarket and sells at road side
Highest profits gained during dry season
e.g. street food vendor
30 Buy ingredients from the market and cooks on the side of the road outside offices
Quiet periods during holidays (December and August)
e.g. domestic worker
5 Works part time as cleaner across other side of town
No
e.g. casual labour
40 Two hh members work as labourers on construction sites
Only in dry season (approx. 10 days per month for 9 months)
TOTAL
100
Quantifying income When proportional piling exercise has been complete, ask participants to quantify the main income sources for the whole year. It is important to make sure the number of people engaged in an activity, and prices/wages obtained for each activity are included. It may be easier to calculate this on a daily or weekly basis and then find out how many days/week or weeks/month income is earned from that source. Table used for income calculation Main source of income
Calculation of typical amount of income earned
Total
e.g. casual labour -‐ construction
e.g. 10 days per month for 9 months paid 500 MK/day = 10 x 9 = 90 days x 500 MK
4500 MK

41
Quantifying income
When proportional piling exercise has been complete, ask participants to quantify the main income sources for the whole year. It is important to make sure the number of people engaged in an activity, and prices/wages obtained for each
Questions to keep in mind:• What are the main sources of income? • What proportion of total income is derived from each source?• Can I quantify the levels of income from each source?• How do income generating opportunities change throughout the year? • Is there a time of year which is more difficult than the rest? If yes, explore the perceived reasons for this.• Has all income from all household members been included?
EXPENDITURE
Aim: To find out typical patterns of expenditure and to understand seasonal variations
Who is involved? Representatives of wealth groups as identified during wealth breakdown exercise. It may be necessary to have separate groups with men and women.
What to do: 1. Brainstorm with participants to find out the main items that households spend money on. Divide expenditure into weekly and monthly, and annual. Be sure to include expenditure on one-off events such as weddings, funerals or other
activity are included. It may be easier to calculate this on a daily or weekly basis and then find out how many days/week or weeks/month income is earned from that source.
Table used for income calculation
cultural events. Refer to the checklist below to prompt participants.
2. Using proportional piling with 100 beans representing annual expenditure, ask participants to demonstrate what proportion of total expenditure goes on different items.
3. Quantify the expenditure using categories set out in table below: survival food and non food, livelihood protection and other. Ask about weekly, monthly, annual and one- off costs. When discussing food items, ask participants to differentiate between (a) food purchased and prepared in the home and (b) prepared (or street) food purchases. Disaggregating by these two types of food expenditures is fairly straightforward and allows for a more refined analysis of the role of street foods in the diet16.
NB: A common problem with expenditure information is exaggeration of the items and quantities purchased. You need to use your judgement and to explore and discuss the figures. You will be able to determine if participants are exaggerating by checking against typical income figures you have just been given. The income and expenditure need to ‘add up’.
16WFP 2008 Technical guidance on urban food and nutrition security assessments
49
Checklist of common income sources in urban areas: • Labour exchange • Salaried employment • Remittances • Self-‐employment (this includes things like handicrafts, brewing, charcoal making); • Small business & petty trade (street vendors, market stall holders, taxi drivers, taxi conductors) • Sale of own production (e.g. vegetables) • Gifts (rural –urban linkages) • Credit Table to describe income sources and seasonal changes Income source (describe) % Additional comments Seasonal change e.g. petty trade
25 Buys tomatoes in bulk from supermarket and sells at road side
Highest profits gained during dry season
e.g. street food vendor
30 Buy ingredients from the market and cooks on the side of the road outside offices
Quiet periods during holidays (December and August)
e.g. domestic worker
5 Works part time as cleaner across other side of town
No
e.g. casual labour
40 Two hh members work as labourers on construction sites
Only in dry season (approx. 10 days per month for 9 months)
TOTAL
100
Quantifying income When proportional piling exercise has been complete, ask participants to quantify the main income sources for the whole year. It is important to make sure the number of people engaged in an activity, and prices/wages obtained for each activity are included. It may be easier to calculate this on a daily or weekly basis and then find out how many days/week or weeks/month income is earned from that source. Table used for income calculation Main source of income
Calculation of typical amount of income earned
Total
e.g. casual labour -‐ construction
e.g. 10 days per month for 9 months paid 500 MK/day = 10 x 9 = 90 days x 500 MK
4500 MK

42
Expenditure checklist (TO BE ADAPTED TO SUIT CONTEXT WITH ASSESSEMENT TEAMS)
Categories of expenditure Survival - food: The amount of money spent on basic staple foods, i.e. those providing the bulk of food energy at minimum cost.Survival - non food: The amount of money required to cover the cost of preparing and consuming food plus any cash expenditure on water for human consumption. This is the amount of money that cannot, except in the most extreme conditions, be switched to staple food purchases. The survival non-food basket includes basic items such as water (where people must buy water), salt, soap, kerosene for cooking, etc.Livelihoods Protection: The amount of money required to protect existing patterns of livelihoods, i.e. the amount that must be spent on items that are essential in terms of either i) maintaining access to basic services (e.g. routine medical and schooling expenses) or ii)
17HEA Practitioners guide
the maintenance of livelihoods in the medium to longer term or iii) the maintenance of a minimum acceptable standard of living (e.g. purchase of basic clothing, coffee/tea, etc.)Other: The amount of money left over for expenditure on other non-essential or discretionary items, such as better quality clothing, more than the minimum on foods as set out in the ‘survival’ and ‘livelihood protection’ categories, cigarettes, etc
Questions to keep in mind:• What are the main items of expenditure? • Can I quantify expenditure patterns – weekly/ monthly/annual/one off costs. • How does expenditure change throughout the year? • Is there a time of year when expenditure is higher than the rest of the year? When?
51
Expenditure checklist (TO BE ADAPTED TO SUIT CONTEXT WITH ASSESSEMENT TEAMS) Survival food Survival non food Livelihood
Protection Other
Staples: cheapest cereals and pulses
Soap Salt Oil Paraffin/Firewood to cook
Primary and secondary school: including fees, uniform, books/materials
Food items: milk, meat,
Services: Gas/electricity Water
Healthcare: including user fees, drugs
Entertainment: Beer, tobacco, football
Accommodation: House rent/Room rent
Transport Wedding/funerals/feasts
Business/petty trade inputs
Gifts: Rural –urban linkages Community support networks
Clothes
Milling
Additional food items: Sauce items, vegetables, sugar, coffee/tea
Repayment of loans/credit
Categories of expenditure17 Survival -‐ food: The amount of money spent on basic staple foods, i.e. those providing the bulk of food energy at minimum cost. Survival -‐ non food: The amount of money required to cover the cost of preparing and consuming food plus any cash expenditure on water for human consumption. This is the amount of money that cannot, except in the most extreme conditions, be switched to staple food purchases. The survival non-‐food basket includes basic items such as water (where people must buy water), salt, soap, kerosene for cooking, etc.
17 HEA Practitioners guide
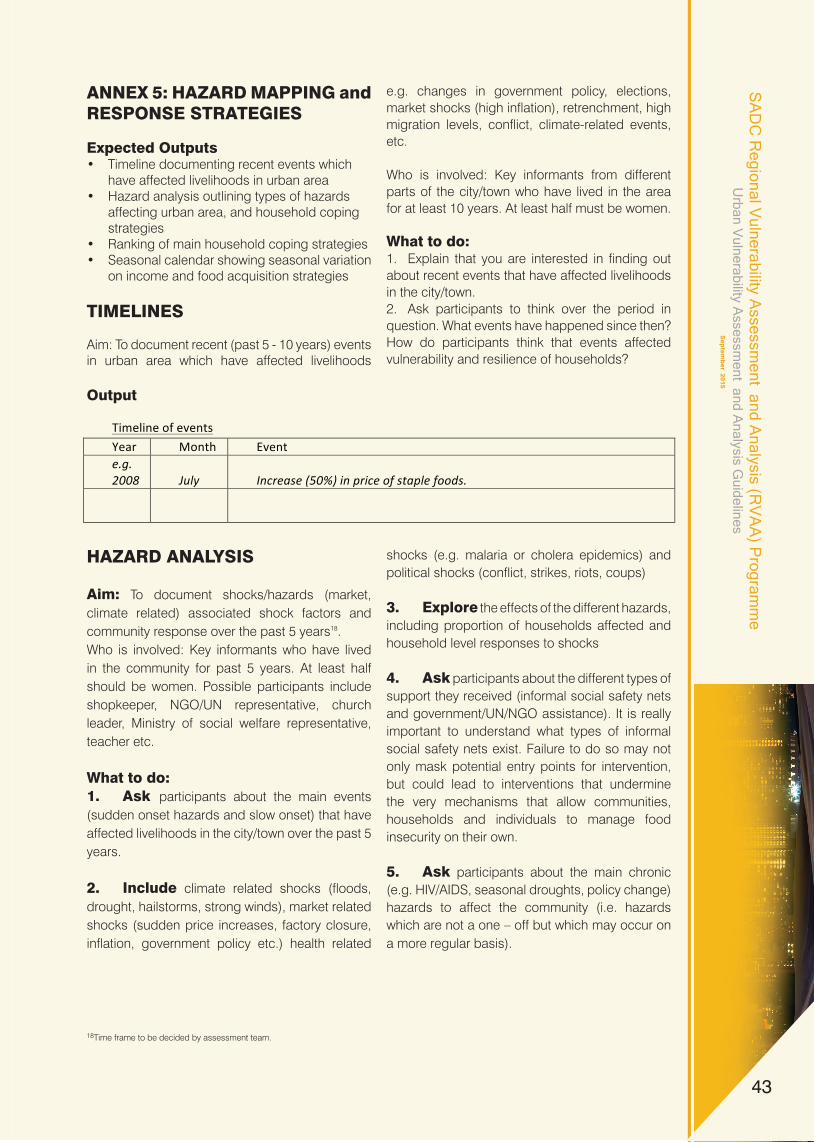
43
ANNEX 5: HAZARD MAPPING and RESPONSE STRATEGIES
Expected Outputs• Timeline documenting recent events which have affected livelihoods in urban area• Hazard analysis outlining types of hazards affecting urban area, and household coping strategies• Ranking of main household coping strategies• Seasonal calendar showing seasonal variation on income and food acquisition strategies
TIMELINES
Aim: To document recent (past 5 - 10 years) events in urban area which have affected livelihoods
HAZARD ANALYSIS
Aim: To document shocks/hazards (market, climate related) associated shock factors and community response over the past 5 years18. Who is involved: Key informants who have lived in the community for past 5 years. At least half should be women. Possible participants include shopkeeper, NGO/UN representative, church leader, Ministry of social welfare representative, teacher etc.
What to do: 1. Ask participants about the main events (sudden onset hazards and slow onset) that have affected livelihoods in the city/town over the past 5 years.
2. Include climate related shocks (floods, drought, hailstorms, strong winds), market related shocks (sudden price increases, factory closure, inflation, government policy etc.) health related
e.g. changes in government policy, elections, market shocks (high inflation), retrenchment, high migration levels, conflict, climate-related events, etc.
Who is involved: Key informants from different parts of the city/town who have lived in the area for at least 10 years. At least half must be women.
What to do: 1. Explain that you are interested in finding out about recent events that have affected livelihoods in the city/town. 2. Ask participants to think over the period in question. What events have happened since then? How do participants think that events affected vulnerability and resilience of households?
Output
shocks (e.g. malaria or cholera epidemics) and political shocks (conflict, strikes, riots, coups)
3. Explore the effects of the different hazards, including proportion of households affected and household level responses to shocks
4. Ask participants about the different types of support they received (informal social safety nets and government/UN/NGO assistance). It is really important to understand what types of informal social safety nets exist. Failure to do so may not only mask potential entry points for intervention, but could lead to interventions that undermine the very mechanisms that allow communities, households and individuals to manage food insecurity on their own.
5. Ask participants about the main chronic (e.g. HIV/AIDS, seasonal droughts, policy change) hazards to affect the community (i.e. hazards which are not a one – off but which may occur on a more regular basis).
18Time frame to be decided by assessment team.
53
ANNEX 5: HAZARD MAPPING and RESPONSE STRATEGIES Expected Outputs § Timeline documenting recent events which have affected livelihoods in urban area § Hazard analysis outlining types of hazards affecting urban area, and household coping strategies § Ranking of main household coping strategies § Seasonal calendar showing seasonal variation on income and food acquisition strategies TIMELINES Aim: To document recent (past 5 -‐ 10 years) events in urban area which have affected livelihoods e.g. changes in government policy, elections, market shocks (high inflation), retrenchment, high migration levels, conflict, climate-‐related events, etc. Who is involved: Key informants from different parts of the city/town who have lived in the area for at least 10 years. At least half must be women. What to do: 1. Explain that you are interested in finding out about recent events that have affected livelihoods in
the city/town. 2. Ask participants to think over the period in question. What events have happened since then? How
do participants think that events affected vulnerability and resilience of households? Output Timeline of events Year Month Event e.g. 2008
July
Increase (50%) in price of staple foods.

44
Consumption Coping Strategies (available to all households)• Reduce the number of meals consumed in a day• Limit the amount of food/portion size you consume during meals• Eat less preferred, lower quality or less expensive foods• Prioritise consumption for certain members and reduce consumption of others• Reduce the diversity of foods eaten• Increase consumption of street food (e.g. prepared foods)• Eat wild foods not typically consumed as part of ‘normal’ diet• Eat scavenged foods (e.g. discarded by others)• Beg for food or money to buy food• Skip entire days without eating
Checklist of Coping Strategies19
Livelihood Response Strategy (livelihood, opportunity and asset dependent)• Reduce non-essential expenditures (education, health, transport, rent rooms, etc.)• Borrow food or money from family/friends• Send household members to eat/live with family or friends• Purchase food/non-food items on credit (incur debts)• Borrow money from informal money lenders or banks• Work additional hours or take on additional casual/temporary work• Produce more of your own food• Send HH member elsewhere in search of work (exclude routine seasonal migration)• Send children or elderly to work• Engage in illicit/high risk income generating activities (prostitution, stealing)
19Assessment teams will need to amend these for the urban environment, and devise categories which reflect mild/moderate or severe food insecurity.
54
HAZARD ANALYSIS Aim: To document shocks/hazards (market, climate related) associated shock factors and community response over the past 5 years.18 Who is involved: Key informants who have lived in the community for past 5 years. At least half should be women. Possible participants include shopkeeper, NGO/UN representative, church leader, Ministry of social welfare representative, teacher etc. What to do: 1. Ask participants about the main events (sudden onset hazards and slow onset) that have affected
livelihoods in the city/town over the past 5 years. 2. Include climate related shocks (floods, drought, hailstorms, strong winds), market related shocks
(sudden price increases, factory closure, inflation, government policy etc.) health related shocks (e.g. malaria or cholera epidemics) and political shocks (conflict, strikes, riots, coups)
3. Explore the effects of the different hazards, including proportion of households affected and household level responses to shocks
4. Ask participants about the different types of support they received (informal social safety nets and government/UN/NGO assistance). It is really important to understand what types of informal social safety nets exist. Failure to do so may not only mask potential entry points for intervention, but could lead to interventions that undermine the very mechanisms that allow communities, households and individuals to manage food insecurity on their own.
5. Ask participants about the main chronic (e.g. HIV/AIDS, seasonal droughts, policy change) hazards to affect the community (i.e. hazards which are not a one – off but which may occur on a more regular basis).
Table showing hazards and shock factors Date Event Shock factor Effect Coping strategy e.g. 2008
Global market meltdown
Inflation Increase in staple food prices
Reduction in quantity of staple food consumed; increased reliance on extended family in rural areas
e.g. Dec 2010
Heavy rains in suburbs
Flooding Loss of stored goods and furniture
Found work as casual labourer
Checklist of Coping Strategies19
18 Time frame to be decided by assessment team.
55
Consumption Coping Strategies (available to all households) ~ Reduce the number of meals consumed in a day ~ Limit the amount of food/portion size you consume during meals ~ Eat less preferred, lower quality or less expensive foods ~ Prioritise consumption for certain members and reduce consumption of others ~ Reduce the diversity of foods eaten ~ Increase consumption of street food (e.g. prepared foods) ~ Eat wild foods not typically consumed as part of ‘normal’ diet ~ Eat scavenged foods (e.g. discarded by others) ~ Beg for food or money to buy food ~ Skip entire days without eating
Livelihood Response Strategy (livelihood, opportunity and asset dependent) ~ Reduce non-‐essential expenditures (education, health, transport, rent rooms, etc.) ~ Borrow food or money from family/friends ~ Send household members to eat/live with family or friends ~ Purchase food/non-‐food items on credit (incur debts) ~ Borrow money from informal money lenders or banks ~ Work additional hours or take on additional casual/temporary work ~ Produce more of your own food ~ Send HH member elsewhere in search of work (exclude routine seasonal migration) ~ Send children or elderly to work ~ Engage in illicit/high risk income generating activities (prostitution, stealing) Table showing different types of support
Event (description and date)
Informal Formal
Retrenchment 2010
Local shopkeeper gave credit for items at low interest rates;
none
SEASONAL CALENDAR – livelihoods and hazards20
19 Assessment teams will need to amend these for the urban environment, and devise categories which reflect mild/moderate or severe food insecurity. 20 See Oxfam 2012 Participatory Capacity and Vulnerability Analysis: A Practitioners’ Guide

45
SEASONAL CALENDAR – livelihoods and hazards20
Aim: To complete a seasonal calendar of main income and food acquisition strategies. Include perceived hazard risks.
Who is involved: Key informants representing a cross section of the population. At least half should be women or ideally a separate meeting with women only could be held.
What to do: 1. Ask participants to brainstorm which income generating activities can be done at which times of year. Note which activities are done by women or men. Explore the reasons why activity cannot be done all year. Put activities into the calendar below.
2. Ask participants about sources of food throughout the year. Does this change? Why? At what time of year are staple food prices usually highest? And lowest?
3. For all activities, show variations in access with arrows, with ↑ indicating peak access and ↑ to indicate minimal access.
4. Ask participants which shocks/hazards their community faced during the last 12 months (include environmental and man made shocks). Note down on the calendar.
OutputAn example of a seasonal calendar template:
Expected outputs
• Market price trends - main staple foods, wage rates for skilled/unskilled labour• Calculation of terms of trade: • Skilled/unskilled labour to staple food • Skilled/unskilled labour to rent• Description of credit market – availability, interest to loan rates, • Calculation of cost of items included in minimum expenditure baskets (survival and livelihood protection) for typical household - as identified during expenditure focus groups
• Map of markets showing the market structure and the main actors involved in the market system, primary/secondary supply routes for staple food and description of potential barriers to access
NB: Assessment teams will need to corroborate this market data with that collected during the initial phase of review of secondary sources e.g. price trends over 5 – 10 years, inflation rates, consumer price index etc.
20See Oxfam 2012 Participatory Capacity and Vulnerability Analysis: A Practitioners’ Guide
ANNEX 6: MARKET ANALYSIS
PQ!!
%")5G%#3!53;=8%2%!4!1%413748!548%794?!3B!;407!0753;%!479!B339!45eA0102037!12?42%:0%1C!M758A9%!=%?5%0>%9!$4K4?9!?0161C!%QI*%)4%)+P*-P'6G%k%<!07B3?;4721!?%=?%1%7207:!4!5?311!1%52037!3B!2$%!=3=A842037C!'2!8%412!$48B!1$3A89!@%!/3;%7!3?!09%488<!4!1%=4?42%!;%%207:!/02$!/3;%7!378<!53A89!@%!$%89C!%QI,2%2*%6*G%%HC '16!=4?2050=4721! 23!@?407123?;!/$05$! 0753;%!:%7%?4207:!4520>020%1! 547!@%!937%!42!/$05$! 20;%1!3B!
<%4?C!N32%!/$05$!4520>020%1!4?%!937%!@<!/3;%7!3?!;%7C!SO=83?%!2$%!?%41371!/$<!4520>02<!547732!@%!937%!488!<%4?C!!,A2!4520>020%1!0723!2$%!548%794?!@%83/C!!!
"C '16!=4?2050=4721!4@3A2!13A?5%1!3B!B339!2$?3A:$3A2!2$%!<%4?C!(3%1!2$01!5$47:%h!D$<h!'2!/$42!20;%!3B!<%4?!4?%!124=8%!B339!=?05%1!A1A488<!$0:$%12h!'79!83/%12h!!
IC R3?! 488! 4520>020%1F! 1$3/! >4?0420371! 07! 455%11! /02$! 4??3/1F! /02$!�! 079054207:! =%46! 455%11! 479!�! 23!0790542%!;070;48!455%11C!!
JC '16!=4?2050=4721!/$05$! 1$3561g$4K4?91! 2$%0?! 53;;A702<! B45%9!9A?07:! 2$%! 8412!H"!;372$1! b0758A9%!%7>0?37;%7248!479!;47!;49%!1$3561cC!N32%!93/7!37!2$%!548%794?C!
!W/2</2%'7!%O4;=8%!3B!4!1%413748!548%794?!2%;=842%\!!'520>02<! n47! R%@! -4?! '=?! -4<! nA7! nA8! 'A:! &%=2! U52! N3>!! (%5!
5/J/$9%7,%($(%)",4$$
! ! ! ! ! ��!
��!
�! ! ! �! ��!
! ! ! ! ! ! ! ! ! ! ! ! !! ! ! ! ! ! ! ! ! ! ! ! !! ! ! ! ! ! ! ! ! ! ! ! !
%C:C!B833907:!?016!!
! ! ! ! ! ! ! ! ! ! ��!
��!
%!!%%%!!!!!!!"JJSY%aG%%F"&_SH%"J"Mg!\!%%%

46
21See above
PRICE DATAAim: To collect price information and to capture seasonal changes
Who is involved: market traders - ideally gather the same information from different sources and then triangulate in order to reduce discrepancies.
57
Expected outputs § Market price trends -‐ main staple foods, wage rates for skilled/unskilled labour § Calculation of terms of trade:
~ Skilled/unskilled labour to staple food ~ Skilled/unskilled labour to rent
§ Description of credit market – availability, interest to loan rates, § Calculation of cost of items included in minimum expenditure baskets (survival and livelihood
protection) for typical household -‐ as identified during expenditure focus groups § Map of markets showing the market structure and the main actors involved in the market system,
primary/secondary supply routes for staple food and description of potential barriers to access NB: Assessment teams will need to corroborate this market data with that collected during the initial phase of review of secondary sources e.g. price trends over 5 – 10 years, inflation rates, consumer price index etc. PRICE DATA Aim: To collect price information and to capture seasonal changes Who is involved: market traders -‐ ideally gather the same information from different sources and then triangulate in order to reduce discrepancies.
Description Measure Price now
Price hungry season
Main staples
e.g maize
kg
e.g. bread
loaf
Main sources of income
e.g. Casual labour Daily rate
e.g. factory work
Daily rate
Rent Room
Monthly
n/a
House
n/a
Minimum expenditure basket prices (typical hh – 6) – survival and livelihood protection21
21 See above
58
Commodity Cost MARKET MAPPING AND COMMODITY FLOWS Aim: To map markets and commodity flows for staple foods, including finding the main barriers (if any) to access Who is involved: Municipal level key informants concerned with production and/or supply of staple foods to the city/town What to do: 1. Using a map of the city/town and surrounding area, identify the main markets for staple foods 2. Choose which staple food to map first (e.g. maize) 3. Identify primary/secondary supply routes, and allocate proportions (e.g. 70% of maize comes from
South Africa, 30% of maize comes from within Lesotho) 4. Discuss barriers to access Urban area
Commodity Primary supply
Secondary supply
Barriers
e.g. Maseru
maize South Africa (70%)
Internal (30%)
Prices increase when border closed with RSA Traders keep maize grown in country in storage until supply dwindles and prices increase. Consumers cannot buy from anywhere else. Monopoly.

47
MARKET MAPPING AND COMMODITY FLOWS
Aim: To map markets and commodity flows for staple foods, including finding the main barriers (if any) to access
Who is involved: Municipal level key informants concerned with production and/or supply of staple foods to the city/town
What to do: 1. Using a map of the city/town and surrounding area, identify the main markets for staple foods 2. Choose which staple food to map first (e.g. maize) 3. Identify primary/secondary supply routes, and allocate proportions (e.g. 70% of maize comes from South Africa, 30% of maize comes from within Lesotho)4. Discuss barriers to access
58
Commodity Cost MARKET MAPPING AND COMMODITY FLOWS Aim: To map markets and commodity flows for staple foods, including finding the main barriers (if any) to access Who is involved: Municipal level key informants concerned with production and/or supply of staple foods to the city/town What to do: 1. Using a map of the city/town and surrounding area, identify the main markets for staple foods 2. Choose which staple food to map first (e.g. maize) 3. Identify primary/secondary supply routes, and allocate proportions (e.g. 70% of maize comes from
South Africa, 30% of maize comes from within Lesotho) 4. Discuss barriers to access Urban area
Commodity Primary supply
Secondary supply
Barriers
e.g. Maseru
maize South Africa (70%)
Internal (30%)
Prices increase when border closed with RSA Traders keep maize grown in country in storage until supply dwindles and prices increase. Consumers cannot buy from anywhere else. Monopoly.
59
Further resources for market analysis include: EMMA tool kit -‐ http://emma-‐toolkit.org/ for description of how to conduct Market Mapping and Analysis. PCMMA guidelines-‐ http://emma-‐toolkit.org/practice/pre-‐crisis-‐market-‐mapping-‐and-‐analysis/ Also see following annexes of HEA practitioners’ guide: How to conduct market chain analysis http://www.savethechildren.org.uk/sites/default/files/docs/Ch.3_Annex_C-‐_Supplementary_Market_Guidance_Guide_1_1.pdf How to interpret time series data http://www.savethechildren.org.uk/sites/default/files/docs/Ch.3_Annex_C-‐_Supplementary_Market_Guidance_Guide_2_1.pdf Price data collection http://www.savethechildren.org.uk/sites/default/files/docs/Ch.3_Annex_C-‐_Supplementary_Market_Guidance_Guide_4_1.pdf Market structure diagrams http://www.savethechildren.org.uk/sites/default/files/docs/Ch.3_Annex_C-‐_Supplementary_Market_Guidance_Guide_5_1.pdf Mapping markets and commodity flow http://www.savethechildren.org.uk/sites/default/files/docs/Ch.3_Annex_C-‐_Supplementary_Market_Guidance_Guide_6_1.pdf

48
ANNEX 7: INSTITUTIONAL MAPPING
Venn diagrams (or circle diagrams)22 Venn diagrams are useful tools to understand
linkages and interactions between different
stakeholders. They help users to understand
local groups and institutions, and identify linkages
between institutions.
Aim: To map institutions (both government and
non-government) in order to understand linkages
and interactions between different stakeholders.
NB: There may be numerous institutions
functioning in the urban environment, so the
assessment team may need to limit the discussion
to those which are perceived by key informants/
community as having most effect on livelihood
outcomes.
Who is involved: Key informants with a good
understanding of different institutions working
within the urban area.
What to do:1. Preparation: Cut out circles from
cardboard in different sizes and colours, if possible
2. List institutions: Participants are asked
to make a list of local and outside groups and
organisations that are most important to them
in relation to dealing with the identified problem
(lack of affordable housing, lack of employment
opportunities). List institutions on a flipchart.
Discuss till everybody agrees that all the relevant
ones are covered. Then decide on how important
they are, and whether they should be represented
by a small or large circle. What are the local /
traditional institutions? Note that this may include
also local ways of sharing assets/resources during
difficult times, such as loans, trade and exchange
mechanisms, and similar.
3. Draw community and place institutions:
Participants are asked to draw a big circle
representing the zone. Inside, ask participants
to put the circles representing each of the
institutions. The more relevant they are, the closer
to the centre of the circle (external institutions
crossing the boundary), and the more important
they are, the bigger the circle. Closeness to each
other indicates how much contact they have; if
no contact – separate circles, if some information
sharing, circles touching each other, and if much
contact and membership overlap – overlapping
circles.
As the drawing is being made, explore questions on their interrelations.• How do they help HH deal with e.g. high rents?
Lack of formal employment opportunities. How
can HH access these institutions? Are they for
everyone?
• How are they related?
• Why they are important or less important?
• How they have changed during the last 10
years?
• Which are becoming more/less important?
Why?
• Do they include only men or women, or both?
• Who have most/less access to these benefits?
22See Oxfam 2012 Participatory Capacity and Vulnerability Analysis Practitioners’ Guide pp.20 – 22 for examples of circle diagrams

49
Checklist of possible institutions:23 a) Public and private institutions• Local government offices;
• Community organizations;
• Labour unions and professional organizations;
• Employer or business organizations;
• Cooperatives and other communal
enterprises;
• Corporate businesses;
• NGOs/CBOs/church organisations;
• Micro-finance institutions;
• Transportation services (passengers and
cargo)
b) Programs and projects operating in the area• Government, UN, NGO or CBO projects
(current or recent)
c) Vocational training and technical education• Vocational training schools/facilities
Storage of information:• Make notes during the facilitation (one to
facilitate, one to two to help and make notes).
Write up notes shortly afterwards (same day)
• Copy the flipchart over to PC/paper (take
photo if possible). Leave flipchart in the
community
• Discuss each point that came up and
make notes on each; note any discussions/
disagreements
Outputs:• One venn diagram copied from flipchart
accompanied by notes summarising the
discussion, emphasising in particular areas
of discussion and disagreements
• Table indicating activities of different
institutions
23See FAO /ILO 2009 Livelihood assessment toolkit
61
a) Public and private institutions § Local government offices; § Community organizations; § Labour unions and professional organizations; § Employer or business organizations; § Cooperatives and other communal enterprises; § Corporate businesses; § NGOs/CBOs/church organisations; § Micro-‐finance institutions; § Transportation services (passengers and cargo)
b) Programs and projects operating in the area § Government, UN, NGO or CBO projects (current or recent)
c) Vocational training and technical education § Vocational training schools/facilities
Storage of information: § Make notes during the facilitation (one to facilitate, one to two to help and make notes). Write up
notes shortly afterwards (same day) § Copy the flipchart over to PC/paper (take photo if possible). Leave flipchart in the community § Discuss each point that came up and make notes on each; note any discussions/disagreements
Outputs: § One venn diagram copied from flipchart accompanied by notes summarising the discussion,
emphasising in particular areas of discussion and disagreements § Table indicating activities of different institutions
Table indicating institutional activities Type of institution Name Main activity Wealth group Government
e.g. Dept. of Work and Pensions
e.g. child benefit e.g. HH income < $20/month
NGO/CBO
ACF Micro credit Poor
Religious
Church food distribution Very poor/ destitute
Other
Overleaf: Example Venn Diagram from FAO SEAGA FIELD GUIDE:
23 See FAO /ILO 2009 Livelihood assessment toolkit

50
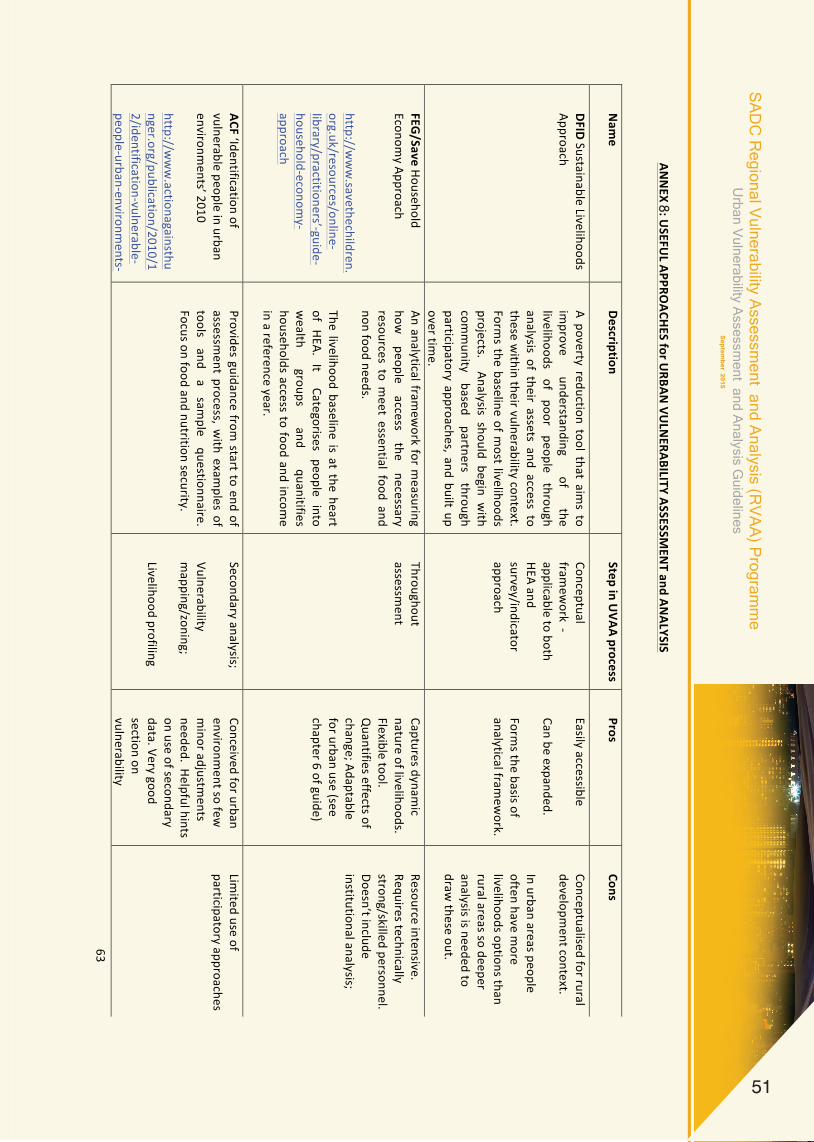
51
63 AN
NEX 9: U
SEFUL APPRO
ACHES for U
RBAN VU
LNERABILITY ASSESSM
ENT and AN
ALYSIS
Nam
e Description
Step in UVAA process
Pros Cons
DFID
Sustainable Livelihoods Approach
A poverty reduction tool that aims to
improve
understanding of
the livelihoods
of poor
people through
analysis of their assets and access to these w
ithin their vulnerability context. Form
s the baseline of most livelihoods
projects. Analysis should begin with
comm
unity based
partners through
participatory approaches, and built up over tim
e.
Conceptual fram
ework -‐
applicable to both H
EA and survey/indicator approach
Easily accessible Can be expanded. Form
s the basis of analytical fram
ework.
Conceptualised for rural developm
ent context. In urban areas people often have m
ore livelihoods options than rural areas so deeper analysis is needed to draw
these out.
FEG/Save H
ousehold Econom
y Approach http://w
ww
.savethechildren.org.uk/resources/online-‐library/practitioners’-‐guide-‐household-‐econom
y-‐approach
An analytical framew
ork for measuring
how
people access
the necessary
resources to meet essential food and
non food needs. The livelihood baseline is at the heart of H
EA. It Categorises people into w
ealth groups
and quanitifies
households access to food and income
in a reference year.
Throughout assessm
ent Captures dynam
ic nature of livelihoods. Flexible tool. Q
uantifies effects of change; Adaptable for urban use (see chapter 6 of guide)
Resource intensive. Requires technically strong/skilled personnel. Doesn’t include institutional analysis;
ACF ‘Identification of vulnerable people in urban environm
ents’ 2010 http://w
ww
.actionagainsthunger.org/publication/2010/12/identification-‐vulnerable-‐people-‐urban-‐environm
ents-‐
Provides guidance from start to end of
assessment process, w
ith examples of
tools and
a sam
ple questionnaire.
Focus on food and nutrition security.
Secondary analysis; Vulnerability m
apping/zoning; Livelihood profiling
Conceived for urban environm
ent so few
minor adjustm
ents needed. H
elpful hints on use of secondary data. Very good section on vulnerability
Limited use of
participatory approaches

52
64
assessment-‐sustainable
m
apping/zoning and selection of criteria W
orks through sam
pling calculations Provides sam
ple questionnaires
OXFAM
Participatory Com
munity Vulnerability
Analysis 2012 http://policy-‐practice.oxfam
.org.uk/publications/participatory-‐capacity-‐and-‐vulnerability-‐analysis-‐a-‐practitioners-‐guide-‐23241
Practical step-‐by-‐step guide designed to take the user through the PCVA process. Covers preparatory w
ork, facilitation (w
orking directly with the
comm
unity on participatory learning and action (PLA) exercises to answ
er key questions), and action planning. U
pdated post 2009 to improve its
approach to gender analysis and make
it more relevant to urban contexts
Existing pilot in the Philippines : integrated PCVA/H
EA
Secondary data analysis; Institutional m
apping; Livelihood profiling
Development
oriented. Clim
ate change/DRR focus Clearly set out section on useful secondary sources. Excellent sections on w
orking with the
comm
unity; analysing hazards, clim
ate change vulnerabilities and capacities; prioritising risk Com
plemented by
clear step by step guidance for using different tools (venn diagram
, daily time
chart, annual livelihoods calendar, hazard m
ap, problem
and solution trees ,

53
65
risk quadrants) OXFAM
Emergency M
arket M
apping and Analysis (EM
MA) 2012
http://emm
a-‐toolkit.org/
A step by step guide to conducting a m
arket analysis. Includes analysis of the key m
arket actors in the supply/consum
er chain. Adds the analysis of the m
arket environment,
infrastructure, inputs and market
support services.
Designed to improve understanding of
use of market system
s in emergency
response. Helps to identify capabilities
of existing market actors and potential
ways in w
hich they can be supported.
Market analysis
Easy to follow.
Emphasis on m
arket as a system
. Includes supply chain analysis. Can extricate relevant inform
ation for adaptation for non em
ergency
Emergency oriented
OXFAM
Pre Crisis Market
Mapping and Analysis
(PCMM
A ) 2014
Similar to EM
MA, but conducted
during non crisis period (focus is more
on the “normal conditions”, PCM
MA
guidelines set out 15 steps for conducting a m
arket analysis. Aim is to
understand the capacity and constraints of critical m
arket systems.
The user is taken through various steps -‐ understanding context, through data collection, selection of response options, identification of indicators to m
onitor and comm
unication of results -‐ w
ith clear instructions on how to
move from
one step to the next.
Context analysis M
arket analysis Institutional analysis
Very clear, easy to follow
, step by step guide. Full analysis requires approx. 11 days. PCM
MA can help
users understand existing structural challenges, im
prove disaster preparedness and identify responses that protect or strengthen parts of the m
arket system
.
Emergency response
and preparedness oriented.
To be carried out in a crisis prone area.
OXFAM
Gendered Entreprise
and Market toolkit
Market system
s approach aiming to
promote long term
livelihood Livelihood Profiling M
arket
U
nder development

54
67
(stable) situation. Applicable in camps,
host families, dispersed populations
Sensitive to special issues such as gender, H
IV/AIDS and IDPs. Includes physical, socio-‐econom
ic, political vulnerability. RU
RAL orientation
knowledge of food
security and social research techniques.
WFP Consolidated Approach
to reporting Food Insecurity (CARI)
Indicator based approach, which
classifies each household into categories of food security/insecurity. The approach takes indicators of food consum
ption vs coping capacity and asset depletion
Hazard m
apping Com
plements H
EA Addresses food consum
ption and diversity
Snapshot. N
eeds to be repeated at different points in the year to take seasonality into account. Potential challenge of H
H definition in urban
areas. FAO
/ILO Livelihood
Assessment Tool kit 2009
Vol. 1: Methodological and
conceptual overview
Vol. 2 Livelihood Baseline &
Contingency Plan http://w
ww
.fao.org/fileadmi
n/user_upload/emergencies/
docs/LAT_Brochure_LoRes.pdf Vol. 3: Initial Livelihood Im
pact Appraisal
Guide to understanding im
pact of disasters on livelihoods. Livelihood Baseline Assessm
ent done undertaken pre-‐disaster; Initial Livelihood Im
pact Appraisal (undertaken im
mediately
after the disaster); Detailed Livelihood Assessm
ent (undertaken up to 90 days after the disaster). Aim
ed at sudden onset natural disasters. An assessm
ent tool that captures
Context Analysis Livelihood profiling H
azard mapping
Markets
Vol 2: Livelihood Baseline m
ost relevant. Provides clear concise guidance on suggested steps and tools for constructing a baseline. Provides exam
ple form
ats, which can be
adapted for urban use.
Needs considerable
adaptation for urban use. U
nderlying assumption
that a crisis will occur.

55
68
Vol. 4: Detailed Livelihood Assessm
ent
capacities and opportunities for recovery and increased resilience. The approach is aim
ed to set up response analysis fram
ework and can be used by
all stakeholdersountry Teams, national
and local governments and N
GO
s. Addresses vulnerability according to the asset base that people have prior to the crisis and their ability to engage in various coping strategies (sustainable livelihoods fram
ework)
Clear guidelines on how
to use tools e.g. seasonal calendar
Coping Strategies Index (CSI) http://w
ww
.seachangecop.org/sites/default/files/docum
ents/2008%
2001%20TAN
GO
%20-‐%
20Coping%20Strategies%
20Index.pdf
The Coping Strategies Index is a basic indicator of food security, w
hich provides a snapshot picture at one point in tim
e. A step-‐by-‐step guide to the process is set out, w
hich enables the user to set up the CSI tool, adapt it to the local context; and use it to collect, collate, and analyze inform
ation about household food security.
Hazard m
apping Can be adapted to urban context.
Gives snapshot picture
of one point in time and
is not able to capture dynam
ics of coping. For exam
ple different strategies m
ay be em
ployed at different tim
es, sometim
es they m
ay be perceived as ‘coping’ at other tim
es as part of the ‘norm
al livelihood activities’.
GSD
RC Tools for participatory analysis 2013
Description of quantitative and qualitative tools and m
ethods used by developm
ent agencies to undertake m
icro-‐level participatory analysis on poverty, social exclusion, or vulnerability.
Context analysis Livelihood profiling
Identifies scope and intended application of tools, the skills required to use them
, and lessons learned.
Only covers handful of
tools.
FAO SEAG
A Field Handbook
2001 http://w
ww
.fao.org/docrep/
Provides toolkits (development
context, livelihood analysis and stakeholder priorities) specifically designed to support a participatory process that starts by focusing on
Context analysis Livelihood profiling (trend lines)
Excellent step by step guide to using different participatory tools.
Written for use in rural
fieldwork contexts but
tools can be adapted for use in urban environm
ent.

56
69 Relevant literature also includes: W
FP and gFSC: Adapting to an Urban W
orld -‐ Tracking the Development of U
rban Food Security Assessment Tools: 2010 to 2015, June 2015
Urban W
orld, Food Security Cluster, 2015.
012/ak214e/ak214e00.pdf
present situation, and also focuses on planning for the future.
The toolkits consist of a number of
rapid rural and participatory rural appraisal tools.
Institutional mapping
(venn diagrams,
institutional profiles)
Focus on understanding gender, w
ealth, ethnicity and other social differences.

57
Notes

58
Notes

59
Notes

60
Notes