sacramento regional transit districtsacrt.com/documents/financialdocs/fy2018abridgedado… · ·...
TRANSCRIPT

1
Exhibit A
Sacramento Regional Transit District
Abridged Budget Fiscal Year 2017-2018
June 12, 2017

2
FFiissccaall YYeeaarr 22001177--22001188 AAbbrriiddggeedd BBuuddggeett
Table of Contents Board of Directors ....................................................................................................................................... 3
Executive Management Team .................................................................................................................... 4
Management and Budget Team .................................................................................................................. 4
Organizational Structure ............................................................................................................................. 5
District Overview ......................................................................................................................................... 6
District Profile ....................................................................................................................................................................... 6
Strategic Plan ...................................................................................................................................................................... 7
Budget Process ................................................................................................................................................................. 10
Voting System .................................................................................................................................................................... 11
RT Major Goals and Objectives in FY 2018 .............................................................................................. 13
Operating Budget Summary ..................................................................................................................... 15
Revenues........................................................................................................................................................................... 15
Expenses ........................................................................................................................................................................... 18
Positions ............................................................................................................................................................................ 21
Capital Improvement Plan ......................................................................................................................... 24
Project Overview ................................................................................................................................................................ 24
Impact of Capital Improvements on the Operating Budget ................................................................................................ 25
Capital Improvements by Category .................................................................................................................................... 26
Capital Improvement Revenues and Expenditures ............................................................................................................ 27
Capital Project Funding Addition Descriptions ................................................................................................................... 31

3
FFiissccaall YYeeaarr 22001177--22001188 AAbbrriiddggeedd BBuuddggeett
Board of Directors
Andrew J. Morin, Chair City of Folsom
Patrick Kennedy, Vice Chair
County of Sacramento
Linda Budge City of Rancho Cordova
Jeff Harris
City of Sacramento
Steve Hansen City of Sacramento
Pat Hume
City of Elk Grove
Rick Jennings II City of Sacramento
Steve Miller
City of Citrus Heights
Don Nottoli County of Sacramento
Jay Schenirer
City of Sacramento
Phil Serna
County of Sacramento
Board of Directors Alternate
Steve Detrick City of Elk Grove
Jeff Slowey
City of Citrus Heights
David Sander City of Rancho Cordova
4
FFiissccaall YYeeaarr 22001177--22001188 AAbbrriiddggeedd BBuuddggeett
Executive Management Team
Henry Li General Manager/CEO
Tim Spangler Chief Counsel
Laura Ham VP, Accountability and Performance
Mark Lonergan
VP, Transit Service/Chief Operating Officer
Suzanne Chan VP, Administration
Neil Nance
VP, Strategic Planning and System Development
Brent Bernegger VP, Finance/Chief Financial Officer
Devra Selenis
VP, Communications and Partnerships
Norm Leong VP, Security and Safety
Olga Sanchez-Ochoa Deputy Chief Counsel
Management and Budget Team David Goldman
Director, Office Management and Budget
Maureen Ring Nadia Mokhov Grants Manager Senior Financial Analyst
Joe Paglieroni Judy Wong Senior Grants Analyst Senior Financial Analyst

5
FFiissccaall YYeeaarr 22001177--22001188 AAbbrriiddggeedd BBuuddggeett
Organizational Structure

6
FFiissccaall YYeeaarr 22001177--22001188 AAbbrriiddggeedd BBuuddggeett
District Overview District Profile
Facts
Sacramento Regional Transit District Constructs, operates, and maintains a comprehensive mass transportation system that serves 367 square miles in Sacramento County
Bus Service Light Rail Service
Power Compressed Natural Gas, Diesel, Gasoline Power Electrical
Routes 69 Miles 42.9
Schedule 4:41 am to 11:38 pm daily Schedule 3:49 am to 12:59 am daily
Stops 3,100+ Stops 53
Vehicles 211 - 40’ CNG Buses 29 – Shuttle Vans
Vehicles 87
Annual Ridership 11,600,000 Annual Ridership 12,400,000
Paratransit Passenger Amenities/ Customer Service
ADA Passenger Trips Provided 340,370 Transfer Centers 32
ADA Vehicle Revenue Miles 3,501,434 Park & Ride 22
Vehicles 102 Annual Customer Service Calls 233,132
Customer Info Line (916) 321-2877
Website www.sacrt.com
History
Apr 1, 1973 Began operations by acquiring the assets of Sacramento Transit Authority
1973 Completed new maintenance facility and purchased 103 new buses
1987 Opened the 18.3-mile light rail system, linking the northeastern Interstate 80 and southeastern Highway 50 corridors with Downtown Sacramento
Sep 1998 Completed the first light rail extension to Mather Field/Mills Station along the Gold Line corridor
Sep 2003 Opened the South Line, extending light rail to South Sacramento
Jun 2004 Extended light rail from Mather Field/Mills to Sunrise Boulevard
Oct 2005 Extended light rail from Sunrise Boulevard to Folsom, including four new stations
Dec 2006 Extended light rail from downtown Sacramento to Sacramento Amtrak station
Jun 2012 Opened the Green Line, connecting downtown Sacramento to the River District
September 2015 Extended light rail from Meadowview to Cosumnes River College

7
FFiissccaall YYeeaarr 22001177--22001188 AAbbrriiddggeedd BBuuddggeett
Strategic Plan
Adopted by the Board of Directors in January 2015, RT’s Strategic Plan reaffirms RT’s commitment to improve access in the Sacramento region by providing fiscally responsible transit service. The Strategic Plan outlines the way RT will navigate challenges and explore opportunities as it seeks to connect people to resources with consideration and support of regional goals. RT’s Strategic Plan requires RT to shape activities to support identified Values and Goals, responsibly manage all agency actions and commitment of resources, and measure performance. RT acts as the Region’s focal point for transit research and development, strategic planning and system assessment, and transit education and safety training. RT’s programs involve multiple modes of transportation. This plan is RT’s commitment to the people of the Sacramento Region. RT will accomplish this through regional leadership and by providing quality service in a respectful and sustainable manner. RT will continue to focus on customer service and provide safe, clean, and reliable transportation service. To prepare for future needs in the 21st Century, RT will build and continuously develop a highly skilled transportation workforce. RT will continue to challenge itself to meet the growing transportation needs of the Sacramento Region. The RT Strategic Plan’s Mission, Vision, Values, and Goals are listed on the following page. The plan is best seen as an evolving process, not a rigid or fixed document. This plan will change as the needs of the Region change and will reflect the transportation requirements of the Region. The updated RT Strategic Plan was recently adopted by the Board of Directors and is currently being implemented.

8
FFiissccaall YYeeaarr 22001177--22001188 AAbbrriiddggeedd BBuuddggeett
Strategic Plan (continued)
Mission Statement The purpose of the Sacramento Regional Transit District is to promote and improve access in the Sacramento region by providing safe, reliable, and fiscally responsible transit service that links people to resources and opportunities. Vision Statement The Sacramento Regional Transit District strives to connect people to resources and opportunities while stimulating livable communities and supporting economic development by providing an efficient and fiscally sustainable transit system that attracts and serves riders by offering an appealing transportation choice. Values
• Quality Service & Innovation: RT is committed to providing safe, reliable, and cost efficient public transit services, and initiating innovative technologies to improve service effectiveness.
• Customer Service: RT places customers first by providing quality transit services and amenities with convenient and easily understood access at an affordable price.
• Respect & Professionalism: RT is committed to treating its customers and employees with dignity and respect, recognizing the importance and value of each individual.
• Fiscal Responsibility: RT is committed to the pursuit of efficient use of resources and of secure and stable funding sources.
• Integrity & Accountability: RT acknowledges its responsibility for actions and performance with an uncompromising commitment to truth, honesty and high ethical standards. RT is committed to compliance with regulatory requirements and industry standards and efforts to improve upon existing practices.
• Quality, Diverse & Positive Work Force: RT is committed to increasing employee effectiveness and satisfaction through effective communication, teamwork, appropriate resource availability, appreciation of varied abilities, and professional development opportunities.
• Regional Leadership & Coordination: RT is committed to work with area stakeholders to create a “world class” transit system that supports livable communities and related efforts.
• Health and Safety: RT is committed to achieve an optimal level of safety for our employees, customers and the general public by minimizing risk of injury and property loss and promoting a sound safety culture throughout the organization.
• Sustainability: RT is committed to environmentally sensitive services and practices. Goals Fundamental Goals
• Ensure Financial Stability • Meet or Exceed Expectations for Safe & Quality Service in a Cost-Effective Manner • Operate in an Ethical Manner • Invest in the Attraction, Development & Retention of a Quality Workforce

9
FFiissccaall YYeeaarr 22001177--22001188 AAbbrriiddggeedd BBuuddggeett
Strategic Plan (continued) Growth Goals
• Improve Access Within and Between Communities in the Sacramento Region in a Cost-Effective Manner • Increase Transit Market Share in the Sacramento Region • Adjust to Legislative & Regulatory Changes and to Stakeholder & Community Initiatives, and Support
Complementary Efforts

10
FFiissccaall YYeeaarr 22001177--22001188 AAbbrriiddggeedd BBuuddggeett
Budget Process
RT uses the annual budget to help measure and account for taxpayer dollars. The budget, as adopted by the Board of Directors, authorizes RT to spend funds. It details how RT allocates tax resources to expenditures, and serves as a benchmark for evaluating accomplishments and assessing fiscal responsibility.

11
FFiissccaall YYeeaarr 22001177--22001188 AAbbrriiddggeedd BBuuddggeett
Voting System
RT is governed by an eleven-member Board of Directors. Six entities (5 cities and 1 county) make appointments to RT’s Board. Eight directors are appointed by “member entities” and represent jurisdictions annexed into RT’s district. Three directors are appointed by “participating entities” and represent jurisdictions that contract with RT to receive transit service. In January 2006, the RT Board directed staff to pursue legislation to change the voting system from a one-member-one-vote system to one that provides for weighted voting based upon the financial contribution made by each entity to RT. Assembly Bill 2137 established the new weighted voting system. The system creates 100 voting shares. RT allocates the shares to jurisdictions and their members as follows:
• Five shares to each annexed jurisdiction • Remaining shares to all jurisdictions based on financial contribution of Transit Development Act funds, funds
through contracts, other local funds, and federal funds On March 12, 2007, the RT Board of Directors adopted the new Schedule of Weighted Voting Distribution for the remainder of FY 2007. For all subsequent years, the Schedule is to be included in the proposed budget document and distributed to voting entities at least 60 days in advance of budget adoption. A summary of the tabulated vote shares adopted for the FY 2017 Budget and for the FY 2018 Proposed Abridged Budget is shown in the table below. A detailed FY 2018 Schedule of Weighted Voting is shown on the next page.
Vote Shares By Jurisdiction
Jurisdiction Status Shares - FY
2017 Budget Shares – FY
2018 Proposed
County of Sacramento Annex 42 41 City of Sacramento Annex 36 37 City of Rancho Cordova Annex 10 10 City of Citrus Heights Contract 5 5 City of Elk Grove Contract 4 4 City of Folsom Contract 3 3
Total 100 100

12
FFiissccaall YYeeaarr 22001177--22001188 AAbbrriiddggeedd BBuuddggeett
Voting System (continued)
Code Section:
102205(b)(6)
FY 17 Federal Funds Available in the
Sacramento MSA 37,432,440
102205(b)(7)
Allocation of Federal Funds to
jurisdictions other than RT 4,746,353
102205(b)(8)
FY 17 Federal Funds Available for
use in RT Service Area: 32,686,087
City of
Sacramento
County of
Sacramento
Rancho
Cordova Citrus Heights Folsom Elk Grove Totals:
102205(b)(10) Population:** 482,110 575,928 70,968 85,653 76,122 165,121 1,455,902
Proportionate Population: 33.11% 39.56% 4.87% 5.88% 5.23% 11.34% 100.00%
Member: Yes Yes Yes No No No
102100.2, 102100.3 4 3 1 1 1 1 11
102105.1(d)(2)(D)
Federal Funds Attributed to Entity
(Total Federal Funding x Share of
Population): 10,823,730 12,930,014 1,593,285 1,922,974 1,708,996 3,707,090 32,686,087
102105.1(d)(2)(A),
102205(b)(3)
FY 18 State TDA Funds Made
Available to RT: 22,779,863 25,770,579 3,353,262 0 0 0 51,903,704
102105.1(d)(2)(B),
102205(b)(4)
FY 18 Funds Provided Under
Contract: 397,688 50,000 289,818 3,334,877 1,182,729 350,000 5,605,112
102105.1(d)(2)(C),
102205(b)(5) FY 18 Other Local Funds 0 0 0 0 0 0 0
102105.1(d)(2) Total Financial Contribution: 34,001,281 38,750,593 5,236,365 5,257,851 2,891,725 4,057,090 90,194,903
102105.1(d)(2) Proportionate Financial Contribution: 37.70% 42.96% 5.81% 5.83% 3.21% 4.50% 100.00%
City of
Sacramento
County of
Sacramento
Rancho
Cordova Citrus Heights Folsom Elk Grove Totals:
102105.1(d)(1)
Incentive Shares (5 for member
jurisdictions) 5 5 5 0 0 0 15
102105.1(d)(2)
Financial Contribution Shares
(Proportionate Financial Share x
Remainder of 100 shares): 32.0429 36.5187 4.9348 4.9550 2.7252 3.8234 85.0000
102105.1(d)(3) Total Shares: 37.0429 41.5187 9.9348 4.9550 2.7252 3.8234 100.0000
102105.1(d)(4)(i) Shares After Rounding: 37 41 10 5 3 4 100
102105.1(d)(4)(i),
102105.1(d)(4)(ii)
Share Adjustment (To Ensure 100
Shares): 37 41 10 5 3 4 100
102105.1(d)(7)
Distribution of Shares Among
Members (Assuming All Members
Present to Vote):***
Member 1 10 14 10 5 3 4
Member 2 9 14 N/A N/A N/A N/A
Member 3 9 13 N/A N/A N/A N/A
Member 4 9 N/A N/A N/A N/A N/A
Member 5 N/A N/A N/A N/A N/A N/A
Total Votes: 37 41 10 5 3 4 100
* In addition to the funding identified above, RT projects the following funds for operating purposes: $39,755,998 - Measure A
** Population as measured by the population statistics used by SACOG to allocate TDA funds for the same fiscal year for which the budget is adopted.
*** If, in any vote allocation, any member would have more than 15 votes, that jurisdiction will be given an additional seat and the votes will be reallocated
to the larger number of members.
Fiscal Year 2018 Schedule of Weighted Voting Distribution
Base Values*
Federal Financial Information
Jurisdiction Specific Values
Voting Calculation

13
FFiissccaall YYeeaarr 22001177--22001188 AAbbrriiddggeedd BBuuddggeett
RT Major Goals and Objectives in FY 2018
• Operator Attendance Control – As part of the recent negotiations with the Amalgamated Transit Union (ATU), RT and ATU have agreed to work together to put into place new attendance control measures with the objective of reducing missed trips, improving customer service, reducing costs, streamline RT’s processes, and improving service reliability.
• Route Optimization Study (ROS) - Phase 1. With recent downward ridership trends, staff is working on a project to find ways to increase ridership. This project will have many phases and include extensive community engagement. The goal will be to re-imagine RT’s system to be consistent with current travel patterns, increase ridership, and reallocate any additional resources. The effort will also seek public input regarding the expansion and customer service priorities for RT with increases in funding.
• Paratransit Business Model – RT understands that lower costs means additional funding, which can be put into service improvements. Finding new ways to provide high quality service to the public, as well as individuals with disabilities, and seniors, in the most cost effective manner will ensure the sustainability of this critical service.
• IT Modernization – RT wants to be on the cutting edge of technology. Offering innovative rider tools to our customers will improve the customer experience by making it easier to ride, quicker to get train information, and provide for faster payment options, including a permanent mobile fare app; real time light rail train arrival information; smart card fare payment system; free Wi-Fi; expanded public information systems; and a secondary light rail warning system.
• Security Program – Phase 1. RT has been very focused on making our system more secure. This starts with additional staff presence on the trains and 24 hour monitoring in the security operations center. There will be increased inspections to reduce theft on the system and improved crime reporting statistics.
• Safety Program – Phase 1. Using technology to improve safety efforts is critical. Better training, and employee and community safety awareness is key. The goal will be to reduce the number of accidents per mile and reduce any findings and recommendations from the Public Utilities Commission (PUC).
• Strategic Communications – Ensuring that our customers can easily navigate RT’s bus and light rail system and understand how easy it is to pay and ride is critical to attracting new customers. This will involve launching new programs and incentive options that will encourage more people to try transit. This will be done through creative partnership and incentive programs. This effort will also serve to educate the general public regarding the benefits of transit to the community as a whole.
• Employee and Labor Relations – Salaries and benefits continue to be the largest cost factor for transit agencies, as this is the operational engine behind a successful system. Maintaining an open line of communication with our employees improves productivity and morale, which equates to new ideas and dedication that benefits all. We will develop our priorities and provide new forums for members to give feedback and listen to their concerns.
• Organizational Excellence and Culture Change – We are striving to be a “world class” organization that attracts and retains a quality workforce while providing the necessary training and mobility opportunities for employees to succeed. We will foster professional development and keep up with industry best practices. Motivation, partnership and teamwork will be a message that all employees will hear. All of this will help improve performance in areas such as increased revenues, reduced expenses, improved on time performance, increased inspection rates, and the creation of new jobs.

14
FFiissccaall YYeeaarr 22001177--22001188 AAbbrriiddggeedd BBuuddggeett
RT Major Goals and Objectives in FY 2018 (continued)
• Campus Master Plan – RT will examine ways to modernize our facilities. This will begin with a comprehensive plan to relocate all administrative staff to one central facility to improve communication. This will improve morale and efficiency.
• Transit Oriented Development – We are examining our various surplus properties to determine if they can be sold to developers that could use the land for purposes that encourage transit use and potentially increase our ridership.
• Sustainability and Business Process Optimization – RT has adopted new fiscal policies to improve its long-term financial position. We are dedicated to strengthening our finances by tapping innovative revenue sources and conducting relentless organizational optimization to fund maintenance and capital investments and to build reserves. Moving forward, we will continue to strive to find new ways to improve our business processes, keep expenses down, and generate opportunities to boost operating revenues. We are implementing a strategic effort to educate the public about the benefits of transit and how local funding is important to create a “world class” public transit system.

15
FFiissccaall YYeeaarr 22001177--22001188 AAbbrriiddggeedd BBuuddggeett
Operating Budget Summary
Revenues
FY 2018 Operating Revenue by Funding Source
Fare Revenue19%
Contract Services
4%
Other2%
State & Local56%
Federal19%
(Dollars in Thousands)
FY 2015 FY 2016 FY 2017 FY 2018
Actual Actual Budget Budget $ Change % Change
Fare Revenue 28,396$ 28,056$ 31,165$ 30,572$ (593)$ -1.9%Contract Services 5,810 6,110 6,092 5,605 (487) -8.0%
Other 4,002 78,493 4,840 3,578 (1,262) -26.1%
State & Local 77,394 34,097 86,110 90,516 4,406 5.1%
Federal 29,767 5,333 34,272 31,033 (3,239) -9.5%
Total 145,369$ 152,089$ 162,479$ 161,304$ (1,175)$ -0.7%
Operating Reserve* 1,446$ 1,095$
Operating Revenue 146,815$ 153,184$ 162,479$ 161,304$ (1,175)$ -0.7%
*Operating Reserve: Positive indicates use of the reserve. Negative indicates an increase in the reserve.
FY 2018 to FY 2017

16
FFiissccaall YYeeaarr 22001177--22001188 AAbbrriiddggeedd BBuuddggeett
Revenues (continued) Fare Revenue This category includes the revenues from carrying passengers. This is money paid by the transit riders to use transit services, but also include special transit fares from Los Rios Community College District (Los Rios) and California State University, Sacramento (CSUS) Student pass programs.
The FY 2018 Proposed Budget proposes $30.6 million in Fare Revenue, an decrease of $0.6 million (1.9%) from the FY 2017 Budget of $31.2 million.
• Fare Revenue is anticipated to decrease mainly due to the introduction of a 90-minute ticket, free ride days and to
reflect the current trend. • This also assumes a reduction in Transfer Agreement pay outs based on the recent trend.
Contracted Services This category includes contracts with the Cities of Citrus Heights, Elk Grove, Folsom, Rancho Cordova, as well as North Natomas shuttle services. These cities and service areas purchase RT transit services.
The FY 2018 Proposed Budget proposes $5.6 million in Contracted Services revenue, a decrease of $0.5 million (8.0%) from the FY 2017 Budget of $6.1 million.
• This reflects a reduction of $0.5 million in Folsom Light Rail Operating and Maintenance cost due to the change to
net billing for services as well as a result of true up calculation for FY 2016 billing. • This also reflects a decrease in the Granite Park contract of $0.1 million due to expiration of the contract. • This also reflects an increase of $0.1 million in Citrus Heights contract due to higher LTF allocation.
Other
This category includes investment income, commercial real estate leases, advertising income, bus book sales, fare evasion fines, promotional item sales, photo identification activities, and parking revenue.
The FY 2018 Proposed Budget includes $3.6 million in other revenue, which is a decrease of $1.3 million (26.1%) from the FY 2017 Budget of $4.9 million.
• The FY 2018 Proposed Budget includes a reduction in advertising revenue of $0.5 million due to removing revenue from Arena sponsorship agreement and replacing it with advertising revenue from light rail stations, and from interior and exterior light rail vehicles.
• This includes $0.2 million for the sale of Federal Renewable Identification Numbers for RT’s Compressed Natural Gas (CNG) Bio-Gas fuel and $1.0 million for the sale of Low Carbon Credits through the State Cap and Trade program.
• This proposal eliminates $0.65 million in revenue received from the CNG tax rebate program due to expiration of the program on December 31, 2016.

17
FFiissccaall YYeeaarr 22001177--22001188 AAbbrriiddggeedd BBuuddggeett
Revenues (continued) State & Local
This category includes formula-based allocations to RT from state and local government sales taxes. RT receives funding from the California Transportation Development Act Local Transportation Fund (TDA-LTF), the Transportation Development Act State Transit Assistance Program (TDA-STA), and Sacramento County Measure A.
The FY 2018 Proposed Budget proposes $90.5 million in state and local funding revenue, an increase of $4.4 million (5.1%) from the FY 2017 Budget of $86.1 million. • This reflects a 4.0% or $1.5 million increase in sales tax estimates for Measure A over the FY 2017 Budget. • This also reflects a 4.4% or $1.7 million increase in sales tax estimates for TDA-LTF. • This includes a 28.1% or $2.2 million increase in the TDA-STA Revenue compared to the FY 2017 Budget due to
$3.0 million in additional SB1 funds, and a $0.8 million reduction in the existing STA program due to lower diesel prices.
• This Budget assumes that Traffic Congestion Relief Program (TCRP) funds will be used for the annual Revenue Bond payment in the amount of $5.5 million.
• This includes $0.9 million in the Low Carbon Transit Operations Program (LCTOP) revenue, which is a State Cap and Trade program established in 2014 that provides funds to public transportation agencies throughout California for operations that reduce greenhouse gas emissions.
Federal This category includes formula-based allocations to RT from the federal government. Each year Congress authorizes the appropriation, and the FTA allocates the dollars to the region. RT can use the funds for operating, planning, and capital, subject to specific regulations.
The FY 2018 Proposed Budget proposes $31.0 million in federal funding, a reduction of $3.2 million (9.5%) from the FY 2017 Budget of $34.3 million. • This includes $0.8 million in Congestion Mitigation Air Quality (CMAQ) revenue for South Line Phase 2, which is a
$1.2 million reduction over FY 2017. • This includes $1.0 million in Job Access/Reverse Commute funding, which is an increase of $0.5 million over FY
2017. • $1.0 million of limited-time grant revenues associated with the Sacramento Energy Clean Air Transportation
Program (SECAT) was used in FY 2017. This funding source is not available for FY 2018. • Section 5307 Urbanized Area federal funding is projected to decrease 5% compared to last year. • Section 5337 State of Good Repair funding is projected to decrease 5% compared to last year.

18
FFiissccaall YYeeaarr 22001177--22001188 AAbbrriiddggeedd BBuuddggeett
Expenses
FY 2018 Operating Expenses by Expense Category
Salaries & Benefits
68%
Professional Services
14%
Materials & Supplies
6%
Utilities4%
Insurance & Liability
5%
Other3%
(Dollars in Thousands)
FY 2015 FY 2016 FY 2017 FY 2018
Actual Actual Budget Budget $ Change % Change
Salaries & Benefits 96,267$ 102,133$ 107,805$ 109,879$ 2,074$ 1.9%
Professional Services 26,338 27,861 28,273 23,499 (4,774) -16.9%
Materials & Supplies 8,556 7,823 8,450 9,041 591 7.0%
Utilities 5,816 6,288 6,711 6,762 51 0.8%
Insurance & Liability 7,906 7,160 9,057 7,839 (1,218) -13.4%
Other 1,932 1,919 2,183 4,284 2,101 96.2%
Operating Expenses 146,815$ 153,184$ 162,479$ 161,304$ (1,175)$ -0.7%
FY 2018 to FY 2017

19
FFiissccaall YYeeaarr 22001177--22001188 AAbbrriiddggeedd BBuuddggeett
Expenses (continued) Salaries & Benefits This category includes payroll and benefits for all positions authorized by the Board of Directors. It accounts for wages, overtime, pension, dental, medical, FICA, vision, and all other RT-paid employee benefits.
The FY 2018 Proposed Budget proposes $109.9 million for salaries and benefits, an increase of $2.1 million (1.9%) from the FY 2017 Budget of $107.8 million.
• The Fiscal Year 2018 Proposed Budget includes funding for 1039 full time funded positions, which is an increase of 34 funded positions from the Fiscal Year 2017 Budget of 1005 funded positions. See Positions section on page 21 for details.
• Total salaries, overtime and personal service contract costs increased by $4.0 million (6.9%) from the FY 2017 Budget of $57.9 million. This reflects various District position salary adjustments, salaries for new positions, increase in overtime cost based on higher wages. This also reflects cost of additional 34 funded positions as well as 25 personal service contractors to move security services in house and to bring Student interns.
• Fringe Benefits cost decreased by $2.2 million (4.1%) from the FY 2017 Budget of $53.1 million. This reflects increases of 0.6 million in pension costs, decreases of $0.2 million in medical costs, decrease of 3.1 million in post-retirement benefits, decrease of $0.4 million in unemployment cost, increase of $0.5 million in vacation and sick leave accrual, etc.
• Capital recovery and indirect costs have decreased by $0.1 million over the FY 2017 Budget. This represents labor charged to capital projects and other initiatives such as the Connect Card Consortium.
Professional Services
This category includes purchased transportation (ADA paratransit) to comply with the Americans with Disabilities Act (ADA), transit security, equipment maintenance, facilities maintenance, legal services, and services provided by outside consultants.
The FY 2018 Proposed Budget proposes $23.5 million for Professional Services, a reduction of $4.8 million (16.9%) from the FY 2017 Budget of $28.3 million. • This reflects a decrease in ADA paratransit cost of $3.3 million due to business optimization improvements. • This includes a $2.2 million decrease in security services cost due to bringing security services in-house. • There are other minor increases in various general ledger (GL) accounts that make up the difference.
Materials & Supplies This category includes fuel, bus and light rail parts, small maintenance tools and equipment, cleaning supplies, printing materials, and general office supplies.
The FY 2018 Proposed Budget proposes $9.0 million for materials and supplies, an increase of $0.6 million (7.0%) from the FY 2017 Budget of $8.4 million. • This reflects an increase in CNG cost of $0.8 million. • This also includes a $0.3 million reduction in bus parts due to new buses. • There are other minor increases in various general ledger (GL) accounts that make up the difference.

20
FFiissccaall YYeeaarr 22001177--22001188 AAbbrriiddggeedd BBuuddggeett
Expenses (continued) Utilities This category includes electricity, water, gas, refuse, and telephone for bus, light rail, and administrative facilities.
The FY 2018 Proposed Budget proposes $6.8 million for Utilities, an increase of $0.1 million (0.8%) from the FY 2017 Budget of $6.7 million. • This includes increases in costs for water, sanitation, and communications.
Insurance & Liability This category includes premiums, claims, and attorney fees related to personal liability insurance, property damage insurance, workers’ compensation claims, and commercial insurance for amounts in excess of self-insured amounts.
The FY 2018 Proposed Budget proposes $7.8 million for Insurance & Liability, a decrease of approximately $1.2 million (13.4%) from the FY 2017 Budget of $9.0 million. • This reflects a decrease of $0.6 million in the projected claims reserves for Property and Liability for FY 2018. • This also reflects a decrease of $0.3 million in the projected claims reserves for Workers’ Compensation for FY
2018. • This reflects the updated insurance premium costs.
Other This category includes but is not limited to travel and training, seminars, dues and subscriptions, awards and ceremonies, building leases, equipment leases, taxes, freight, advertising, legal notices, and bad debt.
The FY 2018 Proposed Budget proposes $4.3 million for other expenditures, an increase of $2.1 million (96.2%) from the FY 2017 Budget of $2.2 million. • This includes $1.1 million in Connect Card fees, which is RT’s portion of running the Connect Card Regional
Service Center. About half of this cost is offset by Connect Card labor recovery. • This reflects an increase of $0.1 million in property taxes. • This also reflects creation of Budget Stabilization account with a balance of $0.45 million in order to address the
reserve shortfall, per the adopted Reserve Policy.

21
FFiissccaall YYeeaarr 22001177--22001188 AAbbrriiddggeedd BBuuddggeett
Positions
The Fiscal Year 2018 Proposed Budget includes 1,039 fully or partially funded positions, which is an increase of 34 funded positions from the Fiscal Year 2017 Adopted Budget of 1,005 funded positions.
Office of the
General Manager
0.3%
Office of the
Chief Counsel
1.1%
VP,
Accountability &
Performance
1.8%
VP, Transit
Services/COO
77.7%
VP,
Administration
2.4%
VP, Strategic
Planning &
System
Development
4.5%
VP, Finance/CFO
2.5%
VP,
Communications
& Partnerships
2.7%
VP, Security &
Safety
7.0%
FY 2015 FY 2016 FY 2017 FY 2018
Division Funded Funded Funded Funded
Office of the General Manager 4 17 6 3
Office of the Chief Counsel 10 18 16 11
VP, Accountability & Performance 0 0 4 19
Facilities & Business Support Services 86 85 0 0
VP, Transit Services/COO 790 792 779 807
VP, Administration 27 0 73 25
VP, Strategic Planning & System Development 23 19 57 47
VP, Finance/CFO 26 25 0 26
Planning & Transit System Development 24 24 0 0
VP, Communications & Partnerships 27 26 33 28VP, Security & Safety 0 0 37 73
Total 1,017 1,006 1,005 1,039

22
FFiissccaall YYeeaarr 22001177--22001188 AAbbrriiddggeedd BBuuddggeett
Positions (continued)
From FY 2017 to FY 2018, the district had a net increase of 34 funded positions. During FY2017, continued GM organizational optimization activities were conducted to realign some departments and divisions. The changes reflected in the FY 2018 proposed budget are as follows: General Manager Division had a net decrease of 3 funded positions. The position changes are as follows:
o Transferred total of 3 positions in Safety to VP, Security and Safety Division. o Swapped 1 Deputy General Manager/CEO with a to-be-determined VP position.
Chief Counsel Division had a net decrease of 5 funded positions. The position changes are as follows:
o Transferred total of 4 positions in Labor Relations to VP, Administration Division. o Swapped 1 Attorney III in Legal with Internal Accountability Auditor in Quality Assurance.
VP, Accountability and Performance Division had a net increase of 15 funded positions. The position changes are as follows:
o Added 1 Internal Accountability Auditor in Quality Assurance (swapped from Attorney III). o Transferred total of 6 positions in Accessible Services from VP, Communications and Partnerships Division. o Transferred total of 7 positions in Service Planning from VP, Strategic Planning and System Development Division. o Added 1 Director, Planning (swapped from Director, Long Range Planning).
VP, Transit Services/Chief Operating Officer (COO) Division had a net increase of 28 funded positions. The position changes are as follows:
o Added 1 Deputy Chief Operating Officer in VP, Transit Services/COO Division o Funded 3 positions: 1 Operations Trainer, 1 Bus Service Worker, and 1 Mechanic A Body/Fender. o Unfunded total of 4 positions: 1 Administrative Assistant II in Bus Transportation, 1 Maintenance Superintendent –
Bus in Bus Maintenance, 1 Rail Maintenance Worker – HLC in Light Rail, and 1 Director, Community Bus Services in Community Bus Service.
o Transferred total of 14 positions in Information Technology from VP, Administration Division and unfunded 2 positions: 1 Senior Programmer Analyst and 1 IT Software Technician.
o Transferred 2 Materials Management Superintendent and 10 Storekeepers to Bus Maintenance and Light Rail Department from Procurement.
o Converted 5 funded Light Rail Services Workers to Facilities Service Workers. Additionally, the Board authorized to add and fund 3 Facilities Service Workers.
o Converted 1 Maintenance Supervisor-Wayside and 2 Rail Laborer to 3 Rail Maintenance Workers and unfunded 1 Rail Maintenance Worker.
VP, Administration Division had a net decrease of 49 funded positions due to GM reorganization that split into two divisions: VP, Administration and VP, Finance/Chief Financial Officer (CFO). The position changes are as follows:
o Transferred 1 Senior Administrative Assistant to VP, Finance/CFO Division. o Transferred total of 4 positions in Labor Relations from Chief Counsel Division and unfunded 1 Senior Labor
Relations Analyst in Labor Relations. o Transferred total of 15 positions in Finance and 7 positions in Office Management and Budget to VP, Finance/CFO
Division. o Transferred total of 16 positions in Information Technology to VP, Transit Services/COO Division. o Transferred total of 2 Materials Management Superintendents and 10 Storekeepers in Procurement to VP, Transit
Service/COO Division. o Unfunded 1 Director, Procurement Services in Procurement.
23
FFiissccaall YYeeaarr 22001177--22001188 AAbbrriiddggeedd BBuuddggeett
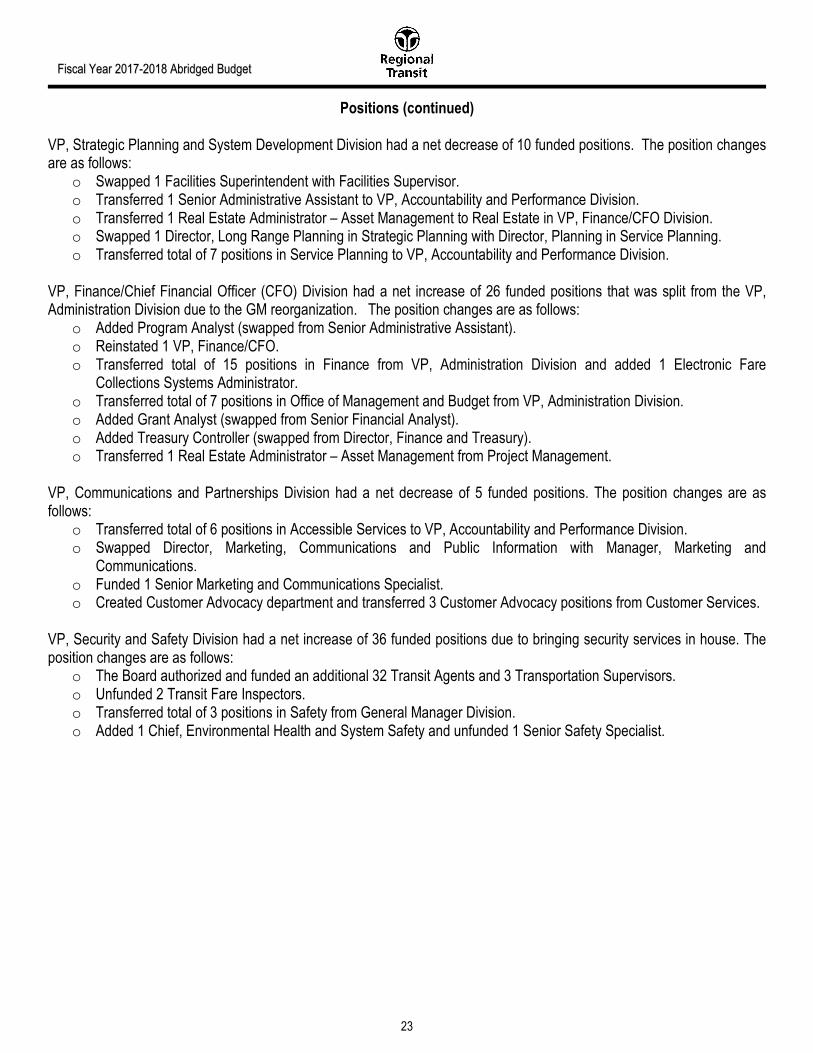
Positions (continued) VP, Strategic Planning and System Development Division had a net decrease of 10 funded positions. The position changes are as follows:
o Swapped 1 Facilities Superintendent with Facilities Supervisor. o Transferred 1 Senior Administrative Assistant to VP, Accountability and Performance Division. o Transferred 1 Real Estate Administrator – Asset Management to Real Estate in VP, Finance/CFO Division. o Swapped 1 Director, Long Range Planning in Strategic Planning with Director, Planning in Service Planning. o Transferred total of 7 positions in Service Planning to VP, Accountability and Performance Division.
VP, Finance/Chief Financial Officer (CFO) Division had a net increase of 26 funded positions that was split from the VP, Administration Division due to the GM reorganization. The position changes are as follows:
o Added Program Analyst (swapped from Senior Administrative Assistant). o Reinstated 1 VP, Finance/CFO. o Transferred total of 15 positions in Finance from VP, Administration Division and added 1 Electronic Fare
Collections Systems Administrator. o Transferred total of 7 positions in Office of Management and Budget from VP, Administration Division. o Added Grant Analyst (swapped from Senior Financial Analyst). o Added Treasury Controller (swapped from Director, Finance and Treasury). o Transferred 1 Real Estate Administrator – Asset Management from Project Management.
VP, Communications and Partnerships Division had a net decrease of 5 funded positions. The position changes are as follows:
o Transferred total of 6 positions in Accessible Services to VP, Accountability and Performance Division. o Swapped Director, Marketing, Communications and Public Information with Manager, Marketing and
Communications. o Funded 1 Senior Marketing and Communications Specialist. o Created Customer Advocacy department and transferred 3 Customer Advocacy positions from Customer Services.
VP, Security and Safety Division had a net increase of 36 funded positions due to bringing security services in house. The position changes are as follows:
o The Board authorized and funded an additional 32 Transit Agents and 3 Transportation Supervisors. o Unfunded 2 Transit Fare Inspectors. o Transferred total of 3 positions in Safety from General Manager Division. o Added 1 Chief, Environmental Health and System Safety and unfunded 1 Senior Safety Specialist.

24
FFiissccaall YYeeaarr 22001177--22001188 AAbbrriiddggeedd BBuuddggeett
Capital Improvement Plan
Project Overview
The following tables and chart represent the Capital Budget as it pertains to the FY 2018 Budget for the projects listed. The full five-year Capital Improvement Program (CIP) will be adopted by a separate Board action and will cover capital funding priorities between fiscal years 2018 through 2022, and beyond to 2048.
Please keep in mind the amounts contained in the FY 2018 Proposed Budget only pertain to items where anticipated funding sources have been identified and are programmed for FY 2018. There are other capital needs that were outlined during the February strategic planning session where funding has yet to be identified. The FY 2018 Capital Budget includes projects focused on the following priority programs: Project Development 230 Northeast Corridor Enhancements (Phase 1) 410 Blue Line to Cosumnes River College R055 Light Rail Station at Dos Rios R135 Light Rail Station at Horn R327 Green Line SVS Loop S030 Downtown/Riverfront Streetcar Project (Small Starts)
Fleet Program
P009 Paratransit Vehicle Replacement - CNG Project R115 Siemens 1st Series Fleet Replacement (26)
Infrastructure Program
R336 Light Rail Station Enhancements Facilities Program R347 Watt I-80 Elevator Equipment Program M009 Radio Communications System Upgrade Transit Security & Safety R344 Enhanced Employee Protection Warning System T054 Security, Systems and Communications Infrastructure Upgrade

25
FFiissccaall YYeeaarr 22001177--22001188 AAbbrriiddggeedd BBuuddggeett
Impact of Capital Improvements on the Operating Budget Capital projects that are approved in the current year budget will impact future operating and capital budgets as follows:
1. Capital projects completed in the current year will require on-going maintenance and, in case of new service lines, additional and on-going operating costs.
2. Capital projects that are not completed in the current year will require additional capital funding that may require
balancing with operating funding if additional capital funds are not available. 3. Capital projects that are not completed in the current year will affect future years’ budgets with increased operating
costs in the year of completion. Future on-going operating and maintenance costs are projected using current year baseline dollars.

26
FFiissccaall YYeeaarr 22001177--22001188 AAbbrriiddggeedd BBuuddggeett
Capital Improvements by Category
CarryOver Funding
24%
Equipment Program
0%
Facilities Program
0%
Fleet Program4%
Project Development
71%
Transit Security & Safety
1%
Category FY2018 Proposed
Project Development 209,733$ 71.1%
Fleet Program 11,097 3.8%
Facilities Program 900 0.3%
Equipment Program 973 0.3%
Transit Security & Safety 1,289 0.4%
Carryover Funding 71,139 24.1%
Grand Total 295,131$ 100%
$ in Thousands

27
FFiissccaall YYeeaarr 22001177--22001188 AAbbrriiddggeedd BBuuddggeett
Capital Improvement Revenues and Expenditures
PROGRAM PROJECT NAME CARRYOVER
FUNDING
FEDERAL STATE LOCAL FY 2018
PROJECT
BUDGET
Project Development
230 Northeast Corridor Enhancement 93,074 5,100,000 5,193,074
404 Green Line to the River District 187,709 187,709
410 South Sacramento Phase 2 LR 26,725,864 7,900,000 300,000 34,925,864
F Amtrak / Folsom Project 52,420 52,420
R055 Light Rail Station at Dos Rios 29,479 500,000 300,000 829,479
R135 Light Rail Station at Horn 104,696 500,000 500,000 1,104,696
R322 Green Line Draft EIS/EIR and Project Development 643,307 643,307
R327 Green Line SVS Loop 632,000 632,000 1,264,000
R345 CPID - Station Planning 349,178 349,178
S010 Sacramento-West Sacramento Streetcar Starter Line 4,064,464 4,064,464
S030 Downtown/Riverfront Streetcar Project (Small Starts) 5,998,690 100,000,000 55,000,000 39,001,310 200,000,000
38,880,881 101,000,000 68,632,000 40,101,310 248,614,191
Fleet Program
651 Siemens LRV Mid-Life Overhaul 2,521,612 2,521,612
B139 40' CNG Bus Replacement Procurement 10,352 10,352
B141 Non-Revenue Vehicles - P1B Restricted 1,616,818 1,616,818
B142 Neighborhood Ride Vehicle Replacement (14) 901,988 901,988
B143 Fare Box Replacements 100,972 100,972
B144 BMF CNG Fueling Facility Upgrades 320,553 320,553
B146 Update Bus Design Guidelines 6,138 6,138
F015 Facilities New Freedom Tasks-Add Mini-Hi's 460,960 460,960
G225 Non-Revenue Vehicle Replacement 158,075 158,075
P007 Paratransit Vehicles-CNG-Rep 157,006 157,006
P009 Paratransit Vehicle Replacement - CNG Project - 7,297,205 7,297,205
R001 CAF/Siemens LRV Painting/Exterior Work 751,494 751,494
R085 UTDC LRV Retrofit and Mid Life Refurbishment 2,000,876 2,000,876
R086 UTDC LRV Retrofit and Mid-Life Refurbishment 501,983 501,983
R115 Siemens 1st Series Fleet Replacement (26) - 3,800,000 3,800,000
9,508,827 - 11,097,205 - 20,606,032
FUNDING ADDITIONS
* Project S030 is not a SacRT project. Project owners include City of Sacramento and West Sacramento.
*

28
FFiissccaall YYeeaarr 22001177--22001188 AAbbrriiddggeedd BBuuddggeett
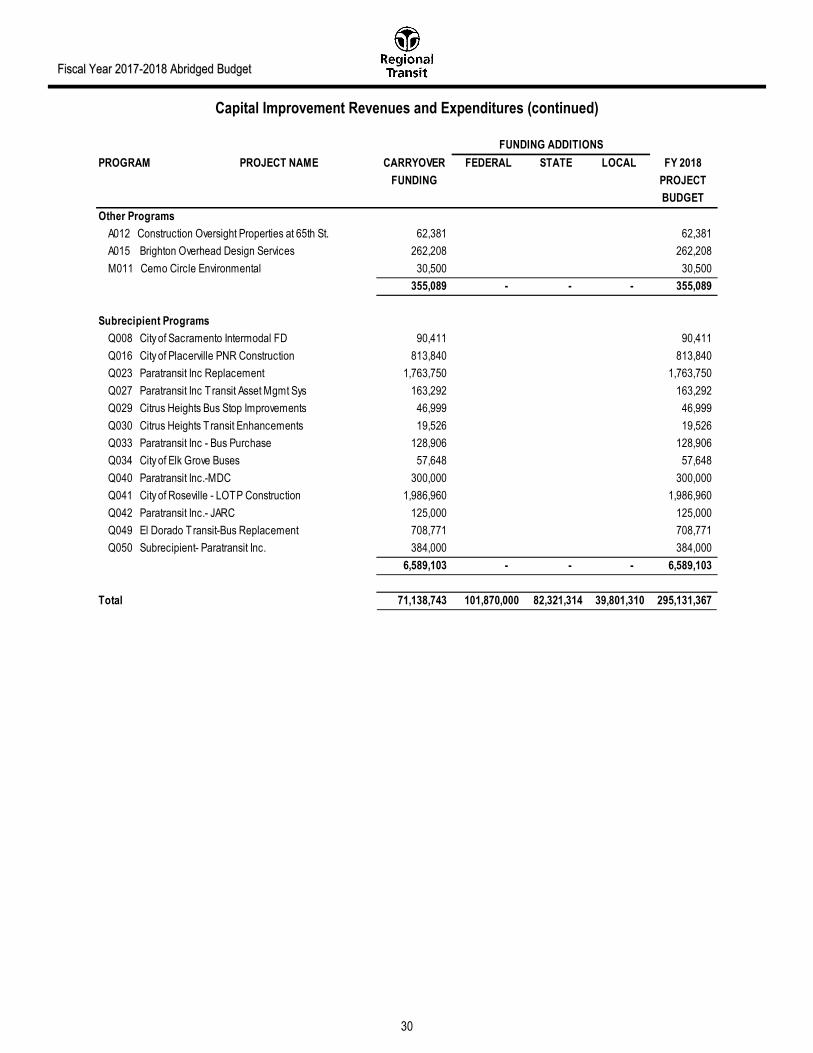
Capital Improvement Revenues and Expenditures (continued)
PROGRAM PROJECT NAME CARRYOVER
FUNDING
FEDERAL STATE LOCAL FY 2018
PROJECT
BUDGET
Infrastructure Program
A001 Watt Avenue / Highway 50 Project Support 1,376 1,376
A005 City College Pedestrian/Bicy 1,683 1,683
A006 Natoma Overhead Widening Project 85,697 85,697
A007 Easton Development Grade Crossing 28,474 28,474
A013 7th & G OCS Pole Relocation 4,601 4,601
G237 Across the Top Systems Modification 56,941 56,941
G238 Repairs per Biennial Bridge Inspection 43,384 43,384
M002 University/65th Street Transit Center Relocation 172,702 172,702
R010 Light Rail Crossing Enhancements 36,089 36,089
R280 Signal - Improve. for Future Gold Line Limited Stop 3,085,726 3,085,726
R334 Rail Capital Maintenance-State of Good Repair 134,122 134,122
R336 Light Rail Station Enhancements 2,119,053 300,000 (300,000) 2,119,053
5,769,848 - 300,000 (300,000) 5,769,848
Facilities Program
4005 Butterfield/Mather Mills LR Station Rehabilitation 12,436 12,436
4007 ADA Transition Plan Improvements 345,303 345,303
715 Bus Maintenance Facility #2 (Phase 1&2) 2,821,281 2,821,281
A002 Louis Orlando Transit Center 1,008 1,008
A010 Louis Orlando - Construction 167,667 167,667
B134 Fulton Ave. Bus Shelters 161,888 161,888
B147 Bus Maintenance Management Program 101,924 101,924
F018 Rancho Cordova Landscaping 13,119 13,119
F019 Rancho Cordova Utility Building Enhancements 220,406 220,406
F021 General Facilities Improvements 34,227 34,227
F022 RT Police Substation Relocation 6,656 6,656
F023 Engineering Front Glass Replacement 12,300 12,300
F025 Office Relocation: Bell Building to 1225 R Street 232,759 232,759
F026 Mold Remediation--Engineering Bldg. 90,200 90,200
F027 Metro Roof Replacement 346,603 346,603
R175 Watt / I-80 Station Improvements 14,853 14,853
R313 29th Street Light Rail Station Enhancements 232,133 232,133
R323 Retrofit Light Rail Vehicle (LRV) Hoist 1,070 1,070
R340 LRV Train Wash Replacement 777,072 777,072
R347 Watt I-80 Elevator - 900,000 900,000
5,592,905 - 900,000 - 6,492,905
Equipment Program
F024 Chiller Control Replacement 232,722 232,722
M009 Radio Communications System Upgrade 1,031,709 973,064 2,004,773
R341 Fare Vending Machines 40,999 40,999
R342 T ire Lease Disposal 26,319 26,319
R343 Whiting In-Floor Hoist Inspection and Repair 94,760 94,760
1,426,509 - 973,064 - 2,399,573
FUNDING ADDITIONS

29
FFiissccaall YYeeaarr 22001177--22001188 AAbbrriiddggeedd BBuuddggeett
Capital Improvement Revenues and Expenditures (continued)
PROGRAM PROJECT NAME CARRYOVER
FUNDING
FEDERAL STATE LOCAL FY 2018
PROJECT
BUDGET
Transit Technologies Program
964 Trapeze Implementation (TEAMS) 15,445 15,445
G035 Fiber/50-Fig Installation, Maintenance, & Repair 62,369 62,369
T004 Connect Card Light Rail Platform Preparations 109,928 109,928
T017 Audio Light Rail Passenger Information Signs 359,701 359,701
T030 Revenue Center Security Camera Upgrade 25,364 25,364
T041 Upgrade for Connect Card 35,000 35,000
T046 Connect Card Implementation-Consultant (Part 2) 2,396 2,396
T050 Upgrades to Transit Security Systems 15,480 15,480
T051 Telephone System Replacement 305,250 305,250
T052 Track Warrant Controlled Access Sys 187,450 187,450
1,118,383 - - - 1,118,383
Transit Security & Safety
G105 Bus Automated Vehicle Location System 2,282 2,282
H021 Emergency Power Generator Enhancement 120,666 120,666
R344 Enhanced Employee Protection Warning System - 870,000 870,000
T005 CPUC General Order 172 - LVR Camera 43,365 43,365
T006 LRV System AVL Equipment 86,897 86,897
T008 Completion Fiber Optics Communications Backbone 44,066 44,066
T010 Light Rail Facility Hardenin 4,927 4,927
T013 Staff Security Training - Overtime/Backfill 1,380 1,380
T018 Building Access System Upgrade 104,021 104,021
T022 Handheld Smart Card Reader 38,374 38,374
T025 Surveillance and Security Facilities Enhancement 242,204 242,204
T026 WiFi Security Systems Enhancement 15,158 15,158
T027 Video Surveillance System Upgrades 35,473 35,473
T029 Upgrade Bus Fleet Digital Video Recorders 8,062 8,062
T034 Computer Aided Dispatching System 70,765 70,765
T036 Facil. Safety, Security and Commun. Infrastr. upgrades 354,187 354,187
T038 Upgrades to Security Video and Data Systems 89,285 89,285
T043 Emergency Drills 46,448 46,448
T045 Security Operations Center 3,427 3,427
T048 Anti-Terrorism Directed Patrols 22,168 22,168
T054 Security, Systems and Commu. Infra. Upgrade - 419,045 419,045
1,333,155 870,000 419,045 - 2,622,200
Planning/Studies
A008 Regional Bike Share Program 100,000 100,000
A009 Folsom Streetscape 42,316 42,316
M012 Route Optimization 212,370 212,370
R335 Watt/I-80 Transit Center Master Plan 209,357 209,357
564,043 - - - 564,043
FUNDING ADDITIONS
30
FFiissccaall YYeeaarr 22001177--22001188 AAbbrriiddggeedd BBuuddggeett
Capital Improvement Revenues and Expenditures (continued)
PROGRAM PROJECT NAME CARRYOVER
FUNDING
FEDERAL STATE LOCAL FY 2018
PROJECT
BUDGET
Other Programs
A012 Construction Oversight Properties at 65th St. 62,381 62,381
A015 Brighton Overhead Design Services 262,208 262,208
M011 Cemo Circle Environmental 30,500 30,500
355,089 - - - 355,089
Subrecipient Programs
Q008 City of Sacramento Intermodal FD 90,411 90,411
Q016 City of Placerville PNR Construction 813,840 813,840
Q023 Paratransit Inc Replacement 1,763,750 1,763,750
Q027 Paratransit Inc T ransit Asset Mgmt Sys 163,292 163,292
Q029 Citrus Heights Bus Stop Improvements 46,999 46,999
Q030 Citrus Heights T ransit Enhancements 19,526 19,526
Q033 Paratransit Inc - Bus Purchase 128,906 128,906
Q034 City of Elk Grove Buses 57,648 57,648
Q040 Paratransit Inc.-MDC 300,000 300,000
Q041 City of Roseville - LOTP Construction 1,986,960 1,986,960
Q042 Paratransit Inc.- JARC 125,000 125,000
Q049 El Dorado Transit-Bus Replacement 708,771 708,771
Q050 Subrecipient- Paratransit Inc. 384,000 384,000
6,589,103 - - - 6,589,103
Total 71,138,743 101,870,000 82,321,314 39,801,310 295,131,367
FUNDING ADDITIONS

31
FFiissccaall YYeeaarr 22001177--22001188 AAbbrriiddggeedd BBuuddggeett
Capital Project Funding Addition Descriptions
230 This project includes enhancements that will allow RT to operate limited stop service in the Northeast Corridor. The project's estimate completion date is June 2023.
410 By the end of FY18, this project will have extended light rail from Meadowview Station further south to Cosumnes
River College (CRC). Remaining activities include the procurement of fare vending machines and passenger information and security features and the relocation of a traction power substation and relay case.
M009 This project allows for the replacement of radio communication equipment, as needed. Additionally, it phases in the
Sacramento Regional Radio Communications System upgrades (P25 upgrade) with final implementation by June 2019.
P009 Thirty-four vehicles will be purchased between the start of FY18 and August 2019 to replace vehicles at the end of
their useful lives. R055 Funding is being used to design and build a light rail station on the Northeast Corridor between North B Street and
Richards Blvd. on North 12th Street in downtown Sacramento. The completion date is to be determined. R115 Replace the (26) 1st Series Siemens vehicles at the end of their engineered life. R135 The construction of this new light rail station near Horn Road and Folsom Boulevard by June 2021 will bridge the
distance between Butterfield and Mather Field LR Stations. R327 This final design and construction phase of the Green Line SVS loop including K St. to H St. improvements will be
completed by June 2020. R336 This is a phased project to improve light rail stations district wide. R344 This project will develop and deploy a fully operational safety technology system that enhances employee-
protection warning systems and roadway worker protection. With a completion date of June 2020, it will meet a PUC deadline for implementation of redundant protections for roadway work groups.
R347 Both Watt I-80 elevators will be replaced under this project. S030 The project is a partnership between SACOG, Regional Transit, Yolo County Transit District, City of Sacramento
and the City of West Sacramento. It will add a 5.25 mile Downtown Riverfront Streetcar System. Anticipated completion date is September 2022.
T054 The project, completed by March 2019, will enhance safety and security features at all RT's operational and
business facilities, as well as provide upgraded communications and data systems including the conversion to an electronic citation process.