sachin;s interim report
DESCRIPTION
This is an interim report regarding the project Sachin and his team is dealing with. The project is about traffic analysis and thus congestion control.TRANSCRIPT

TRAFFIC DENSITY DEDUCTION
USING VIDEO ANALYSIS
Main Project Interim Report
Submitted by
Sachin Sajan George
DEPARTMENT OF COMPUTER SCIENCE & ENGINEERING
Rajagiri School of Engineering & Technology
Rajagiri Valley, Kakkanad, Kochi- 39
OCTOBER 2015

i
RAJAGIRI SCHOOL OF ENGINEERING & TECHNOLOGY
RAJAGIRI VALLEY, KAKKANAD, KOCHI- 39
CERTIFICATE
Certified that this is a Bonafide Record of the project work on Traffic Density Deduction using
Video Analysis done by Sachin Sajan George University registration number 12012676 during
semester Seven of Computer Science and Engineering in partial fulfillment of the requirement
for the award of degree of Bachelor of Technology in Computer Science and Engineering of the
Mahatma Gandhi University, Kottayam, during the academic year 2015-2016
Project Guide Head of the Department
Project Coordinator

ii
ACKNOWLEDGEMENT
I am grateful to the almighty God for his blessings and for helping me complete this
project successfully.
I would like to thank the management and Dr. A. Unnikrishnan, Principal for providing
me with all the necessary facilities including a very well furnished lab. I would also like to thank
Mr. Ajit S., Head of the Department of Computer Science and Engineering for his
encouragement to do this work. I am also grateful to our guide Ms. Tripti C., Asst. Professor,
Department of Computer Science and Engineering for her guidance throughout the course of the
work.
I also thank the faculty and non-faculty staff of Department of Computer Science and
Engineering for helping me in some way or the other. Last but not the least I thank all my
classmates in S7 CSE for helping me with their valuable suggestions and their whole hearted
support.

iii
ABSTRACT
Roads of cities are getting crowded due to the increasing number of vehicles day by day.
The latest technology has facilities to manage this problem in the most beautiful manner
improving life of common people, thus allowing them to travel safely on roads and reach their
destinations at the appropriate time without getting in traffic jams. Reducing traffic can save
time, money and fuel and in time create a cleaner, greener city. This project aims to create an
open-source solution to traffic density by having a video analytical based study and the result can
be used for effective traffic management. Although the proposed technology exists in other
countries, it is yet to be implemented in this very state and is seldom used throughout the
country.

iv
TABLE OF CONTENTS
ACKNOWLEDGEMENT ii
ABSTRACT iii
LIST OF FIGURES v
1 Introduction
1.1 Problem Statement
1.2 Problem Scope and Objective
1.3 Design and Implementation Constraints
1.4 Assumptions and Dependencies
1.5 Development Method
1
1
1
2
2
3
2 Related Work 4
3 System Specification
2.1 Use Cases
2.2 Non-functional Requirements
14
14
17
2 System Design
3.1 Structural Design
3.2 External Interface Design
3.3 Component Level Diagram
3.3.1 Hardware and Software Requirements
18
18
22
23
23
5 Project Schedule and Major Milestones 25
6 Risks and Challenges 28
7 Glossary 29
8 Bibliography 30

v
LIST OF FIGURES
Figure 1.1: The iterative waterfall model 3
Figure 2.1: Detecting a reference using feature extraction and matching 7
Figure 2.2: Blob Analysis 8
Figure 2.4: Overview of Cascade Classifiers 9
Figure 2.3: The moving pixels detected from the video frame above are shown in white 11
Figure 3.1: Activity Diagram of the project 16
Figure 4.1: Use Case diagram of the first stage of the project 19
Figure 4.2: Use Case diagram of the second stage of the project 20
Figure 4.3: Activity Diagram of the project 21
Figure 4.4: Sample GUI 22
Figure 5.5: Deployment Diagram 23
Figure 5.1: Milestone Chart of the project 25
Figure 5.2: Gantt-Chart of Phase I 26
Figure 5.3: Gantt-Chart of Phase II 27

CS010 710 Main Project Interim Report Department of Computer Science and Engineering
Rajagiri School of Engineering and Technology, Kochi -39
© University Register Number: 12012676 1 Traffic Density Deduction using Video Analysis
1. INTRODUCTION
1.1. Problem Statement
Kerala, Gods own country, with its highest literacy rate aims to become the most
developed state of India in the field of business as well as research. The growth in population and
emerging needs of the people from various cultures demand Cochin, the metropolitan city of
Kerala, to be the center of attraction for business.
Transportation forms the backbone for business development. But the roads of Cochin
city have high density of vehicles and becomes very difficult to manage. Traffic on road and the
delay caused by traffic jams cause stress to people. It is hard to manage the vehicles individually.
This leads to the demand of having an efficient mechanism to manage vehicles on road, avoiding
traffic jams and accidents leading to safer lives on road.
1.2. Project Scope and Objective
Cochin city, being a part of the Gods own country, is envisioned to have facilities with
the latest technology, improving life of the common man and allowing everyone to have a
peaceful and stress free life. The people can travel safely on road and reach at the appropriate
place at the appropriate time without getting in traffic jams.
Reducing traffic can save time, money and fuel and in turn create a cleaner, greener city.
This reduces both the pollution of the mind by stress and the environment by harmful gases.
The theme falls under Public infrastructure and utilities (Urban mobility and traffic
management) and Digital Infrastructure (Better connectivity for better service).
The proposed system aims at reducing traffic congestion at inter-junctions by providing a
video analytical based study to determine the density of vehicles in a region. It is hard to manage
the vehicles individually, i.e., surveillance of a mass of cars rather than individual surveillance is
more efficient

CS010 710 Main Project Interim Report Department of Computer Science and Engineering
Rajagiri School of Engineering and Technology, Kochi -39
© University Register Number: 12012676 2 Traffic Density Deduction using Video Analysis
This project may be extended to traffic re-routing and augmented reality supported windshields
for providing drivers with re-routing information.
1.3. Design and Implementation Constraints
The system performs video analysis on live feed from traffic cameras at inter-junctions or
specifically fit cameras that provide live feed. The video analysis is done it to split it into frames
and get the count of vehicles to calculate density.
Large objects, such as birds near to the camera can affect video feed providing erroneous results.
In case of rain, the video feed might be blurred and would not provide solid feed to the system
for effective computation. Rain and other weather can also cause damage to the camera.
Government rules prohibit us from using the live camera feed from the speed and
detection camera. Analysis on blurred feed might be tough, especially if considering really fast
movement of cars.
1.4. Assumptions and Dependencies
The project is written and based on open source software. Thus the software requirements
are also dependent on open source. There exists an external interface to the camera to obtain the
video feed.
Assumptions are made such as this system is to remain unaffected during the process.
Since government policies do not allow us to use live video feed, presets of videos are used for
analysis process and consider that it can be extended to dynamic feed. Also, the system assumes
that the camera feed does not have noise from external factors such as birds or weather.
The video analysis is mainly based on an averaging system for finding the correct
threshold. Thus the system assumes initial transition from higher to lower density to be
discarded.

CS010 710 Main Project Interim Report Department of Computer Science and Engineering
Rajagiri School of Engineering and Technology, Kochi -39
© University Register Number: 12012676 2 Traffic Density Deduction using Video Analysis
1.5. Development Method
The method used for the software development is Iterative Waterfall model. The
waterfall model is a sequential software development process, in which progress is seen as
flowing steadily downwards (like a waterfall) through the phases of Conception, Initiation,
Analysis, Design (validation), Construction, Testing and maintenance. In a typical model, a
project begins with feasibility analysis. On successfully demonstrating the feasibility of a project,
the requirements analysis and project planning begins. The design starts after the requirements
analysis is completed, the coding begins after the design is completed. Once the programming is
completed, the code is integrated and testing is done. On successful completion of testing, the
system is installed. After this, the regular operation and maintenance of the system takes place.
Figure 1.1: The iterative waterfall model
CS010 710 Main Project Interim Report Department of Computer Science and Engineering
Rajagiri School of Engineering and Technology, Kochi -39
© University Register Number: 12012676 4 Traffic Density Deduction using Video Analysis
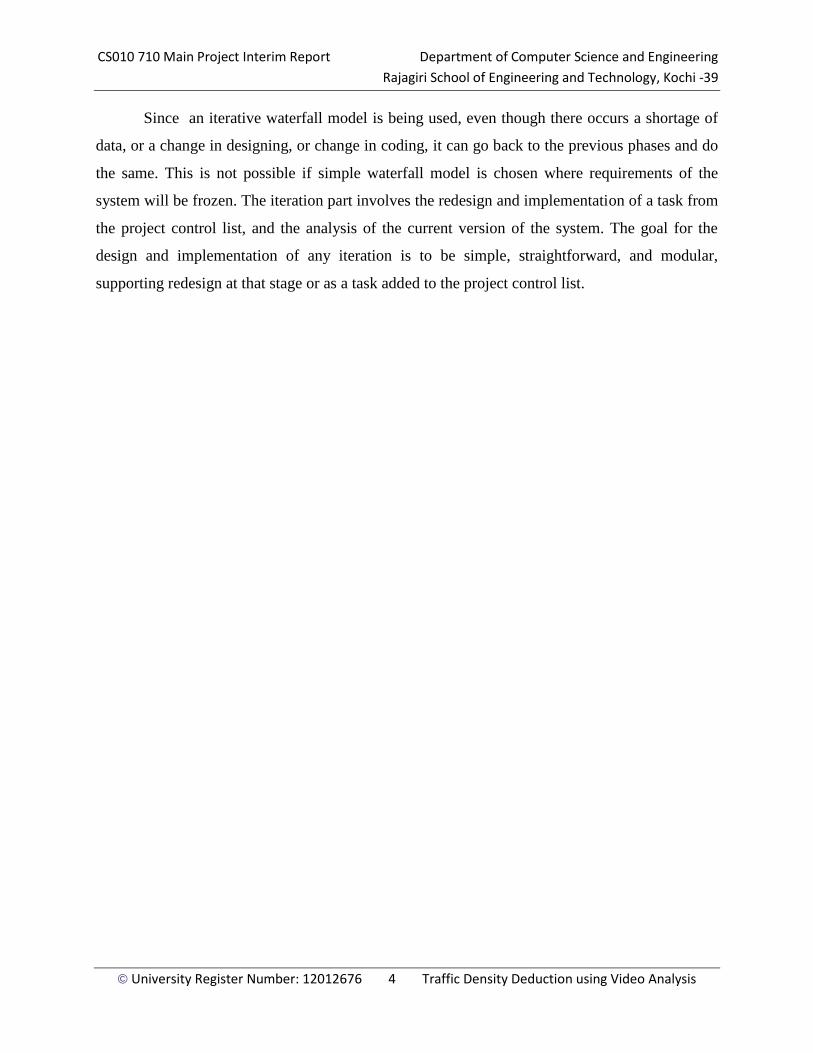
Since an iterative waterfall model is being used, even though there occurs a shortage of
data, or a change in designing, or change in coding, it can go back to the previous phases and do
the same. This is not possible if simple waterfall model is chosen where requirements of the
system will be frozen. The iteration part involves the redesign and implementation of a task from
the project control list, and the analysis of the current version of the system. The goal for the
design and implementation of any iteration is to be simple, straightforward, and modular,
supporting redesign at that stage or as a task added to the project control list.

CS010 710 Main Project Interim Report Department of Computer Science and Engineering
Rajagiri School of Engineering and Technology, Kochi -39
© University Register Number: 12012676 5 Traffic Density Deduction using Video Analysis
2. RELATED WORK
In imaging science, image processing is processing of images using mathematical
operations by using any form of signal processing for which the input is an image, such as
a photograph or video frame; the output of image processing may be either an image or a set of
characteristics or parameters related to the image. Most image-processing techniques involve
treating the image as a two-dimensional signal and applying standard signal-processing
techniques to it.
Closely related to image processing are computer graphics and computer vision.
Computer vision is often considered high-level image processing out of which a
machine/computer/software intends to decipher the physical contents of an image or a sequence
of images (e.g., videos or 3D full-body magnetic resonance scans).
This project involves vehicle detection and hence deduction of traffic density of that road
using appropriate image and video processing techniques. The simplest method that can be used
to detect moving or even static vehicles is using background subtraction.
Background subtraction, also known as Foreground Detection, is a technique in the fields
of image processing and computer vision wherein an image's foreground is extracted for further
processing (object recognition etc.). Generally an image's regions of interest are objects (humans,
cars, text etc.) in its foreground. After the stage of image preprocessing (which may
include image denoising, post processing like morphology etc.) object localisation is required
which may make use of this technique. Background subtraction is a widely used approach for
detecting moving objects in videos from static cameras. The rationale in the approach is that of
detecting the moving objects from the difference between the current frame and a reference
frame, often called “background image”, or “background model”. Background subtraction is
mostly done if the image in question is a part of a video stream. Background subtraction provides
important cues for numerous applications in computer vision, for example surveillance tracking
or human poses estimation.

CS010 710 Main Project Interim Report Department of Computer Science and Engineering
Rajagiri School of Engineering and Technology, Kochi -39
© University Register Number: 12012676 6 Traffic Density Deduction using Video Analysis
However, background subtraction is generally based on a static background hypothesis
which is often not applicable in real environments. With indoor scenes, reflections or animated
images on screens lead to background changes. In a same way, due to wind, rain or illumination
changes brought by weather, static backgrounds methods have difficulties with outdoor scenes.
Thus practicality is low with such an approach. This project requires detection of vehicles, thus
another approach that may be used is object detection.
Object detection is one of the major goals in computer vision that deals with detecting
instances of semantic objects of a certain class (such as humans, buildings, or cars) in images or
videos. Object detection such as face detection and pedestrian detection are among the well-
researched domains. Object detection algorithms typically use extracted features and learning
algorithms to recognize instances of an object category. Object detection has applications in
many areas of computer vision such as image retrieval and video surveillance.
The following models are used for object detection:
Feature-based object detection: Detecting a reference object in a cluttered scene using
feature extraction and matching. In Matlab, RANSAC can be used to estimate the
location of the object in the test image.
Viola-Jones object detection
SVM classification with histograms of oriented gradients (HOG) features
Image segmentation and blob analysis
Gradient-based, derivative-based, and template matching approaches.
Feature extraction a type of dimensionality reduction that efficiently represents interesting
parts of an image as a compact feature vector. This approach is useful when image sizes are large
and a reduced feature representation is required to quickly complete tasks such as image
matching and retrieval.
Feature detection, feature extraction, and matching are often combined to solve common
computer vision problems such as object detection and recognition, content-based image
retrieval, face detection and recognition, and texture classification.

CS010 710 Main Project Interim Report Department of Computer Science and Engineering
Rajagiri School of Engineering and Technology, Kochi -39
© University Register Number: 12012676 7 Traffic Density Deduction using Video Analysis
Figure 2.1: Detecting a reference object (left) in a cluttered scene (right) using feature extraction and matching.
Common feature extraction techniques include Histogram of Oriented Gradients (HOG),
Speeded Up Robust Features (SURF), Local Binary Patterns (LBP), Haar wavelets, and color
histograms.
Local features and their descriptors are the building blocks of many computer vision
algorithms. Their applications include image registration, object detection and classification,
tracking, and motion estimation. These algorithms use local features to better handle scale
changes, rotation, and occlusion.
Blob Analysis is a fundamental technique of machine vision based on analysis of
consistent image regions. As such it is a tool of choice for applications in which the objects being
inspected are clearly discernible from the background. Diverse set of Blob Analysis methods
allows to create tailored solutions for a wide range of visual inspection problems.

CS010 710 Main Project Interim Report Department of Computer Science and Engineering
Rajagiri School of Engineering and Technology, Kochi -39
© University Register Number: 12012676 8 Traffic Density Deduction using Video Analysis
Figure 2.2: Blob Analysis
Let us begin by defining the notions of region and blob.
Region is any subset of image pixels. In Adaptive Vision Studio regions are represented
using Region data type.
Blob is a connected region. In Adaptive Vision Studio blobs (being a special case of
region) are represented using the same Region data type. They can be obtained from any
region using a single SplitRegionIntoBlobs filter or (less frequently) directly from an
image using image segmentation filters from category Image Analysis techniques.
The basic scenario of the Blob Analysis solution consists of the following steps:
1. Extraction - in the initial step one of the Image Thresholding techniques is applied to
obtain a region corresponding to the objects (or single object) being inspected.

CS010 710 Main Project Interim Report Department of Computer Science and Engineering
Rajagiri School of Engineering and Technology, Kochi -39
© University Register Number: 12012676 9 Traffic Density Deduction using Video Analysis
2. Refinement - the extracted region is often flawed by noise of various kind (e.g. due to
inconsistent lightning or poor image quality). In the Refinement step the region is
enhanced using region transformation techniques.
3. Analysis - in the final step the refined region is subject to measurements and the final
results are computed. If the region represents multiple objects, it is split into individual
blobs each of which is inspected separately.
Figure 2.3: The moving pixels (foreground) detected from the video frame above are shown in white.
Moving cars are detected using blob analysis. This is followed by image segmentation
using background subtraction to detect objects.
Viola-Jones algorithm is commonly used for face recognition and tracking. Pedestrian
detection is commonly done using SVM with HOG features which are pre-trained.
Usage of Gaussian mixture models (GMM) is another effective method that can be used
to detect cars in surveillance. A mixture model is a probabilistic model for representing the

CS010 710 Main Project Interim Report Department of Computer Science and Engineering
Rajagiri School of Engineering and Technology, Kochi -39
© University Register Number: 12012676 10 Traffic Density Deduction using Video Analysis
presence of subpopulations within an overall population, without requiring that an observed data
set should identify the sub-population to which an individual observation belongs. Formally a
mixture model corresponds to the mixture distribution that represents the probability
distribution of observations in the overall population.
A GMM on the other hand is a variant of a mixture model. General mixture models have
a set of parameters to it. A GMM variant has some of these parameters modified as A Bayesian
version of a Gaussian mixture model.
Cascade Object Trainers can be used to detect objects whose aspect ratios do not vary
much. This includes stop signs and other road signs, faces, cars or similar objects viewed from
one side.
Cascading is a particular case of ensemble learning based on the concatenation of several
classifiers, using all information collected from the output from a given classifier as additional
information for the next classifier in the cascade. Unlike voting or stacking ensembles, which are
multi-expert systems, cascading is a multistage one.
The first cascading classifier is the face detector of Viola and Jones (2001). The
requirement was that the classifier be fast in order to be implemented on low CPU systems, such
as cameras and phones.

CS010 710 Main Project Interim Report Department of Computer Science and Engineering
Rajagiri School of Engineering and Technology, Kochi -39
© University Register Number: 12012676 11 Traffic Density Deduction using Video Analysis
Figure 2.4: Overview of Cascade Classifiers; courtesy of mathworks.com
Classifiers will not accept faces that are upside down (the eyebrows are not in a correct
position) or the side of the face (the nose is no longer in the center, and shadows on the side of
the nose might be missing). Separate cascade classifiers have to be trained for every rotation that
is not in the image plane (side of face) and will have to be retrained or run on rotated features for
every rotation that is in the image plane (face upside down or tilted to the side). Scaling is not a
problem, since the features can be scaled (centerpixel, leftpixels and rightpixels have a
dimension only relative to the rectangle examined). In recent cascades, pixel value from some
parts of a rectangle compared to another have been replaced with Haar wavelets.
To have good overall performance, the following criteria must be met:
Each stage must validate all faces, and can produce many false positives. For example, if
stage 1 were to mark as 'does not contain a face' 20% of rectangles containing a face (false
negative rate=20%), then the total performance of the chain cannot be higher than 80% true
positive, whatever the next stages are, since 20% of faces have already been rejected.
This suggests that a good stage must have 100% true positive and for example 40% false
positive, that is accept all rectangles containing faces and erroneously mark many rectangles

CS010 710 Main Project Interim Report Department of Computer Science and Engineering
Rajagiri School of Engineering and Technology, Kochi -39
© University Register Number: 12012676 12 Traffic Density Deduction using Video Analysis
as potentially containing a face, to be eliminated by later stages. It should be noted that for a
first stage, 100% true positive and 40% false positive still gives a lot of false negative, if
only 1 in a 1000 rectangles in an image contain a face, there will still be 400 to 1 false
possible faces after the first stage.
If the first stage is very fast (a few operations), we have eliminated 60% of rectangles not
containing a face very quickly.
The training procedure for one stage is therefore to have many weak learners (simple pixel
difference operators), train them as a group (raise their weight if they give correct result), but be
mindful of having only a few active weak learners so the computation time remains low.
The first detector of Viola & Jones had 38 stages, with 1 feature in the first stage, then 10,
25, 25, 50 in the next five stages, for a total of 6000 features. The first stages remove unwanted
rectangles rapidly to avoid paying the computational costs of the next stages, so that
computational time is spent analyzing deeply the part of the image that have a high probability of
containing the object.
There is a trade-off between fewer stages with a lower false positive rate per stage or more
stages with a higher false positive rate per stage. Stages with a lower false positive rate are more
complex because they contain a greater number of weak learners. Stages with a higher false
positive rate contain fewer weak learners. Generally, it is better to have a greater number of
simple stages because at each stage the overall false positive rate decreases exponentially. For
example, if the false positive rate at each stage is 50%, then the overall false positive rate of a
cascade classifier with two stages is 25%. With three stages, it becomes 12.5%, and so on.
However, the greater the number of stages, the greater the amount of training data the classifier
requires. Also, increasing the number of stages increases the false negative rate. This increase
results in a greater chance of rejecting a positive sample by mistake. Set the false positive rate
(FalseAlarmRate) and the number of stages, (NumCascadeStages) to yield an acceptable overall
false positive rate. Then you can tune these two parameters experimentally.
Training can sometimes terminate early. For example, suppose that training stops after seven
stages, even though you set the number of stages parameter to 20. It is possible that the function
cannot generate enough negative samples. If you run the function again and set the number of
CS010 710 Main Project Interim Report Department of Computer Science and Engineering
Rajagiri School of Engineering and Technology, Kochi -39
© University Register Number: 12012676 13 Traffic Density Deduction using Video Analysis
stages to seven, you do not get the same result. The results between stages differ because the
number of positive and negative samples to use for each stage is recalculated for the new number
of stages.
Cascades are usually done through cost-aware ADAboost. The sensitivity can be adjusted so
that there is close to 100% true positives and some false positives. The procedure can then be
started again for stage 2, until the desired accuracy/computation time is desired.
After the initial algorithm, it was understood that training the cascade as a whole can be
optimized, to achieve a desired true detection rate with minimal complexity. Examples of such
algorithms are RCBoost, ECBoost or RCECBoost, in their most basic versions, they can be
understood as choosing, at each step, between adding a stage or adding a weak learner to a
previous stage, whichever is less costly, until the desired accuracy has been reached. Every stage
of the classifier cannot have a detection rate (sensitivity) below the desired rate, so this is a
constrained optimization problem. To be precise, the total sensitivity will be the product of stage
sensitivities.
Cascade classifiers are available in OpenCV, with already trained cascades for frontal faces.
Training a cascade on different object is possible (search for training a haar cascade, for
example), but can currently take a few days.
This project will be using one or more of these methods in combination through trial and
error methods to find the most efficient method. If time permits, a comparison study of the
different combination of techniques will also be provided.

CS010 710 Main Project Interim Report Department of Computer Science and Engineering
Rajagiri School of Engineering and Technology, Kochi -39
© University Register Number: 12012676 14 Traffic Density Deduction using Video Analysis
3. SYSTEM SPECIFICATION
The project is divided into a number of functions which are run in a sequential manner to
obtain the desired output. The first part is to obtain the video feed from the camera. During the
project, a sample video would be used to simulate the video feed.
Next, the relevant frames are retrieved from the video feed containing the traffic. These
frames are given to recognition processor. The recognition processor implements background
subtraction onto the frames. Contour analysis is performed to obtain the different objects in the
scene; vehicles are identified and counted.
The recognition processor outputs the data to the density calculator which calculates the
density based on the number of vehicles on road in comparison to empty road. The display unit
compares the calculated density with the threshold value and outputs whether the traffic density
is high or not.
3.1. Use Cases
There are mainly two parts to the system. One is the video camera to software interface
and the second is the video analysis tool. The video camera provides the feed to the software
through the interface.
Here the video feed is simply divided into its constitutional frames and select few frames
are picked corresponding to a pre-determined time interval. The initial case can have no input
feed in which case there will be no output, thus a video input must be provided.
Pre-conditions include video feed corresponding to the reference image provided.
Post-conditions include a set of video frames on which processing will be done.

CS010 710 Main Project Interim Report Department of Computer Science and Engineering
Rajagiri School of Engineering and Technology, Kochi -39
© University Register Number: 12012676 15 Traffic Density Deduction using Video Analysis
Figure 3.1: Activity Diagram of the project

CS010 710 Main Project Interim Report Department of Computer Science and Engineering
Rajagiri School of Engineering and Technology, Kochi -39
© University Register Number: 12012676 16 Traffic Density Deduction using Video Analysis
The second stage has these frames as input which is processed against the reference
image for background subtraction and contour analysis is then done to retrieve objects of
interest. Vehicles are then counted from these objects of interests which contribute to calculation
of density.
Pre-conditions for this stage includes a reference image for the purpose of background
subtraction and the corresponding frames to it from the video feed which must be provided by
the previous stage.
Post-conditions include a simple GUI displaying the video feed and density values.
Data flow can occur as per the activity diagram. The only alternate paths are that which are
caused by exceptions such as conditions with no video footage or ones with a bad reference
image used for background subtraction.
3.2. Non-functional Requirements
The system is an open source method to find traffic density on roads. Thus there is a
performance requirement of the computer to run the video analysis tool during real-time to
produce required output. Most of the more efficient algorithms and systems related to such work
is proprietary software and this system is a direct protest to this as knowledge and safety systems
should be open to all.
If all of the frames per second are used for calculation, it can lead to a lot of
inconsistency, extraneous results and unnecessary computing. To reduce this, only certain
relevant frames are taken for processing every few seconds. Selection of these frames is a
difficult task as most frames may be blurred or may have streaks of moving cars which is
undesirable and makes detection extremely hard.
If cars are extremely close to each other, and the angle of the camera is not well suited,
then those cars may appear as a single blob or a single vehicle. As the project keeps going,
solutions to such problems will be addressed.

CS010 710 Main Project Interim Report Department of Computer Science and Engineering
Rajagiri School of Engineering and Technology, Kochi -39
© University Register Number: 12012676 17 Traffic Density Deduction using Video Analysis
Also, certain external factors such as rain, birds, etc can affect the video feed during real-
time which can cause erroneous results. Weather can be a huge factor in case of background
subtraction methods and other similar simple methods. Thus, blob detection or other feature
detecting mechanisms must be used with colour thresholding in conjunction with background
subtraction for this purpose to produce better results.

CS010 710 Main Project Interim Report Department of Computer Science and Engineering
Rajagiri School of Engineering and Technology, Kochi -39
© University Register Number: 12012676 18 Traffic Density Deduction using Video Analysis
4. SYSTEM DESIGN
4.1. Structural Design
The system has two main stages. The first one deals with basic pre-processing of the
video for the project. The video camera to software interface is part of the first stage and the
second is the video analysis tool. The video camera provides the feed to the software through the
interface.
The design has a number of assumptions around which the processing takes place. Some
of the more important assumptions include weather conditions. A clear sunny weather is
expected. Rain, storms and other weather conditions will render this design useless and very
erroneous. Other assumptions include an obstacle free video footage. Physical obstacles can
block the path of the camera, thus giving a useless input feed to the footage, again giving out a
set of erroneous results. This design compromises on such details. However, provided there are
no such problems, this project is deemed to be successful.
Here the video feed is simply divided into its constitutional frames and select few frames
are picked corresponding to a pre-determined time interval. The initial case can have no input
feed in which case there will be no output, thus a video input must be provided. Several UML
diagrams are shown below with a brief description of each such as use case diagrams and activity
diagrams.

CS010 710 Main Project Interim Report Department of Computer Science and Engineering
Rajagiri School of Engineering and Technology, Kochi -39
© University Register Number: 12012676 19 Traffic Density Deduction using Video Analysis
Figure 4.1: Use Case diagram of the first stage of the project
The video is read from the source, which maybe recorder video footage or live footage.
Constitutional frames from the video are then extracted. These frames will be extremely
numerous if all them are considered since average cameras has a default of 23.5 frames per
second or 29 frames per second or 30 frames per second. Practically speaking there will not be
much of a difference between frames when it comes to count of cars in a single second, thus we
don’t need to process each and every frame of a second. Therefore, only a few frames are picked
for every few seconds which will be determined through trial and error for an optimal solution of

CS010 710 Main Project Interim Report Department of Computer Science and Engineering
Rajagiri School of Engineering and Technology, Kochi -39
© University Register Number: 12012676 20 Traffic Density Deduction using Video Analysis
the above. These frames are then combined to an object which is then transferred to the second
stage of the project where further complex processing is done to deduce the traffic density.
The actors here include the camera and the second stage system.
Figure 4.2: Use Case diagram of the second stage of the project

CS010 710 Main Project Interim Report Department of Computer Science and Engineering
Rajagiri School of Engineering and Technology, Kochi -39
© University Register Number: 12012676 21 Traffic Density Deduction using Video Analysis
Figure 4.3: Activity Diagram of the project

CS010 710 Main Project Interim Report Department of Computer Science and Engineering
Rajagiri School of Engineering and Technology, Kochi -39
© University Register Number: 12012676 22 Traffic Density Deduction using Video Analysis
The above activity diagram displays how the activities flow and follow. It is rather simple and
sequential. However and is self-explanatory from the diagram. As described elsewhere is takes
the footage, extracts frames, analyses frames and produces desires output
4.2. External Interface Design
A simple GUI interface is provided to the user to display the video, potential vehicles,
traffic density at that instant of time and average traffic density over a decided time. The
interface can also be used to load other video footages and background images to deduce the
traffic density. Other interfaces include that which will be used by the computer and the camera
to provide live footage to be used by the software. Some sample GUI interfaces are shown
below.
Figure 4.4: Sample GUI
CS010 710 Main Project Interim Report Department of Computer Science and Engineering
Rajagiri School of Engineering and Technology, Kochi -39
© University Register Number: 12012676 23 Traffic Density Deduction using Video Analysis
4.3. Component Level Design
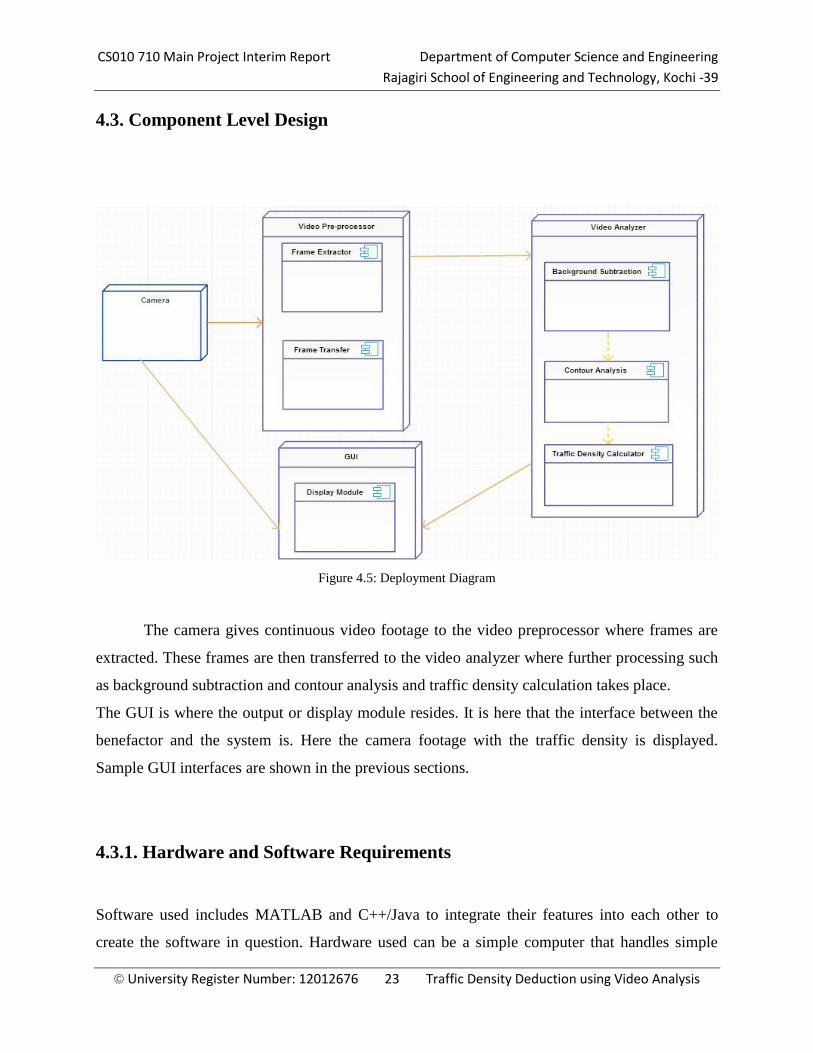
Figure 4.5: Deployment Diagram
The camera gives continuous video footage to the video preprocessor where frames are
extracted. These frames are then transferred to the video analyzer where further processing such
as background subtraction and contour analysis and traffic density calculation takes place.
The GUI is where the output or display module resides. It is here that the interface between the
benefactor and the system is. Here the camera footage with the traffic density is displayed.
Sample GUI interfaces are shown in the previous sections.
4.3.1. Hardware and Software Requirements
Software used includes MATLAB and C++/Java to integrate their features into each other to
create the software in question. Hardware used can be a simple computer that handles simple

CS010 710 Main Project Interim Report Department of Computer Science and Engineering
Rajagiri School of Engineering and Technology, Kochi -39
© University Register Number: 12012676 24 Traffic Density Deduction using Video Analysis
image/video processing. The target environment can be as simple as a device as Raspberry Pi
provided it can handle the processing in real time without unnecessary delay or other
complications. The target will however have to be equipped with a camera, and since Raspberry
Pi won’t be able to handle more complex cameras than a simple webcam which cannot be used
for our purpose, one will have to use a little powerful machine such as a home desktop with
minimal specifications but with a dedicated video card to allow for efficient processing of the
data.

CS010 710 Main Project Interim Report Department of Computer Science and Engineering
Rajagiri School of Engineering and Technology, Kochi -39
© University Register Number: 12012676 25 Traffic Density Deduction using Video Analysis
5. PROJECT SCHEDULE AND MAJOR MILESTONES
MILESTONES
DELIVERABLES
TARGET
DATE
CURRENT
STATUS
Project Initiation Studying existing technologies and
project planning
07-Sep-2015 Achieved
Project Design Project analysis and design 15-Oct-2015 Achieved
Getting Approval Presentation and submission of
interim report
21-Oct-2015 Achieved
Software
Implementation
- Retrieving manageable data from
ifvideo
- Processing of data to get desired
ifinformation
01-Mar-2016
21-Jan-2016
21-Feb-2016
Work-in-Progress
GUI
Implementation
and Testing
Providing a simple GUI for
showing necessary information
and testing the entire software
01-Mar-2016
Work-in-Progress
Figure 4.1: Milestone Chart of the project
A brief description of the achievable milestones is shown above in the table and the basic
outline of what must be done and when it is expected to be completed.

CS010 710 Main Project Interim Report Department of Computer Science and Engineering
Rajagiri School of Engineering and Technology, Kochi -39
© University Register Number: 12012676 26 Traffic Density Deduction using Video Analysis
Figure 4.2: Gantt-Chart of Phase I
The first phase of the project includes all sorts of preliminary work of which data
gathering, studying previous related works, improvements to be made and requirements to be
managed are some of the many things done here.
The second half of the first phase deals with project analysis and design. Here, what the
project is actually supposed to do and achieve is clearly mentioned here. How this can be
achieved, and the most efficient methods are researched and simulated if needed. This
information helps in designing the actual project in question. The timeline of the first phase of
the project is depicted by a Gantt-Chart above.

CS010 710 Main Project Interim Report Department of Computer Science and Engineering
Rajagiri School of Engineering and Technology, Kochi -39
© University Register Number: 12012676 27 Traffic Density Deduction using Video Analysis
Figure 4.3: Gantt-Chart of Phase II
The second phase of the project involves implementation, testing and evaluation of the
project. Testing and implementation goes hand in hand as far as alpha testing is concerned.
However, most of the core testing gets done in the latter part of implementation.
This project deals with video and image processing to deduce the traffic density of a given region
provided there are reliable reference images and obstacle free video feed with ambient light
conditions. Therefore, the initial parts of retrieving frames from the videos for processing and
retrieving objects can be done almost easily in a couple of weeks’ time. The processing which
involves separating relevant objects from irrelevant objects however would be a far more tedious
task which must be dealt with. Further testing and evaluation is done to make sure the
requirements are fulfilled. The second phase of the project which starts in the beginning of the
year of 2016 is depicted by the Gantt-Chart above.

CS010 710 Main Project Interim Report Department of Computer Science and Engineering
Rajagiri School of Engineering and Technology, Kochi -39
© University Register Number: 12012676 28 Traffic Density Deduction using Video Analysis
6. RISKS AND CHALLENGES
The risks involved in this project include insufficient data and insufficient time due to
which the project may be incomplete. However a solid work plan and schedule has been
established to ensure no such thing occurs.
The challenges include dealing with different weather and low visibility conditions. Low
visibility such as at night will deter this project since detection of objects will be next to
impossible unless algorithms are included to detect vehicles based on their headlights or having
to use specialized cameras such as night vision enabled cameras or infrared cameras.
Varying weather conditions can also affect the performance of this system drastically, like In the
case of rain, where visibility can be deteriorated heavily.

CS010 710 Main Project Interim Report Department of Computer Science and Engineering
Rajagiri School of Engineering and Technology, Kochi -39
© University Register Number: 12012676 29 Traffic Density Deduction using Video Analysis
7. GLOSSARY
UML: Unified Modular Language
GUI: Graphical User Interface
GMM: Gaussian Mixture Models

CS010 710 Main Project Interim Report Department of Computer Science and Engineering
Rajagiri School of Engineering and Technology, Kochi -39
© University Register Number: 12012676 30 Traffic Density Deduction using Video Analysis
8. BIBLIOGRAPHY
[1] N. Abbas, M. Tayyab, M. Tahir, “Real Time Traffic Density Count using Image Processing”,
[di4International Journal of Computer Applications, Volume 83,December 2013.
[2] P. Srinivas, Y.L. Malathilatha, Dr. M.V.N.K Prasad, “Image Processing Edge Detection
[di4Technique used for Traffic Control Problem”, International Journal of Computer Science and
[di4Information Technologies, Vol. 4 (1), 2013
[3] P. Niksaz, “Automatic Traffic Estimation Using Image Processing”, International Journal of
[4] Signal Processing, Image Processing and Pattern Recognition Vol. 5, No. 4, December, 2012.
[4] D. Rosenbaum, J. Leitloff, F. Kurz, O. Meynberg, and T. Reize, “Real-Time Image
[di4Processing For Road Traffic Data Extraction From Aerial Images”, ISPRS TC VII
[di4Symposium 100 Years ISPRS, Vienna, Austria, July 5–7, 2010.