s6 statistical process controlkleong.faculty.unlv.edu/scm352powerpoint_files/chapter... ·...
TRANSCRIPT

© 2011 Pearson Education, Inc. publishing as Prentice Hall
S6 Statistical Process Control
SCM 352

Outline
• Statistical Quality Control• Common causes vs. assignable causes• Different types of data – attributes and
variables• Central limit theorem• SPC charts
– Control charts for variables– Control charts for attribute
© 2011 Pearson Education, Inc. publishing as Prentice Hall
Statistical Process Control (SPC)
• The objective of a process control system is to provides a statistical signal when assignable causes are present
• Variability is inherent in every process• Natural or common causes• Special or assignable causes
• Detect and eliminate assignable causes of variation

© 2011 Pearson Education, Inc. publishing as Prentice Hall
Natural Variations
• Also called common causes• Affect virtually all production processes• Expected amount of variation• Output measures follow a probability distribution• For any distribution there is a measure of central
tendency and dispersion• If the distribution of outputs falls within acceptable
limits, the process is said to be “in control”• A process with only natural variations is in statistical
control

© 2011 Pearson Education, Inc. publishing as Prentice Hall
• Also called special causes of variation– Generally this is some change in the process
• Variations that can be traced to a specific reason– Operators errors– Defective raw materials– Improperly adjusted machines
• The objective is to discover when assignable causes are present– Eliminate the bad causes– Incorporate the good causes
Assignable Variations

© 2011 Pearson Education, Inc. publishing as Prentice Hall
Natural & Assignable Variation

© 2011 Pearson Education, Inc. publishing as Prentice Hall
• Characteristics for which you focus on defects
• Classify products as either ‘good’ or ‘bad’, or count number of defects– e.g., radio works or not
• Categorical or discrete random variables
AttributesVariables
Types of Data
• Characteristics that you measure, e.g., weight, length
• May be in whole or in fractional numbers
• Continuous random variables

© 2011 Pearson Education, Inc. publishing as Prentice Hall
X
As sample size gets large enough,
sampling distribution becomes almost normal regardless of population distribution.
Central Limit Theorem
X
Theoretical Basis of Control Charts

© 2011 Pearson Education, Inc. publishing as Prentice Hall
-3σ -2σ -1σ +1σ +2σ +3σMean
68.26%95.44%99.74%
σ = Standard deviation
The Normal Distribution
© 2011 Pearson Education, Inc. publishing as Prentice Hall
For variables that have continuous dimensions
Weight, speed, length, etc.
x-charts are to control the central tendency of the processR-charts are to control the dispersion of the processThese two charts must be used together
Control Charts for Variables
© 2011 Pearson Education, Inc. publishing as Prentice Hall
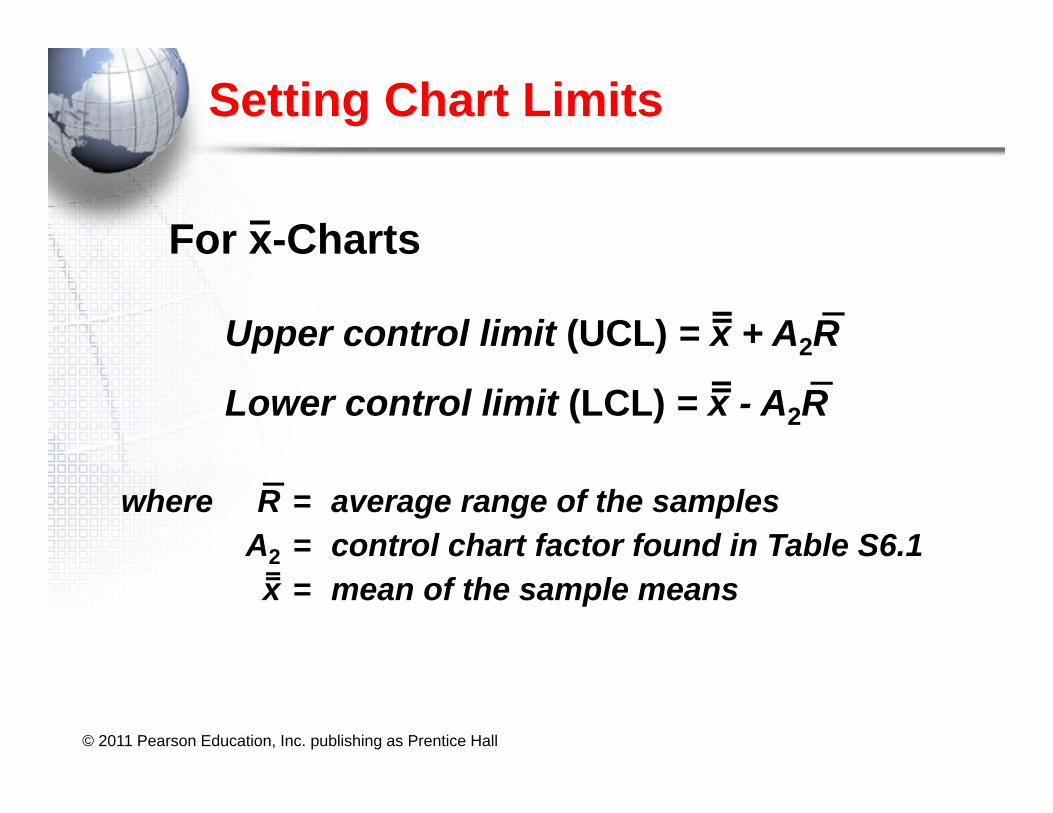
For x-Charts
Lower control limit (LCL) = x - A2R
Upper control limit (UCL) = x + A2R
where R = average range of the samplesA2 = control chart factor found in Table S6.1 x = mean of the sample means
Setting Chart Limits

© 2011 Pearson Education, Inc. publishing as Prentice HallTable S6.1
Sample Size Mean Factor Upper Range Lower Rangen A2 D4 D3
2 1.880 3.268 03 1.023 2.574 04 .729 2.282 05 .577 2.115 06 .483 2.004 07 .419 1.924 0.0768 .373 1.864 0.1369 .337 1.816 0.184
10 .308 1.777 0.22312 .266 1.716 0.284
Control Chart Factors

© 2011 Pearson Education, Inc. publishing as Prentice Hall
For R-Charts
Lower control limit (LCLR) = D3R
Upper control limit (UCLR) = D4R
whereR = average range of the samples
D3 and D4 = control chart factors from Table S6.1
Setting Chart Limits

© 2011 Pearson Education, Inc. publishing as Prentice Hall
Control Charts for Variables
Time SampleTaken 1 2 3 4 Range Mean
7 am 0.5014 0.5022 0.5009 0.50278 am 0.5021 0.5041 0.5024 0.50209 am 0.5018 0.5026 0.5035 0.5023
10 am 0.5008 0.5034 0.5024 0.501511 am 0.5041 0.5056 0.5034 0.5047
Average
Special Metal Screw

© 2011 Pearson Education, Inc. publishing as Prentice Hall
Time SampleTaken 1 2 3 4 Range Mean
7 am 0.5014 0.5022 0.5009 0.5027 0.0018 0.50188 am 0.5021 0.5041 0.5024 0.5020 0.0021 0.50279 am 0.5018 0.5026 0.5035 0.5023 0.0017 0.5026
10 am 0.5008 0.5034 0.5024 0.5015 0.0026 0.502011 am 0.5041 0.5056 0.5034 0.5047 0.0022 0.5045
Average 0.0021 0.5027
Special Metal Screw
Control Charts for Variables

© 2011 Pearson Education, Inc. publishing as Prentice Hall
Control Charts - Special Metal ScrewR - Charts R = 0.0021
UCLR = D4R = 2.282(0.0021) = 0.00479LCLR = D3R = 0(0.0021) = 0
Control Charts for Variables

© 2011 Pearson Education, Inc. publishing as Prentice HallTable S6.1
Sample Size Mean Factor Upper Range Lower Rangen A2 D4 D3
2 1.880 3.268 03 1.023 2.574 04 .729 2.282 05 .577 2.115 06 .483 2.004 07 .419 1.924 0.0768 .373 1.864 0.1369 .337 1.816 0.184
10 .308 1.777 0.22312 .266 1.716 0.284
Control Chart Factors

© 2011 Pearson Education, Inc. publishing as Prentice Hall
0.005
0.004
0.003
0.002
0.001
01 2 3 4 5 6
Ran
ge (i
n.)
Sample number
UCLR = 0.00479
LCLR = 0
R = 0.0021
Range Chart - Special Metal Screw

© 2011 Pearson Education, Inc. publishing as Prentice Hall
Control Charts - Special Metal ScrewR = 0.0021x = 0.5027
x - Charts
UCLx = x + A2R = 0.5027 + 0.729(0.0021)LCLx = x - A2R = 0.5027 - 0.729(0.0021)UCL = 0.5042LCL = 0.5012
Control Charts for Variables

© 2011 Pearson Education, Inc. publishing as Prentice HallTable S6.1
Sample Size Mean Factor Upper Range Lower Rangen A2 D4 D3
2 1.880 3.268 03 1.023 2.574 04 .729 2.282 05 .577 2.115 06 .483 2.004 07 .419 1.924 0.0768 .373 1.864 0.1369 .337 1.816 0.184
10 .308 1.777 0.22312 .266 1.716 0.284
Control Chart Factors

© 2011 Pearson Education, Inc. publishing as Prentice Hall
0.5050
0.5040
0.5030
0.5020
0.5010
1 2 3 4 5
Aver
age
(in.)
Sample number
x = 0.5027
UCLx = 0.5042
LCLx = 0.5012
0.5045
x Chart - Special Metal Screw

Thank You
Questions? ?