s317056 practical performance management for oracle...
TRANSCRIPT


S317056 Practical Performance Management for Oracle Real
Application Clusters
Michael Zoll, Consulting Member of Technical Staff
Sanjay Singh, Consulting Member of Technical Staff
Oracle Real Application Clusters

The following is intended to outline our general
product direction. It is intended for information
purposes only, and may not be incorporated into any
contract. It is not a commitment to deliver any
material, code, or functionality, and should not be
relied upon in making purchasing decisions.
The development, release, and timing of any
features or functionality described for Oracle’s
products remains at the sole discretion of Oracle.

Objective
Convey a few simple and fundamental concepts of
performance monitoring and diagnosis for Oracle RAC
Summarize application level performance and
scalability information
Give exemplary overview of common problems and
solutions
Builds on similar presentation from OOW 2009 http://www.oracle.com/technology/products/database/clustering/pdf/s311441_oow2009_perf.pdf

<Insert Picture Here>
Oracle RAC Infrastructure:
Technical Fundamentals,
Sizing and Configuration

Service
Oracle RAC Architecture
public network
Node1
Operating System
Oracle Clusterware
instance 1
ASM
VIP1
Listener Node 2
VIP2
Node n
VIPn
/…/
Redo / Archive logs all instances
shared storage
Database / Control files
OCR and Voting Disks
Managed by ASM
SCAN_Listener
Service
Operating System
Oracle Clusterware
instance 2
ASM
Listener
SCAN_Listener
Service
Operating System
Oracle Clusterware
instance n
ASM
Listener
SCAN_Listener

Global Cache and Global Enqueue ServiceProcesses and Functions
Dictionary
Cache
Log buffer
LGWRDBW0
Library
Cache
Buffer Cache
LMONLMD0
SGA
Runs in Real
Time Priority
LMSx
Cluster Private High Speed Network
Global Resource Directory
Global Enqueue Service Global Cache Service
Oracle
Process
Oracle
Proces
s

Immediate Global Cache Access
Receive
1
LMS
2
3
Send Block or Grant
Shadow
process:
: Buffer Cache
IPC send via interconnect
Legend:

Immediate Global Cache Access:
Expectations for Roundtrip Latency (UDP/GbE and
RDS/IB ) in Microseconds ( usec )
Block size
RT (usec)
2K 4K 8K 16K
UDP/GE 300 310 360 460
RDS/IB 120 130 160 200
(*) measurements from lab tests under conditions of normality
On systems with average load
The actual values for different platforms an equipment may vary

Latency Variance in Global Cache messaging
• Mean and Standard Deviation can change based on operating conditions
• Machine load• Process concurrency, scheduling, context switching• CPU utilization level
• Interconnect Network• Total bandwidth utilization• Not supported, Sharing the same interconnect for IO and
Message traffic
• LMS process• CPU busy• Not in real-time

Latency Variance in Global Cache messaging
• Changes in Mean or Standard Deviation are
interesting when • Average Statistics ( e.g. in AWR reports ) are higher than
expected
• The frequency of high latencies is large
0
0.1
0.2
0.3
0.4
0.5
0.6
0.7
<250 500 2000 8000 >16000
usecs per message
Distribution of message roundtrip times ( under
load )
pct
Suspicious !!
May relate to intermittent
load spikes
Expected range

Deferred (“Busy” ) Global Cache Access
Receive
LGWR
1
LMS
2
6SendShadow
process:
Flush redo
4
Post3
Post
5: Buffer Cache
IPC send via Interconnect
Log write before send
Legend:
Redo log IO latency will dominate
roundtrip time ( block is “busy” )

Preconditions for a Healthy System
Ensure QoS of redo log file IO ( OLTP )
LMS operating conditionHigh priority ( default )
< 60%
Control CPU and process load Keep CPU reserves ( idle % ) and avoid connection storms
Resource Manager
Active connection limit
No memory pressure Paging and Swapping activity are lethal
Connection pools should have a well defined maximum
Huge pages for SGA ( Linux ) save RAM

Preconditions for a Healthy System
No changes to cpu_countUnless Resource Manager instance caging is deployed
No changes to gcs_processes Note 1181315.1 (My Oracle Support)
For high performance only !!Fence off interrupt busy CPUs
E.g. taskset -pc <cpuid> <pid>
LGWR and LMS should not be interrupted frequently by hardware
ps -eo psr,ppid,args,pcpu

Best Practices
Establish a reference by load and stress testing
Interconnect ( e.g. Iperf, Netperf )
IO subsystem performance ( e.g. Orion )
Application ( Capture and Replay, Real Application Testing)
Examine the baseline statistics
Log “normal” values for different operating conditions
Can be used to customize alarm thresholds ( e.g. in EM )
Improve efficiency if values are unexpected
Save the statistics
Export AWR repository

<Insert Picture Here>
Performance and Scalability of
Applications and Database
Design with RAC

Performance and Scalability
IO, CPU and read intensive applications with large working sets and low proximity of access scale well out of the box
Self-Service Web Applications ( Shopping Carts etc. )
CRM
Document storage and retrieval
Business Analytics
Concurrent batch jobs or queueing applications often contend on indexes data
Advanced Queuing and Workflow
Order processing and Inventory
Payroll processing

Performance and Scaling: In-Memory Contention
CONCURRENT INSERTS, UPDATES, DELETE of
rows in a small working set
Index keys with monotonically increases values
Maintenance of non-unique keys
Session logging and tracking
First-in first-out queues
Status flag updates and deletions in work/job queues
Small working sets may fit into buffer cache of one
machine
Locality of access may diminish , hence more traffic across
interconnect and block contention

DML Contention and Serialization
…… ……
INSERT INTO I WHERE Key = sequence
UPDATE T SET … WHERE row in blocks[1..n]
and n is a small number
“busy blocks” “busy blocks”
Index I Index I
Table T Table T’
Modification intensive operations on small set of ( cached) blocks
Frequent symptoms:
Enq: TX – row lock contention buffer busy
Enq: TX – index contention gc cr/current block busy

Performance and Scaling: Metadata
Ordered Sequences
Do not scale well in RAC
Symptoms: “enq: SV – contention”
Parallel Loads or INSERTS
Contention on file header blocks in very large tablespaces
Contention on data dictionary (SEG$, TSQ$)
Symptoms: “buffer busy”, “gc buffer busy acquire/release”
Library Cache
Hard Parsing due to invalidations and reloads
PL/SQL package loading
Symptoms: “library cache lock”,”row cache lock”

Identifying Performance and Scaling Bottlenecks in
Database Design
The Golden Rules:
#1: Focus on the INSERT, UPDATE and DELETE intensive
indexes and tablespace
#2: Random access to database is not an issue, frequently
modified small tables are interesting
#3: A small subset of statements and objects causes 90% of
performance issues
#4: Standard SQL and schema tuning solves > 80% of
performance problems
#5: Almost everything can be scaled out quickly with load-
direction and load balancing

Identifying Performance and Scaling Bottlenecks in
Database Design
Indexes with right-growing characteristics
Keys comprising DATE columns or keys generated by sequence
numbers
Concurrent SQL updating index keys
Concurrent SQL updating many rows in the same
transaction
Concurrent SQL updating the same rows
Frequent access to Ordered Sequences
Dropping, Truncating, Altering of Partitions , Statistics
gathering while the objects are accessed
HOW ?
Use Oracle Enterprise Manager Access Advisories and Automatic Database Diagnostics Monitor (ADDM)
ADDM suggests fixes of top problems
Instrumentation with MODULE and ACTION helps identify and quantify components of the workload
SQL and Segment Access Statistics in AWR
C.f. APPENDIX for Quick Fixes
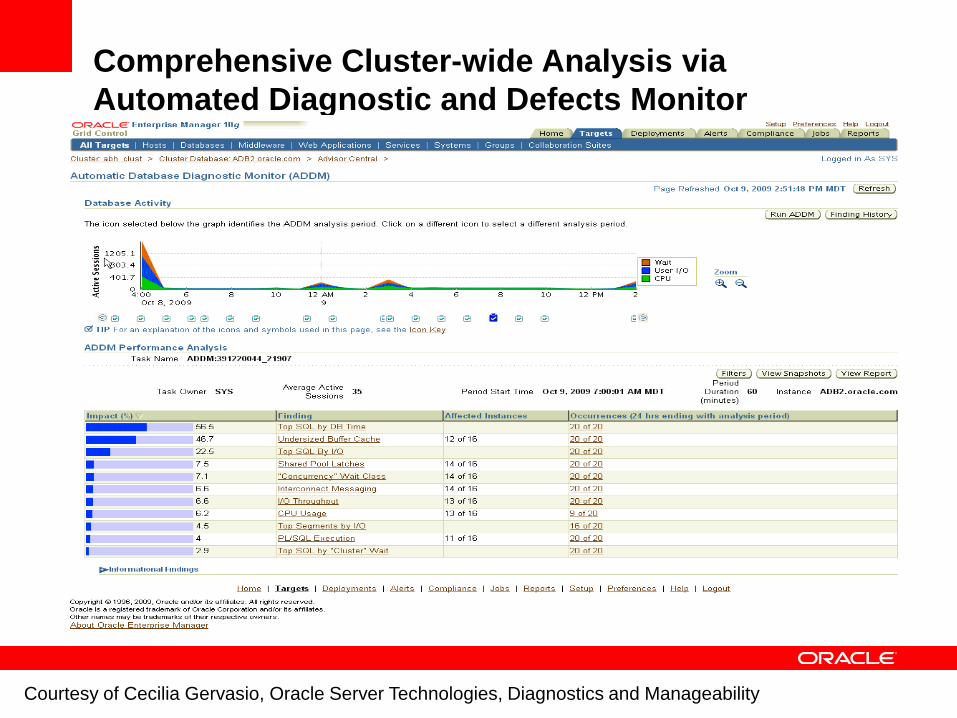
Comprehensive Cluster-wide Analysis via
Automated Diagnostic and Defects Monitor
Courtesy of Cecilia Gervasio, Oracle Server Technologies, Diagnostics and Manageability

<Insert Picture Here>
Performance Monitoring and
Diagnostics: Metrics and
Method

<Insert Picture Here>
Performance Monitoring and
Diagnostics: General Approach
Ranking Which event has the biggest impact on response times ?
Looking for “non-normal” ( “faulty” ) behaviour occurrence of an unexpected event
large deviation of a monitored event from an expected, standard condition
Diagnosing/Determining CauseMost problems boil down to CPU, IO, network capacity or application contention issues
Deciding “repair” strategy Return to “normal” operation via configuration changes
SQL and Schema optimization

Cause and Effect are Distributed
Node 1
Node 2
Node 1
Node 2
ROOT CAUSE
Disk Capacity
Disk or Controller Bottleneck
Example: Cluster-wide Impact of a Log File IO Problem

Ranking: Immediate Data Block Transfers
Accurate avg: 109usecs
Global Cache has small impact
Average Performance looks normal

Histogram: Mean and Variance
48% of time in IO
Mean values: accepted
Variance: small
Normal operation
Optional:
Consult ADDM for general tuning

Receiving a database block :
Reasons for “non-normal” behaviour
Gc cr/current block 2-way/3-way
0
0.1
0.2
0.3
0.4
0.5
0.6
0.7
<250 500 2000 8000 >16000
usec per message
Distribution of message roundtrip times
pct
0
0.1
0.2
0.3
0.4
0.5
0.6
0.7
<250 500 2000 8000 >16000
usecs per message
Distribution of message roundtrip times ( under
load )
pct
Mean: 250 usecs
Mean: 800 usecs
5% > 8 ms
Likely Causes:
Interconnect Utilization or Network Configuration
High CPU Utilization and Process Concurrency
LMS busy

Repair Latency average for immediate block sends higher
than expected or high variance
Symptom Problem Repair
Gc cr/current block 2-
way/3-way
High average or large
outliers
High System CPU Load:
CPU%
Run queue
Load spikes
Rebalance
Stop services
Throttle new connections
Reschedule CPU
intensive jobs
Add another node
Interconnect Capacity
75% + utilized
Message loss
Bigger Pipe , Sizing was
wrong
LMS server utilization
high ( 60% + )
Start 1 more LMS
process ( requires rolling
instance restart )

Ranking: Contention and Log IO
Global cache wait events: 35% significant
Means higher than expected
Transfer delayed by log flush on other node(s)
Local sessions waiiting for transfer
Block pinged out, sessions waiting for its return

Histogram: Mean and Variance
Variance: Significant Outliers
Other node(s) need to be examined

Global View: Local symptoms are associated with
issues on other instance(s)
Contended blocks from instance 2
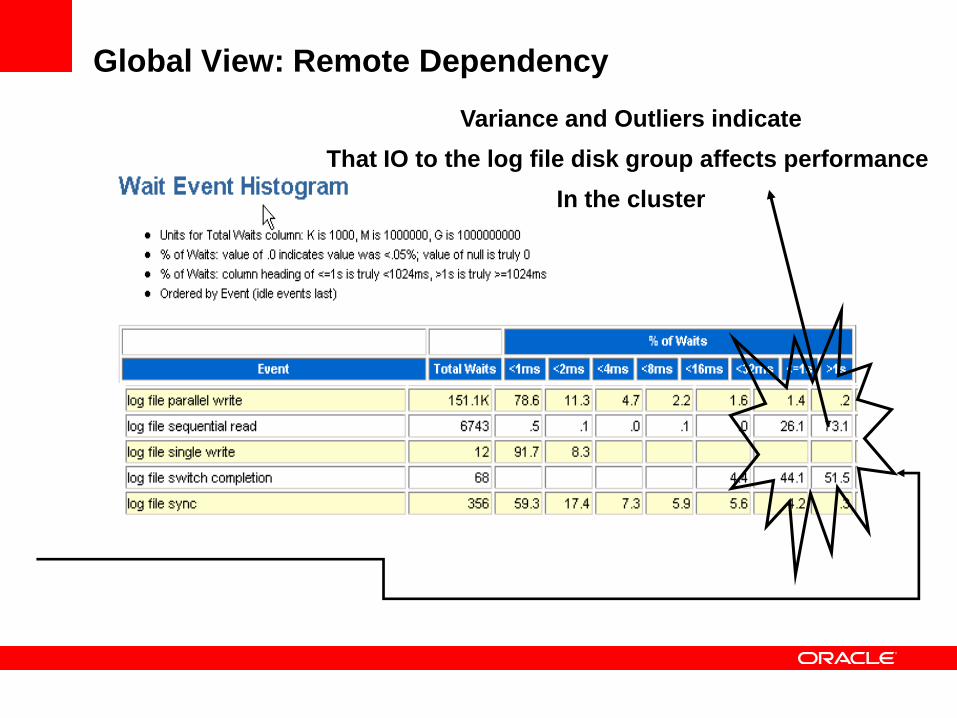
Global View: Remote Dependency
Variance and Outliers indicate
That IO to the log file disk group affects performance
In the cluster

Receiving a “hot” database block:
Reasons for “non-normal” behaviour
Gc cr/current block busy
Mean: 1.5 msecs
Mean: 10 msec
12% > 16 ms
Likely Causes:
Redo log IO performance
0
0.1
0.2
0.3
0.4
0.5
0.6
0.7
<250 500 2000 8000 >16000
usec per message
Distribution of deferred pings
pct
0
0.1
0.2
0.3
0.4
0.5
0.6
<250 500 2000 8000 >16000
usecs per message
Distribution of deferred pings
pct Log file parallel write
Also C.F. Appendix for some info regarding log sync
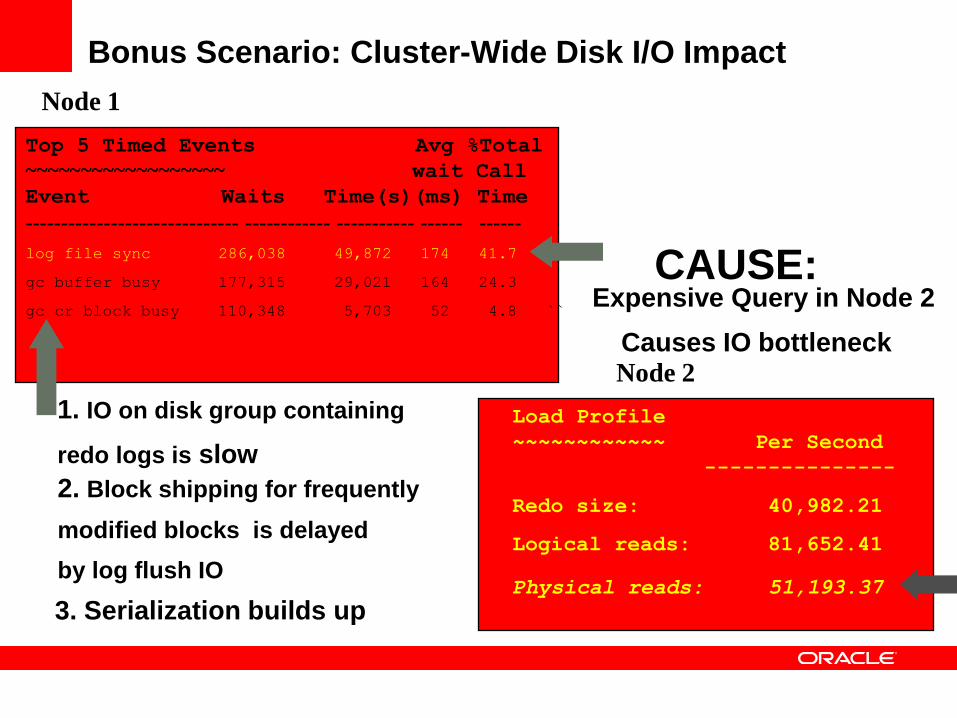
Bonus Scenario: Cluster-Wide Disk I/O Impact
Top 5 Timed Events Avg %Total
~~~~~~~~~~~~~~~~~~ wait Call
Event Waits Time(s)(ms) Time
------------------------------ ------------ ----------- ------ ------
log file sync 286,038 49,872 174 41.7
gc buffer busy 177,315 29,021 164 24.3
gc cr block busy 110,348 5,703 52 4.8 ``
Load Profile
~~~~~~~~~~~~ Per Second
---------------
Redo size: 40,982.21
Logical reads: 81,652.41
Physical reads: 51,193.37
Node 2
Node 1
Expensive Query in Node 2
Causes IO bottleneck
1. IO on disk group containing
redo logs is slow
2. Block shipping for frequently
modified blocks is delayed
by log flush IO
3. Serialization builds up
CAUSE:
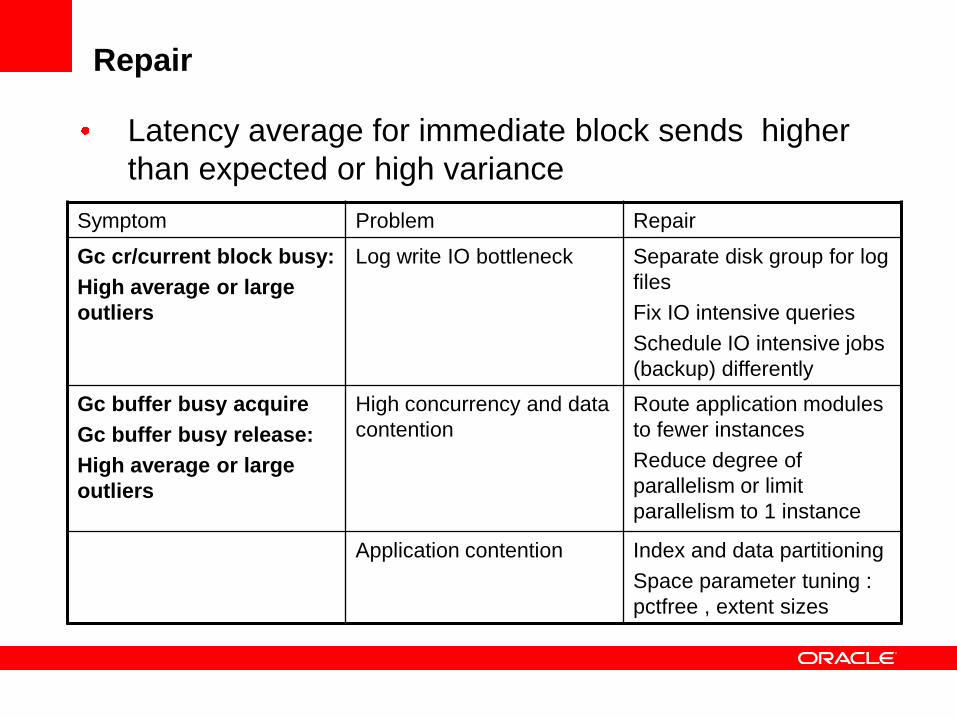
Repair
Latency average for immediate block sends higher
than expected or high variance
Symptom Problem Repair
Gc cr/current block busy:
High average or large
outliers
Log write IO bottleneck Separate disk group for log
files
Fix IO intensive queries
Schedule IO intensive jobs
(backup) differently
Gc buffer busy acquire
Gc buffer busy release:
High average or large
outliers
High concurrency and data
contention
Route application modules
to fewer instances
Reduce degree of
parallelism or limit
parallelism to 1 instance
Application contention Index and data partitioning
Space parameter tuning :
pctfree , extent sizes

SQL and Schema Optimization: Identifying SQL
incurring highest Cluster Wait Time

SQL and Schema Optimization: Identifying Objects
incurring Cluster Waits
Indexes with High Contention, 1 accounting for 84%

Severe Faults
Some wait events are symptoms of severe faults or
failures
Should never have high impact , I.e. not show in top 5
Symptom Problem Repair
Gc cr/current block
lost
Link Congestion
Network Stack
Buffering insufficient
Reduce system load
in cluster
Increase IPC buffer
sizes
Gc cr/current
request
Node hang due to
memory problems
Unresponsive Node
will be evicted
Process on other
node hung or dead
and not cleaned up
Check DIA trace files
for hang info and kill
process

Interconnect or Network Stack Congestion
NIC1 NIC2
Ports
Queues
Device
Drivers
Ifconfig -a
Applications: Oracle
Switch
UDP:
Packet receive errors
Socket buffer overflowsProtocol processing:IP,UDP
IP:
1201 Fragments dropped after timeout
467 Reassembly failure
468 Incoming packets discarded
netstat –s
gc blocks lost
TX errors:135 dropped: overruns:
RX errors: 0 dropped:27 overruns:

<Insert Picture Here>
Time Series and
Temporal Sequencing

Time Series: Active Session History
0
0.1
0.2
0.3
0.4
0.5
0.6
<250 500 2000 8000 >16000
usecs per message
Distribution of deferred pings
pct
When did these happen ?
AWR only gives average statistics
over 30 min intervals
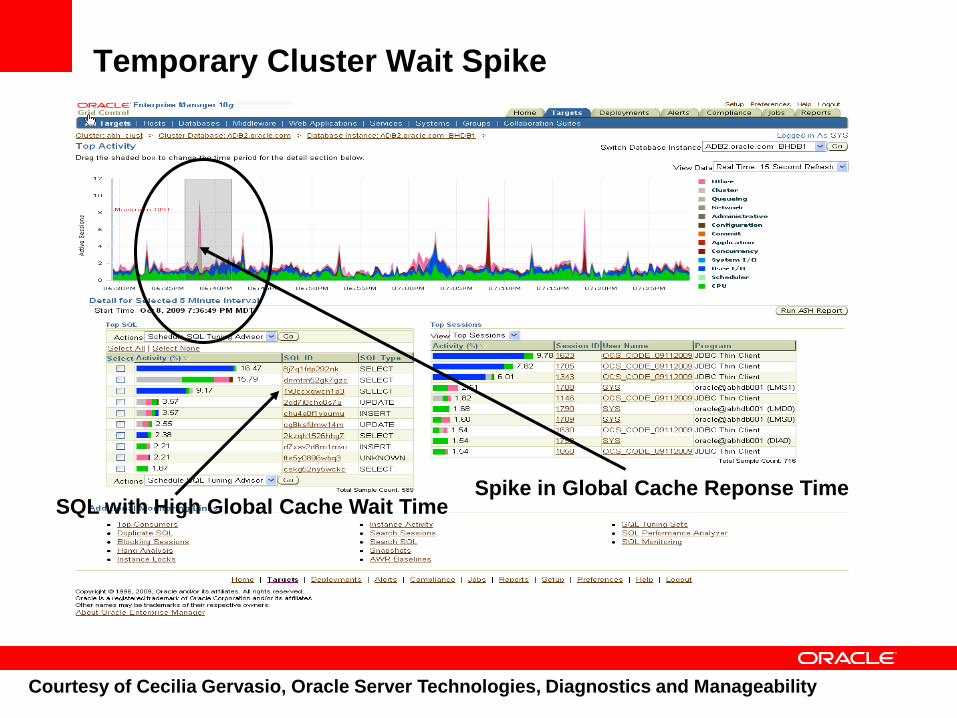
Temporary Cluster Wait Spike
Spike in Global Cache Reponse TimeSQL with High Global Cache Wait Time
Courtesy of Cecilia Gervasio, Oracle Server Technologies, Diagnostics and Manageability
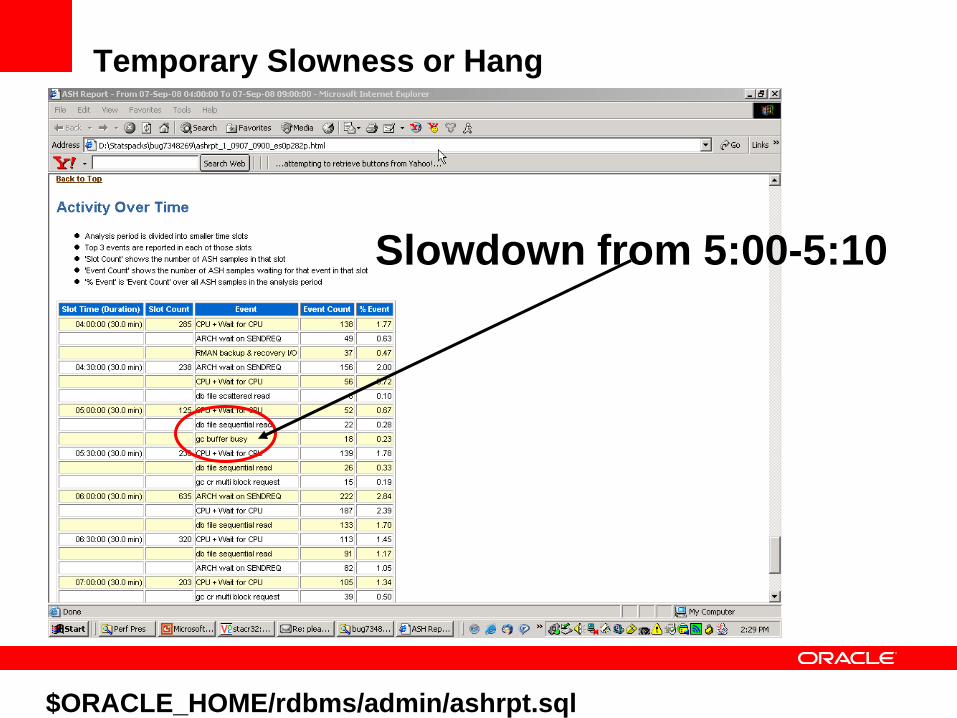
Temporary Slowness or Hang
Slowdown from 5:00-5:10
$ORACLE_HOME/rdbms/admin/ashrpt.sql

Additional Diagnostics for Transient Issues
Active Session History reports ( all nodes )
Set event 10899 system-wide to alert when threshold for global cache latencies is exceeded
Event 10899 trace name context forever, level <microseconds>
LGWR trace files would contain alert when latency threshold for log IO is exceeded
In 11.2, the alarm threshold is configurable.
Continuous OS Statistics
Cluster Health Monitor (IPD/OS)
Hang and Blocker information
DIA0 trace files
Active Session History reports

<Insert Picture Here>
Conclusions

Guidelines for a well-performing RAC systems
Thorough configuration and testing of infrastructure is
basis for stable performance
Anticipation of application and database bottleneck and
their possible magnified impact in Oracle RAC is
relatively simple
Enterprise Manager provides monitoring and quick
diagnosis of cluster-wide issues
Basic intuitive and empirical guidelines to approach
performance problems suffice for all practical purposes

Q U E S T I O N S
A N S W E R S
http://otn.oracle.com/rac

<Insert Picture Here>
Appendix

Appendix : Quick Fixes
Without modifying Application
Indexes with right-growing characteristics
Cache sequence numbers per instance
Hash or range partition table with LOCAL indexes
Frequent updates of “small” and compact tables
Reduce block size ( 2K ) and row density of blocks
(PCTFREE 99 )
Frequently modified LOBS
Hash partitions ( 128 – 256 )
FREE POOLS

Appendix: Quick Fixes
file header contention for parallel loads and inserts
More files and tablespaces
Large , uniform extents

References
http://www.oracle.com/technology/products/database/clustering/pdf/s31
1441_oow2009_perf.pdf
http://otn.oracle.com/rac
