s p a r c - earth, atmospheric, and planetary physics...
TRANSCRIPT

S P A R C 2008
Newsletter no30January
STRATOSPHERIC PROCESSES AND THEIR ROLE IN CLIMATE
A Project of the World Climate Research Programme
Report on the 15th Session of the SPARC Scientific Steering Group
18-21 September 2007, Bremen, Germany
N. McFarlane, SPARC IPO, University of Toronto, Canada ([email protected])T. G. Shepherd, University of Toronto, Canada ([email protected])T. Peter, ETH Zürich, Switzerland ([email protected])
Contents
Report on the 15th Session of the SPARC SSG, by N. McFarlane et al....................1
SPARC GA 2008 Announcement.........9
Upper Tropospheric Humidity: A Report on an international workshop, by T. Peter et al.....................................9
SPARC water vapour initiative, by C. Schiller et al..............................16
Report on the 3rd SPARC CCMVal workshop, by V. Eyring et al.............17
Overview of the New CCMVal Refer-ence and Sensitivity Simulation..., by V. Eyring et al................................20
Report on the Joint SPARC Workshop in Data Assimilation and International Polar Year (IPY), by S. Ploavarapu et al.........................27
Report on the Regional SPARC Science
workshop, by B.-M. Sinnhuber et al.....33
Future Meetings...................................36
The 15th session of the SPARC Scientific Steering Group (SSG) was hosted by the Institute for Environmental Physics and Remote Sensing (IUP) of the University of Bremen at the invitation of John Burrows. The first afternoon was held jointly with the final session of the Regional SPARC Workshop that was held at the University of Bremen on September 17-18, 2007.
This year’s SSG meeting marked a year of significant developments within SPARC, with the appointment of new Co-Chairs (Tom Peter and Ted Shepherd) and four new SSG members (Anne Thompson, Greg Bodeker, David Fahey and P.C.S. Devara), and with new and rejuvenated ac-tivities getting under way. In his opening remarks, Tom Peter thanked the outgoing Co-Chairs, A.R. Ravishankara and Alan O’Neill, for their years of excellent leader-ship and service to SPARC. For the benefit of the new SSG members and participants he also reviewed the organization and ac-tivities of the SPARC project and its role within WCRP
Summary of SPARC Activities in the past year
In the last year there were a number of SPARC sponsored and related work-shops and meetings, several of which are
discussed below and elsewhere in this newsletter.
The SPARC Office has received an ex-tension of its funding from the Canadian Foundation for Climate and Atmospheric Sciences to keep it operational until early 2011. It has also received additional fund-ing for the two-year period of the IPY to enable the hiring of Elham Farahani as the SPARC-IPY coordination scientist and thereby facilitate progress in the SPARC-IPY Activity, which has become fully active in the last year (see further discussion below).
JSC outcomes and WCRP update
The 28th session of the WCRP Joint Scien-tific Committee was held in March 2007 and reported upon in SPARC Newsletter No. 29. Ted Shepherd summarized the main outcomes of the JSC meeting and current issues for the WCRP as they affect SPARC.
The March 2007 JSC meeting reaffirmed the central role of the WCRP core projects and working groups in delivering WCRP science. SPARC was commended by the JSC for its focus, its evolution, its high-impact activities, and for bridging between the climate and NWP communities. The
developments within the AC&C initiative were also very well received.
Vladimir Ryabinin gave an overview of the WCRP and its place within the World Climate Program (WCP) and the Earth System Science Partnership (ESSP). The founding objectives of the WCRP are to determine the predictability of climate and the effect of human activities on cli-mate. More recently the scope of WCRP has broadened to connect with impacts and adaptation, and include capacity build-ing. This reflects developments within the international community and priorities of
53294-1 SPARC.indd 1 12/11/07 10:54:52 AM

2
funding agencies worldwide. In principle, the WCP and ESSP provide natural vehi-cles for this broadening.
The COPES (Coordinated Observation and Prediction of the Earth System) initiative remains WCRP’s Strategic Framework for 2005-2015. Implementing the COPES strategy is a continuing preoccupation of the WCRP but the guiding principle is that new initiatives or rearrangements of activities and responsibilities, for example between the core projects and cross-cutting activities, must be science driven while at the same time responsive to user needs. Within SPARC the CCMVal and DynVar activities are particularly well positioned to contribute to COPES. Seamless predic-tion, an underlying theme of COPES, will be the central theme of the WCRP/WWRP/IGBP Modelling Summit to be held in May 2008.
In the discussion following the opening presentations a number of issues were noted. The importance of the stratosphere in climate simulations remains an abiding issue that will be addressed in a focused way within the DynVar activity. Surface processes must be taken into account in modelling of the whole atmosphere and so are important for SPARC. In this respect interactions with activities such as SOLAS and iLEAPS should be considered. A solid suggestion arising from the discussion was that an update of the WAVAS report would be timely.
Regional SPARC related research
As precursor to the poster session that was held in conjunction with the Re-gional SPARC Workshop, Björn-Martin Sinnhuber provided an overview of the research that was presented during the preceding two days of the workshop and in the poster session. (See the report by Sinnhuber et al., in this newsletter.) Much of the work presented was related to the TTL and focussed on results from several observational campaigns. The Regional SPARC Workshop was very successful and holding it just before the beginning of the SPARC SSG meeting was synergistic. It is in the interest of SPARC to encourage and facilitate such activities in the future.
SPARC Themes
Detection/Attribution/Prediction
Decadal Predictability:In an invited presentation to the SSG, Noel Keenlyside discussed recent work on decadal scale prediction as a combined initial and boundary value problem. Much of this work has focused on associating decadal scale variations in the 20th cen-tury with both natural and anthropogenic causes. There is evidence for multi-decadal variability in several areas where such vari-ability may have strong socio-economic impacts (rainfall in the Sahel, hurricane activity, and Atlantic sea surface tempera-ture). The mechanisms for these mani-festations of variability are not certain. In specific instances they could involve inter-nal modes of variability of the atmosphere, ocean or both.
There are several ways in which the strato-sphere may play a role in decadal vari-ability. Enhanced variance of temperature is found in the NAM/SAM regions where there are strong interactions between the troposphere and stratosphere. Variabil-ity in the oceanic meridional overturning circulation (MOC) may also be linked to annular mode variability. Decadal scale variability in the stratosphere is associated with a range of processes including solar forcing and ozone changes. It is anticipated that decadal predictions using initialized coupled models will play a role in the next IPCC assessment (AR5). The likelihood of an important role for the stratosphere in decadal variability of the troposphere (and vice versa) indicates the importance of in-cluding the stratosphere in such coupled prediction models. Understanding the role of stratospheric processes (chemistry, dy-namics, solar forcing) in decadal scale vari-ability of the earth-atmosphere system is an important challenge for SPARC.
Temperature Trends:An update on the work of the SPARC Temperature Trends Assessment group was provided by Bill Randel. The most recent meeting of the group was held in Washington in April 2007. A paper on up-dated stratospheric temperature trends is near completion with submission expected before the end of 2007. The most recent temperature trends time series include ex-tensions back to the 1960s using radiosonde data and recent adjustments remove the
effects of biased radiosonde stations on the time series. The paper will also incorporate recent updates concerning SSU data. There is now an appreciation of the fact that CO
2
increases have raised the altitude of the SSU weighting functions, resulting in an apparent positive temperature trend in the stratosphere. It has also now been realized that the highest of the so-called X chan-nels (47X) has weighting functions that are strongly dependant on latitude, making interpretation of global temperature trends more difficult. This channel will, therefore, likely be excluded from the analysis.
Outstanding issues for the future include: (a) continued homogenization of radio-sonde data sets; (b) further analyses of his-torical satellite data (independent analysis of SSU data would be particularly valu-able); (c) use of GPS as a climate moni-toring tool; and (d) improved capability of reanalyses for the stratosphere.
With regard to the latter, Bill Randel also drew attention to a number of develop-ments and issues in regard to reanalyses. The Third WCRP International Conference on Reanalysis will be held in January 2008 in Tokyo. A number of papers on strato-spheric topics have been submitted. Other reanalysis developments include:
(a) An ECMWF “interim reanalysis” is being produced using 4-DVar. This will cover the period after 1989, and address several problems evident in ERA40. Pro-duction began in 2006 and will reach the present day in 2008, after which it will be updated in near-real-time.
(b) Homogenization of SSU data for future reanalyses is in progress at ECMWF. This includes documenting biases be-tween overlapping SSU instruments, and collecting information on cell pressure losses for each SSU instrument. This will improve the time consistency of stratospheric analyses, especially in the 1980’s. Proper handling of the transition from SSU (which ends in 2005) to AMSU (which begins in 1998) will be criti-cal to stratospheric temperature trends.
(c) At NASA, GMAO is about to begin production of a satellite-era (1979-
present) reanalysis, termed Modern Era Retrospective analysis for Research and Application (MERRA).
53294-1 SPARC.indd 2 12/11/07 10:54:52 AM

3
Stratosphere-Troposphere Dynamical Coupling
Mark Baldwin discussed several aspects of current activities relevant to stratosphere-troposphere coupling, beginning with a brief report on the WCRP Workshop on Seasonal Prediction that was held in Bar-celona in June 2007. In addition to a key-note talk by Mark Baldwin (“Why should we care about the stratosphere?”) there was a SPARC session entitled Stratospheric Processes and Seasonal Prediction. The programme and a number of the presenta-tions are available for downloading at the TFSP web pages: http://www.clivar.org/organization/wgsip/spw/spw_main.php.
Mark Baldwin also noted the upcoming Chapman conference in Santorini (Sep-tember 24-28, 2007) which covers a broad range of topics on stratospheric processes and modeling, includes seasonal prediction and climate change. In general, the role of stratosphere-troposphere dynamical cou-pling has not received the attention it de-serves in the IPCC assessments or within operational seasonal prediction activities. This issue is one that can be addressed in general within the DynVar activity. Mark Baldwin proposed that a simplified annular mode index could become a standard diag-nostic of stratosphere-troposphere coupling in prediction models and climate change assessments, which is much less computa-tionally demanding to produce than the full 3-dimensional EOF.
Paul Kushner discussed progress in the Dynamics and Variability (DynVar) activ-ity. This activity was proposed at the 2006
SSG meeting and subse-quently endorsed by the JSC at its March 2007 meeting. In the inter-vening time substantial progress has been made in developing DynVar, following the plan pub-lished in SPARC News-letter No. 29. A web site for the Activity has been set up at http://www.sparcdynvar.org/. Pre-liminary analyses are be-ing carried out to refine the science goals. A plan-ning workshop will be held in Toronto in March 2008, in conjunction
with a workshop on gravity waves (see re-juvenated gravity-wave initiative below). It is anticipated that these workshops will be synergistic as it is now well established that gravity-wave drag parameterizations play a significant role in model simulations of stratospheric dynamics and stratosphere-troposphere coupling.
Chemistry – Climate Coupling
CCMVal Update:Veronika Eyring summarized recent developments within the CCMVal activity. CCMVal had achieved some notable suc-cesses in the last two years, most visibly the organization and analysis of the CCM simulations that provided a major under-pinning for the 2006 WMO/UNEP Ozone Assessment and which were also included in the IPCC AR4. In large part these suc-cesses were the result of careful planning, effective engagement of the CCM commu-nity, and timely completion of sub-projects. Two summary papers on the REF1 (past) and REF2 (future) CCM simulations have been published in JGR (Eyring et al., 2006, 2007), and several more incomparison pa-pers based on the BADC archive are cur-rently in progress.
The 3rd CCMVal workshop, held in Leeds, UK in June 2007, was very well attended and successful (see the report in this newsletter).
Darryn Waugh summarized CCMVal’s plans to prepare a SPARC report on evalu-ation of CCMs. The aims of the report are to evaluate the ability of CCMs to represent the stratospheric ozone layer, stratospheric
climate and variability, and the coupled ozone-climate response to natural and an-thropogenic forcing. The report will be completed by late 2009 so as to enable its use as a source of timely information for the next WMO/UNEP Ozone Assessment and the expected IPCC AR5. Lead authors for all 10 chapters have been identified, and the Leeds workshop helped to define the chapter outlines.
An innovative feature proposed for this re-port is that it will attempt to assign quanti-tative evaluations (scores) to model perfor-mance for different diagnostic tests. This will enable a quantitative assessment of improvements made during model devel-opment, and make it possible to assign rel-ative weights to the projections by the dif-ferent models and to form a “best estimate” that takes into account differing abilities of models to reproduce key processes. This proposal was discussed vigorously. Basic requirements for such a grading system are that it be transparent in its application and that the “best estimates” derived from it also include measures of uncertainty.
New CCM simulations in support of the CCMVal report and future assessments were discussed at the CCMVal workshop and subsequently refined (see the report in this newsletter).
The Role of Halogens in Ozone Deple-tion: A Proposed SPARC Workshop/Study:The implications of new data on the pho-tolysis rate of the ClO dimer were raised in a presentation by Markus Rex in the Regional SPARC Workshop, and then dis-cussed again at intervals throughout the SSG meeting. This issue is considered to be of such concern that a timely action by SPARC is required. A proposal, presented by Mike Kurylo, for a focused workshop and well defined follow-on deliverables was strongly supported. The workshop will have three principal objectives:
(i) Evaluate the consequence of the new data on the photolysis rate of the ClO di-mer on simulations of stratospheric ozone depletion, particular in winter polar re-gions.
(ii) Evaluate the new results for the pho-tolysis rate and the type of further studies that are required to resolve current differ-ences in laboratory studies.
(iii) Assess the qualitative and quantitative
SPARC Co-Chairs: T. Peter and T.G. Shepherd
53294-1 SPARC.indd 3 12/17/07 2:16:45 PM

4
evidence from laboratory studies, field observations and models that links ozone depletion to active chlorine and bromine amounts in the stratosphere.
The main deliverables will be a white pa-per describing points (i) and (ii) above and a peer-reviewed manuscript describing point (iii). Key participants must include laboratory kineticists, field experimental investigators, and modellers. The work-shop should be held in early 2008 at the latest with deliverables following in 6-12 months, so as to be available for the next WMO/UNEP Ozone Assessment.
Atmospheric Chemistry and Climate–SPARC/IGAC Interactions
A. R. Ravishankara reviewed progress in the WCRP/IGBP Atmospheric Chemistry and Climate (AC&C) Initiative. The report published in SPARC Newsletter No. 29 summarizes the background and motiva-tion for AC&C and provides details of its structure and activities. Progress has been steady, but there are a number of issues that require attention in the coming year. These include engaging activity leaders from out-side of the US, convening a steering com-mittee for AC&C, and beginning prototype model simulations. The first-phase AC&C activities, as they involving modeling, will have to deal with data managing and ar-chiving issues that are similar to those that have been and/or are continuing issues for SPARC (CCMVal in particular).
Issues Arising from the Recent Assessments
The 2006 WMO/UNEP Ozone Assessment
Some key issues arising from the 2006 Ozone Assessment were discussed by Shepherd and Randel in an article in SPARC Newsletter No. 29. Ted Shepherd reiterated these, emphasizing that despite substantial improvement in CCMs in recent years, serious quantitative discrepancies remain. Some of the discrepancies seen in the assessment in terms of the magnitude of ozone depletion may reflect weaknesses with the analysis method which tried to find a 1980 baseline from data after 1980. However, the absolute magnitudes of polar total ozone in the CCMs are generally poor, especially in the Arctic.
A.R. Ravishankara noted that the remit emerging from the recent Meeting of the Parties to the Montreal Protocol is to deal with a number of key issues such as assess-ment of the state of the ozone layer and its progress towards recovery; assessment of the mutual impacts of climate change and ozone recovery, and assessment of consis-tent approaches to evaluating the impact of very short-lived substances, including po-tential ODS substitutes on the ozone layer.
These issues raise several key questions for the 2010 assessment: (a) Can ODSs be dealt with separately from ozone? (b) What is the “baseline” (and is it even needed?), in particular are pre-1980 values the most ap-propriate? (c) Is the idea of “super-recov-ery” needed? (d) Is current understanding consistent (e.g. ozone trends in the tropics, vertical profile and regionality of ozone trends)? (e) Is it possible to better quantify the effects of polar ozone depletion on mid-latitude depletion?
A number of steps can be taken by SPARC to “shape” the next assessment including:(a) holding a workshop and perhaps consti-tuting a working group on ozone recovery, (b) developing better approaches to quan-tifying age of air, lifetimes of ODSs, and dealing with very short-lived substances (perhaps within the AC&C initiative), (c) facilitating through CCMVal continued contributions on climate-ozone linkages.
IPCC AR4
In an invited presentation to the SSG, Piers Forster reviewed issues for SPARC arising from the IPCC AR4. He noted that the AR4 had an unprecedented level of SPARC-friendly authorship and, in his view, strato-spheric issues were very well covered in the report. For example, a basic conclusion of the AR4 is that the observed pattern of tropospheric warming and stratospheric cooling is very likely due to the combined influences of greenhouse gas increases and stratospheric ozone depletion.
Notwithstanding the growing recognition of the role of the stratosphere, climate change science is diversifying with more components of the climate system taking on added significance, and the onus is on the SPARC community to prove its con-tinued relevance. There were many gaps in IPCC AR4 that are relevant to SPARC. In regard to forcings, stratospheric ozone
has not been updated since the IPCC TAR, stratospheric water vapour remains a key uncertainty, and solar indirect effects were not evaluated. Other gaps include the little attention given to (a) variability and change of mid to upper stratospheric temperatures, (b) the dynamical response to solar forcing and volcanoes, (c) the role of the strato-sphere in simulations of modes of variabil-ity (SAM/NAM/QBO) their importance for surface climate change, and (d) directly relating stratospheric processes to regional surface changes — particularly outside of Antarctica.
Although the role of the stratosphere is, for the first time, mentioned in the chapter of the AR4 dealing with projections of climate change, climate modelling groups still don’t pay sufficient attention to the role of the stratosphere (as noted also in the presenta-tion of Mark Baldwin). Two key issues that SPARC should address are: (a) the discrep-ancy between what the report says in terms of understanding and what is in the models (since modelling groups must be convinced that the stratosphere is relevant if they are going to commit resources to its represen-tation); (b) the need to provide information in a correct, user-friendly way for the next IPCC report (e.g. calculate forcings, effects on surface; tell modelling groups what reso-lution is needed in the stratosphere).
Issues for IPCC AR5
Although an IPCC AR5 is not yet assured, planning for modelling and analysis activi-ties in support of it are under way in most of the major modelling centres and were a major focus of the recent WGCM meeting in Hamburg. Veronika Eyring and Marco Giorgetta represented SPARC at this meet-ing. They summarized for the SSG the dis-cussions and issues of concern to SPARC that were raised at the meeting.
SPARC and AC&C contributions to the coordinated AOGCM and ESM experi-ments in support of AR5 (if there is one) should include providing ozone fields. As a first step, a “best guess” of ozone from the CCMVal simulations performed in support of the recent WMO/UNEP Ozone Assess-ment could be used to derive ozone chang-es to drive the IPCC models. However, there are a number of issues for SPARC and AC&C to resolve in addressing this goal. What is the best approach to provid-ing chemical fields such as ozone for use
53294-1 SPARC.indd 4 12/11/07 10:54:53 AM

in ESM simulations: existing CCMVal runs or new runs that are consistent with new scenarios? What is the optimal approach to produce a best guess and uncertain-ties: multi-model or weighted mean? How to handle grading and weighting issues? Should observations be used for periods up to the present day and combined with pro-jections for the future? How can model re-sults and observations be combined so as to account for uncertainties and biases? (See also the report on CCMVal reference and sensitivity simulations in this newsletter).
Cross-Cutting Activities
Gravity-wave Initiative
Activity within the SPARC gravity-wave initiative has waned in recent years. However, understanding the role of gravity waves in the dynamics of the atmospheric general circulation and improving grav-ity-wave drag parameterizations continues to be a critical modelling issue. With the advent of DynVar, rejuvenation of the grav-ity-wave initiative is important.
Joan Alexander summarized historical and current gravity-wave issues relevant to SPARC and some new research develop-ments, and suggested some research activi-ties that could form the basis of a rejuve-nated SPARC gravity-wave initiative.
Progress in computing technology has en-abled simulation of vertically propagating gravity waves and their interaction with the larger scale flow on increasingly broad ranges of spatial and temporal scales. Ad-vances have been made in the use of data assimilation techniques to estimate gravity-wave drag from wind observations. Prog-ress has also been made in estimating grav-ity-wave properties, such as the magnitude of vertical momentum flux, from satellite measurements.
An immediate goal of a new gravity-wave initiative for SPARC could be to apply new observational constraints on momen-tum fluxes to parameterizations in global models. In the near term it would also be valuable to combine these observational constraints with “missing force” determi-nations from various analysis systems to examine the strengths and weaknesses of various parameterization schemes.
It was agreed that a useful first step in
developing a rejuvenated SPARC grav-ity-wave initiative would be to convene a workshop in which modellers and observa-tionalists met together to begin the process of developing new model diagnostics and observationally-based quantities that may be compared. In discussion it was clear that the new SPARC gravity-wave initiative will be synergistic with the DynVar activ-ity and that the two efforts should evolve in a closely collaborative way. The proposed first step of holding a gravity-wave work-shop jointly with the DynVar workshop in March 2008 was endorsed by the SSG.
SOLARIS and Solar Variability
Katja Matthes and Kuni Kodera dis-cussed recent activities and current issues within the SOLARIS project. A summary of the first SOLARIS workshop was published in SPARC Newsletter No. 28 (Matthes et al., 2007), and an analysis of the solar sig-nal in CCMVal REF1 simulations has been published (Austin et al., ACPD, 2007).
An understanding of the processes of im-portance for simulating the solar signal is developing. However, many effects are still not well understood. Newer CCMs show better agreement with observations but the reasons are not fully undersood. Variable solar forcing and variable SSTs appear to play a role. The role of the nonlinear in-teraction between the QBO and the solar signal in climate simulations is not well understood. Additionally, there is evidence for a difference, between maxima and min-ima of solar forcing, in the magnitude and vertical extent of the stratospheric cooling that is associated with increasing CO
2. A
goal of SOLARIS is to address these is-sues through a series of carefully designed and coordinated modelling studies, pref-erably involving 3-4 different modelling groups. These may involve both CCMs and AGCMs. Among the experiments planned for the near future are (a) simulations (ap-proximately 50 simulated years in length) using CCMs with a fixed solar cycle and variable QBO, and (b) AGCM simulations with prescribed heating rates (from whole atmosphere CCMs such as WACCM or HAMMONIA) plus variable QBO (inter-nally generated or prescribed).
Upcoming SOLARIS project activities in-clude the CAWSES symposium in Kyoto in October 2007 and the SOLARIS session at the EGU meeting in April 2008 (Solar
Influence on the Middle Atmosphere and Dynamical Coupling to the Troposphere, convenors: Katja Matthes, Kuni Kodera and Lesley Gray).
Aerosols and PSCs
On behalf of Larry Thomason and col-laborators, Tom Peter summarized recent and ongoing work on characterization of Polar Stratospheric Clouds with CALIPSO. Significant gaps in knowledge concerning PSCs still exist including understanding of the role of large solid particle forma-tion (NAT rocks) and their denitrification potential, and accurate representation of PSCs in global models and their quanti-tative influence on predictions of future ozone loss. CALIPSO provides a com-prehensive picture of PSCs. Ongoing and future work includes: (a) utilizing com-bined measurements from CALIPSO and other instruments to investigate evolution and formation of PSCs, (b) producing ro-bust inferences of PSC bulk microphysical properties such as surface area density, (c) partnering with chemical modelling groups to assess and improve PSC parameteriza-tion schemes.
The Tropical Tropopause Layer – SPARC/IGAC/GEWEX Links
Thomas Birner summarized the history and recent activities within the collabora-tive activity between SPARC, GEWEX, and IGAC on the role of deep convection in the tropical tropopause layer (TTL). This activity began with the TTL work-shop in Victoria, Canada in 2006. Among the issues raised at this workshop were: (a) questions concerning the performance of cloud-resolving models (CRMs) at TTL altitudes (important parametrizations such as subgrid scale mixing and microphysics are conventionally tested at much lower al-titudes), (b) the supersaturation puzzle (do we understand cloud/condensation micro-physics at TTL altitudes/temperatures?), and (c) using results from the many recent field campaigns to explicitly address TTL questions.
Since the Victoria workshop some specific efforts have begun. A TTL case study is be-ing developed to evaluate the role of dif-ferent microphysical processes in CRMs in the water vapour budget of the TTL and water vapour transport across the cold point. Encouraging preliminary results for
5
53294-1 SPARC.indd 5 12/11/07 10:54:54 AM

this case study have been generated by W. Grabowski. It is planned to present this case study for consideration by the GEWEX/GCSS deep convection working group at the pan-GCSS workshop in June 2008.
Other work that is promising as a means of understanding dynamical influences of convection in the TTL includes studies with the highly anisotropic tropics-wide domain (1 km zonally, 40 km meridionally) model-ing framework used by Shutts and collabo-rators (Shutts et al., DAO, 2007) to study the dynamics of Hadley cells, convectively coupled waves, etc. the recent evaluation of the ability of GCMs to simulate key fea-tures of the TTL (Gettelman and Birner, JGR, in press).
The SPARC Tropopause Initiative
At the 2006 SSG meeting, Andrew Gettelman, Peter Haynes, and Marv Geller were tasked with looking at the status of tropopause research and reporting back to the SSG on the merits of an organized activity on this topic. A summary article (Gettelman et al.,) which included a pro-posal for such an activity was published in SPARC Newsletter No. 29. Peter Haynes summarized the current status of this ini-tiative proposal. He noted that a number of SPARC workshops dealing with tropo-pause related topics have been held since 1993 and reported upon in SPARC news-letters. The areas of interest in tropopause related research can be broadly subdivided into topics relating to the tropics (TTL), extratropics (ExTL), tropical-extratropical interaction, and climate change.
In regard to the tropics the research situ-ation and state of activities is relatively healthy. A TTL paradigm has emerged and evolved over last 10 years and there is active research dealing with stratospheric water vapour, the TTL as the gateway to the stratosphere for tropospheric source gases, particularly VSLS, many measure-ment campaigns (SOWER, Aura valida-tion, SCOUT-O3, ACTIVE, TC4, AMMA) and associated meetings. In addition, the SPARC-GEWEX- IGAC TTL initiative is developing.
In regard to the extratropics there have been activities stimulated by previous and new observations and measurement campaigns, but there has not yet been a significant con-vergence of ideas.
In regard to tropical-extratropical interac-tion there are several issues concerning two-way interactions that should not be overlooked in the current focus on the TTL. The importance of transport from the TTL to the extratropical lowermost stratosphere is being rediscovered, e.g. the largest po-tential impact of VSLS on ozone. These in-teractions play an important role in setting the chemical composition of extratropical lowermost stratosphere and its temporal (e.g. seasonal) variation. Transport from the extratropics likewise plays a role in set-ting the structure of the TTL.
In regard to climate change, there are many interesting science questions: How will the tropopause and stratosphere-troposphere ex-change change and what does this mean (e.g. taking a particular tropopause definition)? What is the role of the tropopause region (dynamical and chemical structure) in cli-mate change (‘climate sensitivity to changes in tropopause region’)? What is the role of the UTLS in dynamical coupling between troposphere and stratosphere? Are chem-ical-climate interactions in the UTLS the next challenge for CCMs? More program-matically, is there a gap in AC&C between the CCMVal and TropChem activities?
A web site (http://www.acd.ucar.edu/sparctrop) has been set up as a commu-nication medium with links to the SPARC Office, data, papers, and other activities (e.g. CCMVal). Upcoming relevant ac-tivities include the UTLS session at the AGU meeting (Fall 2007), and TTL and Extratropical UTLS sessions at the EGU meeting (Spring 2008). Possible future activities include a focused workshop in 2009 in light of the above and a study of chemical-climate interactions in the UTLS.
SPARC Data Assimilation Working Group and SPARC-IPY
Saroja Polavarapu summarized activi-ties of the data assimilation working group over the last year. The combined SPARC-DA and SPARC-IPY workshop in Toronto in September 2007 was very successful (see the report in this newsletter). Because of the SPARC General Assembly in 2008, the next SPARC-DA workshop will not be held until 2009 at a location yet to be determined. Ellie Farahani gave an overview of the SPARC-IPY activity. A major current fo-
cus within the SPARC-DA working group is on addressing the data assimilation component of the SPARC-IPY activity. The new SPARC-IPY archive of analyses is now receiving data. This archive will include data from two Canadian assimila-tion systems (the operational GEM-BACH and the research CMAM-DAS systems) as well as from other major operational cen-ters such as ECMWF, Met Office, NCEP, GMAO, and KNMI. SPARC-IPY data is being made available through the SPARC Data Center and can be accessed by regis-tering as a SPARC-IPY user following the procedures documented on the Data Center web site.
While the data assimilation component of SPARC-IPY is under way and functioning well, there are a number of other aspects of the activity, predominantly associated with the observational component, that are more diverse and in varying states of prog-ress. Several of these were reviewed at the workshop. Issues such as acquisition and management of observational data and out-reach were also discussed. (See the work-shop report in this newsletter).
Pablo Canziani gave a brief summary of ongoing work on stratosphere-tropo-sphere coupling studies at high southern latitudes and work on Antarctic Historical Data analysis. This involves recovery and consistency checking of historical data sets in the region, particularly for Antarctica, where there are few but valuable observa-tions starting after the Second World War.
Coordination with other agencies and programmes
Jörg Langen presented an update of ESA activities relevant to SPARC. The ERS-2 and Envisat satellites are currently in orbit and performing well. Envisat carries the GOMOS, MIPAS, and SCIAMACHY in-struments. The main objectives of these sat-ellites are to provide accurate stratospheric ozone profiling for studies of stratospheric chemistry and dynamics. The expected life-time of Envisat is 2014. Future approved Earth Explorer missions include the ADM-Aeolus and EarthCARE missions. ADM-Aeolus is a wind profiling mission with an expected launch date in 2009. The Earth Clouds, Aerosol and Radiation Experiment (EarthCARE) mission involves a collabo-ration between ESA, NICT, and JAXA. Its mission objective is to quantify aerosol-
6
53294-1 SPARC.indd 6 12/18/07 9:04:06 AM

cloud-radiation interactions so they may be included correctly in climate and numerical weather forecasting models.
Several candidate Earth Explorer missions are under consideration, for the most rel-evant for SPARC being PREMIER (PRo-cess Exploration through Measurements of Infrared and millimetre-wave Emitted Radiation)
Rolf von Kuhlman discussed activities related to atmospheric composition and climate within the German Space Agency (DLR). There is strong DLR input into current and planned ESA missions dealing with atmospheric composition. However, there is no dedicated budget line in DLR for atmospheric missions. The German strategy builds on supporting activities and technology developments for European missions, utilizing the high level of compe-tence within DLR in lidar and high spectral resolution optical systems.
Mike Kurylo presented an update on mea-surements of atmospheric composition within the NASA Earth System Science program. This program employs a range of observing systems including satellites, aircraft, balloons, and ground-based ob-serving systems. There have been notable accomplishments in this program. The sat-ellite measurement program has produced significant global observations relevant to ozone (e.g. 25 years of merged TOMS and SBUV measurements) and ozone chem-istry, air quality, and climate. Valuable supplementary measurements have come from various sub-orbital field campaigns and long-term ground-based observing networks. Modelling and data analysis systems have been developed to help with interpretation of satellite data and contrib-uted to the latest WMO/UNEP assessment of ozone depletion.
A number of NASA satellite missions and programs for measurement of atmospheric composition may be limited in the fu-ture by funding constraints. A number of sub-orbital field programs for science and validation are planned for coming years but several are subject to uncertainties in either platform availability or availability of resources.
Shuji Kawakami presented a survey of cur-rent and planned activities within the JAXA Earth Observation Program. Currently the
program focuses on the Asia-Pacific region and priority areas are (a) reduction and prevention of disasters, (b) climate change including water-cycle variation, and (c) global warming and carbon cycle change.
Within the climate change/water cycle pro-gram currently operational instruments on the AM SR-E platform include the TRMM precipitation radar and passive microwave radiometers (AQUA) for measuring surface variables (SST, sea ice, soil moisture). Fol-low-on and expanded missions are planned for 2009 and beyond to enable measure-ment of a range of variables including sur-face wind speed, temperature, sea ice con-centration, soil moisture, integrated water vapour and cloud water, precipitation, and snow depth. JAXA will provide a cloud profiling radar as a component of ESA’s EarthCARE payload.
Christian von Savigny gave an over-view of the activities of the Limb Working Group which includes the OSIRIS, SAGE III, SCIAMACHY and OMPS teams. This group has held annual workshops for the last four years, co-sponsored by WCRP/SPARC, which have focussed on algorithm development, sensitivity analyses and er-ror budgets, validation of data products, scientific applications, and common prob-lems and solutions. The limb community is growing, and workshops/conferences will continue in the future.
Measurements with current and previous (SAGE II and III, HALOE, POAM III) limb scatter instruments have produced a wide range of products including vertical profiles for several gaseous chemical con-stituents as well aerosol extinction and PSC measurements. The limb-scatter instru-ments have demonstrated great potential, and will fill the gaps left by the shut-down of solar occultation instruments. Future limb-scatter missions are needed to pro-vide global profile information of relevant minor constituents and aerosols.
Stella Melo presented an overview of the Canadian Space Agency (CSA) Atmo-spheric Environment Program and current and planned missions. Currently opera-tional missions include the MOPITT in-strument on the TERRA satellite, OSIRIS on the Odin satellite, ACE-FTS and MAESTRO on SciSat, and partnership activities in the NASA CloudSat mission.
MOPITT has been in operation since 1999 and has produced the longest existing global record of carbon monoxide measurements. However, as the MOPITT technology is now 10 years old a follow-on instrument (MOPITT-II/MAPLE) is currently under development. OSIRIS was launched in 2001 and produces measurements of ozone in the 7-60 km altitude range and of NO
2
and aerosols in the 10-40 km range. Aero-sol extinction profiles are currently avail-able and work is under way to produce ad-ditional products including number density and size distributions of sulphate aerosols. ACE-FTS and MAESTRO were launched in 2003 and together provide profile mea-surements of a large number of chemical species. They will be continued at least through the IPY period. The possibility of flying an ACE-FTS follow-on is under con-sideration.
The one future CSA atmospheric mission currently in the works is Chinook, which consists of SWIFT (which will measure stratospheric winds and ozone fluxes) and a GPS receiver known as ARGO. However, there are some budget con-cerns and the mission is currently on hold pending further technical development. It was noted in discussion that SWIFT’s measurements will be unique and would be of particular interest to SPARC, given the growing recognition of the importance of tropical stratospheric winds in climate variability and stratosphere-troposphere coupling, and the fact that existing knowl-edge of tropical winds is very poor.
Update from Japan
Sachiko Hayashida reported on the new structure of the Science Council of Japan (SCJ) and its implications for the SPARC and IGAC communities in Japan. She also provided an update on the status of the ILAS/ILASI-II and SMILES missions.
The current structure of the SCJ includes a WCRP/IGBP joint committee with sub-committees for some of the WCRP and IGBP projects including a sub-commit-tee for SPARC, currently chaired by S. Hayashida. Both the SPARC and IGAC communities are active in Japan — for example a successful SPARC session was held at the 2007 meeting of the Japan Geo-sciences Union (JGU). However, a con-cern is that these two communities do not interact strongly with each other and the
7
53294-1 SPARC.indd 7 12/13/07 11:29:25 AM

SPARC community is less visible than the IGAC community. Increasing interactions and collaborations between the SPARC and IGAC communities in Japan is desir-able and would benefit both the Japanese and international research programmes.
The ILAS/ILAS-II project ended in March 2006, but data provision is ongoing through web sites (http://www-ilas.nies.go.jp/, http://www-ilas2.nies.go.jp/). S. Hayashida summarized several recent sci-entific results obtained using ILAS and ILAS-II data. SMILES (Superconduc-tive Submillimeter-WaveLimb-Emission Sounder ) will be launched in 2009. Its ob-jective is to provide measurements of trace gas compositions in the 10-60 km altitude range with a latitudinal coverage between 65oN and 38oS. Target gases include O
3,
HCl, ClO, HO2, HOCl, BrO, O
3 isotopes,
HNO3, and CH
3CN.
Discussion of the Geoengineering Proposal of P. Crutzen
Tom Peter led a discussion on the proposal by P. Crutzen published in an article in Climatic Change in 2006 entitled “Albedo enhancement by stratospheric sulfur injec-tions: A contribution to resolve a policy dilemma?”
This proposal has already received much attention in both popular and scientific lit-erature. Much of the discussion has focused on the impacts on the lower troposphere and surface of introducing such a sun-blocking layer in the stratosphere. Among the concerns that have been raised are that such a measure, if indeed viable, may have undesirable consequences such as interfer-ing with efforts to address the root cause of the global warming problem, namely human production of CO
2 and other green-
house gases through burning of fossil fuels. With such an outcome a number of serious environmental issues, such as acidification of the oceans due to increased CO
2 load-
ing in the atmosphere, would remain unad-dressed.
There has been less discussion of the im-pact that such a measure may have on the stratosphere. SPARC is the authoritative body to address this. The question consid-ered was whether it is already now timely for SPARC to do so. The discussion on this issue was vigorous. The consensus view that emerged was that there is currently
insufficient information for SPARC to is-sue an authoritative statement. Nor does it seem that SPARC would be well advised to undertake a study of the issue on its own (especially given the current commitments within CCMVal). However, the issue is im-portant and merits serious study, possibly as part of a wider geoengineering study that could be carried out within the WCRP. Therefore the Co-Chairs will bring this issue forward to the next meeting of the WCRP JSC in April 2008.
Update from the SPARC Data Center
Stefan Liess reported on the current status of the SPARC Data Center funding, hard-ware, data holdings, and planned enhance-ments in software. NASA has funded the Data Center operations since 1999. A pro-posal for new funding for the SPARC Data Center has been under consideration by NASA for the past two years. The first year of this proposed new funding has recently been awarded but with a 20% reduction from the originally proposed level. Options for supplementary funding to make up this difference are being considered.
Hardware upgrades for the Data Center are under consideration. Also steps are now be-ing taken to establish a mirror site for the Data Center at Kyoto University. Enhance-ments of online downloading and plotting software are also being developed.
The 4th SPARC General Assembly
Elisa Manzini summarized the status of preparations for the 4th SPARC General Assembly (see the announcement in this newsletter). Planning is well under way with arrangements for the venue (the CNR Congress Centre, Bologna), local services, and registration services having been made. The scientific programme committee, joint-ly chaired by Peter Haynes and Tom Peter, is coordinating planning of the programme with the corresponding committee for the IGAC conference which will be held in the following week in Annecy-le-Vieux, France. Discussions are under way to coor-dinate registration fees for these two con-ferences to encourage cross-participation. A significant issue for the coming months is arrangement of funding to support participation by young scientists, scien-
tists from developing countries and other needy participants. The SPARC Office will assume responsibility for coordination of funding initiatives to provide such support.
Closure of the 15th session of the SSG and plans for the next SSG meeting
Because of the juxtaposition of the SPARC and IGAC conferences, the 2008 SPARC SSG meeting will not be held immediately following the General Assembly. Instead it will be held later, at a date to be deter-mined, in Toronto, Canada, hosted by the SPARC Office.
The 15th session of the SPARC SSG closed on Friday afternoon, with the Co-chairs thanking all for participating and reiterat-ing thanks to Prof. John Burrows and staff of the IUP for the excellent arrangements and assistance that was provided during the meeting.
8
53294-1 SPARC.indd 8 12/13/07 11:30:12 AM
Upper Tropospheric Humidity:A Report on an International Workshop
12-15 June 2007, Karlsruhe, Germany
T. Peter, ETH Zürich, Switzerland ([email protected])M. Krämer, Forschungszentrum Jülich, Germany ([email protected])O. Möhler, Forschungszentrum Karlsruhe, Germany ([email protected])
Background
Why does ice at the lowest atmospheric temperatures sometimes appear not to nucleate in aerosol particles? Why do thin cirrus clouds at the lowest atmospheric temperatures sometimes appear not to absorb water vapour despite considerable supersaturation?
These and related questions were discussed by 38 scientists from 9 nations during an international workshop co-sponsored by SPARC in Karlsruhe, Germany, in June this year. Less than seven years after the
WAVAS report1, SPARC’s “Assessment of Upper Tropospheric and Stratospheric Water Vapour”, there is renewed interest in the question of water vapour measure-ments, in understanding and judging their reliability and in estimating consequences of deviations from our traditional “text-book” understanding of cirrus cloud-driven dehydration processes.
The discovery of pronounced super-saturations with respect to ice in upper tropospheric cloud-free air and inside cirrus clouds calls into question our understand-ing of the physics of ice cloud formation. These findings represent potentially impor-
tant modifications in our characterisation of upper tropospheric and stratospheric water and energy budgets, with implications for cloud formation, fluxes of water and radia-tion, and atmospheric chemistry. At the core of understanding processes in cirrus clouds is the requirement for accurate mea-surements of water vapour and total water concentrations under field and laboratory conditions. Currently applied and newly developed instruments with improved sen-sitivity and time resolution require elabo-rate calibration procedures. However,
1http://www.atmosp.physics.utoronto.ca/SPARC/WAVASFINAL_000206/WWW_wavas/Cover.html
9
53294-1 SPARC.indd 9 12/11/07 10:54:55 AM

)( H2O,
H2O
Tp
pS
satice =
14
13
12
minutes to hourstime
nucleationthreshold
14
13
12
ice
satu
ratio
nra
tio S
ice
0
1
1.6
2.2
14
13
12
altit
ude
(km
)
recent observations of unexpectedly high supersaturations using different kinds of instruments warrant close scrutiny of the various hypotheses put forward as explana-tions by laboratory experimentalists, cloud modellers and ice theoreticians.
The workshop was held in sessions devoted to field observations and instrumental is-sues, laboratory work on single particles and bulk proxies, and microphysical and large-scale modelling.
General
The relative humidity with respect to ice, also called ice saturation ratio S
ice , is defined
as
where pH2O
is the partial pressure of water in the gas phase and p
H2O,sat is the vapour
pressure of ice, which according to the Clausius-Clapeyron equation is a strong function of temperature. Given sufficient time inside an ice cloud we expect that – according to our traditional understanding – the partial water pressure will equilibrate to the vapour pressure through growth/evaporation processes of the ice particles, until S
ice = 1 is reached.
Traditionally one assumes that the time-scale for water uptake by ice particles in supersaturated air is in accordance with molecular diffusion of the water molecules from the gas phase to the ice surface. One further assumes a mass accommodation α of the water molecules on the ice sur-face in the range α ≳ 0.1 (i.e., at least every tenth H
2O molecule hitting the ice surface
adsorbs and is accommodated on the sur-face, while the others are rejected and re-turn to the gas phase).
We know from laboratory studies that, ir-respective of composition, ice nucleates homogeneously in aqueous aerosol par-ticles at S
ice > S
nuc, i.e. ice nucleation above
a critical relative humidity which is well established by laboratory and theoretical work, S
nuc = 1.4...1.8 for T = 240...180 K
(Koop et al., 2000).
According to this general framework, re-cent field and laboratory observations of S
ice can be classified in the three groups
shown in Figure 1:
(a) Sice
≲ Snuc
outside and Sice
1 inside cirrus clouds (the “text book case”, upper grey panel in Figure 1 (the corresponding ice saturation ratios are shown in the lower-most panel),
(b) Sice
> Snuc
without obvious ice forma-tion (centre grey panel in Figure 1),
(c) 1≪ Sice
< Snuc
inside cirrus clouds with-out a clear tendency to equilibration (lower grey panel in Figure 1).
Cases (b) and (c) are in apparent violation of traditional cloud microphysics. Much of the workshop discussion revolved around whether or not measurements were suf-ficiently accurate to actually identify a violation of traditional microphysics in the rapidly changing environment of the upper troposphere, including small-scale temper-ature fluctuations and lofting of air above convective systems.
Field observations and instrumental issues
Relative humidity can be determined either by directly measuring the partial pressure p
H2O, e.g. by Lyman-α or tuneable diode la-
ser absorption spectroscopy (TDL), or by measuring the frost point (i.e. the tempera-ture at which p
H2O,sat(T) = p
H2O) using a frost
point hygrometer. In both cases the ambi-ent temperature needs to be measured, from which p
H2O,sat(T) is derived in order to cal-
culate Sice
. Karen Rosenlof introduced the topic by providing an overview of humidity measurements, from Alan Brewer’s early frost point hygrom-eter measurements in 1943, to the SPARC WAVAS report and modern measurement techniques. Ambient temperature measure-ments on aircraft or balloon sondes have an accuracy of about ± 0.5 K, with main errors resulting from radiation corrections on sondes, and from static pressure correc-tions on aircraft. This results in an uncer-tainty in S
ice of about
± 10 %. Although this uncertainty could explain a fraction of the observed unusual
Sice
data, the larger part must have other reasons.
Cornelius Schiller provided evidence for S
ice > 1.4 inside a cold (180-190 K)
2 km thick cirrus layer at 16-18 km on 19 November 2005 north of Australia, ob-served by the stratospheric research aircraft Geophysica. Martina Krämer provided further evidence for ice supersaturations inside and outside of cirrus from many flights in Arctic, mid-latitude and tropi-cal field campaigns. She estimated that the range of observed S
ice does generally
not exceed the possible range bounded by traditional ice growth theory (Korlev and Mazin, 2003). This result was controver-sially discussed by the participants. She also highlighted ambiguities connected with in-flight cross-calibration of the two Lyman-α instruments on board the Geo-physica – one for gas phase the other one for total water measurements. Care must be taken that calibration efforts do not lead to an additional bias, i.e. an enhancement of the calculated supersaturations. Often, optical instruments such as the FSSP only provide little help to discriminate between clear air and in-cloud situations, because very high cirrus clouds may be very thin so that the counting statistics of optical instru-ments is too low to detect these clouds.
Jessica Smith reported on several cam-paigns from Costa Rica, the Houston ex-periments, and Crystal-Face from Florida.
Figure 1: Ice cloud formation in rising air. The top three panels sketch three scenarios for the formation of ice clouds along an ascending air parcel trajectory; the bottom panel sketches the effect of these scenar-ios on supersaturation. According to conventional understanding, ice particles nucleate (star), grow, and reduce the supersaturation (solid curves). Recent observations suggest suppressed nucleation (short dashed curves) or suppressed growth (long dashed curves) in large parts of the atmosphere. Adapted from Peter et al., (2006).
10
53294-1 SPARC.indd 10 12/11/07 10:54:57 AM

Evidence from in situ observations on board the research aircraft WB-57 of supersatu-rations in clear air and in cirrus from the mid-latitudes to the tropics was provided. There is a potential high bias in S
ice of 5 %
inside clouds.
The picture emerging from the Euro-pean and US observations is that mea-surements at T > 200 K appear to be in general agreement with homogeneous ice nucleation and ready growth of ice par-ticles, leading to the absence of high su-persaturations, and general agreement with the upper panel in Figure 1. Conversely, at T < 200 K very high S
ice occur, reaching
Sice > Snuc
, (compare Figure 2). Wide-spread regions supersaturated with respect to ice (with S
ice = 1.1-1.6) are observed
by MOZAIC, a programme with five A340 passenger aircraft that since 1994 has obtained more than 250,000 hours of Humicap-H Vaisälä data of relative humid-ity. The MOZAIC climatology identifies about 30% of the upper tropospheric air as supersaturated, as was shown by Herman Smit. In contrast, much lower supersatura-tions are found by CARIBIC, also operat-ing from the A340, as reported by Andreas Zahn.
Sean Davis showed that rocket exhaust plumes could constitute an excellent op-portunity for constraining the accuracy of water vapour measurements, given that the unique chemical environment of the plumes and their water content are well known. Liz Moyer asked how measurements of isotopic composition can help to clarify the supersaturation issue. Current instruments can distinguish fresh convective outflow cirrus from in situ formed cirrus. In future, it may be possible to distinguish in situ condensation of ice at equilibrium vapour pressure from ice formed under diffusion-limited non-equilibrium conditions.
Daniel Cziczo started the session on wa-ter/trace gas interactions by focusing on the effect of organic species on atmospheric ice formation. To this end single particle mass spectrometry is an ideal in situ and real time method to qualitatively deter-mine the chemical composition of particu-late matter in the atmosphere. Internally mixed sulphates and organics dominate the free tropospheric aerosol in terms of mass, and they represent the major fraction of all aerosol particles leading to homogeneous ice nucleation under very cold conditions. However, under conditions of moder-ately low temperature and low saturations
(Sice
≳ 1) refractory par-ticles, such as mineral dust, fly ash or metal-lic particles, domi-
nate. In addition, there is also evidence that under homogeneous nucleation conditions ice preferentially nucleates in sulphate-rich particles, while the organic-rich fraction stays preferentially in the interstitial aero-sol (see Figure 3). This behaviour could be caused by changes in the relationship between solute mass fraction and water activity of the supercooled liquid phase, by modifications of the accommodation coefficient α for water molecules, or by a combination thereof (Kärcher and Koop, 2005). In turn, the changes could be due to organic films, but this would have to lead to a reduction in α as low as 5 × 10⁻⁵ to 8 × 10⁻³ (depending on cooling rate) in order to explain the observed high RH in the up-per troposphere, and the presence of just a few uncoated particles would negate this effect.
David Fahey and Christiane Voigt direct-ed the discussion on observations of HNO
3
on ice and its potential implications for humidity equilibration in cirrus clouds and contrails. Figure 4 by Gao et al., (2006) shows one of those measurements which were most discussed during the workshop, but which was also met with concern over data accuracy. A contrail self-sampling experiment, using data from a contrail formed and sampled by the NASA WB-57F high-altitude aircraft, showed an average S
ice ≈ 1.31 at temperatures of 195–200 K
within the contrail. This is 31% higher
Figure 2: Frequency of occurrence of ice saturation ratios, observed inside and outside of Arctic, mid-latitude and tropical cirrus. The data set represents about 13 h of airborne in-situ observations inside and 16 h outside of cirrus (data are sorted in 1K temperature bins; black line: homogeneous freezing threshold, blue line: water saturation line). Adapted from Krämer et al., (2008).
Cirrus Clouds Organic FragmentsInterstitial (unfrozen)
Frac
tion
of d
etec
tor s
igna
l
Fraction of particles nucleating ice
0.25
0.20
0.15
0.10
0.05
0.000.001 0.01 0.1 1
Figure 3: Average fraction of the aerosol mass spectrometer sig-nal attributed to organic fragments as a function of the fraction of the background aerosol that was nucleating ice (observed during CRYSTAL-FACE with ice crystal densities from 0.001 to 300 cm-3). Ice nucleation happens preferentially in particles with little or no organic content. Only when almost all pre-existing particles were nucleating ice was also the organic fraction activated, as shown by the blue hori-zontal line. Adapted from Cziczo et al., (2004).
11
53294-1 SPARC.indd 11 12/11/07 10:54:58 AM

12
S
ice
1.8
1.6
1.4
1.2
1.0
Contrail producing legIn contrailContrail S average = 1.31ice
1.0 1.5 2.0 2.5 3.0NO (ppbv)
than expected over pure hexagonal ice, while the combined uncertainty of the measurements is only ± 11 %. One ex-planation is that HNO
3 adsorbed as nitric
acid trihydrate (NAT) on the ice surface might block growth sites and enhance the equilibrium S
ice in the low-tempera-
ture contrail, as described by Gao et al., (2004). This could result in a lower mass accommodation, i.e. a kinetic effect. While HNO
3 in contrails has also been found in
the ice phase of thick anvil cirrus and in subvisible cirrus, e.g. during the European SCOUT-O3 campaign, the blocking by NAT so far is just a hypothesis that will require laboratory testing of ice growth in the presence of HNO
3 under a range
of microphysically relevant atmospheric conditions of temperature and humidity.
These field data triggered a scientific debate about whether it was at all possible that such high supersaturations in ice clouds could persist. Tom Peter noted that “persistence” should mean that the supersaturation was maintained significantly longer than would be the case by uptake via diffusion of H
2O
molecules through the gas phase, and their subsequent mass accommodation with α ≳ 0.1. Conversely, brief excursions to very high S
ice are not necessarily an in-
dication for unusual physics. This was illustrated by Klaus Gierens with the ex-ample of the wake of aircraft wings, where S
ice ≈ 10 can be reached leading to aerody-
namic contrail formation.
The following discussion ranged from the assertion that the observations were se-verely affected by a measurement offset, to the opposing statement by one laboratory scientist that high supersaturations must occur below 200 K based on experimental
evidence, and that the field observations were wrong if they did not show pro-nounced supersaturations.
Recent intense laboratory calibrations of the Lyman-α hygrometer flown on board the WB-57 were detailed by Jes-sica Smith. Multiple calibration stan-dards, tied to independent physical properties of water vapour, provide the means to minimise systematic errors in
the calibration system, suggesting an accu-racy of 5 % and a precision of better than ± 0.2 ppmv. In particular, the calibration work resulted in no evidence of an offset in flight.
Holger Vömel showed balloon-borne ob-servations of S
ice ≫ 1 in cirrus layers that
were 1 to 5 km thick, just below the tropi-cal tropopause over Biak in Indonesia. These measurements are corroborated by very similar observations from FLASH-B, a balloon-borne Ly-α hygrometer, reveal-ing high supersaturations in 2 km thick cirrus layers below the tropical tropopause in West Africa, as presented by Vladimir Yushkov.
In addition, Holger Vömel reported on attempts to address the issue of disagree-ments between various in situ instruments measuring H
2O in this altitude region.
Figure 5 shows measurements from a bal-loon launch at Midland, Texas, which was coordinated with water vapour measure-ments on board NASA’s WB-57 high-alti-tude research aircraft (Vömel et al., 2007). In this comparison, the WB-57 spiralled between 12 km and 18 km during the bal-loon ascent and descent, with the Harvard Lyman-α hygrometer and a NOAA/CSD aircraft frost point hygrometer on board. The figure shows all descent and ascent profiles of the WB-57 instruments and the descent profile of the balloon instru-ment (there was severe contamination on ascent). Throughout the entire altitude region, the Harvard Lyman-α hygrometer shows values more than 50 % above those measured by the balloon instrument. This large discrepancy cannot be explained in terms of the known instrumental uncertain-ties. While there was no progress during
the workshop concerning the source of this difference, “the closer agreement of the two frost point instruments may indicate that the difference is not related to the mea-surement platform, but rather to the tech-niques or instrumental implementations of the technique” (Vömel et al., 2007).
Also, at the end of the workshop, debate remained about these discrepancies. While all instruments clearly indicate substantial supersaturation within cirrus clouds, which is presently unexplained, there are signifi-cant differences between the various in-struments, with the aircraft measurements being generally higher than the balloon instruments in direct comparisons. And while the frost point hygrometer could be regarded as the canonical instrument, the sophisticated calibration work done by the Harvard group on their Lyman-α does not allow for any conclusion on the source of the error, but calls for similar cali-bration efforts for all instruments.
Less controversial was the last part of this session introducing new developments. Ulrich Bundke reported on new fast frost-point measurements for use in nucleation chambers or airborne applications, and Frank Wienhold on a novel radio-sonde payload to study UTLS aerosols and clouds. The latter reported on the new development of a lightweight aerosol backscatter sonde, which may eventually have similar char-acteristics as the Rosen and Kjome (1991) sonde, but be light enough to fly on regular radio-sondes. Volker Ebert reported on the new development of an absolute hu-midity sensor without gas sampling based on tunable diode laser (TDL) absorption spectroscopy and its application to in-cloud supersaturation measurements in the AIDA cloud chamber. Finally, Marc Zondlo showed calibrations and first test flights of the HIAPER vertical cavity surface emit-ting laser (VCSEL) near 1854 nm.
Laboratory studies of ice nucleation and growth
Thomas Leisner, host of the meeting, opened the session by talking about funda-mentals of ice nucleation as derived from
Figure 4: Derived Sice
as function of nitrogen monoxide (NO) on contrail-producing (CP, black diamonds) and contrail-sampling (CS, blue circles) legs measured onboard the WB-57 during a contrail self-sampling flight. The background NO values are nearly constant at 0.7 ppbv. NO values found above this value on the CS leg indicate contrail air affected by the CP leg. The black horizontal line represents the average S
ice ≈ 1.3 found on the CS leg. Adapted from Gao
et al., (2006).
53294-1 SPARC.indd 12 12/11/07 10:54:59 AM

13
Altitu
de
(km
)
Mixing ratio (ppmv)
Midland, TX18 November 2004
20
18
16
14
12
100 10 20 4030 50
CFHNOAA/AL FPHarvard Ly-α
Figure 5. Comparison between the balloon-borne frost point hygrometer (black dots) and the WB-57F instruments Harvard Lyman-α (blue dots) and NOAA/CSD frost point hygrometer (grey crosses). Adapted from Vömel et al., (2007).
electrodynamic levitator techniques ap-plied to single aerosol particles. By means of levitation experiments with supercooled water microdroplets he showed that ice nucleation is a process that is volume-dominated, at least as long as the droplets are larger than 4 μm in radius. Only for smaller droplets might surface nucleation become important and possibly dominant. Indirectly, this finding on pure water drop-lets makes it less likely that the formation of an ice nucleus could be hampered by surface contamination and that impurities in the surface region of water droplets (e.g. surfactants) could actually be responsible for the observed suppressed nucleation ten-dencies.
Dennis Lamb presented laboratory work using an electrodynamic particle trap to measure cycles of growth and partial evap-oration of an ice particle under conditions of periodically varying super- and subsatu-ration (from S
ice < 1 to about 1.2). These
experiments led to the perplexing result that the mass accommodation coefficient of the water molecules on the ice surface could be as low as α ≲ 0.006, i.e. only 6 out of every 1000 molecules are involved in vapour de-position to the small ice particles (Magee et al., 2006). This result has important impli-cations for cirrus clouds and for maintain-ing high supersaturations in the UT. The physics behind these extremely small mass accommodation coefficients needs to be studied much further.
The crystallisation of aqueous droplets at extreme tropopause temperatures was also studied using droplets suspended in emul-sions. Ben Murray showed that cubic
ice is the dominant product when solution droplets freeze below ~190 K, so that at least a part of the high S
ice below 200 K
could be accounted for by cubic ice. The crystallisation of solution droplets is a complex process (see Figure 6), and the cubic-to-hexagonal phase transformation can be solvent mediated. This transfor-mation may be blocked when the solu-tion becomes very viscous. At the lowest temperatures the presence of organics may further enhance the viscosity of the solu-tion within droplets, leading to the forma-tion of a glass, which in turn may suppress ice nucleation altogether, as was suggested by Claudia Marcolli and Thomas Koop based on emulsion experiments using dif-ferential scanning calorimetry.
Cirrus simulation studies in the aerosol and cloud chamber AIDA (Aerosol Interactions and Dynamics in the Atmosphere) revealed that organic coatings on solid particles may suppress their activity as heterogeneous ice nuclei. By means of cirrus formation experiments Ottmar Möhler showed that ice nuclei, such as mineral dust and soot, may partly or even completely lose their ice nucleation activity when they are covered by organic coatings. Interestingly, switch-ing from the deposition mode (with direct ice nucleation on the solid dust or soot particles) to the immersion mode (with ice formation on a solid nucleus surrounded by an aqueous liquid), may reduce their activ-ity, a process that is not easily understood in microphysical terms. Subsequently Harald Saathoff reported on the general possibility of a systematic intercomparison and systematic testing of humidity and wa-ter vapour instrumentation within AIDA.
This discussion was resumed again in the last part of the workshop, prepar-ing the Aqua Valida-tion and Instrument Tests Intercom-parison Campaign of Water Vapour Measurement Tech-niques (AquaVIT), which took place 8-26 October 2007 at the AIDA facility
Karlsruhe (see below).
Modelling of ice processes and their impact on global humidity
What happens on the molecular scale when ice nucleates in a solution droplet and what happens with the solute during the subse-quent crystallisation process? How does this affect cloud formation all the way to the global scale (Figure 7)?
Lubos Vrbka showed molecular dynam-ics simulations of water freezing suggest-ing that the initial event of homogeneous nucleation is preferentially in the subsur-face region stimulated by salt concentra-tion fluctuations. This finding relates to the experimental work by Leisner mentioned above, by emphasising the necessity for experimental work on submicron droplet freezing.
Also, the growth process of ice crystals at extremely low temperatures is presently not well understood. One way to model the ice surface and the mass accommodation of the water molecules approaching the surface is to assume that whenever a crystal plane has
Figure 6. X-ray intensity peak ratio of the intensities of the exclusive hexagonal peaks and the peak intensity common to cubic and hexago-nal ice. The data are grouped into three size bins, 2–5 μm (Δ), 5–10 μm (•) and 10–20 μm (□) Adapted from Murray and Bertram (2007).
53294-1 SPARC.indd 13 12/11/07 10:55:19 AM

14
Figure 8. Stream of arguments applied during the workshop.
been completed during a growth phase, the start of a new plane requires overcoming an energy barrier. In this model, growth occurs via repeated nucleation events, and the H
2O mass accommodation coefficient
becomes a function of relative humidity, α = α(S
ice), see Wood et al., (2001). Two
groups (Thierry Corti and Beiping Luo; Marcia Baker, Jon Nelson and Jenni-fer Kay) took this approach. Parameters of the lattice plane nucleation are adapted from laboratory experiments (e.g. Magee et al., 2006). A first result from this mod-elling work is that simulations with con-stant α yield either excessively high ice particle number densities if α ≪ 1, while α ≳ 0.1 cannot explain the observed high S
ice. Future work will show whether
α = α(Sice
) can overcome this dilemma.
The workshop also prompted a new debate about how and to what degree coatings by foreign molecules on ice surfaces may change the ice vapour pressure. Of course, foreign molecules on ice surfaces may change the kinetics of the ice growth and evaporation, but can they also change the vapour pressure, i.e. thermodynamic state? One focus of this discussion, led by Dan Murphy, was the so-called Δ-ice, which had been put forth by Gao et al., (2004) as a concept for ice with HNO
3 surface impuri-
ties, leading to nitric acid trihydrate (NAT) clusters. This, in turn, may lead to “step-pinning”, i.e. the growth of the nucleated steps is hindered by the foreign molecules, in the present case by the NAT-clusters. Dan Murphy discussed possible interpreta-tions of ◻-ice: the HNO
3 could lead to a
previously un-known phase of ice (neither hex-agonal nor cu-bic), but this in not very likely; the HNO
3 could
change the kinet-ics of growth of hexagonal ice, but this would maintain S
ice > 1
only in the case of continuous cooling; ◻-ice could also sim-ply be cubic ice, but this would explain at most ~ 11 % of the ob-served supersatu-
ration. Finally, he stressed that HNO3 can
not change the relative rates of evaporation and condensation of ice, as this would vio-late the second law of thermodynamics.
Alexei Korolev concurred with the assess-ment of how our lack of understanding of ice nucleation and growth rates represents a main obstacle in our understanding of high S
ice in ice clouds. However, based on
present theoretical understanding he also concluded that the relative humidity in ice clouds must be expected to increase with decreasing temperatures, and that there was no need for new microphysical mecha-nisms to explain high S
ice, a conclusion that
was vigorously debated.
Eric Jensen analysed CRAVE water va-pour and subvisible cirrus observations, re-vealing the existence of hexagonal particles as large as 100 μm in diameter a few hun-dred metres below the tropical tropopause. Model calculations suggest that in order to grow such large ice particles extreme super-saturations around S
ice ≈ 2 were required.
This latter conclusion would speak for a clear need for new microphysical mecha-nisms to explain the observed high S
ice in
cold tropical cirrus clouds. On another day of the CRAVE campaign more convention-al ice particles were found and modelled by Iulia Gensch using a detailed microphysi-cal box-model forced along backward tra-jectories. She found best agreement when assuming heterogeneous ice nucleation, relatively little water, and rapid accommo-dation of water on ice (α ≈ 1).
Figure 7. Various cloud scales addressed during the workshop.
Mesoscale models may bridge the gap between global models and backward tra-jectory analyses. Federico Fierli showed that such models with horizontal resolu-tions in the range of 10-20 km are able to reproduce supersaturation in the recent outflow; however that S
ice may be severely
underestimated in aged outflow. This may be related to insufficient resolution which does not allow including appropriate physi-cal and small-scale dynamical processes responsible for the maintenance of high S
ice. To this end, cloud-resolving models
with horizontal resolutions ~ 100 m have an advantage, as was illustrated by Peter Spichtinger. High patchiness in cirrus clouds – unresolved by aircraft-borne mea-surements – could be induced by internal dynamics of cirrus clouds, which may dominate the properties of cirrus clouds (ice number and mass concentrations) including the maintenance of high relative humidities (S
ice up to 1.6) inside cirrus clouds.
Finally, Ulrike Lohmann widened the per-spective by asking to what degree low mass accommodation coefficients (α) would in-fluence cirrus cloudiness in a global circu-lation model. Preliminary calculations sug-gest that a low accommodation coefficient (α = 0.005) for H
2O on ice may increase
Sice
under clear-sky conditions and reduce the overall cirrus cloudiness. Once cirrus clouds form, their crystal number density and mass is increased, thus lowering S
ice
inside cirrus.
Final discussion and outlook
The rapporteurs, to whom we are most grateful, were Thierry Corti, Thomas Koop, Claudia Marcolli, Liz Moyer, Karen Rosenlof, Cornelius Schiller and Peter Spichtinger. Figure 8 summarises some aspects of the final discussion. Per-sistent S
ice > 1.2 inside and S
ice > S
nuc (with
Snuc
≈ 1.6 at 200 K) outside clouds were conditions regarded as calling for special attention. However, even after three days of intense discussion there was no general agreement amongst the workshop par-ticipants whether or not the measured data were sufficiently good to warrant a call for “unconventional” microphysics. The point that high supersaturations must occur be-low 200 K based on laboratory evidence was also reiterated, and that therefore there could be little doubt that pronounced up-per tropospheric supersaturations must be expected.
53294-1 SPARC.indd 14 12/12/07 10:46:38 AM

ice ice
ice
Persistent S > 1.2 inside and S > 1.6outside clouds
Data sufficiently good?
Yes
Persistent S violates conventionalmicrophysics with homogeneousnucleation of ice lh and α <</ 1
No
Hypothesis 1: glassy stateHypothesis 2: subresolution patchyness
Hypothesis 3: pinning by NATEtc. etc.
Yes
No
Figure 8. Stream of arguments applied during the workshop.
Mesoscale models may bridge the gap between global models and backward tra-jectory analyses. Federico Fierli showed that such models with horizontal resolu-tions in the range of 10-20 km are able to reproduce supersaturation in the recent outflow; however that S
ice may be severely
underestimated in aged outflow. This may be related to insufficient resolution which does not allow including appropriate physi-cal and small-scale dynamical processes responsible for the maintenance of high S
ice. To this end, cloud-resolving models
with horizontal resolutions ~ 100 m have an advantage, as was illustrated by Peter Spichtinger. High patchiness in cirrus clouds – unresolved by aircraft-borne mea-surements – could be induced by internal dynamics of cirrus clouds, which may dominate the properties of cirrus clouds (ice number and mass concentrations) including the maintenance of high relative humidities (S
ice up to 1.6) inside cirrus clouds.
Finally, Ulrike Lohmann widened the per-spective by asking to what degree low mass accommodation coefficients (α) would in-fluence cirrus cloudiness in a global circu-lation model. Preliminary calculations sug-gest that a low accommodation coefficient (α = 0.005) for H
2O on ice may increase
Sice
under clear-sky conditions and reduce the overall cirrus cloudiness. Once cirrus clouds form, their crystal number density and mass is increased, thus lowering S
ice
inside cirrus.
Final discussion and outlook
The rapporteurs, to whom we are most grateful, were Thierry Corti, Thomas Koop, Claudia Marcolli, Liz Moyer, Karen Rosenlof, Cornelius Schiller and Peter Spichtinger. Figure 8 summarises some aspects of the final discussion. Per-sistent S
ice > 1.2 inside and S
ice > S
nuc (with
Snuc
≈ 1.6 at 200 K) outside clouds were conditions regarded as calling for special attention. However, even after three days of intense discussion there was no general agreement amongst the workshop par-ticipants whether or not the measured data were sufficiently good to warrant a call for “unconventional” microphysics. The point that high supersaturations must occur be-low 200 K based on laboratory evidence was also reiterated, and that therefore there could be little doubt that pronounced up-per tropospheric supersaturations must be expected.
Amongst the many possible explanations for the observed high supersaturations dis-cussed during the workshop, formation of a glassy state of the preexisting aerosol or formation of viscous hexagonal/cubic mix-tures were emphasised again to explain the lack of nucleation outside of clouds. Mesoscale subresolution patchiness, step pinning by HNO
3 deposition on ice form-
ing NAT, low mass accommodation of H2O
on ice, and cubic ice were seen as most promising hypotheses to explain the lack of H
2O uptake inside of cirrus clouds.
The workshop was closed by an open plan-ning meeting led by Harald Saathoff, Cornelius Schiller and Volker Ebert, for an AIDA water vapour intercomparison campaign. There was broad agreement that such an instrument intercomparison could bring us a good step forward, even if the intercomparison conditions are different from those onboard an aircraft or a balloon. Aims are to determine the instrument per-formances for static conditions (constant p, T, H
2O), dynamic conditions (changing
parameters), with and without clouds. In the meantime the SPARC-cosponsored AquaVIT campaign (Aqua Validation and Instrument Tests) took place, 8-26 Octo-ber 2007, Karlsuhe, Germany. Amongst the participating instruments were all the WB-57, Geophysica and balloon instru-ments mentioned above plus several others. The experiments were coordinated
by Harald Saathoff, Cornelius Schiller and Volker Ebert and run as blind tests, supervised by David Fahey and Ru-Shan Gao from NOAA, Boulder, and by Ottmar Möhler from Forschungszentrum Karl-sruhe who acted as referees. First inter-comparison results are expected to become available in spring 2008.
Acknowledgments:
The international workshop on “Upper Tropospheric Humidity”, 12-15 June 2007, Karlsruhe, Germany, has been sponsored and financially supported by:– WCRP: The Word Climate Research
Program;– SPARC: Stratospheric Processes and their
Role in Climate (a WCRP core project);– EUROCHAMP: A European Union FP6
project;– SCOUT-O3: A European Union FP6
project;– ETH Zurich: Institute for Atmospheric
and Climate Science;– FJ: Forschungszentrum Jülich, Institute
of Chemistry and Dynamics of the Geo-sphere;
– FZK: Forschungszentrum Karlsruhe, Institute of Meteorology and Climate Re-search.
We are grateful for their support.
Acronyms:
AIDA: Aerosol Interaction and Dynamics in the AtmophereAquaVIT: Aqua Validation and Instrument Tests Intercomparison Campaign of Water Vapour Measurement TechniquesCARIBIC: Civil Aircraft for the Regular Investigation of the Atmosphere Based on an Instrument containerCRAVE: Costa Rica. Aura Validation ExperimentFSSP: Forward Scattering Spectrometer ProbeFLASH-B: Fluorescent Advanced Strato-spheric Hygrometer (Balloon version)HIAPER: High-performance Instrument-ed Airborne Platform for Environmental ResearchMOZAIC: Measurement of Ozone, Water Vapour, Carbon Monoxide and Nitrogen Oxides aboard Airbus in-service aircraftNAT: Nitric Acid TrihydrateTDL: Tuneable Diode Laser Absorption Spectroscopy VCSEL: Vertical-Cavity Surface-Emitting Laser
WAVAS: SPARC Assessment of Upper Tropospheric and Stratospheric Water Va-pour
References
Cziczo, D. J. et al., Observations of organic species and atmospheric ice formation, Geo-phys. Res. Lett., 31, L12116, doi:10.1029/2004GL019822, 2004.
Gao, R.S. et al., Evidence that nitric acid in-creases relative humidity in low-temperature cirrus clouds, Science, 303 (5657), 516-520, 2004.
Gao, R.S. et al., Measurements of relative hu-midity in a persistent contrail, Atmos. Environ., 40 (9), 1590-1600, 2006.
Karcher B. and T. Koop, The role of organic aerosols in homogeneous ice formation, Atmos. Chem. Phys., 5, 703-714, 2005.
Koop, T. et al., Water activity as the determinant for homogeneous ice nucleation in aqueous so-lutions, Nature, 406, 611– 614, 2000.
Korolev, A.V. and I.P. Mazin, Supersaturation of water vapor in clouds, J. Atmos. Sci., 60, 2957-2974, 2004.
Krämer, M. et al., Supersaturations in Arctic, Mid-latitude, Tropical and Artificial Cirrus. To be submitted to ACP, 2008.
Magee, N. et al., Experimental determination of the deposition coefficient of small cirrus-like ice crystals near -50°C, Geophys. Res. Lett., 33, L17813, doi:10.1029/2006GL026665, 2006.
Murray, B.J. and A.K. Bertram, Strong depen-dence of cubic ice formation on droplet am-monium to sulfate ratio, Geophys. Res. Lett, 34 (16): Art. No. L16810, 2007.
Peter, T. et al., When dry air is too humid, Sci-ence, 314 (5804): 1399-1400, 2006.
Rosen, J.M. and N.T. Kjome, Backscattersonde – a new instrument for atmospheric aerosol re-search, Appl. Opt., 30 (12): 1552-1561, 1991.
Vömel, H. et al., Accuracy of tropospheric and stratospheric water vapour measurements by the cryogenic frost point hygrometer: Instrumental details and observations, J. Geophys. Res., 112, D08305, doi:10.1029/2006JD007224, 2007.
Wood, S.E. et al., New model for the vapor growth of hexagonal ice crystals in the atmo-sphere, J. Geophys. Res., 106, 4845–4870, 2001.
15
53294-1 SPARC.indd 15 12/11/07 10:55:21 AM

16
SPARC Water Vapour Initiative
C. Schiller, Forschungszentrum Jülich, Germany ([email protected])T. Peter, ETH Zürich, Switzerland ([email protected])K. Rosenlof, NOAA, USA ([email protected])
In the year 2000, SPARC published its Assessment of Upper Tropospheric and Stratospheric (UTS) Water Vapour (SPARC Report No. 2, WCRP-113, WMO/TD No. 1043), which was coordinated and edited by Dieter Kley, Jim M. Russell III and Celine Phillips. The key topic addressed in this report was the analysis and the assessment of the long-term changes of UTS water vapour, with an emphasis on the observed increase of water in the stratosphere. The report had a strong focus describing and comparing relevant data sets using in situ hygrometers and remote sensing instruments from laboratories all over the world in order to create a suit-able data set, including historical data back to the 1940s. Data presented is the report are available at the SPARC data centre at http://www.sparc.sunysb.edu/. The dis-tribution and variability of UTS water va-pour, the relevant processes, and the impact of the increased water vapour on radiation, dynamics and chemistry were discussed. However, a quantitative explanation of the analysed changes was not possible in 2000.
Following the recommendations of this report, climatological measurement pro-grammes have continued, new campaigns to investigate UTS water vapour have been carried out, new satellite observation pro-grammes have been launched, and many model and laboratory studies have been made since 2000 to explain the observa-tions and to identify previously unknown processes. Emerging from the new obser-vations, an additional “puzzling” question became apparent in that unexpected high
relative humidities were observed, largely in the cold tropopause region both inside and outside of clouds (see contribution by Peter, Krämer and Möhler, this issue). Data quality, in particular knowing the absolute accuracy and not simply the rela-tive discrepancies between different sen-sors, has become a crucial issue if we are to assess these questions. These accuracy issues have lead to the need of cross valida-tion of established and recently developed hygrometers, both in the field and in the laboratory.
In light of these developments, it seems timely to update the SPARC water vapour assessment of 2000. In particular, there is a need to summarise the relevant results over the past decade from various field experi-ments, laboratories and models in a com-prehensive report or review publication. The major goal of such an exercise is to assess the value and the accuracy of recent measurements and to give new recommen-dations and guidelines for future research on UTS water vapour. The major topics to be addressed are:
1. Data quality: How reliable are in situ and remote sensing field data in terms of accuracy and precision?
2. Clear air and in-cloud supersaturation: Can the observations be explained within the framework of our current knowledge or do we need new theoretical concepts and new laboratory investigations, e.g. of ice growth at extreme temperatures?
3. Recent observations of UTS water va-pour changes: Are these observations mutually consistent, do we understand
them, and what are our abilities for future predictions?
4.Impact on atmospheric chemistry and climate: What are the implications of changing UTS water vapour for radiation, dynamics, chemistry, clouds and climate?
Therefore, the SPARC Scientific Steering Group proposed during its annual meeting in September 2007 to initiate a new water vapour initiative, which will be coordinat-ed by Cornelius Schiller, Thomas Peter and Karen Rosenlof. A kick-off workshop for the community will be organised in 2008, preferably connected to the SPARC Gener-al Assembly in Bologna (August 31 – Sep-tember 5, 2008). More detailed information will be provided soon to the community concerned with water vapour issues.
53294-1 SPARC.indd 16 12/11/07 10:55:21 AM

Report on the 3rd SPARC CCMVal Workshop
26-28 June 2007, University of Leeds, United Kingdom
V. Eyring, DLR, Germany ([email protected])A. Gettelman, NCAR, USA ([email protected])N.R.P. Harris, University of Cambridge, UK ([email protected])S. Pawson, NASA Goddard, USA ([email protected])T.G. Shepherd, University of Toronto, Canada ([email protected])D.W. Waugh, John Hopkins University, USA ([email protected])H. Akiyoshi, NIES, Japan ([email protected])N. Butchart, Met Office, UK ([email protected])M.P. Chipperfield, University of Leeds, UK ([email protected])M. Dameris, DLR, Germany ([email protected])D.W. Fahey, NOAA-ESRL, USA ([email protected])P.M.F. Forster, University of Leeds, UK ([email protected])P.A. Newman, NASA Goddard, USA ([email protected]) M. Rex, AWI-Potsdam, Germany ([email protected])R.J. Salawitch, NASA JPL, USA ([email protected]) B.D. Santer, LLNL, USA ([email protected])
Introduction and Rationale
The coupling of stratospheric chemi-cal models with climate models has led to a new generation of models far more complex than those available when the Montreal Protocol was signed twenty years ago. This increased complexity al-lows questions about future stratospheric ozone and UV radiation levels to be stud-ied in much more detail than could be done at that time. However, the workings of these chemistry-climate models (CCMs) themselves are also more difficult to fully understand. Periodic assessments of the family of stratospheric CCMs and their general circulation models (GCMs) have been organised under the auspices of the SPARC GRIPS and CCMVal activities (Pawson et al., 2000; Eyring et al., 2005) and have contributed directly to the evalu-ation of CCMs during the preparation of the UNEP/WMO Scientific Assessments of Ozone Depletion (Eyring et al., 2006, 2007). However, there is insufficient time to evaluate CCM performance thoroughly while preparing the Ozone Assessments. For this reason SPARC CCMVal is under-taking to prepare a Report on the Evalu-ation of Chemistry Climate Models by 2009 in time for consideration in the an-ticipated UNEP/WMO Ozone Assessment in 2010. The SPARC CCMVal report it-self has two major aims: 1) provide valu-
able base material for that Assessment, and 2) improve the understanding of the strengths and weaknesses of CCMs and thus increase their integrity and credibility.
The 3rd CCMVal workshop was held at the University of Leeds in June 2007, follow-ing on from earlier workshops in Grainau, Germany in 2003 and Boulder, USA in 2005. The aims of the workshop were: (a) to discuss recent advances in model devel-opment and the means to diagnose them; and (b) to prepare for the SPARC Report on the Evaluation of Chemistry Climate Models. Approximately 80 members of the atmospheric and climate communities from Europe, North America, Japan and New Zealand attended the workshop. The attendees included representatives from nearly all the major stratospheric CCM groups in the world. The agenda, abstracts and a list of participants can be found at the workshop’s website (http://www.see.leeds.ac.uk/ccmval2007).
Science sessions
A total of 25 oral and 41 poster presenta-tions were given which focussed on re-search related to CCMVal activities. The presentations included studies using ex-isting diagnostics for assessing particular processes in CCMs and proposals for new diagnostics. Many were based on the data
that is already present in the CCMVal data archive at the British Atmospheric Data Centre (BADC). Presentations focused on four main areas:
• Transport and upper troposphere/lower stratosphere
• Stratospheric chemistry and radiation• Dynamics and natural variability• Long term changes in the stratosphere
and the effect on the troposphere
In addition to presentations on model analysis and validation, results of recent CCM simulations were presented and new applications of CCMs were discussed. Programmatic presentations on other international programmes, such as SPARC DynVar (see SPARC Newsletter No. 29) and SOLARIS, were given to clarify their relation to CCMVal.
SPARC CCMVal report on the Evaluation of
Chemistry Climate Models
Much of the meeting was devoted to plan-ning the SPARC Report on the Evaluation of Chemistry Climate Models. The aim of this SPARC report is to provide a compre-hensive, up-to-date evaluation of the abil-ity of CCMs to represent the stratospheric ozone layer, stratospheric climate and climate variability, and the coupled ozone-
17
SPARC Water Vapour Initiative
C. Schiller, Forschungszentrum Jülich, Germany ([email protected])T. Peter, ETH Zürich, Switzerland ([email protected])K. Rosenlof, NOAA, USA ([email protected])
them, and what are our abilities for future predictions?
4.Impact on atmospheric chemistry and climate: What are the implications of changing UTS water vapour for radiation, dynamics, chemistry, clouds and climate?
Therefore, the SPARC Scientific Steering Group proposed during its annual meeting in September 2007 to initiate a new water vapour initiative, which will be coordinat-ed by Cornelius Schiller, Thomas Peter and Karen Rosenlof. A kick-off workshop for the community will be organised in 2008, preferably connected to the SPARC Gener-al Assembly in Bologna (August 31 – Sep-tember 5, 2008). More detailed information will be provided soon to the community concerned with water vapour issues.
53294-1 SPARC.indd 17 12/11/07 10:55:22 AM

climate response to natural and anthropo-genic forcings. The report will be based on the diagnostic metrics developed within SPARC CCMVal and will be completed in time to provide useful and timely informa-tion for the expected WMO/UNEP Scien-tific Assessment of Ozone Depletion: 2010, as well as for the expected IPCC 5th Assess-ment Report.
The SPARC CCMVal report will consist of two major parts. Part A will evaluate how well the CCMs perform according to the CCMVal diagnostics tables under pres-ent-day conditions in five major areas (ra-diation, dynamics, transport, stratospheric chemistry and microphysics, and upper troposphere/lower troposphere). Each pro-cess is associated with one or more model diagnostics and with relevant data sets that can be used for model evaluation. Due to a lack of appropriate measurements, the evaluation of the radiation descriptions will be largely based on detailed comparisons of the radiation codes from the participating models. The chapters in Part A will also include long-term changes of the key pro-cesses in the past and future (e.g. changes in the Brewer-Dobson circulation, PSC fre-quency, sudden warmings). This approach provides a coherent framework for the evaluation of CCMs and will be used as a basis for the assessment in Part B.
Part B will examine the coupled ozone-cli-mate response to natural and anthropogenic forcing. The chapter on natural variability will evaluate how well CCMs represent the effects of various sources of coherent forced and unforced natural variability (QBO, volcanic, solar, ENSO) on strato-spheric dynamics, radiation, chemistry and transport. The chapter on long-term pro-jections of stratospheric ozone will focus on simulated long-term changes in ozone and the causes of these changes (i.e. relate to changes in chemistry, dynamics, radia-tion, transport and UTLS discussed in Part A). The chapter on the effect of the strato-sphere on the troposphere will include the radiative forcing from ozone changes, tro-pospheric effects of polar ozone depletion, and changes in the flux of ozone to the tro-posphere over long timescales.
New CCMVal reference scenarios
On the first day of the workshop, a break-out group met to discuss new model simu-lations that would be tailored to the SPARC
Report on Evaluation of Chemistry Cli-mate Models. The group recommended three different reference simulations that could be run by the various modelling groups. The first simulation (REF0) is de-fined as a time-slice experiment with spe-cies levels characteristic for the year 2000. This run will provide a basic assessment of chemical and dynamical conditions in the models during a period of peak ozone loss. It should be possible to start the analysis of runs based on REF0 much earlier than the other scenarios, which will be useful for developing the diagnostics as well as providing a preliminary evaluation of the models. The second simulation (REF1) is defined as a transient run from 1960 to the present. This scenario is meant to simulate the past climate and would be evaluated by comparing to observations. REF1 includes observed sea surface temperatures, volcanic aerosols, and solar forcings. The third sim-ulation (REF2) is a transient run from 1960 to 2100. This scenario will simulate both the past and future in a consistent manner, but with a primary focus on ozone deplet-ing substances (ODSs) and greenhouse gas (GHG) forcing. REF2 will include fixed background aerosol conditions that exclude volcanic forcings, and sea surface tempera-tures from a coupled atmosphere-ocean model simulation or from the CCM itself if coupled to an ocean model. In addition, several sensitivity experiments have been proposed. An overview of the proposed CCMVal reference and sensitivity simula-tions is given in Eyring et al., (2008). The specified forcings for the new reference simulations and a detailed description will be made available for download on the CCMVal website.
Data and tools
A working group on data and tools dis-cussed several issues regarding using model output, future model output, diag-nostics and observations. All agreed that the CCMVal archive at BADC is working well for CCMVal modellers and collabo-rators. There are other options to explore improved (e.g. web based) interfaces to the data and improved data transfer (such as sub-setting). It was agreed to move to-wards a Climate and Forecast (CF) standard compliant NetCDF format for future data requests. The group discussed output for future diagnostics and agreed that the base output for core diagnostics should be three-dimensional (latitude, longitude, pressure)
monthly mean fields. The vertical coor-dinate should be pressure based, but there was no consensus whether the pressure levels should be standard for all models or model specific. Several derived fields are desirable, e.g. Eliassen-Palm (EP) fluxes, potential vorticity (PV) and tropopause characteristics. Some high frequency diag-nostics (such as instantaneous snapshots of chemical fields) will probably be requested by some chapters. Details on which fields at what frequency will be needed, are like-ly to be determined by the requirements of the SPARC CCMVal report and will be finalised in 2007.
The diagnostic tools and observations used for model evaluation were discussed. It was agreed that a common diagnostic tool for evaluating climatological fields (such as those appearing in Eyring et al., 2006, 2007) would be valuable for quick assess-ment and comparison of basic model per-formance prior to more detailed analysis. Such a tool should be based on open source formats and might be designed to run on a server linked to the CCMVal archive. Additional resources would be required to build such a tool and are requested in some proposals currently pending in the USA and Europe. There was general agreement to prepare observational data sets in the same format as the model output and to add these to the model output archive. These would include individual instruments as well as composite data sets.
Evaluation
CCMVal was formulated to evaluate the skill of CCMs being used for projections of stratospheric ozone. A comprehensive list of diagnostics of model performance has been developed previously for radiation, dynamics, transport, and chemistry. The workshop participants discussed how to approach the next step; namely the evalu-ation of individual models for their perfor-mance in each diagnostic category.
During a breakout group discussion, the fol-lowing recommendations were put forward: 1.Establish guidelines for models partici-
pating in any chemistry-climate experi-ments that relate to basic model features, e.g. stratospheric chemistry, polar pro-cesses.
2.Develop a quantitative metric of perfor-mance (grade) for each model for each
18
53294-1 SPARC.indd 18 12/11/07 10:55:22 AM

CCM1
CCM2
CCMi
• Evaluation of climate-ozone coupling mechanisms
Chemistry Climate Model Groups
SPARC Chemistry Climate Model Validation (CCMVal) Activity
• Database of model outputs• Model past and future scenarios• Intercomparison tools• Model diagnostics and evaluation
UNEP/WMO Scientific Assessment of Ozone Depletion
• Past and future projections of stratospheric ozone
diagnostic. The grades are an effort to de-scribe the skill of each model to represent important features of the atmosphere.
3. Assign weights to the importance of each diagnostic based on what model product is being used in a model-based assess-ment. For instance, if the product is the “recovery date of stratospheric ozone,” then a diagnostic relating to the behav-iour of Cly might get high weight, while the skill of predicting 500-hPa geopoten-tial height may receive a lower weight.
4.Convolve the diagnostic weights and grades for each model to define an overall weight for a specific product.
5.Calculate a weighted-ensemble average and uncertainty for a product using the set of model weights to define best esti-mates and variances (spreads) for model products, such as stratospheric ozone projections.
This is an ambitious goal and there was considerable discussion about how well it can be attained. However, there was also general agreement that the goal is a worthy one and that even trying to achieve it will be very interesting and worthwhile.
Link to the anticipated UNEP/WMO 2010 Ozone Assessment
The outcome of the extensive evaluation in the SPARC CCMVal report should provide the authors of the next UNEP/WMO Ozone Assessment with a sound basis to make objective judgements of the uncertainties associated with future ozone projections from the participating CCMs. The two-way communication linking the CCM groups with CCMVal and the WMO/UNEP Ozone Assessment is illustrated in Figure 1. CCMVal acts as a resource for the model-ling groups and for the Ozone Assessment by developing and maintaining evaluation tools for the models, maintaining defini-tions and boundary condition data for “sce-nario” experiments, and archiving output data from the models. The CCM groups will interact with CCMVal in defining and applying the evaluation tools, using the boundary condition data, and provid-ing model output. It is anticipated that the Ozone Assessment will make use of CCMVal resources by working with the CCM groups to help in defining relevant model scenarios, using the data bases of model outputs and applying the tools and metrics derived by CCMVal in their evalu-ation of model results. In addition, the
Assessment authors may solicit data from other model groups and, if they wish, may apply CCMVal diagnostic tools to evalu-ate these model results. The coordination, support, and products that SPARC CCM-Val provides for the CCM community rep-resent an important additional resource for the Assessment process.
Timetable
The SPARC CCMVal report needs to be finished by the end of 2009, if it is to be available for consideration in the 2010 Ozone Assessment. The timetable for the report preparation is thus:
• November 2007: Definition of chapter outlines, scenarios and diagnostics
• March 2008: REF0 runs available for analysis • August 2008: Lead Author meeting coupled to SPARC General Assembly• October 2008: All model runs completed and available for analysis• March 2009: Draft for internal review• May 2009: CCMVal workshop 2009 in Toronto• August –September 2009: External re
view• October-November 2009: Review meeting• December 2009: Report finished
Updated information on the SPARC CCMVal Report, the new reference and sensitivity simulations and data requests can be found at the CCMVal website (http://www.pa.op.dlr.de/CCMVal/).
Acknowledgements
The workshop was organised by the Steer-ing Committee of the CCM Validation (CCMVal) Activity on behalf of WCRP’s (World Climate Research Programme) SPARC (Stratospheric Processes and their Role in Climate). We thank Martyn Chipperfield and Piers Forster of the Uni-versity of Leeds, UK for the local organisa-tion and all the workshop participants for their valuable contributions.
References
Eyring, V. et al., A strategy for process-ori-ented validation of coupled chemistry-cli-mate models, Bull. Am. Meteorol. Soc., 86, 1117–1133, 2005.
Eyring, V. et al., Assessment of tempera-ture, trace species and ozone in chemis-try-climate model simulations of the re-cent past, J. Geophys. Res., 111, D22308, doi:10.1029/2006JD007327, 2006.
Eyring, V. et al., Multimodel projections of stratospheric ozone in the 21st century, J. Geophys. Res., 112, D16303, doi:10.1029/2006JD008332, 2007.
Eyring, V. et al., Overview of the new CCMVal reference and sensitivity simula-tions in support of upcoming ozone and cli-mate assessments and the planned SPARC CCMVal Report, SPARC Newsletter No. 30, this issue, 2008.
Pawson, S. et al., The GCM-Reality In-tercomparison Project for SPARC: Scien-tific Issues and Initial Results, Bull. Am. Meteorol. Soc., 81, 781-796, 2000.
Figure 1. Model of the relationships between CCMVal, the CCM groups, and the UNEP/WMO Assessment.
19
monthly mean fields. The vertical coor-dinate should be pressure based, but there was no consensus whether the pressure levels should be standard for all models or model specific. Several derived fields are desirable, e.g. Eliassen-Palm (EP) fluxes, potential vorticity (PV) and tropopause characteristics. Some high frequency diag-nostics (such as instantaneous snapshots of chemical fields) will probably be requested by some chapters. Details on which fields at what frequency will be needed, are like-ly to be determined by the requirements of the SPARC CCMVal report and will be finalised in 2007.
The diagnostic tools and observations used for model evaluation were discussed. It was agreed that a common diagnostic tool for evaluating climatological fields (such as those appearing in Eyring et al., 2006, 2007) would be valuable for quick assess-ment and comparison of basic model per-formance prior to more detailed analysis. Such a tool should be based on open source formats and might be designed to run on a server linked to the CCMVal archive. Additional resources would be required to build such a tool and are requested in some proposals currently pending in the USA and Europe. There was general agreement to prepare observational data sets in the same format as the model output and to add these to the model output archive. These would include individual instruments as well as composite data sets.
Evaluation
CCMVal was formulated to evaluate the skill of CCMs being used for projections of stratospheric ozone. A comprehensive list of diagnostics of model performance has been developed previously for radiation, dynamics, transport, and chemistry. The workshop participants discussed how to approach the next step; namely the evalu-ation of individual models for their perfor-mance in each diagnostic category.
During a breakout group discussion, the fol-lowing recommendations were put forward: 1.Establish guidelines for models partici-
pating in any chemistry-climate experi-ments that relate to basic model features, e.g. stratospheric chemistry, polar pro-cesses.
2.Develop a quantitative metric of perfor-mance (grade) for each model for each
53294-1 SPARC.indd 19 12/13/07 11:39:29 AM
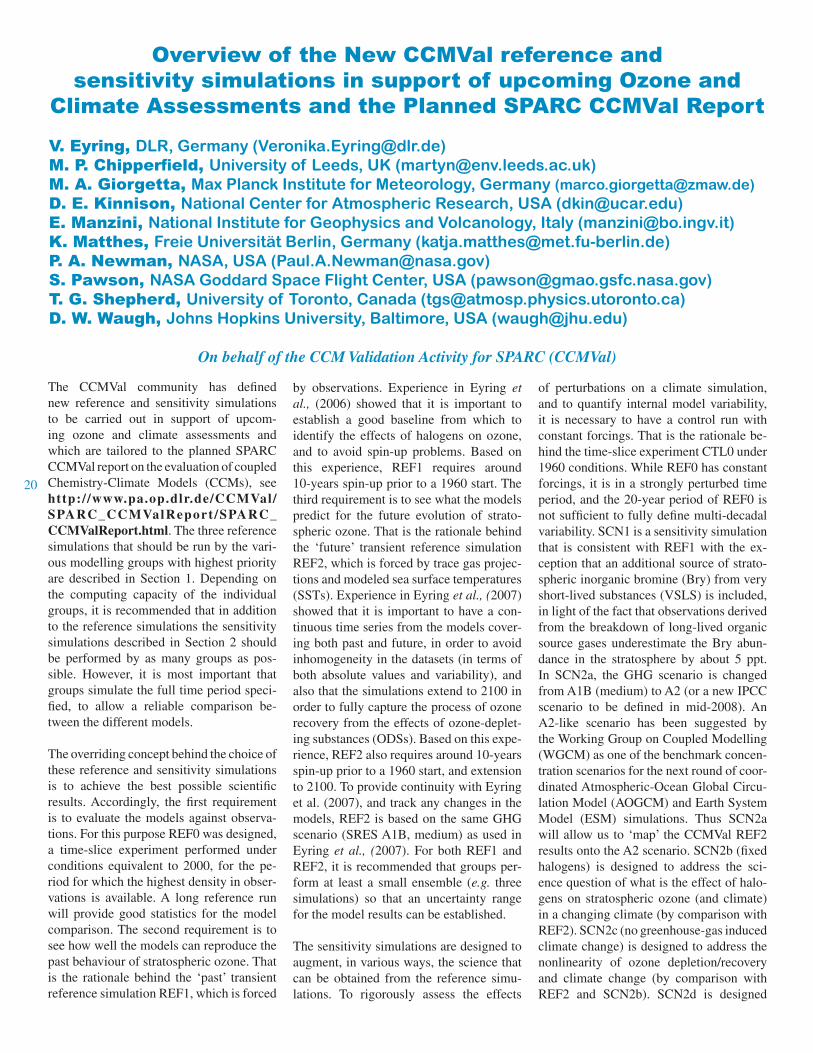
20
Overview of the New CCMVal reference and sensitivity simulations in support of upcoming Ozone and
Climate Assessments and the Planned SPARC CCMVal Report
V. Eyring, DLR, Germany ([email protected])M. P. Chipperfield, University of Leeds, UK ([email protected])M. A. Giorgetta, Max Planck Institute for Meteorology, Germany ([email protected])D. E. Kinnison, National Center for Atmospheric Research, USA ([email protected])E. Manzini, National Institute for Geophysics and Volcanology, Italy ([email protected])K. Matthes, Freie Universität Berlin, Germany ([email protected])P. A. Newman, NASA, USA ([email protected])S. Pawson, NASA Goddard Space Flight Center, USA ([email protected])T. G. Shepherd, University of Toronto, Canada ([email protected])D. W. Waugh, Johns Hopkins University, Baltimore, USA ([email protected])
On behalf of the CCM Validation Activity for SPARC (CCMVal)
The CCMVal community has defined new reference and sensitivity simulations to be carried out in support of upcom-ing ozone and climate assessments and which are tailored to the planned SPARC CCMVal report on the evaluation of coupled Chemistry-Climate Models (CCMs), see http:/ /www.pa.op.dlr.de/CCMVal/SPARC_CCMValReport /SPARC_CCMValReport.html. The three reference simulations that should be run by the vari-ous modelling groups with highest priority are described in Section 1. Depending on the computing capacity of the individual groups, it is recommended that in addition to the reference simulations the sensitivity simulations described in Section 2 should be performed by as many groups as pos-sible. However, it is most important that groups simulate the full time period speci-fied, to allow a reliable comparison be-tween the different models.
The overriding concept behind the choice of these reference and sensitivity simulations is to achieve the best possible scientific results. Accordingly, the first requirement is to evaluate the models against observa-tions. For this purpose REF0 was designed, a time-slice experiment performed under conditions equivalent to 2000, for the pe-riod for which the highest density in obser-vations is available. A long reference run will provide good statistics for the model comparison. The second requirement is to see how well the models can reproduce the past behaviour of stratospheric ozone. That is the rationale behind the ‘past’ transient reference simulation REF1, which is forced
by observations. Experience in Eyring et al., (2006) showed that it is important to establish a good baseline from which to identify the effects of halogens on ozone, and to avoid spin-up problems. Based on this experience, REF1 requires around 10-years spin-up prior to a 1960 start. The third requirement is to see what the models predict for the future evolution of strato-spheric ozone. That is the rationale behind the ‘future’ transient reference simulation REF2, which is forced by trace gas projec-tions and modeled sea surface temperatures (SSTs). Experience in Eyring et al., (2007) showed that it is important to have a con-tinuous time series from the models cover-ing both past and future, in order to avoid inhomogeneity in the datasets (in terms of both absolute values and variability), and also that the simulations extend to 2100 in order to fully capture the process of ozone recovery from the effects of ozone-deplet-ing substances (ODSs). Based on this expe-rience, REF2 also requires around 10-years spin-up prior to a 1960 start, and extension to 2100. To provide continuity with Eyring et al. (2007), and track any changes in the models, REF2 is based on the same GHG scenario (SRES A1B, medium) as used in Eyring et al., (2007). For both REF1 and REF2, it is recommended that groups per-form at least a small ensemble (e.g. three simulations) so that an uncertainty range for the model results can be established.
The sensitivity simulations are designed to augment, in various ways, the science that can be obtained from the reference simu-lations. To rigorously assess the effects
of perturbations on a climate simulation, and to quantify internal model variability, it is necessary to have a control run with constant forcings. That is the rationale be-hind the time-slice experiment CTL0 under 1960 conditions. While REF0 has constant forcings, it is in a strongly perturbed time period, and the 20-year period of REF0 is not sufficient to fully define multi-decadal variability. SCN1 is a sensitivity simulation that is consistent with REF1 with the ex-ception that an additional source of strato-spheric inorganic bromine (Bry) from very short-lived substances (VSLS) is included, in light of the fact that observations derived from the breakdown of long-lived organic source gases underestimate the Bry abun-dance in the stratosphere by about 5 ppt. In SCN2a, the GHG scenario is changed from A1B (medium) to A2 (or a new IPCC scenario to be defined in mid-2008). An A2-like scenario has been suggested by the Working Group on Coupled Modelling (WGCM) as one of the benchmark concen-tration scenarios for the next round of coor-dinated Atmospheric-Ocean Global Circu-lation Model (AOGCM) and Earth System Model (ESM) simulations. Thus SCN2a will allow us to ‘map’ the CCMVal REF2 results onto the A2 scenario. SCN2b (fixed halogens) is designed to address the sci-ence question of what is the effect of halo-gens on stratospheric ozone (and climate) in a changing climate (by comparison with REF2). SCN2c (no greenhouse-gas induced climate change) is designed to address the nonlinearity of ozone depletion/recovery and climate change (by comparison with REF2 and SCN2b). SCN2d is designed
53294-1 SPARC.indd 20 12/11/07 10:55:23 AM

to address the impact of ‘realistic’ natural variability on the REF2 simulations, for which the natural variability is underesti-mated.
1. CCMVal reference simulations
This section gives an overview of the main characteristics of the new CCMVal refer-ence (REF) simulations. The key character-istics are also summarised in Table 1.
1.1. Time-slice experiment (REF0)
REF0 is a time-slice experiment for condi-tions equivalent to the year 2000, proposed to facilitate the comparison of model out-put against constituent datasets from vari-ous high-quality observational data sources and meteorological analyses under a period of high chlorine loading and peak ozone losses. Each simulation is integrated over 20 annual cycles following adequate spin-up (10 years is recommended). The model data of these 20 years are evaluated against contemporary observations (i.e. during the satellite measurement period of UARS, Aura, ENVISAT, Odin, SAGE, SBUV, TOMS, ACE, etc.) and compared to results of other CCMs. The 20 years of output are necessary in order to compare mean quan-tities with large variability (e.g. polar tem-peratures). It should be possible to start the analysis of runs based on REF0 much ear-lier than the other scenarios and to collect extended output, which will be useful for developing the diagnostics as well as pro-viding a preliminary evaluation.
• Trace gas forcings are characteristic of species levels in 2000 for both ODSs and greenhouse gases (GHGs). The sur-face concentrations of GHGs are based on IPCC (2001) while the surface halogens are based on Table 8-5 of WMO (2007) for the year 2000. Both annual cycles of ODSs and GHGs repeat every year.• Background aerosol is prescribed from the extended SPARC (2006) SAD dataset (see REF1) for the year 2000.• Solar irradiance is averaged over 1-solar cycle to provide a mean solar flux for the year 2000.• Sea surface temperatures (SSTs) and sea ice concentrations (SICs) in this simu-lation are prescribed from observations by using a climatological mean derived from the years 1995 to 2004 HadISST1 dataset provided by the UK Met Office Hadley Centre (Rayner et al., 2003). Prescribed
SSTs and ice distribution repeat each year in REF0 (cf. REF1 SSTs/SICs).• Quasi-Biennial Oscillation (QBO). In this run the QBO is not externally forced and only included by those models that in-ternally generate a QBO. • Emissions of ozone and aerosol pre-cursors (CO, NMVOC, NO
x and SO
2) are
averaged over the years 1998 to 2000 and are taken from an extended dataset of the REanalysis of the TROpospheric chemical composition (RETRO) project (Schultz et al., 2007, see http://retro.enes.org). The RETRO emissions inventory is a com-prehensive global gridded dataset for an-thropogenic and wildfire emissions over the past 40 years. The dataset comprises a high level of detail in the speciation of NMVOC compounds. The data originates from a large variety of sources, including the TNO TEAM inventory, information on burnt area statistics, the regional fire model Reg-FIRM, and satellite data. In case of SO
2, RETRO only provides biomass burn-
ing related emissions. Therefore, this data is combined with an interpolated version of EDGAR-HYDE 1.3 (Van Aardenne et al., 2001) and EDGAR 32FT2000 (Olivier et al., 2005; Van Aardenne et al., 2005).• Chemical kinetics should be taken from JPL (2006), in accordance with all other CCMVal simulations described below.
1.2. Reproduce the past: Reference Simulation 1 (REF1), Core Time Period 1960 to 2006
REF1 (1960-2006) is defined as a transient run from 1960 to the present and is de-signed to reproduce the well-observed peri-od of the past 35 years during which ozone depletion is well recorded. It allows a more detailed investigation of the role of natural variability and other atmospheric changes important for ozone balance and trends. All forcings in this simulation are taken from observations. The set-up and forcings are very similar to the REF1 simulations that were evaluated in Eyring et al., (2006). A re-assessment of temperatures, trace spe-cies and ozone in the CCM simulations will allow documenting progress of indi-vidual models and overall progress on the representation of key processes compared to the last CCM assessment. The compari-son of CCM results with observations will also allow some groups to identify and correct previously unrecognised model errors and will help to indicate a range of model uncertainties. This transient simula-
tion includes all anthropogenic and natural forcings based on changes in trace gases, solar variability, volcanic eruptions, quasi-biennial oscillation (QBO), and SSTs/SICs. REF1 covers the time period from at least 1960 to 2006 (with around 10 years spin-up prior to 1960) to examine model variability and to replicate as closely as possible the atmospheric state in this period.
• Greenhouse Gases (N2O, CH
4, and CO
2)
between 1950 and 1996 are taken from IPCC (2001) and merged with the NOAA observations forward through 2006. NOAA CO
2, CH
4, and N
2O were scaled to agree
on January 1996 with the historical IPCC data.• Surface mixing ratios of Ozone Deplet-ing Substances (CFC-11, CFC-12, CFC-113, CFC-114, CFC-115, CCl4, CH3CCl3, HCFC-22, HCFC-141b, HCFC-142b, Ha-lon1211, Halon1202, Halon1301, and Ha-lon2402) in REF1 are taken from Table 8-5 of WMO (2007). The mixing ratios are cal-culated by a box model using yearly emis-sions and are given for the middle of the month. The time series does not contain a yearly variation in mixing ratios. Through 2004 the values are maximally forced to equal global estimates calculated from observations (for details see Chapter 8 of WMO [2007]). For models that do not wish to represent all the brominated and chlori-nated species in Table 8-5 of WMO (2007), the halogen content of species that are con-sidered should be adjusted such that model inputs for total chlorine and total bromine match the time series of total chlorine and bromine given in this table. • Sea surface temperatures and sea ice concentrations in REF1 are prescribed as monthly mean boundary conditions follow-ing the global sea ice concentration and sea surface temperature (HadISST1) dataset provided by the UK Met Office Hadley Centre (Rayner et al., 2003). This dataset is based on combined satellite and in situ observations. To prepare the data for use in forcing a model, and in particular to correct for the loss of variance due to time-interpola-tion of monthly mean data, it is recommend-ed that each group follows the procedures described on the C20C project website (see http://grads.iges.org/c20c/c20c_forcing/karling_instruct.html). This describes how to apply the AMIP II variance cor-rection method (see http://www-pcmdi.llnl.gov/projects/amip/AMIP2EXPDSN/BCS/amip2bcs.php for details) to the HadISST1 data.
of perturbations on a climate simulation, and to quantify internal model variability, it is necessary to have a control run with constant forcings. That is the rationale be-hind the time-slice experiment CTL0 under 1960 conditions. While REF0 has constant forcings, it is in a strongly perturbed time period, and the 20-year period of REF0 is not sufficient to fully define multi-decadal variability. SCN1 is a sensitivity simulation that is consistent with REF1 with the ex-ception that an additional source of strato-spheric inorganic bromine (Bry) from very short-lived substances (VSLS) is included, in light of the fact that observations derived from the breakdown of long-lived organic source gases underestimate the Bry abun-dance in the stratosphere by about 5 ppt. In SCN2a, the GHG scenario is changed from A1B (medium) to A2 (or a new IPCC scenario to be defined in mid-2008). An A2-like scenario has been suggested by the Working Group on Coupled Modelling (WGCM) as one of the benchmark concen-tration scenarios for the next round of coor-dinated Atmospheric-Ocean Global Circu-lation Model (AOGCM) and Earth System Model (ESM) simulations. Thus SCN2a will allow us to ‘map’ the CCMVal REF2 results onto the A2 scenario. SCN2b (fixed halogens) is designed to address the sci-ence question of what is the effect of halo-gens on stratospheric ozone (and climate) in a changing climate (by comparison with REF2). SCN2c (no greenhouse-gas induced climate change) is designed to address the nonlinearity of ozone depletion/recovery and climate change (by comparison with REF2 and SCN2b). SCN2d is designed
21
53294-1 SPARC.indd 21 12/11/07 10:55:24 AM

22
Scenario Period Greenhouse Gases
ODSs SSTs/SICs Background & Volcanic
Aerosol
Solar Variability
QBO Ozone and Aerosol
PrecursorsREF0 Time slice
2000Appropriate spin up then provide 20 years of output
OBSFixed at 2000 concentrations
(from IPCC, 2001), repeating
each year
OBSFixed at 2000 concentrations (from Table 8-5 WMO, 2007),
repeating each year
OBS1995-2004
average derived from HadISST1, repeating each year
OBSBackground
SAD from 2000
OBSAveraged
solar irradiance
over 1 solar cycle
Only internally generated
OBSRETRO 1998-
2000 mean
REF1 Transient simulation 1960-2006Appropriate spin up prior
to 1960
OBSGHG used for
WMO/UNEP 2002 runs and updated
until 2006
OBSTable 8-5 WMO
[2007]
OBSHadISST1
OBSSurface Area Density data
(SAD)
OBSSpectrally resolved
irradiance data
OBS or internally generated
OBSExtended RETRO dataset
REF2 Transient simulation 1960-2100Appropriate spin up prior
to 1960
A1B(medium)(from IPCC, 2000)
OBS + adjusted A1 scenario [WMO 2007,
Table 8-5]
Modeled SSTs
OBS Background
SAD from 2000
NO Only internally generated
Same as REF1 until
2000 + adjusted
IIASA scenario
through 2100
• Surface Area Densities (SADs) from observations are considered in REF1. A monthly zonal mean time series for SADs from 1979 to 2005 was created using data from the SAGE I, SAGE II, SAM II, and SME instruments (units: square microns per cubic centimeter). This time series was published in SPARC (2006). In addi-tion, uncertainties of the SAGE II dataset are described in detail in Thomason et al., (2007). The altitude and latitude range of this dataset is 12 - 40 km and 80°S – 80°N respectively. The SPARC SAD dataset does have data gaps, which occur mainly in lower tropical altitudes (below 16 km) and during the El Chichón period. Above 26 km there are large data gaps in the mid-to-high latitude region. There are also miss-ing data at all altitudes in the high latitude polar regions. The NCAR group modified this new SPARC SAD dataset for CCM applications by filling the missing data us-ing a linear interpolation approach in alti-tude and latitude. Large gaps of data above 26 km were filled with background values of 0.01 square microns per cubic centime-ter. In the upper troposphere, tropical lati-tudes, data gaps were filled without scien-tific considerations. The previous CCMVal SAD dataset was created by D. Considine and used in Eyring et al., (2006). The mod-ified SPARC SAD time series shows minor deviations from the previous CCMVal SAD time series in the mid-latitudes and tropics. The most significant changes occur in high latitude regions, specifically during the
period influenced by major volcanic erup-tions. Here, the previous CCMVal SAD time series is consistent with background values (see description in the header of the previous CCMVal SAD time series input file for details on how this dataset was cre-ated). The Agung eruption in 1963 is not covered by this dataset. To correct for this eruption, the method described in Dameris et al., (2005) was applied. The well docu-mented years following the eruption of Mt. Pinatubo (1991–1994) have been adopted and associated with the period 1963–1966 with modifications based on published results to account for differences in total mass of sulfate aerosols in the stratosphere, in maximum height of the eruption plumes, and in the geographical location of the vol-canoes. Above the maximum vertical extent of Agung’s eruption plume the annual mean of 1979 has been incorporated. For the time periods 1950–1962 and 1968–1978 the an-nual mean of 1979 has been adopted. For the new CCMVal simulations, we recom-mend using the new modified SPARC SAD time series described above, in particular for those models that have a heterogeneous chemistry halogen activation approach based solely on the occurrence of super cooled ternary (STS) PSCs.• Stratospheric warming and tropo-spheric-surface cooling due to volcanic eruptions are either calculated online by using aerosol data or by prescribing heat-ing rates and surface forcing. For those models that do not calculate this effect on-
line, pre-calculated zonal mean aerosol heating rates (K/day) and net surface radiative forcing (W/m2) monthly means from January 1950 to December 1999 for all-sky condition are available on the CCMVal website. They were calculated us-ing volcanic aerosol parameters from Sato et al., (1993), Hansen et al., (2002) and GISS ModelE radiative routines and clima-tology (Schmidt et al., 2006; G. Stenchikov and L. Oman, pers. communication, 2007). In addition to the larger volcanic eruptions (Agung, 1963; El Chichón, 1982; Pinatubo, 1991), smaller ones like Fernandina (1968 in Galapagos) and Fuego (1974 in Guate-mala) are included. The surface radiative forcing is negative, corresponding to cool-ing caused by volcanic aerosols. The right way to use these datasets to mimic effect of the volcanic eruptions would be to apply heating rates to the atmosphere and cooling flux to the surface. Heating rates and sur-face forcing would characterise the entire volcanic effect, i.e. stratospheric warming and tropospheric-surface cooling. If the focus is on stratospheric processes only, aerosol heating rates could be used without causing any problem.• Solar variability. To account for the highly variable and wavelength-dependent changes in solar irradiance, daily spec-trally resolved solar irradiance data from 1 Jan 1950 to 31 Dec 2006 (in W/m2/nm) are provided. The data are derived with the method described in Lean et al., (2005) and are available with the following spec-
Table 1: Summary of proposed CCMVal reference simulations.
53294-1 SPARC.indd 22 12/11/07 10:55:24 AM

tral resolution: 1 nm bins from 0 to 750 nm; 5 nm bins from 750 to 5000 nm; 10 nm bins from 5000 to 10000 nm; 50 nm bins from 10000 to 100000 nm. Each mod-elling group is required to integrate these data over the individual wavelength inter-vals (a) in their radiation scheme (to adjust the shortwave heating rates) and (b) in their chemistry scheme (to adjust the photolysis rates). It is recommended to use the pro-vided solar flux data directly (integrated over the respective intervals in the radia-tion and chemistry schemes), rather than a parameterisation with the F10.7 cm radio flux previously used. Additional informa-tion as well as the data can be found on the SOLARIS website at http://www.geo.fu-berlin.de/en/met/ag/strat/research/SOLARIS/Input_data/index.html.• Quasi-Biennial Oscillation. The QBO is generally described by zonal wind pro-files measured at the equator. The QBO is an internal mode of variability of the atmo-sphere that dominates the interannual vari-ability in wind in the tropical stratosphere and contributes to the variability in the ex-tratropical dynamics. It is recognised that the QBO is important for understanding interannual variability in ozone and other constituents of the middle atmosphere, in the tropics and extratropics. Currently only a few atmospheric GCMs or CCMs simu-late a realistic QBO and hence QBO related influences. Simulated QBOs are generally independent of observed time series be-cause their phase evolutions are not bound by external boundary conditions. Realistic simulated QBOs, however, have similar periods, amplitudes and composite struc-tures in observations. The assimilation of the QBO, for example by a relaxation of zonal winds in the QBO domain (“nudg-ing”), hence may be useful for two reasons: first to obtain a QBO in GCMs that do not simulate the QBO internally, so that for ex-ample QBO effects on the general circula-tion are present; and second to synchronise the QBO simulated in a GCM with a given QBO time series, so that simulated QBO effects, for example on ozone, can be com-pared to observed signals. Datasets for this purpose and examples for the “nudging” of the QBO in a GCM are discussed on the CCMVal web site.• Ozone and aerosol precursors (CO, NMVOC, NO
x and SO
2) from 1960 to 2000
are taken from the extended dataset of the RETRO project (Schultz et al., 2007). For the spin-up period from 1950 to 1959 we recommend using the 1960 values from
this dataset. The dataset will be extended through 2006 by using trend estimates and will be harmonised so that regional totals are the same as in RETRO for the year 2000.
1.3. Making predicitons: Reference simulation 2 (REF2), Core time period 1960 to 2100
REF2 is an internally consistent simulation from the past into the future. The objective of REF2 is to produce best estimates of the future ozone-climate change up to 2100 under specific assumptions about GHG in-creases (Scenario SRES A1B) and decreas-es in halogen emissions (adjusted Scenario A1) in this period. REF2 only includes anthropogenic forcings. External natural forcings such as solar variability and vol-canic eruptions are not considered, as they cannot be known in advance, and the QBO is not externally forced (also as it cannot be known in advance; furthermore, it repre-sents the internal dynamics of the model). To avoid introducing inhomogeneity into the time series, these natural forcings are not applied in the past either.
• Greenhouse Gas concentrations (N2O,
CH4, and CO
2) are taken from the IPCC
(2000) A1B scenario, to provide continuity with Eyring et al., (2007). • Surface mixing ratios of Ozone Deplet-ing Substances are based on the halogen scenario A1 from WMO (2007). However, at the 2007 Meeting of the Parties to the Montreal Protocol, the Parties agreed to an earlier phase out of HCFCs, with nearly a full phase out by Article 5 countries in 2030 (http://ozone.unep.org/Meeting_Documents/mop/19mop/Adjustments_on_HCFCs.pdf). The current scenario A1 does not include this phase out. Hence, a new scenario has been developed to in-clude this adjustment (hereafter referred to as adjusted scenario A1). The adjusted scenario A1 will only consider changes in HCFCs; distributions of CFCs, Halons, and other non-HCFC species remain identical to the original A1 scenario. The adjusted scenario A1 can be downloaded from the CCMVal website.• Background aerosol is prescribed from the extended SPARC (2006) SAD dataset (see REF1) for the year 2000.• Sea surface temperatures and sea ice concentrations in REF2. One of the most critical issues is the design of the future simulation REF2. Discrepancies between
observed and simulated SST and SICs complicate the selection of these fields for runs that span the past and the future. Be-cause of potential discontinuities between the observed and modeled data record, the REF2 runs use simulated SSTs and SICs for the entire period. There are three al-ternate approaches, depending on the re-sources of each modelling group. First, groups that have fully coupled atmosphere-ocean models with coupled chemistry and a middle atmosphere should perform a fully coupled run that calculates the SSTs/SICs internally. Due to the inertia of the coupled atmosphere ocean system, such integra-tions should be started from equilibrated control simulations for preindustrial condi-tions, as it is standard for the 20th century integrations for IPCC. Second, groups that have a coupled atmosphere-ocean model that does not include chemistry should use their own modeled SSTs/SICs for 1960-2100 in their CCM run. Third, groups that do not have their own coupled ocean-atmo-sphere model should use SSTs/SICs from an A1B-scenario IPCC AR-4 simulation, for example from CCSM3 (Collins et al., 2007). The SSTs from HADGEM1 used in the first CCMVal REF2 simulation have a cold bias with respect to observations (see Figure 3 of Johns et al., 2006), whereas the tropical SSTs from the CCSM3 are in better agreement with observations (Large and Danabasoglu, 2006). Oldenborgh et al., (2005) presented a multi-model study of the representation of El Niño in IPCC AR4 models. • Ozone and aerosol precursors in REF2 are similar to REF1 until 2000 (extended RETRO dataset), and use the adjusted IIA-SA scenario through 2100 (M. Amann and P. Rafai, pers. communication, 2007). The dataset needs to be harmonised so that re-gional totals are the same as in RETRO for the year 2000.
2. CCMVal sensitivity and control simulations
The following CCMVal sensitivity and control experiments are proposed:
SCN1 (1960-2006, REF1 with addi-tional organic bromine): Observations suggest that stratospheric inorganic bro-mine (Br
y) derived from the breakdown of
long-lived (>3 years) organic source gases (i.e. CH3Br, halon-1211, halon-1301, and halon-2402) underestimate the Bry abun-dance in the stratosphere by about 5 ppt,
23
53294-1 SPARC.indd 23 12/11/07 10:55:25 AM

Scenario Period GHGs ODSs SSTs/SICs Background & Volcanic
Aerosol
Solar Variability
QBO Ozone and Aerosol
PrecursorsCTL0 1960 Time slice 1960
Appropriate spin-up then provide a minimum of 20 years of output
OBSFixed at 1960 concentrations
(from IPCC, 2001), repeating
each year
OBSFixed at 1960 concentrations
(from Table 8-5 WMO, 2007), repeating each
year
OBS1955-1964
average derived from HadISST1, repeating each
year
OBSBackground SAD
from 1979
OBSAveraged
solar irradiance
over 1 solar cycle
Only internally generated
OBSRETRO 1960-
1962 mean
SCN1 (additional bromine)
Transient simulation 1960-2006
Same as in REF1 Same as in REF1 but with
additional bromine
Same as in REF1
Same as in REF1 Same as in REF1
Same as in REF1
Same as in REF1
SCN2a GHGs 2000-2100 OBS + GHG scenario different from
A1b
Same as in REF2
SSTs/SICs distribution
consistent with GHG scenario
Same as in REF2 Same as in REF2
Same as in REF2
Same as REF1 until 2000 + scenario consistent with GHGs
SCN2b Fixed Halogens
1960-2100 Same as in REF2 Fixed halogen scenario
Same as in REF2
Same as in REF2 Same as in REF2
Same as in REF2
Same as in REF2
SCN2c NCC
1960-2100 Fixed GHG Same as in REF2
1955-1964 average of
values used in REF2, repeating
each year
Same as in REF2 Same as in REF2
Same as in REF2
Same as in REF2
SCN2d Natforcing QBO
1960-2100 Same as in REF2 Same as in REF2
Same as in REF2
OBS in the past and background
aerosol in the future
OBSrepeating in
future
OBS / repeating
in future or internally generated
Same as in REF2
• Solar irradiance is averaged over 1-solar cycle to provide a mean solar flux for the year 1960.
• Emissions of ozone and aerosol precur-sors (CO, NMVOC, NO
x and SO
2) for
1960 conditions are taken from the ex-tended RETRO dataset and averaged over the period 1960 to 1962.
• Sea surface temperatures and sea ice concentrations in this simulation are pre-scribed from observations by using a cli-matological mean derived from the years 1955 to 1964 HadISST1 dataset provided by the UK Met Office Hadley Centre (Rayner et al., 2003). Prescribed SSTs and ice distribution repeat each year in CTL0.
• Quasi-Biennial Oscillation. In this run the QBO is not externally forced and only included by models that internally gener-ate a QBO.
3. Summary and outlook
CCM groups are encouraged to run the pro-posed reference simulations with the speci-fied forcings. In order to facilitate the set-up of the reference simulations, CCMVal has established a website where the forc-ings for the simulations can be download-
24
with estimates ranging from 3 to 8 pptv. Observations also suggest that very short-lived substances (VSLS) with atmospheric lifetimes of less than 0.5 years make up the missing stratospheric Bry (Chapter 2 of WMO 2003, 2007). The supply of bro-mine from VSLS can result in a substantial fractional increase to the amount of bro-mine in the lowermost stratosphere, with important consequences for ozone trends and the photochemical budget of ozone, particularly during times of high aerosol loading. SCN1 was developed to quantify the effect of bromine on ozone from VSLS. This scenario is consistent with REF1 with the exception that an additional source of 5 pptv of Bry from VSLS is included. In SCN1, we are proposing to add the species dibromomethane (CH
2Br
2) to the chemical
mechanism of participating CCMs. The lifetime of CH
2Br
2 is approximately 120
days at 5 km (Table 2.3, WMO 2007) and the reaction with OH is the dominant loss process (Table 2.4, WMO 2003). The esti-mated fraction of CH
2Br
2 mixing ratio in
the tropical upper troposphere relative to the abundance in the marine boundary lay-er is approximately 0.8 (Table 2.2, WMO 2007). Therefore, if the surface abundance of CH
2Br
2 is set to 3 pptv, the stratospheric
Bry abundance should increase by approxi-mately 5 pptv (i.e. 5 pptv total Bry / 2 Br per CH
2Br
2molecule / 0.8 is equal to ~3.0
pptv CH2Br
2). If modelling groups prefer
not to add a new species to their CCM, we propose adding 5 pptv of total bromine to the shortest-lived organic bromine source gas currently included in the chemical mechanism.
SCN2a (2000-2100, REF2 with GHG scenario different than SRES A1B) is a transient simulation similar to REF2, but with the GHG and ozone precursor scenar-io changed from SRES A1B (medium) to A2 (or a new IPCC scenario to be defined in mid-2008). Accordingly, if the model does not include an interactive ocean, SSTs and SICs are prescribed from an AOGCM simulation that is consistent with the GHGs scenario. SCN2a is designed to be consis-tent with one of the new coordinated Cli-mate Change Stabilization Experiments proposed for AOGCMs and ESMs (Meehl et al., 2007). Ideally AOGCMs and ESMs will include their own atmospheric chemis-try schemes, but many models do not have this option. For this category of models ozone fields have to be prescribed in the simulations. There are therefore two moti-
vations for this run. One is to assess the fu-ture evolution of the ozone-climate change under a different GHG scenario than the A1B scenario used in REF2, and the sec-ond is to compute a best estimate of ozone fields consistent with the GHG scenario for community use in IPCC AR5 models. Ozone precursors in SCN2a are similar to REF1 and REF2 until 2000, and use the adjusted IIASA A2 scenario through 2100 (M. Amann and P. Rafai, pers. communica-tion, 2007) or a new IPCC scenario to be defined in mid-2008.
SCN2b (1960-2100, REF2 with halo-gens fixed at 1960 levels) is a transient simulation similar to REF2, but with halo-gens fixed at levels corresponding to 1960 throughout the simulation, whereas GHGs and SSTs/SICs are the same as in REF2. It is designed to address the science ques-tion of what are the effects of halogens on stratospheric ozone and climate, in the presence of climate change. By comparing SCN2b with REF2, the impact of halogens can be identified and it can be assessed at what point in the future the halogen impact is undetectable, i.e. within climate variabil-ity. This was the definition of full recovery of stratospheric ozone from the effects of ODSs that was advanced in WMO [2007]. SCN2c (1960-2100, REF2 with GHGs fixed at 1960 levels) is a transient simula-tion similar to REF2, but with GHGs fixed at levels corresponding to 1960 throughout the simulation, whereas the adjusted sce-nario A1 halogens are the same as in REF2. It is designed to address the science ques-tion of how nonlinear are the atmospheric responses to ozone depletion/recovery and climate change. To that end, GHGs are fixed at 1960 levels throughout the simulation. SSTs/SICs will be a 1955-1964 average of the values used in REF2. By comparing the sum of SCN2b and SCN2c (each relative to the 1960 baseline) with REF2, the non-linearity of the responses can be assessed. SCN2c also addresses the policy-relevant (if academic) question of what would be the impact of halogens on the atmosphere in the absence of climate change.
SCN2d (1960-2100, REF2 with natural forcings and QBO) is designed to address the impact of ‘realistic’ natural variability on the REF2 simulations, for which the natural variability is underestimated. This sensitivity simulation is defined similar to REF1, with the inclusion of solar variabil-
ity, volcanic activity, and the QBO in the past. Future forcings include a repeating solar cycle and QBO, under volcanically clean aerosol conditions. SSTs/SICs are simulated or prescribed as in REF2. GHGs and halogens will be the same as in REF2. We recommend using a repeating solar cy-cle based on the observed daily spectra de-scribed in Lean et al., (2005). It is proposed to repeat the solar cycles 20 to 23 (1962-2004) and therefore neglect the extreme solar cycle 19 (peaking in 1957/58).
CTL0 (minimum 20 years, REF0 but for 1960 conditions) is a time-slice simulation under 1960 conditions designed to estab-lish a baseline control simulation for the reference and sensitivity simulations. The objective is to provide a statistical char-acterisation of the internal variability of the CCMs prior to major perturbations of the ozone layer. The control 1960 simula-tion has ODSs, GHGs, and solar irradiance held fixed. SSTs/SICs in this simulation are (analogous to REF0) prescribed from ob-servations by using a climatological mean derived from years 1955 to 1964 of the HadISST1 dataset, repeating every year. Given these design constraints, the only source of variability is the internal dynam-ics of the atmosphere (and land properties like snow cover and soil moisture), while natural variability arising from solar vari-ability and volcanic eruptions is excluded. Moreover, there are no secular changes in greenhouse gases and halogens, hence no long-term trends, which will allow a statis-tical characterisation of random short-term trends. This is important for assessing the statistical significance of trends in the ref-erence and sensitivity simulations. After a spin-up period of about 10 years, each sim-ulation is integrated over at least 20 annual cycles for analysis. However, the goal of a 46-year control simulation is strongly en-couraged, 46 years being the length of the REF1 simulation. Some of the reference and sensitivity simulations could branch off from CTL0, thereby reducing their re-spective spin-up periods to a few years. • Trace gas forcings are characteristic of 1960 levels for both ODSs and GHGs. The surface concentrations of GHGs are based on IPCC (2001) while the surface halogens are based on Table 8-5 of WMO (2007) for the year 1960. Both ODSs and GHGs repeat every year.
• Background aerosol is prescribed from the extended SPARC (2006) SAD clima-tology (see REF1) for the year 1979.
53294-1 SPARC.indd 24 12/11/07 10:55:25 AM

Scenario Period GHGs ODSs SSTs/SICs Background & Volcanic
Aerosol
Solar Variability
QBO Ozone and Aerosol
PrecursorsCTL0 1960 Time slice 1960
Appropriate spin-up then provide a minimum of 20 years of output
OBSFixed at 1960 concentrations
(from IPCC, 2001), repeating
each year
OBSFixed at 1960 concentrations
(from Table 8-5 WMO, 2007), repeating each
year
OBS1955-1964
average derived from HadISST1, repeating each
year
OBSBackground SAD
from 1979
OBSAveraged
solar irradiance
over 1 solar cycle
Only internally generated
OBSRETRO 1960-
1962 mean
SCN1 (additional bromine)
Transient simulation 1960-2006
Same as in REF1 Same as in REF1 but with
additional bromine
Same as in REF1
Same as in REF1 Same as in REF1
Same as in REF1
Same as in REF1
SCN2a GHGs 2000-2100 OBS + GHG scenario different from
A1b
Same as in REF2
SSTs/SICs distribution
consistent with GHG scenario
Same as in REF2 Same as in REF2
Same as in REF2
Same as REF1 until 2000 + scenario consistent with GHGs
SCN2b Fixed Halogens
1960-2100 Same as in REF2 Fixed halogen scenario
Same as in REF2
Same as in REF2 Same as in REF2
Same as in REF2
Same as in REF2
SCN2c NCC
1960-2100 Fixed GHG Same as in REF2
1955-1964 average of
values used in REF2, repeating
each year
Same as in REF2 Same as in REF2
Same as in REF2
Same as in REF2
SCN2d Natforcing QBO
1960-2100 Same as in REF2 Same as in REF2
Same as in REF2
OBS in the past and background
aerosol in the future
OBSrepeating in
future
OBS / repeating
in future or internally generated
Same as in REF2
Table 2: Summary of proposed CCMVal control and sensitivity simulations.
• Solar irradiance is averaged over 1-solar cycle to provide a mean solar flux for the year 1960.
• Emissions of ozone and aerosol precur-sors (CO, NMVOC, NO
x and SO
2) for
1960 conditions are taken from the ex-tended RETRO dataset and averaged over the period 1960 to 1962.
• Sea surface temperatures and sea ice concentrations in this simulation are pre-scribed from observations by using a cli-matological mean derived from the years 1955 to 1964 HadISST1 dataset provided by the UK Met Office Hadley Centre (Rayner et al., 2003). Prescribed SSTs and ice distribution repeat each year in CTL0.
• Quasi-Biennial Oscillation. In this run the QBO is not externally forced and only included by models that internally gener-ate a QBO.
3. Summary and outlook
CCM groups are encouraged to run the pro-posed reference simulations with the speci-fied forcings. In order to facilitate the set-up of the reference simulations, CCMVal has established a website where the forc-ings for the simulations can be download-
ed (http://www.pa.op.dlr.de/CCMVal/Forcings/CCMVal_Forcings.html). This web site was developed to serve the needs of the CCM community, and encourage consistency of anthropogenic and natural forcings in future model/model and model/observation inter-comparisons. Any up-dates as well as detailed explanation and further discussion will be placed on this website. In addition to the reference runs, the groups are encouraged to run as many sensitivity simulations as possible. The hope is that these additional runs will be available in time to provide useful input for the anticipated UNEP/WMO Ozone Assessment in 2010, so that the ozone pro-jections from the CCMs can be assessed for different halogen and GHG scenarios, and not just from one scenario as in WMO (2003, 2007).
The proposed simulations will be evaluat-ed as part of the planned SPARC CCMVal Report by 2009 in time for consideration in the anticipated UNEP/WMO Ozone As-sessment in 2010. The SPARC CCMVal report itself has two major aims: 1) pro-vide valuable base material for that assess-ment, and 2) improve the understanding
of the strengths and weaknesses of CCMs and thus increase their integrity and cred-ibility. Regarding mechanisms for model evaluation, a set of standard diagnostics has been agreed at the first CCMVal work-shop (Grainau, Germany, November 2003) and further refined at the second workshop (NCAR, Boulder, USA, October 2005). Output for these standard diagnostics (Eyring et al., 2005) and possible addi-tional diagnostics needed for the individual chapters of the SPARC CCMVal report will be collected in Climate and Forecast (CF) standard compliant netCDF format from all models in the central database at the British Atmospheric Data Centre (BADC). In addition, it is anticipated to obtain obser-vational datasets for the core diagnostics. The specified forcings for the new refer-ence simulations and the new data request will be made available for download at the CCMVal website. The proposed timeline for the SPARC CCMVal report can be found at http://www.pa.op.dlr.de/CCMVal/SPARC_CCMValReport /SPARC_CCMValReport_Timeline.html.
25
53294-1 SPARC.indd 25 12/11/07 10:55:26 AM

Acknowledgements
We wish to thank the CCMVal communi-ty for a lively and fruitful discussion and for the excellent cooperation. Thanks go to Georgiy Stenchikov for providing the pre-calculated aerosol heating rates, Neal Butchart and the UK Met Office for provid-ing observed sea surface temperatures and sea ice concentrations, Larry Thomason and Simone Tilmes for providing observed sulfate aerosol surface area densities, as well as to Tom Conway, Ed Dlugokencky, Jim Elkins, Geoffrey Dutton and Stephen Montzka for supplying CO
2, CH
4 and N
2O
mixing ratios from the NOAA Cooperative Global Air Sampling Network. We also thank Guus Velders and John Daniel for providing surface mixing ratios of ozone depleting substances, Ross Salawitch for helpful discussions regarding bromine, Judith Lean for the specification of the solar cycle, as well as Markus Amann, Andreas Baumgärtner, Christoph Brühl, Peter Rafai, Martin Schultz, David Steven-son, and Michiel van Weele for their help with ozone and aerosol precursor datasets.
References
Collins, W. D. et al., (2006), The Com-munity Climate System Model version 3 (CCSM3), J. Clim., 19, 2122-2143.
Dameris, M. et al., (2005), Long-term changes and variability in a transient simu-lation with a chemistry-climate model em-ploying realistic forcings, Atmos. Chem. Phys., 5, 2121-2145.
Eyring, V. et al., (2005), A strategy for pro-cess-oriented validation of coupled chem-istry-climate models, Bull. Am. Meteorol. Soc., 86, 1117–1133.
Eyring, V. et al., (2006), Assessment of temperature, trace species and ozone in chemistry-climate model simulations of the recent past, J. Geophys. Res., 111, D22308, doi:10.1029/2006JD007327.
Eyring, V. et al., (2007), Multi-model projections of ozone recovery in the 21st century, J. Geophys. Res., 112, D16303, doi:10.1029/2006JD008332.
Giorgetta, M. A., and L. Bengtsson (1999), The potential role of the quasi-biennial os-cillation in the stratosphere-troposphere ex-change as found in water vapor in general
circulation model experiments, J. Geophys. Res., 104, 6003-6020.
Hansen, J. et al., (2002), Climate forcings in Goddard Institute for Space Studies SI2000 simulations, J. Geophys. Res., 107(D18), 4347, doi:10.1029/2001JD001143.
IPCC (Intergovernmental Panel on Climate Change) (2000), Special report on emis-sions scenarios: a special report of Working Group III of the Intergovernmental Panel on Climate Change, 599 pp., Cambridge University Press, Cambridge, U.K.
IPCC (Intergovernmental Panel on Climate Change) (2001), Climate change 2001: The scientific basis. Contribution of Working Group 1 to the Third Assessment Report, J.T. Houghton (Eds.), Cambridge Universi-ty Press, Cambridge, United Kingdom and New York, NY, USA.
Johns, T. C. et al., (2006), The new Hadley Centre climate model HadGEM1: Evalua-tion of coupled simulations, Journal of Cli-mate, 19, 1327-1353.
JPL (Jet Propulsion Laboratory) (2006), Chemical Kinetics and Photochemical Data for Use in Atmospheric Studies. Evaluation 15, JPL Publication No. 06-2, NASA Panel for Data Evaluation, NASA Aeronautics and Space Administration, Pasadena, CA, USA, 73.
Large, W. G. and G. Danabasoglu (2006), Attribution and Impacts of Upper-Ocean Biases in CCSM3. J. Climate, 19, 2325-2346.
Lean, J. L. et al., (2005), SORCE contri-butions to new understanding of global change and solar variability, Solar Phys., 230:27-53.
Meehl G. A. et al., (2007), Summary report: A Strategy for Climate Change Stablization Experiments with AOGCMs and ESMs, WCRP Informal Report N° 3/2007; ICPO Publication N° 112, IGBP Report N° 57.Oldenborgh, G. J. van, et al., (2005), El Niño in a changing climate: a multi-model study, Ocean Sci., 1, 81-95.
Olivier, J. et al., (2005), Recent trends in global greenhouse gas emissions: region-al trends and spatial distribution of key sources, In: “Non-CO2 Greenhouse Gas-es (NCGG-4)”, van Amstel, A. (coord.),
325-330, Millpress, Rotterdam, ISBN 90 5966 043 9.
Rayner, N. A. et al., (2003), Global analy-ses of sea surface temperature, sea ice, and night marine air temperature since the late nineteenth century, J. Geophys. Res., 108, No. D14, 4407 10.1029/2002JD002670.
Sato, M. et al., (1993), Stratospheric aero-sol optical depths, 1850-1990, J. Geophys. Res., 98, 22987-22994.
Schmidt, G. A. et al., (2006), Present-day atmospheric simulations using GISS ModelE: Comparison to in situ, satellite, and reanalysis data, J. Clim., 19, 153-192.
Schultz, M. et al., (2007), Emission data sets and methodologies for estimating emissions (http://retro.enes.org/reports/D1-6_final.pdf), REanalysis of the TRO-pospheric chemical composition over the past 40 years, A long-term global modeling study of tropospheric chemistry funded un-der the 5th EU framework programme, EU-Contract No. EVK2-CT-2002-00170.
SPARC (2006), SPARC Assessment of Stratospheric Aerosol Properties (ASAP), Tech. Rep. WMO-TD No. 1295, WCRP Series Report No. 124, SPARC Report No. 4, Berrieres le Buisson Cedex.
Thomason, L. W. et al., (2007), SAGE II measurements of stratospheric aerosol properties at non-volcanic levels, Atmos. Chem. Phys. Discuss., 7, 6959-6997.
Van Aardenne, J. et al., (2001), A 1 x 1 de-gree resolution dataset of historical anthro-pogenic trace gas emissions for the period 1890-1990. Global Biogeochemical Cycles, 15(4), 909-928.
Van Aardenne, J. et al., (2005), The EDGAR 3.2 Fast Track 2000 dataset (32FT2000), Technical documentation, http://www.mnp.nl/edgar/model/v32ft2000edgar.
World Meteorological Organization (WMO)/United Nations Environment Pro-gramme (UNEP) (2007), Scientific Assess-ment of Ozone Depletion: 2006, World Me-teorological Organization, Global Ozone Research and Monitoring Project, Report No. 50, Geneva, Switzerland.
26
53294-1 SPARC.indd 26 12/11/07 10:55:26 AM

27
Report on the Joint SPARC Workshop on Data Assimilation and International Polar Year (IPY)
4-7 September 2007, Toronto, Canada
S. Polavarapu, Environment Canada, Canada ([email protected])E. Farahani, University of Toronto, Canada ([email protected])G. Manney, Jet Propulsion Laboratories, USA ([email protected])N. McFarlane, SPARC IPO, Canada, ([email protected])T. G. Shepherd, University of Toronto, Canada, ([email protected])
Introduction
The SPARC Data Assimilation Working Group (DAWG) was initiated in 2002 to foster exchange between the data assimila-tion and stratospheric research communi-ties. Data assimilation impinges on many aspects of SPARC goals such as the docu-mentation of the stratosphere and the need to reduce uncertainties in climate models. By confronting models with measurements, model deficiencies can be highlighted. In addition, there is a hope of being able to use the assimilation process to identify free parameters in parameterised processes such as gravity wave drag or deep convec-tion. One of the main vehicles for this ex-change is the annual data assimilation (DA) workshop. These workshops have typi-cally alternated locations between Europe and North America. The 2006 workshop was held in Noordwijk, the Netherlands and a summary of this meeting is found in SPARC Newsletter No. 28. The 2007 workshop was held in Toronto, Canada during 4-7 September.
The themes of the 2007 workshop (which were identified during the 2006 workshop) were: stratosphere-troposphere coupling, the mesosphere (including stratosphere/mesosphere coupling), and International Polar Year (IPY). Data assimilation for large atmospheric models is primarily per-formed at operational weather centres. At operational centres, the value of forecast improvements is often heavily weighted to-ward tropospheric impacts. Thus, the data assimilation community is very interested in better understanding stratosphere-tro-posphere coupling — more specifically, in how improving stratospheric analyses can impact tropospheric forecasts. The second theme was motivated by the fact that op-erational centres such as ECMWF, GMAO
and the UK Met Office are moving their model lids into the mesosphere (at least to 80 km) in order to properly analyse the entire stratosphere. Thus, the assimilation community expressed a desire to better un-derstand the dynamics of the mesosphere in order to improve analyses in that region. Initial experience with extended model do-mains that include the mesosphere is that large analysis increments can be gener-ated in the mesosphere which can lead to model instabilities. Finally, IPY was a nat-ural theme since the SPARC DA Working Group is putting a substantial effort into the collection of global analyses during March 2007 to March 2009 (the IPY period) for the SPARC-IPY project.
Stratosphere-Troposphere coupling
In his overview presentation, A. Scaife used climate models to show that the stratosphere plays an important role in the North Atlantic Oscillation (NAO) sig-nal. He showed that the observed increase in the NAO from the 1960s to 1990s was strongly influenced by changes in the strato-sphere. Because ENSO (El Nino/Southern Oscillation) events frequently weaken the stratospheric polar vortex they can also produce a negative NAO response. The presence of a model stratosphere can there-fore have an influence on seasonal fore-casts. Figure 1 shows that while climate models underestimate blocking frequency, blocking appears to be sensitive to the rep-resentation of the model stratosphere. The troposphere-stratosphere HadAM3 model reproduces the observed maxima in blocking in both the Pacific and Atlantic sectors. M. Baldwin noted that stratosphere-tropo-sphere coupling is evident at high lati-tudes and easily diagnosed using the NAM (Northern Annular Mode) index. A nega-tive NAM index corresponds to a strong
polar vortex while a positive index cor-responds to a weak polar vortex, and the surface signature corresponds to the Arc-tic Oscillation. There is a time delay for the stratospheric signal to propagate to the surface, but the impact can last for months (Baldwin and Dunkerton 2001). The strength of the stratospheric vortex also affects the position of storm tracks, with strong polar vortices being associated with more northern storm tracks. Interestingly, C. Li showed how wintertime stratospheric NAM anomalies were correlated with the summertime Mei-Yu precipitation anoma-ly in east Asia. Since the NAM index is a good indicator of stratosphere-troposphere coupling, it would be interesting to be able to apply it as a standard diagnostic of anal-yses or forecasts. However, it is computa-tionally intensive to compute as it requires daily 3D fields. To that end, M. Baldwin proposed a 1D version of the NAM index and showed that it captured the essence of the 2D NAM index.
The impact of an improved stratosphere on the troposphere was also studied by D. Jackson and C. Mathison (in a presenta-tion given by M. Keil). Specifically, use of EOS-MLS data improved ozone analy-ses which then impacted tropospheric fore-casts. In addition, R. Errico showed that stratospheric singular vectors can be used to identify rapidly growing perturbations. (Singular vectors identify the most rapidly growing perturbations to a given flow for a specified time period and vector norm.) For a 5 day optimisation period and a back-ground flow that develops a stratospheric warming, stratopheric singular vectors were found to be baroclinic, like tropo-spheric ones, but unlike their tropospheric counterparts, nonlocal structures were found. Thus, initial perturbations may be located at some distance horizontally from where their ultimate impact is felt.
53294-1 SPARC.indd 27 12/11/07 10:55:27 AM

The role of assimilation in the UTLS region
Because there simply are not enough ob-servations to define the full state, data assimilation products are a blend of mea-surements and model forecasts. Therefore, it is interesting to understand where the analysis is being determined by the model and where the analysis is being determined by the assimilation. K. Wargan was able to show that ozone assimilation primarily moves the modes of the ozone PDFs by correcting model biases, while the basic structure of the ozone fields is determined by the model. Figure 2 shows a compari-son of model and assimilations to aircraft measurements in the UTLS region. The measurements show a multi-modal struc-
ture since some of the air being sampled is tropospheric (the lower ozone mode) while some is stratospheric (the higher ozone mode). The free-running model correctly represents the existence of the two modes and the overall structure of the PDF, while the assimilation is able to correct the position of the stratospheric mode. (The tropospheric mode is also slightly improved.) Fig-ure 3 shows that the shape of the horizontal spectrum of ozone is similar for both model and as-
similation, with assimilation producing an offset which primarily acts to correct the ozone bias of the model. Again this sug-gests that the horizontal structure of the ozone field in the assimilation is mainly be-ing driven by transport, which is captured by the model. This point was also made by G. Manney in comparisons of ozone mor-phology in the UTLS from the Aura Micro-wave Limb Sounder (MLS) and a number of transport models (both online and of-fline) and assimilation systems (with and without ozone assimilation). Further evi-dence that the horizontal structure of tracer gradients is well defined by model forecasts was found by M. Hegglin, who showed that CMAM-DAS was able to maintain lat-itudinal gradients of N
2O, NO
y and O
3, as
well as transport barriers (when compared to ACE and SPURT aircraft mea-surements), despite using a 3D-Var scheme. (Note that Scheele et al., (2005) found that 4D-Var assimi-
lated winds are better able to preserve lati-tudinal gradients of age-of-air than 3D-Var assimilated winds.) This result points to the benefit of online advection where con-stituents are advected by wind fields which are adjusted every time step (rather than every few hours, as occurs in offline advec-tion with a CTM). This result may seem somewhat surprising since online advection has previously been recommended only for regions where chemistry dominates trans-port in determining species distributions.
The mesosphere
With the recent availability of measure-ments from ACE and EOS-MLS that ex-tend into the mesosphere, the performance of assimilation in the stratopause region can be assessed. G. Manney examined the performance of operational systems such as ECMWF and GEOS-4 and -5 as well as research assimilation systems (CMAM-DAS and NOGAPS-ALPHA) during a prolonged Stratospheric Sudden Warming (SSW) event in early 2006. Figure 4 shows that while the operational systems had dif-ficulty in capturing the timing or the height of the reformation of the stratopause on 1 February 2007, the CMAM-DAS fared bet-ter, even though no mesospheric data was assimilated. The NOGAPS-ALPHA mod-el also did well (except immediately below the model top), but for a different reason — in NOGAPS-ALPHA, SABER and EOS-MLS temperature data were assimilated in the mesosphere. Thus, the higher lid of the CMAM model combined with reasonable mesospheric dynamics may provide a natu-ral boundary condition for stratospheric as-
MOZAIC and analysis at 360K
0.0 0.1 0.2 0.3 0.4 0.5 0.60.000.04
0.08
0.12
Fre
quen
cy
MOZAIC and model at 360K
0.0 0.1 0.2 0.3 0.4 0.5 0.6Ozone mixing ratio (ppmv)
0.000.04
0.08
0.12
Fre
quen
cy
Figure 2: Distribution of ozone within the 360±2.5K isentropic layer in July 2005, 20N-90N from the Measurement of OZone and water vapour by AIrbus in-service airCraft (MOZAIC; Marenco et al 1998) (black), collocated assimila-tion of EOS Aura data (gray), and a control model run with ozone data with-held (blue). A bimodal structure, indicative of the presence of both, tropospheric and stratospheric air, is seen in all three datasets. In this example assimilation corrects model’s biases by changing the (relative) position of the distribution modes. The result uses assimilation of ozone data from EOS Aura’s OMI (total column) and MLS (215 – 0.14 hPa profiles) into NASA’s GEOS-4 Data Assimila-tion System (Stajner et al., 2008). (Figure courtesy of Kris Wargan.)
Longitude
Fre
quen
cy
0.2
0.00 120 240 360
Observations
Strat-trop model
Trop model
Longitude
Fre
quen
cy
0.2
0.00 120 240 360
Observations
Strat-trop model
Trop model
Figure 1: Atmospheric blocking frequency in the Hadley Centre HadAM3 model calcu-lated according to Tibaldi and Molteni (1990) using 500hPa geopotential height. Mod-elled climatological blocking frequency in the standard model (upper panel - gray) and troposphere-stratosphere model (upper panel - black). Blocking climatologies are cal-culated over the 40 year period from 1960 onwards and 3 realisations are shown from each model. Observed blocking frequencies from ERA 40 reanalyses are shown as blue dots. The lower panel is as the upper panel but with the mean background climatologies of the models exchanged. This shows that the model blocking frequency is much higher when the stratosphere is properly represented and that this is due largely to a change in the mean state. Of course these results are for one particular model and may be model dependent. (Courtesy of Adam Scaife, Met Office.)
28
53294-1 SPARC.indd 28 12/11/07 10:55:29 AM

29
lated winds are better able to preserve lati-tudinal gradients of age-of-air than 3D-Var assimilated winds.) This result points to the benefit of online advection where con-stituents are advected by wind fields which are adjusted every time step (rather than every few hours, as occurs in offline advec-tion with a CTM). This result may seem somewhat surprising since online advection has previously been recommended only for regions where chemistry dominates trans-port in determining species distributions.
The mesosphere
With the recent availability of measure-ments from ACE and EOS-MLS that ex-tend into the mesosphere, the performance of assimilation in the stratopause region can be assessed. G. Manney examined the performance of operational systems such as ECMWF and GEOS-4 and -5 as well as research assimilation systems (CMAM-DAS and NOGAPS-ALPHA) during a prolonged Stratospheric Sudden Warming (SSW) event in early 2006. Figure 4 shows that while the operational systems had dif-ficulty in capturing the timing or the height of the reformation of the stratopause on 1 February 2007, the CMAM-DAS fared bet-ter, even though no mesospheric data was assimilated. The NOGAPS-ALPHA mod-el also did well (except immediately below the model top), but for a different reason — in NOGAPS-ALPHA, SABER and EOS-MLS temperature data were assimilated in the mesosphere. Thus, the higher lid of the CMAM model combined with reasonable mesospheric dynamics may provide a natu-ral boundary condition for stratospheric as-
similation. This implies that study of the upper stratosphere requires a model with a very high top, and either a reasonable me-sosphere or assimilation of mesospheric measurements.
An overview of mesospheric dynamics was provided by C. McLandress. In contrast to the lower atmosphere, here tides and gravity waves are important and lead to large and rapid dynamic variability. Thus good representation of the mesosphere requires that a model properly depicts the various tidal modes and supports a realis-tic gravity wave spectrum. Models may also employ gravity-wave drag (GWD) schemes to parameterise the effects of sub-grid scale gravity waves on the mean flow. In the tropics, equatorial wave spectra are largely controlled by convective parame-terisations (Horinouchi et al. 2003). Thus, convection schemes may impact the zonal wind oscillations in the tropics, as well as modelled tides. Issues for assimilation include not only the large variability of the mesosphere, but also sampling issues for sun-synchronous satellite orbits. R. Lieberman found that combining SABER and EOS-MLS measurements could help improve the analysis of the diurnal tides. However, averaging over longer time in-tervals reduces the “added benefit” of the second measurement source. Capturing
tides with assimilation is also complicated by the fact that harmonics of up to four per day contribute to the tidal field, as noted by W. Ward and Z. Chen. V. Yudin re-viewed the problem of generation of biases in the stratosphere and mesosphere due to inconsistent vertical scales in background error vertical correlations and weighting functions or Jacobians for nadir tempera-ture sounders, and suggested the use of a singular vector decomposition of Jacobians to ensure a natural tapering of increments. Yudin also suggested that mesospheric as-similation might proceed through an initial extraction of fast tidal amplitudes followed by zonal mean wind and planetary wave analysis.
Obtaining a good mesospheric analysis may be aided by the upward transfer of information. This notion of the slaving of large-scale aspects of the mesosphere to the lower atmosphere was considered by S. Ren for the case of the 2002 South-ern Hemisphere SSW. Information can be propagated by the model’s GWD scheme, as data assimilation can help define the large scale tropospheric and stratospheric flow which then filters upward propagating wave fluxes. The slaving of fast motions to slow ones was examined with a low-or-der model by L. Neef. When the true state
was unbalanced (as in the mesosphere) and consisted of both time scales of motion, 4D assimilation schemes showed some advan-tage over 3D ones.
The predictability of the mesosphere was also considered by Y. Nezlin who showed that for a perfect model and perfect obser-vations, the propagation of information into the mesosphere can be quantified and that the information is primarily on the largest scales. K. Hoppel also showed that there is some value in performing mesospheric data assimilation. Figure 5 shows that forecasts initialised from an analysis are better than those initialised from climatology, even in the mesosphere. In addition, the forecasts are better whether in the winter or summer hemisphere where the dynamics are very different.
The structure and evolution of the polar vor-tex across the stratopause were described by L. Harvey, who showed the evolution of a diagnostic of the polar vortex edge and an-ticyclones in three dimensions up through ~70 km from GEOS-4/5 analyses and the WACCM GCM during both Arctic and Antarctic winters. Preliminary compari-sons of vortex edge diagnostics and MLS CO along orbit cross-sections showed en-couraging agreement into the mesosphere.
March
4000 1000 400 200Wavelength (km)
10-6
10-5
10-4
10-3
10-2
Pow
er
(ppm
v2 k
m)
a)
Figure 3: One dimensional ozone power spectra computed from 4000 km MOZAIC flight segments (black), collocated assimila-tion of Aura data (gray), and model (blue) in a) March and b) July 2005. The aircraft data were averaged to match the resolution of the model. Steeper decline of model and assimilation spec-tra indicates that they exhibit less small scale variability than MOZAIC data. Note that in July, the assimilation has more variability than the model at all scales; that is consistent with increased difference between the ozone distribution modes shown in Figure 2. (Courtesy of Kris Wargan, GMAO.)
Figure 4: Pressure-time sections at 70N of zonal mean temperature from (top to bottom, left to right) MLS, SABER, GEOS-5, ECMWF, CMAM-DAS and NOGAPS-ALPHA, from 1 January 2006 through 31 March 2006. Overlaid contours on analy-ses panels are 70N zonal mean zonal winds from -60 to 90 m/s by 30 m/s, with easterlies and zero values in black, westerlies in white. NOGAPS-ALPHA run shown here assimilated MLS and SABER temperatures up to 0.01 hPa. CMAM-DAS run assimilates no observations above 1 hPa. (Courtesy of Gloria Manney, JPL.)
100
1 0
1.00
0.100
0.010 0.001
MLS
100
1 0
1.00
0.100
0.010 0.001
Pre
ssur
e / h
Pa
SABER
1 Jan 1 Feb 1 Mar
100
1 0
1.00
0.100
0.010 0.001
GEOS5
203 218 233 248 263
15
30
45
60
7 5
ECMWF
15
30
45
60
7 5
App
roxi
mat
e A
ltitu
de /
k m
CMAM
1 Jan 1 Feb 1 Mar
15
30
45
60
7 5
NOGAPS
203 218 233 248 263 70°N ZM Temperature / K 70°N ZM Temperature / K
53294-1 SPARC.indd 29 12/11/07 10:57:09 AM
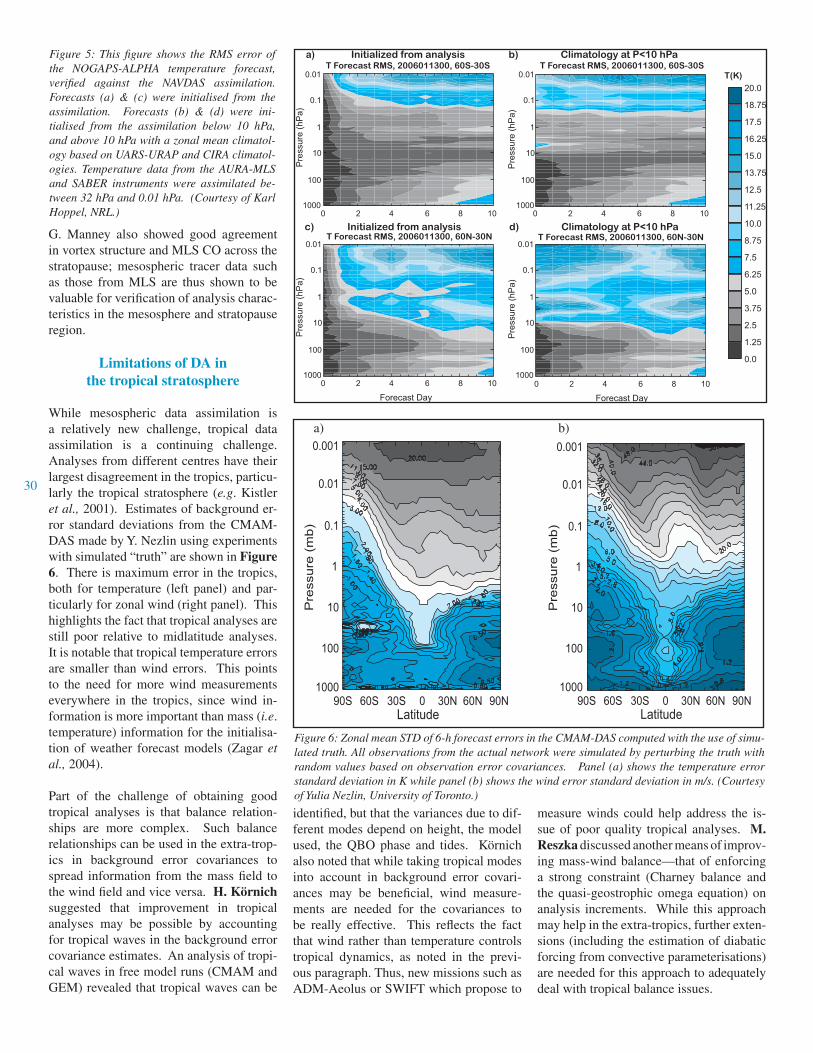
G. Manney also showed good agreement in vortex structure and MLS CO across the stratopause; mesospheric tracer data such as those from MLS are thus shown to be valuable for verification of analysis charac-teristics in the mesosphere and stratopause region.
Limitations of DA in the tropical stratosphere
While mesospheric data assimilation is a relatively new challenge, tropical data assimilation is a continuing challenge. Analyses from different centres have their largest disagreement in the tropics, particu-larly the tropical stratosphere (e.g. Kistler et al., 2001). Estimates of background er-ror standard deviations from the CMAM-DAS made by Y. Nezlin using experiments with simulated “truth” are shown in Figure 6. There is maximum error in the tropics, both for temperature (left panel) and par-ticularly for zonal wind (right panel). This highlights the fact that tropical analyses are still poor relative to midlatitude analyses. It is notable that tropical temperature errors are smaller than wind errors. This points to the need for more wind measurements everywhere in the tropics, since wind in-formation is more important than mass (i.e. temperature) information for the initialisa-tion of weather forecast models (Zagar et al., 2004).
Part of the challenge of obtaining good tropical analyses is that balance relation-ships are more complex. Such balance relationships can be used in the extra-trop-ics in background error covariances to spread information from the mass field to the wind field and vice versa. H. Körnich suggested that improvement in tropical analyses may be possible by accounting for tropical waves in the background error covariance estimates. An analysis of tropi-cal waves in free model runs (CMAM and GEM) revealed that tropical waves can be
identified, but that the variances due to dif-ferent modes depend on height, the model used, the QBO phase and tides. Körnich also noted that while taking tropical modes into account in background error covari-ances may be beneficial, wind measure-ments are needed for the covariances to be really effective. This reflects the fact that wind rather than temperature controls tropical dynamics, as noted in the previ-ous paragraph. Thus, new missions such as ADM-Aeolus or SWIFT which propose to
measure winds could help address the is-sue of poor quality tropical analyses. M. Reszka discussed another means of improv-ing mass-wind balance—that of enforcing a strong constraint (Charney balance and the quasi-geostrophic omega equation) on analysis increments. While this approach may help in the extra-tropics, further exten-sions (including the estimation of diabatic forcing from convective parameterisations) are needed for this approach to adequately deal with tropical balance issues.
T Forecast RMS, 2006011300, 60S-30S T Forecast RMS, 2006011300, 60S-30S
T Forecast RMS, 2006011300, 60N-30N T Forecast RMS, 2006011300, 60N-30N
Pre
ssur
e (h
Pa)
Pre
ssur
e (h
Pa)
Forecast Day Forecast Day
0.01
0.1
1
10
100
1000
0.01
0.1
1
10
100
1000
0.01
0.1
1
10
100
1000
0.01
0.1
1
10
100
1000
0 2 4 6 8 10 0 2 4 6 8 10
0 2 4 6 8 100 2 4 6 8 10
T(K)20.0
18.75
17.5
16.25
15.0
13.75
12.5
11.25
10.0
8.75
7.5
6.25
5.0
3.75
2.5
1.25
0.0
Initialized from analysis Climatology at P<10 hPaa) b)
c) d)
Pre
ssur
e (h
Pa)
Pre
ssur
e (h
Pa)
Initialized from analysis Climatology at P<10 hPa
Figure 5: This figure shows the RMS error of the NOGAPS-ALPHA temperature forecast, verified against the NAVDAS assimilation. Forecasts (a) & (c) were initialised from the assimilation. Forecasts (b) & (d) were ini-tialised from the assimilation below 10 hPa, and above 10 hPa with a zonal mean climatol-ogy based on UARS-URAP and CIRA climatol-ogies. Temperature data from the AURA-MLS and SABER instruments were assimilated be-tween 32 hPa and 0.01 hPa. (Courtesy of Karl Hoppel, NRL.)
a) b)
Pre
ssure
(m
b)
0.001
0.01
0.1
1
10
100
1000
Latitude 60S 90S 30S 0 30N 60N 90N
Pre
ssure
(m
b)
0.001
0.01
0.1
1
10
100
1000
Latitude60S90S 30S 0 30N 60N 90N
Figure 6: Zonal mean STD of 6-h forecast errors in the CMAM-DAS computed with the use of simu-lated truth. All observations from the actual network were simulated by perturbing the truth with random values based on observation error covariances. Panel (a) shows the temperature error standard deviation in K while panel (b) shows the wind error standard deviation in m/s. (Courtesy of Yulia Nezlin, University of Toronto.)
30
53294-1 SPARC.indd 30 12/11/07 10:57:22 AM

31
T Forecast RMS, 2006011300, 60S-30S T Forecast RMS, 2006011300, 60S-30S
T Forecast RMS, 2006011300, 60N-30N T Forecast RMS, 2006011300, 60N-30N
Pre
ssur
e (h
Pa)
Pre
ssur
e (h
Pa)
Forecast Day Forecast Day
0.01
0.1
1
10
100
1000
0.01
0.1
1
10
100
1000
0.01
0.1
1
10
100
1000
0.01
0.1
1
10
100
1000
0 2 4 6 8 10 0 2 4 6 8 10
0 2 4 6 8 100 2 4 6 8 10
T(K)20.0
18.75
17.5
16.25
15.0
13.75
12.5
11.25
10.0
8.75
7.5
6.25
5.0
3.75
2.5
1.25
0.0
Initialized from analysis Climatology at P<10 hPaa) b)
c) d)
Pre
ssur
e (h
Pa)
Pre
ssur
e (h
Pa)
Initialized from analysis Climatology at P<10 hPa
Chemical Data Assimilation
While operational forecast centres are primarily concerned with weather fore-casts, in the future their interests will be much more far reaching. S. Lu noted that NCEP plans to obtain global estimates of the distribution of atmospheric aerosols as well as forecasts of chemical species and of dust. Their plans for aerosol forecast-ing and assimilation, which are motivated by the desire to capture aerosol radiative impacts, were described. As operational weather centres move toward operational environmental forecasts in the future, it is important to determine which feedbacks must be simulated online and which ones can be neglected for computational expedi-ency. For example, should chemical data assimilation be performed online in a GCM or offline with a CTM? With online chem-istry assimilation, species are updated us-ing measurements and then used for input to the radiation scheme to potentially im-prove the dynamical analyses. R. Ménard, using an NWP forecast model (GEM) with full online chemistry, found that the impact of the ozone radiative feedback on temper-ature analyses was not significant if only temperature data was assimilated. How-ever, if both ozone and temperature were assimilated, then the ozone radiative feed-back on temperature was significant. Ozone analyses were significantly improved as was temperature predictability in the lower stratosphere. M. Parrington showed that assimilation of TES ozone profiles had an impact on outgoing longwave radiation in a chemistry climate model (AM2-Chem) which could be as large as 15% compared to the case without ozone assimilation. An ozone climatology was used in the radia-tion calculations so the impact was due to changes in circulation due to the use of as-similated ozone. C. Long showed that by assimilating OMI in addition to SBUV/2 ozone measurements with the NCEP sys-tem, not only was the total ozone analysis improved (as expected), but there was also an impact on tropical forecasts.
As noted earlier in the UTLS section, model forecasts can capture the horizontal structure of constituent distributions. This means that the use of model trajectories in a 4D-Var system could potentially help improve analyses in regions where mea-surements are sparse, such as the tropics. The prospect of improving winds through constituent assimilation in a 4D-Var system
was discussed by J. de Grandpré, who showed an improvement in zonal wind bias in the tropics when assimilating O
3, CH
4
and N2O from MIPAS. However, in the ex-
tra-tropics, species assimilation in 4D-Var had a negative impact on ozone analysis and predictability.
With the recent availability of multiple spe-cies measurements from instruments such as those on ENVISAT, EOS-AURA or ACE, the challenges of assimilating multi-ple species can be tackled. Just as there are mass-wind balances to consider when as-similating dynamic variables, multiple spe-cies assimilation may also need to consider how the adjustment of one species affects another. S. Chabrillat (in a presentation giv-en by Y. Rochon) found that assimilation of a short lived species, NO
2, helps the NO
2
analysis but has a very negative impact on HNO
3 and probably ClONO
2. However, A.
Robichaud noted that assimilation of NO2
alone was able to improve 6-hour forecasts of HNO
3 as well as capture the mesospher-
ic/thermospheric descent of NOx during an
energetic particle precipitation event. Data assimilation can ideally provide feed-back on the quality of not only the models but also the observing system. F. Baier, us-ing some observing system simulation ex-periments, found that a better distribution of ozone sondes was preferable to more fre-quent observations at existing locations. S. Chabrillat (presented by Y. Rochon) found that MIPAS-IMK assimilations generally compared better to independent measure-ments than MIPAS-ESA assimilations. J. Schwinger showed that assimilation can be used to validate one sensor by assimilating a second one with good spatial coverage. The example of MIPAS ozone assimilation for HALOE validation was used. This type of cross-validation requires that assump-tions made in the assimilation process re-garding the validity of specified biases and covariances be checked first. The payoff is that coincidence of different sensors is no longer an issue since analyses are globally defined.
IPY – International Polar Year
The objective of the SPARC-IPY project is to obtain a description of the two polar vortices (in terms of dynamics, chemistry and microphysics) during the March 2007 to March 2009 period. There is special em-phasis on the coupling of the stratosphere
and mesosphere as well as the stratosphere and troposphere. To achieve this goal, SPARC will acquire and archive measure-ments and assimilation products during the IPY period. The current contents of the archive of assimilation products include analyses from ECMWF, NCEP, Met Office and GMAO. The archive will also include analyses from CMAM-DAS and GEM-BACH as well as KNMI ozone analyses. This archive, recently described in SPARC newsletter no. 29, was set up and monitored by D. Pendlebury. The web interface for data access will be hosted by the SPARC data centre website.
An important feature of Arctic polar dy-namics is Stratospheric Sudden Warmings (SSWs). M. Baldwin explained their im-pact on tropospheric weather, and S. Ren and K. Hoppel considered their vertical coupling with the mesosphere in assimi-lation experiments. Also L. Harvey and G. Manney showed aspects of changes in the mesospheric flow during SSWs in operational analyses and satellite data. T. Chshyolkova noted that while analyses are very useful for diagnosing and under-standing the dynamics of polar vortices, vertical extension of operational products is needed to better understand the coupling of the stratosphere and mesosphere during these events. Another area where assimila-tion needs improvement is in the depiction of polar ozone depletion. C. Benson noted that large AIRS observation-minus-forecast residuals are often associated with the pres-ence of PSCs as observed by POAM III.
An important science question concerning the Arctic stratosphere is how chemical constituents change and how this relates to dynamics. K. Strong provided an over-view talk on several instruments at PEARL (Polar Environment Atmospheric Research Laboratory, 80oN, 86oW) and their mea-surements of stratospheric long-lived and short-lived constituents including HF, O
3,
NO2, HNO
3, and HCl. She noted the impor-
tance of the geographic distribution of at-mospheric samplings relative to the obser-vations site and showed once this factor is taken into account the agreement on ozone measured by different ground-based instru-ments and ACE FTS improved. Three post-er presentations highlighted stratospheric observations at PEARL. R. Batchelor showed HF, HCl column measurements by a new Bruker-IFS at PEARL in which low values of HF reflects descent inside the
53294-1 SPARC.indd 31 12/11/07 10:57:24 AM

polar vortex while decrease in HCl column amounts suggest conversion to active chlo-rine which results in O3 chemical deple-tion. A. Fraser focused on observations by a UV-Visible spectrometer at PEARL and showed slant column densities of O
3, NO
2,
BrO and OClO and their comparison with ACE FTS and MAESTRO measurements during the past three ACE Arctic valida-tion campaigns. The total ground-based columns are expected to agree with satel-lite measurements within error for ozone and within ~15% for NO
2. W. Ward stud-
ied the wave environment in Arctic region and the coupling of the dynamics between atmospheric layers and locations. On his wavelet spectra plot meteor radar wind sig-natures over PEARL show a strong diurnal signature whereas this signature was absent in Saskatoon data.
In her ACE satellite mission overview talk, K. Walker presented the ozone evolution mapped by ACE FTS during winter/spring 2005 and their comparison to MLS and SAGEIII. Also a first global picture of phosgene (COCl
2), the product of chloro-
carbon decomposition, measured by ACE FTS was presented.
R. Collins’ presentation demonstrated that high-resolution temperature data from a network of Arctic lidar observatories can aid in the study of the coupled tropospheric, stratospheric and mesospheric circulation. A statistically significant long-term cool-ing of the middle atmosphere over the past 19 years at Haute Provence was shown. Also several prototype studies on vortex and anticyclone interactions manifested in temperature fields were presented together with observations of zonal wind reversal in the zonal mean during stratospheric warm-ing events. These studies will be continued during the IPY. Also looking at temperature data, Y. Cho showed that the UKMO as-similated data indicates the negative rela-tionship between the lower stratosphere and stratopause temperature. The relationship between the lower-upper stratosphere and MLT region temperature also can be seen in the SABER satellite measurements.
As part of the IPY project the SPARC Data Center also hosts polar observational data sets in addition to the above-mentioned analyses products. Based on the discussion in the IPY session, the data archive was de-cided to be a hybrid of a web portal and an online library which will serve both as a
home to observational data with no current permanent archive and as an archive for monthly mean data sets which are mature (e.g. radar and lidar observations). There were also discussions concerning logistical issues regarding providing data with high temporal resolution for specific period. Data providers are responsible for includ-ing meta data statements while a medium-level quality control is done by SPARC scientific data managers. Also the possi-bility of organising a second SPARC-IPY workshop in the Arctic circle with focus on status of current polar observations was proposed. Finally, the development of an outreach programme in collaboration with other related IPY activities such as IASOA was discussed.
NRT availability of research satellite measurements
N. Livesey and A. Lambert (presented by G. Manney) discussed plans for near real time (NRT) availability of EOS-MLS data. Data assimilators in the audience showed considerable interest in NRT data access. The question of why NRT data provision was not considered at an earlier stage in the life of the satellite mission was also raised, in view of the demand for MLS data. This is an emerging issue with all research sat-ellite missions, as data assimilation cen-tres are increasingly showing an appetite to assimilate research satellite products including species measurements. While these products are still useful after the fact for validation, their use is enormously en-hanced if they are available in NRT in order to be used in the operational cycles. Fur-thermore, this offers tremendous benefits to the measurement team, as the statistical analysis inherent in ongoing assimilation is one of the most effective ways of identify-ing changes in measurement characteris-tics. Unfortunately, this opportunity tends to fall between the cracks, as the space agencies do not consider NRT availability as part of their mandate for research satel-lites. Yet the additional cost involved is a relatively small fraction of the overall cost of the mission, so this is a lost opportunity for atmospheric science. SPARC needs to work as an advocate of the principle that NRT availability should be a basic require-ment of all research satellite products.
Next meeting
There will be no SPARC-DA workshop in
2008. Instead all participants are encour-aged to attend the SPARC General Assem-bly to be held in Bologna, Italy during 31 August to 5 September 2008. The next SPARC-DA workshop will be held in 2009, most likely in the fall.
Acknowledgements
We are grateful to the Fields Institute for the use of their facilities and for their cre-ation of the workshop website. All pre-sentations are viewable (with sound) at http://www.fields.utoronto.ca/programs/scientific/07-08/data_assim/. Environ-ment Canada provided substantial funding. WCRP and the SPARC International Proj-ect Office provided travel support for some participants.
K. Wargan acknowledges, for their strong support, the European Commission, Air-bus and the Airlines (Lufthansa, Austrian, Air France) who carry, free of charge the MOZAIC equipment and perform the maintenance since 1994. MOZAIC is sup-ported by INSU-CNRS (Institut National des Sciences de l’Univers - Centre National de la Recherche Scientifique, France), Mé-téo-France, and FZJ (Forschungszentrum Jülich, Germany).
Work at the Jet Propulsion Laboratory, Cal-ifornia Institute of Technology was done under contract with the National Aeronau-tics and Space Administration.
References
Baldwin, M.P. and T. J. Dunkerton, 2001: Stratospheric Harbingers of Anomalous Weather Regimes, Science, 294 (5542), 581-584. DOI: 10.1126/science.1063315.
Horinouchi, T., S. Pawson, K. Shibata, U. Langematz, E. Manzini, M.A. Giorgetta, F. Sassi, R.J. Wilson, K. Hamilton, J. de-Grandpre, A.A. Scaife, 2003: Tropical co-mulus convection and upward-propagat-ing waves in Middle-Atmospheric GCMs, Journal of the Atmospheric Sciences 60 (22), 2765-2782.
Kistler, R., E. Kalnay, W. Collins, S. Saha, G. White, J. Woollen, M. Chelliah, W. Ebisuzaki, M. Kanamitsu, V. Kousky, H. van den Dool, R. Jenne, and M. Fiori-no, 2001: The NCEP–NCAR 50–Year Re-analysis: Monthly Means CD–ROM and Documentation. Bulletin of the American
Meteorological Society, 82, 247–267. DOI: 10.1175/1520-0477(2001)082.
Marenco, A., V. Thouret, P. Nédélec, H. Smit, M. Helten, D. Kley, F. Karcher, P. Simon, K. Law, J. Pyle, G. Poschmann, R. Von Wrede, C. Hume, T. Cook,. 1998: Measurement of ozone and water vapor by Airbus in-service aircraft: The MO-ZAIC airborne program, An overview, J. Geophys. Res., 103(D19), 25,631–25,642. (98JD00977)
Stajner, I., K. Wargan, S. Pawson, H. Hayashi, L.-P. Chang, R. C. Hudman,
32
53294-1 SPARC.indd 32 12/11/07 10:57:24 AM

2008. Instead all participants are encour-aged to attend the SPARC General Assem-bly to be held in Bologna, Italy during 31 August to 5 September 2008. The next SPARC-DA workshop will be held in 2009, most likely in the fall.
Acknowledgements
We are grateful to the Fields Institute for the use of their facilities and for their cre-ation of the workshop website. All pre-sentations are viewable (with sound) at http://www.fields.utoronto.ca/programs/scientific/07-08/data_assim/. Environ-ment Canada provided substantial funding. WCRP and the SPARC International Proj-ect Office provided travel support for some participants.
K. Wargan acknowledges, for their strong support, the European Commission, Air-bus and the Airlines (Lufthansa, Austrian, Air France) who carry, free of charge the MOZAIC equipment and perform the maintenance since 1994. MOZAIC is sup-ported by INSU-CNRS (Institut National des Sciences de l’Univers - Centre National de la Recherche Scientifique, France), Mé-téo-France, and FZJ (Forschungszentrum Jülich, Germany).
Work at the Jet Propulsion Laboratory, Cal-ifornia Institute of Technology was done under contract with the National Aeronau-tics and Space Administration.
References
Baldwin, M.P. and T. J. Dunkerton, 2001: Stratospheric Harbingers of Anomalous Weather Regimes, Science, 294 (5542), 581-584. DOI: 10.1126/science.1063315.
Horinouchi, T., S. Pawson, K. Shibata, U. Langematz, E. Manzini, M.A. Giorgetta, F. Sassi, R.J. Wilson, K. Hamilton, J. de-Grandpre, A.A. Scaife, 2003: Tropical co-mulus convection and upward-propagat-ing waves in Middle-Atmospheric GCMs, Journal of the Atmospheric Sciences 60 (22), 2765-2782.
Kistler, R., E. Kalnay, W. Collins, S. Saha, G. White, J. Woollen, M. Chelliah, W. Ebisuzaki, M. Kanamitsu, V. Kousky, H. van den Dool, R. Jenne, and M. Fiori-no, 2001: The NCEP–NCAR 50–Year Re-analysis: Monthly Means CD–ROM and Documentation. Bulletin of the American
33
Meteorological Society, 82, 247–267. DOI: 10.1175/1520-0477(2001)082.
Marenco, A., V. Thouret, P. Nédélec, H. Smit, M. Helten, D. Kley, F. Karcher, P. Simon, K. Law, J. Pyle, G. Poschmann, R. Von Wrede, C. Hume, T. Cook,. 1998: Measurement of ozone and water vapor by Airbus in-service aircraft: The MO-ZAIC airborne program, An overview, J. Geophys. Res., 103(D19), 25,631–25,642. (98JD00977)
Stajner, I., K. Wargan, S. Pawson, H. Hayashi, L.-P. Chang, R. C. Hudman,
L. Froidevaux, N. Livesey, P. F. Levelt, A. M. Thompson, D. W. Tarasick, R. Stübi, S. B. Andersen, M. Yela, G. König-Langlo, F. J. Schmidlin, and J. C. Witte (2008), As-similated Ozone from EOS-Aura: Evalu-ation of the Tropopause Region and Tro-pospheric Columns, J. Geophys. Res., submitted.
Scheele, M.P., P.C. Siegmund, P.F.J. van Velthoven, 2005: Stratospheric age of air computed with trajectories based on various 3D-Var and 4D-Var data sets. Atmospheric Chemistry and Physics, 5, 1-7.
Tibaldi, S and F. Molteni, 1990: On the op-erational predictability of blocking, Tellus A, 42, p.343.
Zagar, N., 2004: Assimilation of Equatorial Waves by Line-of-Sight Wind Observa-tions. J. Atmos. Sci. 61, 1877-1893.
Report on the Regional SPARC Science Workshop
17-18 September 2007, Bremen, Germany
B.-M. Sinnhuber, Institute of Environmental Physics, University of Bremen ([email protected])C. von Savigny, Institute of Environmental Physics, University of Bremen ([email protected])J. Burrows, Institute of Environmental Physics, University of Bremen ([email protected])
A two-day workshop on SPARC related activities in Germany and near-by Europe took place in Bremen, Germany from 17 to 18 September 2007, back-to-back with the SSG meeting. The idea was to foster regional collaborations in SPARC related research. The concept was well received, and at a following discussion with the SSG it was suggested that this idea of regional meetings might be expanded, although it was realised that this would not work equally well in different parts of the world. The workshop consisted of a series of invited and
contributed talks, loosely arranged according to the three SPARC Initiatives.
Session 1: Chemistry Climate Interactions including TTL
Cornelius Schiller presented airborne measurements of total water in the tropical tropopause layer (TTL) from three tropi-cal missions in Brazil (TROCCINOX), Australia (SCOUT-O3) and West Africa (AMMA/SCOUT-O3). During all three experiments, convection penetrating the tropopause and moistening the stratosphere up to 420 K was observed. However, extrapolation of these events does not imply a major impact on the stratospheric water vapour budget. Although the averaged H
2O
abundances and relative humidities at the
cold point varied substantially for the dif-ferent campaigns, depending on season and geographical locaion, the observed mixing ratios were all consistent with recent satu-ration history (i.e. over the preceeding 10 days) as demonstrated in a backward tra-jectory analysis.
Michael Volk presented recent in situ ob-servations with the Geophysica aircraft to identify key transport processess in the TTL. A large amount of in situ trace gas ob-servations in the TTL and the lower strato-sphere (up to 20 km) has been obtained during recent deployments of the Geophys-ica over Brazil (TROCCINOX), the Mari-
time Continent (SOCUT-O3) and West Af-rica (AMMA/SCOUT-O3). Measurements were made by the University of Frankfurt’s High Altitude Gas Analyzer (HAGAR) (long-lived tracers N
2O, CH
4, CO
2, H
2,
F12, F11, H-1211, SF6), the Cryogenically
Operated Laser Diode (COLD) (CO), and the Fast Ozone ANalyzer (FOZAN) (O
3).
The three campaigns comprise over 30 tropical flights, and include flights aimed at improving our understanding of large-scale transport, and flights aimed at investigating the impact of mesoscale convective system (under both continental and marine condi-tions) on the tropical upper troposphere/lower stratosphere (UTLS). Measurements
53294-1 SPARC.indd 33 12/11/07 10:57:24 AM

were used to i) contrast observations of the background TTL and convectively influ-enced air, ii) diagnose irreversible mixing of convectively overshooting air with the background TTL, iii) detect isentropic mix-ing across the subtropical tropopause and the subtropical transport barrier, and iv) to assess slow up-welling in the TTL and the lower stratosphere.
To study the composition of air entering the stratosphere, Paul Konopka present-ed multi-annual simulations (2001-2006) with the Chemical Lagrangian Model of the Stratosphere (CLaMS). In addition to the convective and radiative transport, the composition of air within the TTL is strongly influenced by mixing on a time scale of weeks or even months. Based on the CLaMS transport studies, in which mixing can be completely switched off, it was deduced that vertical mixing, driven mainly by the vertical shear in the tropical flanks of the subtropical jets and, to some extent in the outflow regions of the large-scale convection, offers an explanation for the upward transport of trace species from the main convective outflow layer, around 350 K, up to 380 K. Furthermore, the sea-sonal dependence of the composition of the TTL is controlled by the isentropic mixing across the subtropical jets with a strong in-fluence of the Asian monsoon during the boreal summer.
Kirstin Krüger showed results from a La-grangian study using diabatic heating rates to calculate vertical ascent of the mass transport through the TTL, instead of verti-cal winds from assimilation systems, which tend to be too strong and very noisy. With this alternative method, much slower and more realistic diabatic ascent rates in the upper part of the TTL were obtained, in contrast to previous published results. The mean residence time was determined to be approximately 40 days for the 360 to 380 K layer during the NH winter 2000/2001.
Klaus Pfeilsticker reported on the contri-bution of very short-lived species (VSLS) to the burden of stratospheric halogen as inferred from recent balloon soundings in the TTL and UTLS over north eastern Brazil. For all three halogens potentially relevant for stratospheric ozone (chlorine, bromine, iodine), the quasi-simultaneous detection of VSL organic and inorganic halogens species across the TTL reveals the following contributions to their total
stratospheric budgets: for chlorine 100 – 150 ppt or 3-4 %, for bromine 4.0 ± 2.5 ppt or 20 % and for iodine < 0.3 ppt. These results are in reasonably good agreement with the respective assessments provided by the recent UNEP WMO (2007) report. With respect to present errors in assessing such budgets, the detection of any change in the influx of VSLS into the stratosphere due to climate change is likely to require a decade-long monitoring of the tropical UTLS by modern high-precision measure-ment techniques.
Peter Hoor presented an analysis of trans-port pathways and time scales in the low-ermost stratosphere using the relationship between N
2O and CO
2, which is interpreted
as mixing lines between tropospheric and stratospheric air. The CO
2 intercept of the
CO2-N
2O relation in the lower stratosphere
evaluated for N2O at the tropical tropo-
pause can be regarded as the CO2 mixing
ratio at the tropical tropopause, when the air was mixed into the stratosphere. The relation between this CO
2-mixing ratio
and the well known tropospheric seasonal CO
2 cycle provides information on the time
elapsed since last contact with the tropo-pause. Whereas mean age describes only the mean of a transit time distribution, the new method helps to constrain the younger part of the age spectrum, and therefore the range of very short-lived compounds that can enter the stratosphere.
Session 2: Detection, Attribution and Prediction of Stratospheric Change
Wolfgang Steinbrecht discussed the evo-lution of ozone in recent years. In the up-per stratosphere (around 40 km) lidar and microwave measurements from various stations of the Network for the Detec-tion of Atmospheric Composition Change (NDACC), as well as satellite data, indi-cate that the ozone decline of the 1980s and 1990s has not continued after 2000. At all NDACC stations outside polar regions, upper stratospheric ozone has in fact been increasing in recent years. This is attrib-uted to the decline of stratospheric chlo-rine, and indicates success of the Montreal Protocol. At more northern stations, the recent increase is modulated substantially by temperature variations. While this ef-fect is expected to continue in the future, evidence for the beginning of ozone recov-ery can be seen in the upper stratosphere. However, the same cannot be said for total
global ozone. Several factors have contrib-uted substantially (on the order of 5 to 15 DU) to the higher ozone columns observed in recent years at northern mid-latitudes, e.g. above Hohenpeissenberg: the slow re-moval of stratospheric aerosol in the years after the 1991 Pinatubo eruption, the de-cline in the winter North-Atlantic-Oscilla-tion Index after its peak around 1990, and the recent solar maximum. Compared to these factors, the expected ozone recovery due to chlorine turnaround is much smaller (only about 2 DU), and currently cannot be identified with statistical significance.
Gabi Stiller presented calculations of stratospheric age-of-air diagnosed from MIPAS/ENVISAT observations of SF
6.
The global data set of the mean age of stratospheric air was derived from MIPAS SF
6 observations, covering the pe-
riod September 2002 to March 2004. This data set demonstrates high seasonal and interannual variability of the stratospheric mean age in middle and high latitudes as well as inter-hemispheric differences; fre-quent intrusions of mesospheric air into the polar winter vortices during all polar win-ters are observed. The data set will be used to validate CCMs and GCMs and there are plans to be extend it for the complete MI-PAS mission lifetime.
Mark Weber talked about the role of the Brewer-Dobson (BD) circulation and solar activity on stratospheric ozone. Using SCIAMACHY and GOME data up to 2007, he showed an update from the last WMO ozone assessment on the com-pact relationship between the strength of the BD circulation (here expressed by the integrated absolute winter eddy heat flux) and the spring-to-fall ratio of total ozone confirming the close coupling of dynam-ics and polar chemistry in the interannual variability of polar ozone. The time series of the monthly mean absolute eddy heat flux added from both hemispheres show a clear step-like rise that correlates with the drop in tropical lower stratospheric water vapour after 2000 observed by SAGE and HALOE up to 2005. Both the 11-year so-lar cycle and the enhancement of the BD circulation are main drivers for the rather rapid increase in NH total ozone after the middle 1990s, as derived from a regression analysis of 27 years of SBUV total ozone data.
Markus Rex analysed the impact of re-
34
53294-1 SPARC.indd 34 12/11/07 10:57:25 AM

cently published new laboratory measure-ments of the absorption cross sections of ClOOCl on our understanding of polar stratospheric chlorine and ozone chemistry. He presented comparisons between model calculations and in situ measurements of ClO, ClOOCl and ozone loss rates and concluded that if the new cross sections are correct, a fundamental lack of understand-ing of stratospheric chlorine chemistry lim-its our understanding of observed ozone loss rates, and that there must exist an un-known process that leads to the breakdown of ClOOCl in the stratosphere and accounts for most of the observed ozone loss.
Session 3: Stratosphere-Troposphere Dynamical Coupling
The introduction to this session was given in an invited overview talk on strato-sphere-troposphere dynamical coupling by Mark Baldwin. The talk presented re-cent evidence for the impact of the strato-sphere on weather and climate at the Earth’s surface. For example, springtime strato-spheric ozone loss in the Southern Hemi-sphere (SH) has driven changes in surface climate over Antarctica. In the Northern Hemisphere (NH), circulation changes in the lower stratosphere during winter pre-cede similar changes at the surface with substantial changes to surface weather and the likelihood of extreme weather events. The mechanisms for the coupling between stratosphere and troposphere are not well understood at present. Predicting how the stratosphere will affect climate change will require coupled chemistry climate models. Ideas were presented on how the fidelity of current models, with respect to strato-sphere-troposphere coupling, could be tested.
Dieter Peters discussed the impact of zonally asymmetric ozone anomalies on stratospheric temperatures, the strength of the polar vortex and planetary wave propa-gation. For NH winter, decadal means of the zonally asymmetric ozone components are derived from ERA-40 and used in MAECHAM5 to investigate their effects on temperature and planetary wave propa-gation in the troposphere, stratosphere and lower mesosphere. The analysed strato-spheric ozone from ERA-40 shows a strong increase in wave 1 structure during the last decades, with amplitudes of about 10% of
the zonal mean ozone during the 1990’s. Based on model calculations, it was found that the related radiation perturbations in-duce significant changes in temperature, increasing with height due to an increase in amplitude and shift in phase of wave 1, i.e. a shift of the polar vortex further from the pole. Furthermore, the accompanying changes in the three-dimensional wave activity flux vector reveal that regions of strong vertically propagating wave trains become much weaker over the Asian/North Pacific region and much stronger over the North America/North Atlantic region. This suggests that the decadal change in zonally asymmetric ozone may have contributed largely to observed temperature trends in the stratosphere and lower mesosphere by efficiently altering the balance between large-scale dynamics and planetary wave propagation.
Björn-Martin Sinnhuber presented obser-vational evidence of a correlation between stratospheric ozone anomalies at high lati-tudes in summer and autumn with total ozone anomalies in the following spring. Not only is springtime total ozone corre-lated with mid-stratospheric ozone several months before, but there exists a statisti-cally significant correlation between ozone anomalies in autumn and the wave activ-ity as expressed by the Eliassen-Palm flux during mid-winter. This unexpected find-ing raises the question of what controls the interannual variability of Arctic total ozone in spring, and at the same time offers an ap-proach from predicting total ozone several months in advance. It is currently still un-clear what the underlying mechanisms for this observed correlation are.
Peter Preusse discussed global gravity wave modelling constrained by satellite measurements. A typical annual cycle of gravity wave temperature amplitudes re-trieved from infrared emission limb sound-ing measurements by SABER has been compared to global ray tracing simulations of gravity waves based on a homogeneous and isotropic source at 5 km altitude tuned to match the zonal mean distributions in July. Salient features of global maps for the various seasons, as well as the overall annual cycle are matched, though some structures due to localised wave forcing are missing. In contrast to the assump-tion generally made in gravity wave para-
merisation schemes, even average gravity wave propagation can exceed 20 degrees in latitude. The simulations will also be used to test whether horizontal refraction is an important process for gravity wave-mean flow interaction.
Thomas Reddmann presented simulations with the 3D model KASIMA using NO
x
enhancements in the lower mesosphere derived from observations from MIPAS. Covering the period from mid 2002 to early 2004, these observations represent one of the most complete data sets, and include the strong solar proton event in fall 2003 and intrusions connected to auroral activ-ity during the Arctic and Antarctic winters. The comparison of the disturbed run with a control run reveals persistent reduction of ozone concentration for several months in the middle stratosphere but which is re-stricted to high latitudes. By including ion cluster chemistry in the model, the HNO
3
build-up observed in the upper stratosphere by MIPAS/ENVISAT in Antarctic winter 2003 and the subsequent Arctic winter can be reproduced qualitatively.
Katja Matthes reported on solar cycle studies at the Freie Universität Berlin. Model simulations with two GCMs, MAE-CHAM5-Messy and WACCM, show re-sults comparable to observational estimates in the annual mean as well as during NH winter. During solar maximum, higher temperatures exist in the tropical upper stratosphere that lead to dynamical changes throughout the atmosphere. Certain aspects of the observed modulation of the polar night jet and the BD circulation, as well as the dependence of the solar signal on the phase of the QBO, can be reproduced in the simulations, e.g. a significant positive AO signal during NH winter in the stratosphere and troposphere.
35
53294-1 SPARC.indd 35 12/11/07 10:57:25 AM

Director: N. McFarlane Project Scientist: D. Pendlebury Manager: V. De Luca
SPARC IPO Department of Physics University of Toronto, 60 St. George St. Toronto, ON M5S 1A7 - Canada Tel: (1) 416 946 7543 Fax: (1) 416 946 0513 Email: [email protected] http://www.atmosp.physics.utoronto. ca/ SPARC/
Co-ChairsT. Peter (Switzerland)T.G. Shepherd (Canada) SSG Members (2008)
G. Bodeker (New Zealand)J.P. Burrows (Germany)P. Canziani (Argentina)P.C.S. Devara (India)D. Fahey (USA)D. Hartmann (USA)S. Hayashida (Japan)P. H. Haynes (UK)E. Manzini (Italy)A.M. Thompson (USA)V. Yushkov (Russia)
Ex-Officio MembersCOSPAR: J. Gille (USA)IGAC: D. Parrish (USA), K. Law (France)NDSC: M. Kurylo (USA) SCOSTEP: M. Geller (USA) WMO/GAW: G.O. Braathen (Switzerland)
SPARC Scientific Steering Group
JPS/WCRP: V. Ryabinin (Switzerland)
Composition of the SPARC Office
Liason with WCRP
200826-28 March: DynVar Planning and Gravity Waves workshops, Toronto, Canada, http://www.sparcdynvar.org/
13-18 April: European Geosciences Union General Assembly 2008, Vienna, Austria, http://meetings.copernicus.org/egu2008/
17-23 May: The Canadian-SPARC Project organizes the Summer School on “Dynamics, long-term memory, and trends in the climate system”, Banff, Canada, http://www.atmosp.physics.utoronto.ca/C-SPARC/SummerSchool08.html
29 June-5 July: Quadrennial Ozone Symposium, Tromsoe, Norway
13-20 July 37th Scientific Assembly of the Committee on Space Research and Associated Events - COSPAR 2008“50th Anniversary Assembly”, Montreal, Canada, http://www.cospar2008.org/ or http://www.cospar-assembly.org
31 August-5 September
SPARC 4th General Assembly, Bologna, Italy, http://www.cmcc.it:8080/web/public/sparc-ga2008See announcement on page number 9
7-12 September: 10th IGAC 2008 Conference Bridging the Scales in Atmospheric Chemistry: Local to Global Annecy-le-Vieux, France, http://www.igacfrance2008.fr/
Design and Layout: V. De Luca Editing: D. Pendlebury, P. Huck,V. De Luca Printed and bound by: Thistle Printing Limited - Canada ISSN 1245-4680
Future SPARC and SPARC-related Meetings
Edited and Produced by the SPARC IPO
36
Climate-Chemistry Interactions: T. Peter (Switzerland), A. R. Ravishankara (USA)
Stratosphere-Troposphere Dynamical Coupling: M. Baldwin (USA), S. Yoden (Japan)
Detection, Attribution, and Prediction of Strato-spheric Change: W. Randel (USA), T.G. Shepherd (Canada)
Gravity Waves: J. Alexander (USA)
Data Assimilation: S. Polavarapu (Canada)
CCM Validation: V. Eyring (Germany), A. Gettel-man (USA), N. Harris (UK), S. Pawson (USA), T. G. Shepherd (Canada)
Laboatory Studies joint with IGAC: A.R. Ravishankara (USA), R. A. Cox (IGAC)
Solar Influences for SPARC (SOLARIS): M. Geller (USA), K. Kodera (japan), K. Matthes (Germany)
Dynamical Varialibility Activity: P. Kushner (Canada)
UTLS/SPARC Tropopause Initiative: P. Haynes (UK), A. Gettelman (USA), M. Geller (USA)
Themes and Group Leaders
53294-1 SPARC.indd 36 12/11/07 10:57:26 AM