s n a p s h o t final chapter - california health care ... n a p s h o t final chapter:...
TRANSCRIPT

s n a p s h o t
Final Chapter: Californians’ Attitudes and Experiences with Death and Dying
February 2012

©2012 California healthCare foundation 2
Death and Dying in California
c o n t e n t s
Overview . . . . . . . . . . . . . . . . . . . . . . . 3
By Race/Ethnicity . . . . . . . . . . . . . . . . 5
End-of-Life Concerns . . . . . . . . . . . . . . 8
By Location . . . . . . . . . . . . . . . . . . . . 12
Hospital Care . . . . . . . . . . . . . . . . . . . . 14
Communicating End-of-Life Wishes . . 19
End-of-Life Experiences . . . . . . . . . . . 27
Authors . . . . . . . . . . . . . . . . . . . . . . . . 31
Methodology . . . . . . . . . . . . . . . . . . . . 31
IntroductionA large majority of Californians say they would prefer a natural death if they became severely ill, rather than have
all possible care provided . They would prefer to die at home instead of a hospital or nursing home . And they want
to talk with their doctor about their wishes for care at the end of their lives . However, Californians don’t always get
what they want, as this research shows . The snapshot combines publicly available data with new research that
explores people’s experiences around the death of a loved one and their own preferences for end-of-life care .
highlights include:
•Californians say the most important factors at the end of their life are making sure their family is not
burdened financially by the costs of care (67% say this is extremely important) and being comfortable and
without pain (66%) .
•Top concerns vary by race/ethnicity . For example, Latinos rate living as long as possible (56%) more
highly than do other groups .
•Two-thirds of Californians say they would prefer a natural death if they were severely ill, while only 7% say
they would want all possible care to prolong life .
•Sixty percent say that making sure their family is not burdened by tough decisions about their care is
“extremely important .” However, 56% of Californians have not communicated their end-of-life wishes to
the loved one they would want making decisions on their behalf .
•While a large majority of Californians (82%) say it is important to have end-of-life wishes in writing, only
23% say they have done so .
•Almost 80% say they definitely or probably would like to talk with a doctor about end-of-life wishes, but
only 7% have had a doctor speak with them about it . Over 80% think it would be a very or somewhat
good idea for doctors to be paid for such discussions .
•Seventy percent of Californians say they would prefer to die at home . However, of deaths in California in
2009, 32% occurred at home, 42% in a hospital, and 18% in a nursing home .
•Compared to the nation as a whole, California is trending toward providing more inpatient care and more
intensive care in the last six months of life .
•Lack of insurance and language barriers strongly influence Californians’ perceptions about whether a
recently deceased loved one received excellent or very good care .

©2012 California healthCare foundation 3
0
100
200
300
400
500
600
700
200920052000199519901985198019751970
362,652
166,382
130,000
611,666608,366
526,774
231,764
Deaths Births Age 85+HundREdS OF THOuSAndS
overviewDeath and Dying in California
Sources: State of California, Department of Public Health, Birth, Death, Fetal Deaths, and Infant Deaths by Age, Table 1-2, 2006 – 2009. California Counts: Population Trends and Profiles, Vol. 2 No. 2, November 2000, Public Policy Institute of California. California Department of Finance, Race/Ethnic Population with Age and Sex Detail, prepared by California Department of Health Services, EPIC Branch, November 30, 2011.
Births, Deaths, and Population Age 85+, california, 1970 to 2009, selected years
California’s 85+ population
is growing quickly and
has more than quadrupled
over the last 40 years .
The elderly also make up
a growing share of the
state’s total population
(not shown) .

©2012 California healthCare foundation 4
1900 2002 2009
Pneumonia and Influenza Heart disease Heart disease
Tuberculosis Cancer Cancer
diarrhea and Enteritis Stroke Chronic Lower Respiratory diseases
Death and Dying in Californiaoverview
Sources: US Department of Health & Human Services, Center for Disease Control and Prevention, National Center for Health Statistics, National Vital Statistics Reports, Vol. 59, No. 4, March 16, 2011, Table B. Accessed December 12, 2011, www.cdc.govw.
The leading causes of uS
deaths have moved away
from infectious illnesses
toward chronic conditions
over time . Many patients
near the end of life may
have a longer disease
trajectory than in the past
and more time to consider
their options for care .
TOP THREE CAuSES OF dEATH
Leading Causes of Death, united states, 1900, 2002, 2009

©2012 California healthCare foundation 5
total deaths no. 1 cause no. 2 cause no. 3 cause
White/Non-Latino 154,084
Heart disease 40,996
Cancer 37,095
Chronic Lower Respiratory diseases 10,201
Latino 38,034
Cancer 8,445
Heart disease 7,933
Accidents 2,641
Asian/Pacific Islander 18,497
Cancer 5,220
Heart disease 4,424
Stroke 1,531
African American 17,562
Heart disease 4,637
Cancer 4,227
Stroke 1,032
Death and Dying in Californiaby Race/ethnicity
Sources: California Department of Health Services, Death Statistical Data Tables, Table 5-8, Major Causes of Death by Race/Ethnic Group and Sex, California 2009. Accessed December 14, 2011, www.cdph.ca.gov.
Heart disease and cancer
were the top two causes
of death for Whites,
Latinos, Asians, and
African Americans in
California in 2009 .
Leading Causes of Death, by Race/Ethnicity, california, 2009

©2012 California healthCare foundation 6
OVERALLAsian/Pacific Islander
LatinoWhite/Non-Latino
AfricanAmerican
73.379.3
83.186.1
80.1
Death and Dying in Californiaby Race/ethnicity
Source: American Human Development Project of the Social Science Research Council, A Portrait of California: California Human Development Report, 2011, Health in California Today. Accessed December 14, 2011, www.measureofamerica.org.
Average life expectancy
is a broad measure of the
health of a population . In
California, Asian/Pacific
Islanders have the longest
life expectancy, six years
over the average for the
state . African Americans
have a life expectancy
that is about seven years
shorter than the average .
AvERAgE YEARS OF AgE
Life Expectancy, by Race/Ethnicity, california, 2010

©2012 California healthCare foundation 7
White/Non-Latino66%
Latino16%
8%
8%
Other (2%)
African American
Asian/Pacific Islander
Death and Dying in California
TOTAL dEATHS: 231,764
Source: California Department of Public Health, Death Statistical Data Tables, Table 5-18. Deaths by sex and race/ethnic group. California counties and selected city health departments, 2009. Accessed December 14, 2011, www.cdph.ca.gov.
Since mortality rates are
much higher for older
adults, the number of
deaths for a racial/ethnic
group is determined
primarily by the group’s
age distribution . Because
the majority of Californians
over 65 are White, this
group has the highest
number of deaths .
by Race/ethnicityDeaths, by Race/Ethnicity, california, 2009

©2012 California healthCare foundation 8
A close relationship with my MD
Being at home
Living as long as possible
Having MDs and nurses who will respect my cultural beliefs and values
Not feeling alone
Making sure my wishes for medical care are followed
Being able to pay for the care I need
Having loved ones around me
Making sure family is not burdened by tough decisions about my care
Being at peace spiritually
Being comfortable and without pain
Making sure family not burdened financially by my care 67%
66%
61%
60%
60%
58%
57%
55%
44%
36%
33%
32%
Death and Dying in California
RATIng FACTOR “ExTREMELY IMPORTAnT”
end-of-life concerns
Source: Californians’ Attitudes Toward End-of-Life Issues, Lake Research Partners, 2011. Statewide survey of 1,669 adult Californians, including 393 respondents who have lost a loved one in the past 12 months.
Californians are most
likely to say it is extremely
important to them that
their care does not burden
their family financially .
Most Important Factors at End of Life, california, 2011

©2012 California healthCare foundation 9
Being at peace spiritually
Having family not burdened by decisions about care
Having health care providers respect cultural beliefs and values
Living as long as possible
61% 76%
50% 55%
71%
36% 43%
18% 25%
56%
44% 52%
29% 41%
52%
60% 68%
59% 54%
68%
■ TOTAL■ African
American■ Asian ■ White/
Non-Latino ■ Latino
Death and Dying in California
RATIng FACTOR “ExTREMELY IMPORTAnT”
Source: Californians’ Attitudes Toward End-of-Life Issues, Lake Research Partners, 2011. Statewide survey of 1,669 adult Californians, including 393 respondents who have lost a loved one in the past 12 months.
Top concerns vary by
race/ethnicity . Latinos
rate “living as long as
possible” more highly
than do other groups .
Sixty percent of
respondents say it is
extremely important
that their family not be
burdened by decisions
regarding their care .
Most Important Factors at End of Life, by Race/ethnicity, california, 2011
end-of-life concerns

©2012 California healthCare foundation 10
TOTALWhite/Non-Latino
Asian/PacificIslander
LatinoAfricanAmerican
34%
6%
58%
30%
10%
60%
23%
8%
67%
20%
5%
75%
25%
7%
67%
■ Not sure■ Medical providers
using everything to prolong life
■ Dying a natural deathif heartbeat or breathing stops
Death and Dying in California
*Question wording: “If you had an advanced illness, which would you prefer: Doctors and nurses using everything available to attempt to prolong my life (such as a breathing machine or feeding through a tube) — or — Dying a natural death if my heart should stop beating or I should stop breathing”.
end-of-life concerns
Note: Segments may not add to 100% due to rounding.
Source: Californians’ Attitudes Toward End-of-Life Issues, Lake Research Partners, 2011. Statewide survey of 1,669 adult Californians, including 393 respondents who have lost a loved one in the past 12 months.
A large majority of
Californians want to die a
natural death, rather than
receive all possible care to
prolong their life .*
Preferences Around Prolonging Life, by Race/ethnicity, california, 2011
©2012 California HealtHCare foundation 11
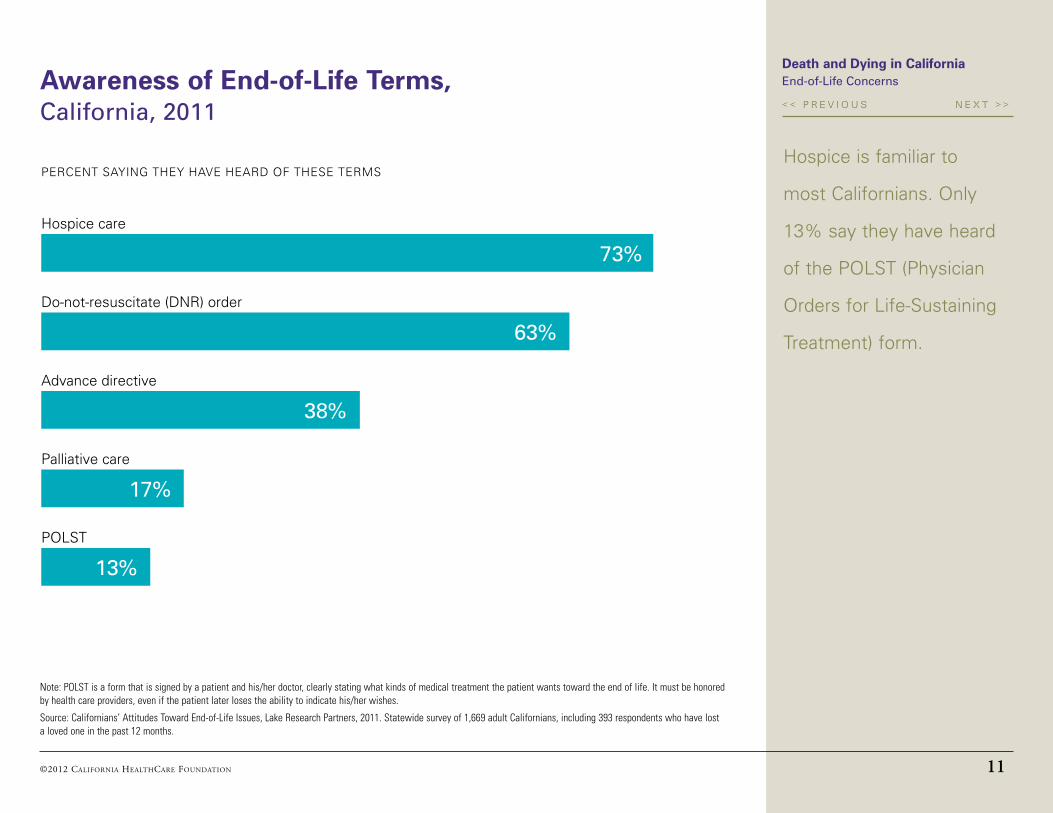
POLST
Palliative care
Advance directive
Do-not-resuscitate (DNR) order
Hospice care
73%
63%
38%
17%
13%
Death and Dying in California
Percent saying they have heard of these termshospice is familiar to
most californians. only
13% say they have heard
of the PoLst (Physician
orders for Life-sustaining
treatment) form.
Note: POLST is a form that is signed by a patient and his/her doctor, clearly stating what kinds of medical treatment the patient wants toward the end of life. It must be honored by health care providers, even if the patient later loses the ability to indicate his/her wishes.
Source: Californians’ Attitudes Toward End-of-Life Issues, Lake Research Partners, 2011. Statewide survey of 1,669 adult Californians, including 393 respondents who have lost a loved one in the past 12 months.
Awareness of End-of-Life Terms, California, 2011
End-of-Life Concerns

©2012 California healthCare foundation 12
Home70%
Other7%
Hospital16%
Refused(2%)
Hospice facility(4%)
Don’t know/Not sure(2%)
Death and Dying in California
Note: Segments may not add to 100% due to rounding.
Source: Californians’ Attitudes Toward End-of-Life Issues, Lake Research Partners, 2011. Statewide survey of 1,669 adult Californians, including 393 respondents who have lost a loved one in the past 12 months.
A large majority of
Californians would prefer
to die at home rather than
in a health care facility .
Preferred Location of Death, california, 2011
by location

©2012 California healthCare foundation 13
Other
Inpatient Hospice
Nursing Home
Home
Hospital
58%47%
42%
13% 27%
32%
22%21%
18%
5% 8%
6%
N/A N/A
2%
■ 1989 ■ 2001 ■ 2009
Death and Dying in Californiaby location
The number of
Californians who died at
home has grown 146%
since 1989, while deaths
in hospitals have declined .
In 2009, 42% of deaths
occurred in hospitals
and about 18% in
nursing homes .
Source: State of California, Department of Public Health, Death Records, 2011.
Location of Deaths, california, 1989, 2001, 2009

©2012 California healthCare foundation 14
8.0
8.5
9.0
9.5
10.0
10.5
11.0
11.5
12.0
2007200420001996
10.9
9.2
10.6
10.3
CaliforniaUnited States
Death and Dying in California
Source: The Dartmouth Institute for Health Policy and Clinical Practice, The Dartmouth Atlas of Health Care, Inpatient Days per Decedent During the Last Six Months of Life, by Gender and Level of Care, California. Accessed December 14, 2011, www.dartmouthatlas.org.
While the average number
of days patients spent in
the hospital during the last
six months of their lives
declined across the nation
from 1996 to 2007, the
number of days rose in
California .
Hospital Days During the Last Six Months of Life, california vs. united states, 1996 to 2007, selected years
hospital care

©2012 California healthCare foundation 15
0%
5%
10%
15%
20%
25%
2007200420001996
12.5%
10.0%
20.3%
15.2%
CaliforniaUnited States
Death and Dying in California
Source: The Dartmouth Institute for Health Policy and Clinical Practice, The Dartmouth Atlas of Health Care, Percent of Decedents Spending 7 or More Days in ICU/CCU During the Last 6 Months of Life, California. Accessed December 12, 2011, www.dartmouthatlas.org.
The percentage of
Californians spending
seven or more days in
intensive care units (both
high- and intermediate-
intensity beds) almost
doubled between 1996
and 2007, and is nearly
a third higher than the
national average .
This does not reflect
Californians’ preference
for limited intervention .
hospital carePatients Spending 7+ Days in ICU/CCU During the Last Six Months of Life, california vs. united states, 1996 to 2007

©2012 California healthCare foundation 16
0%
5%
10%
15%
20%
25%
2007200420001996
17.5%17.1%
21.2%
17.1%
CaliforniaUnited States
Death and Dying in California
*The Dartmouth Atlas of Health Care, Percent of Decedents Admitted to ICU/CCU during the hospitalization in which death occurred, by gender. Accessed December 19, 2011, www.dartmouthatlas.org.
Source: The Dartmouth Institute for Health Policy and Clinical Practice, The Dartmouth Atlas of Health Care, Percent of Decedents Admitted to ICU/CCU During the Hospitalization in Which Death Occurred, California. Accessed December 12, 2011, www.dartmouthatlas.org.
California was second
only to new Jersey in the
percentage of patients
admitted to ICu/CCu
during the hospitalization
in which death occurred .*
This growing trend does
not align with Californians’
preference to die at home .
Patients Admitted to ICU/CCU During the Hospitalization in Which Death Occurred, california vs. united states, 1996 to 2007
hospital care

©2012 California healthCare foundation 17
Not served by hospice61%
Served byhospice
39%
Death and Dying in California
*Connor, S.R., B. Pyenson, K. Fitch, C. Spence, K. Iwasaki. Comparing Hospice and Non-Hospice Patient Survival Among Patients Who Die Within a Three-Year Window. Journal of Pain and Symptom Management, 2007 March; 33(3). The study found the mean survival was 29 days longer for hospice patients than for non-hospice patients.Source: California Hospice and Palliative Care Association, California State Hospice Data Report, 2012.
Less than 40% of dying
Californians were served
by hospice in 2010,
despite research indicating
that hospice patients
have better symptom
control and a better
quality of life .*
hospice careDeaths Served by Hospice, Medicare Beneficiaries, california, 2010

©2012 California healthCare foundation 18
White/Non-Latino85%
5%
4%4%
3%
Other
Asian/Pacific Islander
Latino
African American
Death and Dying in California
Note: Segments may not add to 100% due to rounding.
Source: California Hospice and Palliative Care Association, California State Hospice Data Report, 2012.
Whites use hospice care
more than other racial/
ethnic groups in California .
They accounted for 85%
of hospice deaths in 2010 .
Deaths in Hospice Care, by Ethnicity/Race, Medicare Beneficiaries, california, 2010
hospice care

©2012 California healthCare foundation 19
No56%
Yes42%
Refused(2%)
Most likely to say “yes”:
•Age 65+ (71%)
•White (54% vs . 41% African Americans, 31% Latinos, and 33% Asians)
•Some college+ (46% vs . 36% high school or less)
• Income $50K+ (49% vs . 36% <$50K)
•Has chronic conditions (48% vs . 34%)
Death and Dying in California
Source: Californians’ Attitudes Toward End-of-Life Issues, Lake Research Partners, 2011. Statewide survey of 1,669 adult Californians, including 393 respondents who have lost a loved one in the past 12 months.
Have you talked with (the loved one you would want to make decisions on your behalf) about the kind of medical treatment you would want?
Discussed End-of-Life Wishes with a Loved One, california, 2011
Fifty-six percent of
respondents have
not discussed their
preferences with the
loved one they would
want making decisions
on their behalf . Among
Californians over 65, 71%
have had the discussion .
communicating end-of-life Wishes

©2012 California HealtHCare foundation 20
No one to talk to
Haven’t thought about it
Too young/long ways off
Loved one does not want to talk about death or dying
Don’t want to think about death or dying
Too many other things to worry about right now
41%
26%
13%
4%
3%
3%
African American
Asian/Pacific Islander
Latino
White/Non-Latino
45%
36%
49%
35%
African American
Asian/Pacific Islander
Latino
White/Non-Latino
15%
38%
26%
15%
Death and Dying in California
Source: Californians’ Attitudes Toward End-of-Life Issues, Lake Research Partners, 2011. Statewide survey of 1,669 adult Californians, including 393 respondents who have lost a loved one in the past 12 months.
Having too many other
things to worry about is a
top barrier to discussing
end-of-life wishes.
Latinos are more likely
than other groups to say
they do not want to think
about death and dying.
What is the main reason you have not talked (to your loved one) about your wishes for end-of-life medical treatment? n = 857
Barriers to Discussing Wishes with Loved One, California, 2011
Communicating End-of-Life Wishes

©2012 California HealtHCare foundation 21
Very important45%
No76%
Yes23%
Not tooimportant
12%
Somewhatimportant37%
Refused(1%)
Refused(1%)
Not at all important(4%)
Percent saying “yes,” by race/etHnicity
Latino
Asian/Pacific Islander
African American
White/Non-Latino
33%
24%
21%
9%
Death and Dying in California
Note: Segments may not add to 100% due to rounding.
Source: Californians’ Attitudes Toward End-of-Life Issues, Lake Research Partners, 2011. Statewide survey of 1,669 adult Californians, including 393 respondents who have lost a loved one in the past 12 months.
How important do you feel it is to have your wishes in writing?
Do you have any of your wishes regarding the medical treatment you would want in a written document?
While a large majority
of californians feel it is
important to put their
wishes in writing,
only 23% say they
have done so.
White, non-Latino
californians are three
times as likely as Latinos
to have their end-of-life
wishes in a written
document.
Communicating End-of-Life WishesPut End-of-Life Wishes in Writing, California, 2011

©2012 California healthCare foundation 22
Definitely33%Maybe
26%
Probably32%
Refused(2%)Definitely not
(2%)
Probably not(4%) Most likely to say
“definitely”:
•Already has wishes in writing (47%)
•Women age 45+ (43%)
Death and Dying in California
*POLST is a form for seriously ill patients that is signed by a patient and his or her doctor. The form, printed on bright pink paper, clearly says what kinds of medical treatment the patient wants toward the end of his or her life and must be honored by health care providers. POLST works even if the patient later loses the ability to say what he or she wants.
If you were seriously ill, do you think you would want to fill out a POLST [Physician Orders for Life-Sustaining Treatment] form with your doctor?
After hearing a description
of POLST,* almost two-
thirds of Californians say
they would definitely or
probably want to fill out a
POLST form if they were
seriously ill .
communicating end-of-life Wishes
Note: Segments may not add to 100% due to rounding.
Source: Californians’ Attitudes Toward End-of-Life Issues, Lake Research Partners, 2011. Statewide survey of 1,669 adult Californians, including 393 respondents who have lost a loved one in the past 12 months.
Attitudes Toward POLST for Self, california, 2011

©2012 California healthCare foundation 23
Definitely41%
Maybe21%
Probably30%
Refused(3%)Definitely not
(2%)
Probably not(2%)
Women are more likely to say “definitely” for a loved one (46%) than for themselves (36%) .
Death and Dying in California
*POLST is a form for seriously ill patients that is signed by a patient and his or her doctor. The form, printed on bright pink paper, clearly says what kinds of medical treatment the patient wants toward the end of his or her life and must be honored by health care providers. POLST works even if the patient later loses the ability to say what he or she wants.
If a loved one were seriously ill, would you want them to fill out a POLST form so you would be clear about what he or she wanted?
Note: Segments may not add to 100% due to rounding.
Source: Californians’ Attitudes Toward End-of-Life Issues, Lake Research Partners, 2011. Statewide survey of 1,669 adult Californians, including 393 respondents who have lost a loved one in the past 12 months.
Seventy-one percent
of Californians say they
would definitely or
probably want their loved
one to fill out a POLST*
form if they were
seriously ill .
communicating end-of-life WishesAttitudes Toward POLST for Loved One, california, 2011
©2012 California healthCare foundation 24
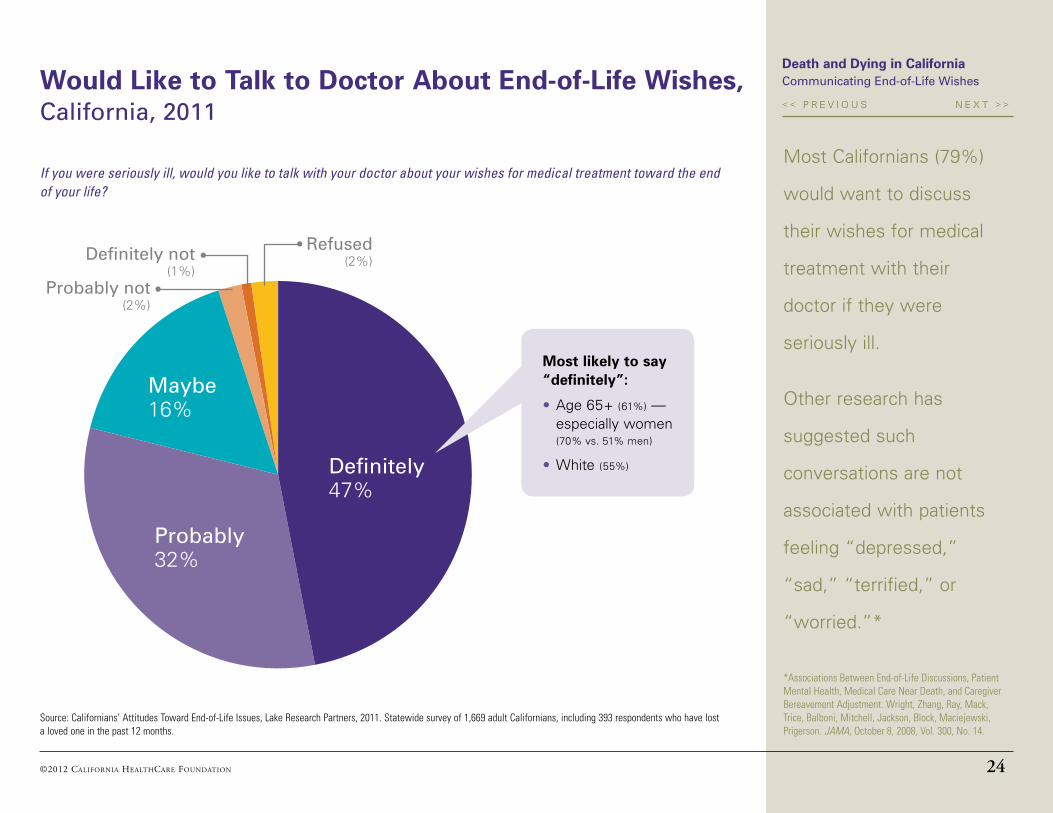
Definitely47%
Maybe16%
Probably32%
Refused(2%)Definitely not
(1%)Probably not
(2%)
Most likely to say “definitely”:
•Age 65+ (61%) — especially women (70% vs . 51% men)
•White (55%)
Death and Dying in California
*Associations Between End-of-Life Discussions, Patient Mental Health, Medical Care Near Death, and Caregiver Bereavement Adjustment. Wright, Zhang, Ray, Mack, Trice, Balboni, Mitchell, Jackson, Block, Maciejewski, Prigerson. JAMA, October 8, 2008, Vol. 300, No. 14.
Source: Californians’ Attitudes Toward End-of-Life Issues, Lake Research Partners, 2011. Statewide survey of 1,669 adult Californians, including 393 respondents who have lost a loved one in the past 12 months.
Most Californians (79%)
would want to discuss
their wishes for medical
treatment with their
doctor if they were
seriously ill .
Other research has
suggested such
conversations are not
associated with patients
feeling “depressed,”
“sad,” “terrified,” or
“worried .”*
If you were seriously ill, would you like to talk with your doctor about your wishes for medical treatment toward the end of your life?
communicating end-of-life WishesWould Like to Talk to Doctor About End-of-Life Wishes, california, 2011

©2012 California healthCare foundation 25
No92%
Yes7%
Refused(1%)
Most likely to say “yes”:
•Age 65+ (13%) — especially women (16% vs . 10% of men 65+)
Most likely to say “no”:
•Age 45 to 64 (94% vs . 93% age 18 to 44; and 84% age 65+)
Death and Dying in California
Have you ever had a doctor ask you about your wishes for medical treatment at the end of your life?
Source: Californians’ Attitudes Toward End-of-Life Issues, Lake Research Partners, 2011. Statewide survey of 1,669 adult Californians, including 393 respondents who have lost a loved one in the past 12 months.
Only 7% say their doctor
has talked with them
about their wishes .
Research indicates that
patients who had such
discussions were more
likely to have a dnR and
to prefer comfort-focused
care over life-extending
therapies .*
communicating end-of-life WishesDoctor Talking with Patient About End-of-Life Wishes, california, 2011
*Associations Between End-of-Life Discussions, Patient Mental Health, Medical Care Near Death, and Caregiver Bereavement Adjustment. Wright, Zhang, Ray, Mack, Trice, Balboni, Mitchell, Jackson, Block, Maciejewski, Prigerson. JAMA, October 8, 2008, Vol. 300, No. 14.

©2012 California healthCare foundation 26
Very goodidea36%
Somewhatbad idea16%
Somewhatgood idea45%
Refused(3%)
Very bad idea(6%)
Most likely to say bad idea:
•Men age 65+ (30%)
Most likely to say good idea:
•democrats (84% vs . 80% Independents and 72% Republicans)
Death and Dying in Californiacommunicating end-of-life Wishes
One idea is to have insurance plans cover a doctor’s time to talk with patients about treatment options towards the end of life. Do you think this is a good idea or a bad idea?
Note: Segments may not add to 100% due to rounding.
Source: Californians’ Attitudes Toward End-of-Life Issues, Lake Research Partners, 2011. Statewide survey of 1,669 adult Californians, including 393 respondents who have lost a loved one in the past 12 months.
More than four out of
five Californians say
reimbursing physicians for
talking about end-of-life
treatment options is a
good idea .
Physician Reimbursement for End-of-Life Discussion, california, 2011

©2012 California healthCare foundation 27
No63%
Yes18%
Not sure15%
4%
Refused
Death and Dying in California
Source: Californians’ Attitudes Toward End-of-Life Issues, Lake Research Partners, 2011. Statewide survey of 1,669 adult Californians, including 393 respondents who have lost a loved one in the past 12 months.
Did you or others share information about your loved one’s health through a website like CaringBridge, Facebook, or some other site? n = 393
end-of-life experiences
nearly one in five
respondents who recently
lost a loved one say
information was shared
about their loved one’s
health on a website .
Of those, 89% used
Facebook .
End-of-Life Experiences with a Loved One: use of social Media, california, 2011

©2012 California healthCare foundation 28
Uninsured25%
Languagebarrier27%
Nolanguagebarrier69%
Insured72%
Refused(3%)
Refused(4%)
Death and Dying in California
At the end of your loved one’s life, what was their health insurance status?
To what extent, if at all, was language a barrier to your loved one getting the best possible care?
Source: Californians’ Attitudes Toward End-of-Life Issues, Lake Research Partners, 2011. Statewide survey of 1,669 adult Californians, including 393 respondents who have lost a loved one in the past 12 months.
Among Californians who
have lost a loved in the
past 12 months:
• One-fourth say their
loved one was
uninsured at the end
of his or her life .
• Twenty-seven percent
say their loved one
faced a language barrier
to getting the best
possible care .
end-of-life experiencesDeath of a Loved One, by Health Insurance Status and Language Barrier, california, 2011
n = 393

©2012 California healthCare foundation 29
TOTALLanguage barrierNolanguage barrier
UninsuredInsured
58%
35%
60%
36%
52%
Death and Dying in California
Note: Because sample sizes for uninsured (n=70) and facing a language barrier (n=71) are smaller than ideal, statistical tests of the differences across groups were conducted using Chi-Square tests. The difference between insured and uninsured is statistically significant at 99% level of confidence. Likewise, the difference between language barrier and no language barrier is statistically significant at 99% level of confidence.
Source: Californians’ Attitudes Toward End-of-Life Issues, Lake Research Partners, 2011. Statewide survey of 1,669 adult Californians, including 393 respondents who have lost a loved one in the past 12 months.
Overall, how would you rate the care your loved one received at the end of their life?
PERCEnT SAYIng “ExCELLEnT” OR “vERY gOOd” n =393
Individuals whose loved
one was uninsured or
faced a language barrier
were much less likely than
others to say their loved
one received excellent or
very good care .
end-of-life experiencesOverall Rating of End-of-Life Care of Loved One, by insurance status and language Barrier, california, 2011
©2012 California healthCare foundation 30
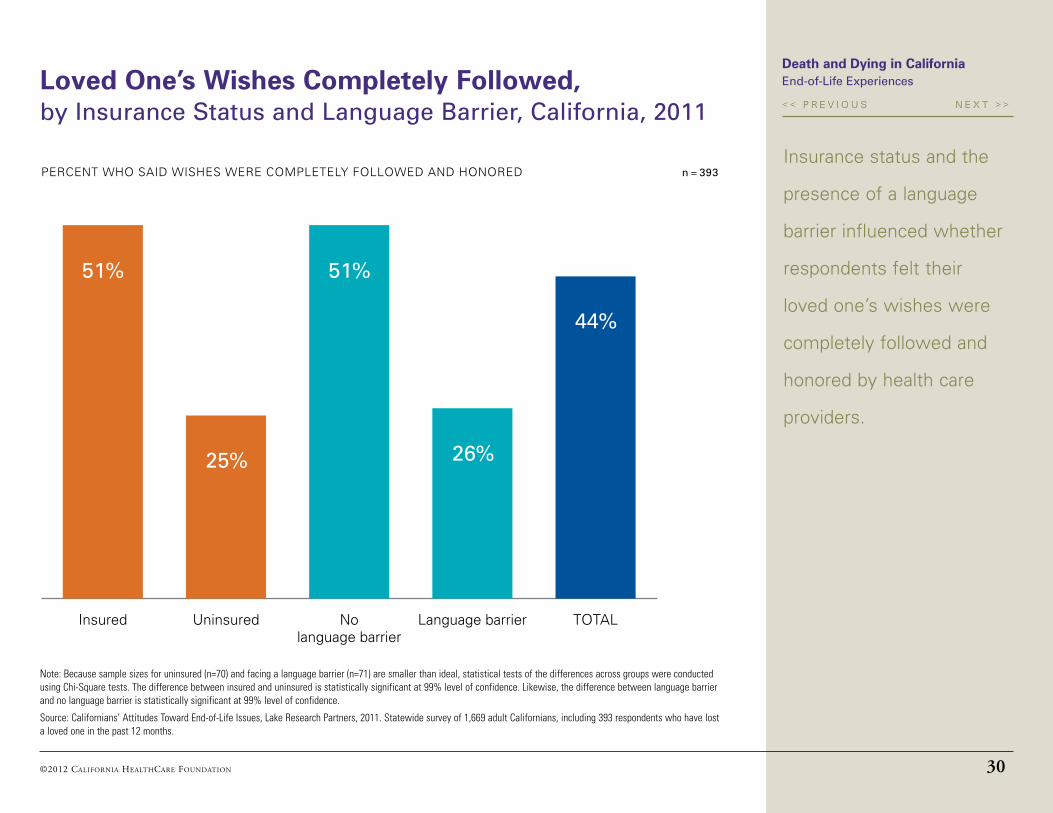
TOTALLanguage barrierNolanguage barrier
UninsuredInsured
51%
25%
51%
26%
44%
Death and Dying in California
Note: Because sample sizes for uninsured (n=70) and facing a language barrier (n=71) are smaller than ideal, statistical tests of the differences across groups were conducted using Chi-Square tests. The difference between insured and uninsured is statistically significant at 99% level of confidence. Likewise, the difference between language barrier and no language barrier is statistically significant at 99% level of confidence.
Source: Californians’ Attitudes Toward End-of-Life Issues, Lake Research Partners, 2011. Statewide survey of 1,669 adult Californians, including 393 respondents who have lost a loved one in the past 12 months.
PERCEnT WHO SAId WISHES WERE COMPLETELY FOLLOWEd And HOnOREd n = 393Insurance status and the
presence of a language
barrier influenced whether
respondents felt their
loved one’s wishes were
completely followed and
honored by health care
providers .
end-of-life experiencesLoved One’s Wishes Completely Followed, by insurance status and language Barrier, california, 2011

©2012 California healthCare foundation 31
for more information
California HealthCare Foundation
1438 Webster Street, Suite 400
Oakland, CA 94612
510.238.1040
www.chcf.org
Death and Dying in California
AuthorsLake Research Partners provides public opinion and research-based strategy for campaigns, issue advocacy groups,
foundations, unions, and nonprofit organizations .
www .lakeresearch .com
The Coalition for Compassionate Care of California is a partnership of nearly 200 regional and statewide organizations
dedicated to the advancement of palliative medicine and end-of-life care in California .
www .coalitionccc .org
MethodologyThe survey was conducted October 26 through november 3, 2011 among a representative sample of 1,669 Californians 18 and
older, including 393 respondents who have lost a loved one in the past 12 months, using Knowledge networks . The margin of
error is 2 .4 percentage points for the total results .
Survey Respondents Demographics
gEndER
Men . . . . . . . . . . . . . .49%
Women . . . . . . . . . . . . 51%
RACE/ETHnICITY
White/non-Latino . . . . . . 47%
Latino . . . . . . . . . . . . .33%
Asian/Pacific Islander . . . . . 12%
African American . . . . . . . 6%
Other . . . . . . . . . . . . . 1%
2+ races . . . . . . . . . . . 1%
AgE gROuP
18 to 24 . . . . . . . . . . . . 11%
25 to 29 . . . . . . . . . . . . 12%
30 to 34 . . . . . . . . . . . . 9%
35 to 39 . . . . . . . . . . . .10%
40 to 44 . . . . . . . . . . . . 9%
45 to 49 . . . . . . . . . . . . 9%
50 to 54 . . . . . . . . . . . . 9%
55 to 59 . . . . . . . . . . . . 9%
60 to 64 . . . . . . . . . . . . 7%
65 to 69 . . . . . . . . . . . . 7%
70 to 74 . . . . . . . . . . . . 4%
75+ . . . . . . . . . . . . . . 2%
(not ascertained) . . . . . . . 2%