s eporting ate ugust andhra cements ltd. cements ltd. nse code ... project and certain bills, ......
TRANSCRIPT
Stakeholders’ Education | Corporate Governance Research | Corporate Governance Score | Proxy Advisory
STAKEHOLDERS EMPOWERMENT SERVICES
1 | P A G E
SECTOR: CEMENT REPORTING DATE: 14TH AUGUST, 2017
ANDHRA CEMENTS LTD. www.andhracements.com
Andhra Cements Ltd. NSE Code - ANDHRACEMT TABLE 1 - MARKET DATA (STANDALONE) (As on 10TH AUGUST, 2017)
Sector - Cement NSE Market Price (₹) 8.60 NSE Market Cap. (₹ Cr.) 258.59
Face Value (₹) 10.00 Equity (₹ Cr.) 293.52
Business Group - Duncans Goenka 52 week High/Low (₹) 14.10/6.35 Net worth (₹ Cr.)* 36.01
Year of Incorporation - 1936 TTM P/E (TTM) N.A. Traded Volume (Shares) 406,120
TTM P/BV N.A. Traded Volume (lacs) 34.93
Registered Office Source - Capitaline, TTM - Trailing Twelve Months, N.A. – Not Applicable, * as on 30th Sepetember,2016
Durga Cement Works, COMPANY BACKGROUND
Sri Durgapuram Dachepalli, Andhra Cement Ltd. (formerly Andhra Cement Company Ltd.), incorporated in Dec.'36,
was promoted and owned by the Sadu Jain group. It manufactures and markets cement
under the Durga Prasad trade name. It's first unit was commissioned in Vijayawada in
1940. Later, it was extended in three stages in 1951, 1958 and 1970. By 1987, total
capacity reached 2.4 lac tpa of cement. The company possesses mining leases over about
300 acres in Gammalapadu.
BIFR has sanctioned a scheme for rehabilitation in June 1994. The Scheme estimated at ₹
79.81 crore, envisaged change of management in favour of Duncan Agro Inds., now known
as Duncan Industries Ltd, belonging to the G P Goenka Group (also known as Duncan
Goenka Group). In the year 1997-98, the Duncan Goenka group of companies have
brought ₹ 52.61 Crs. under the BIFR scheme.
Guntur - 522 414, Andhra Pradesh
Company Website:
www.andhracements.com
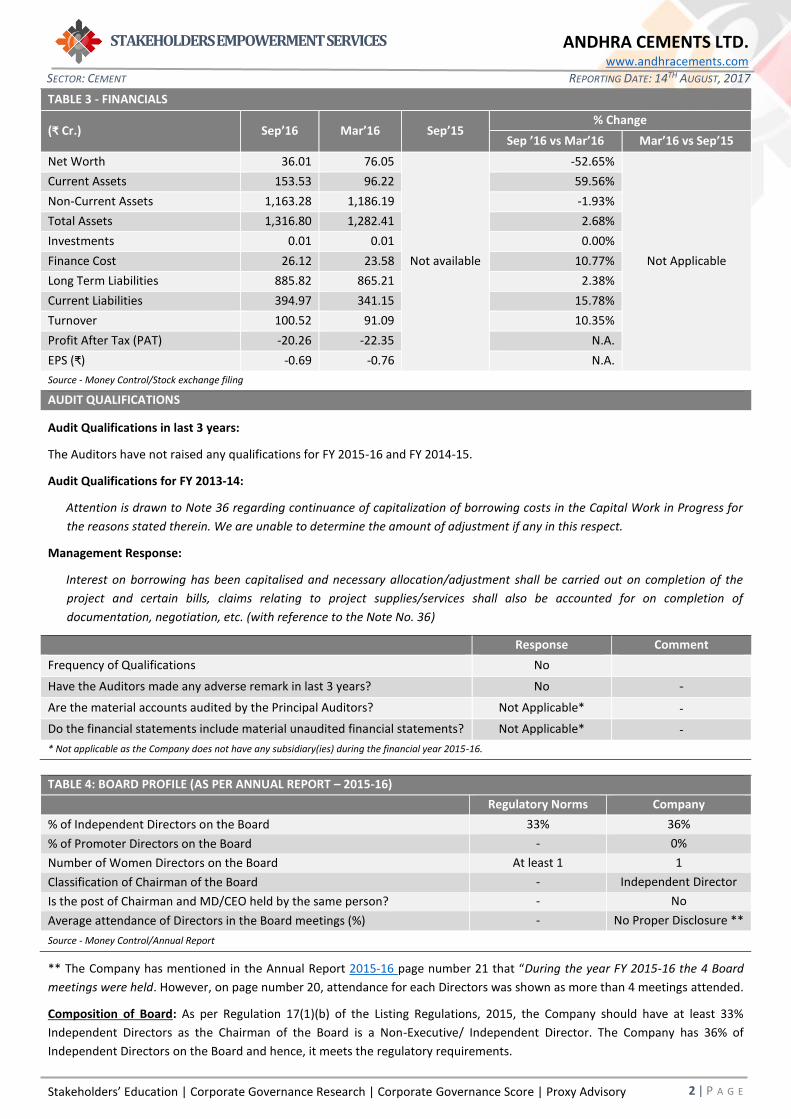
Revenue and Profit Performance
The revenue of the Company decreased from ₹ 110.65
crores to ₹ 101.08 crores from quarter ending Sep’15 to
quarter ending Sep’16. The Company made a loss of ₹
20.26 crores in quarter ending Sep’16 vis-a-vis making a
loss of ₹ 19.82 crores in quarter ending Sep’15.
Source: Money control
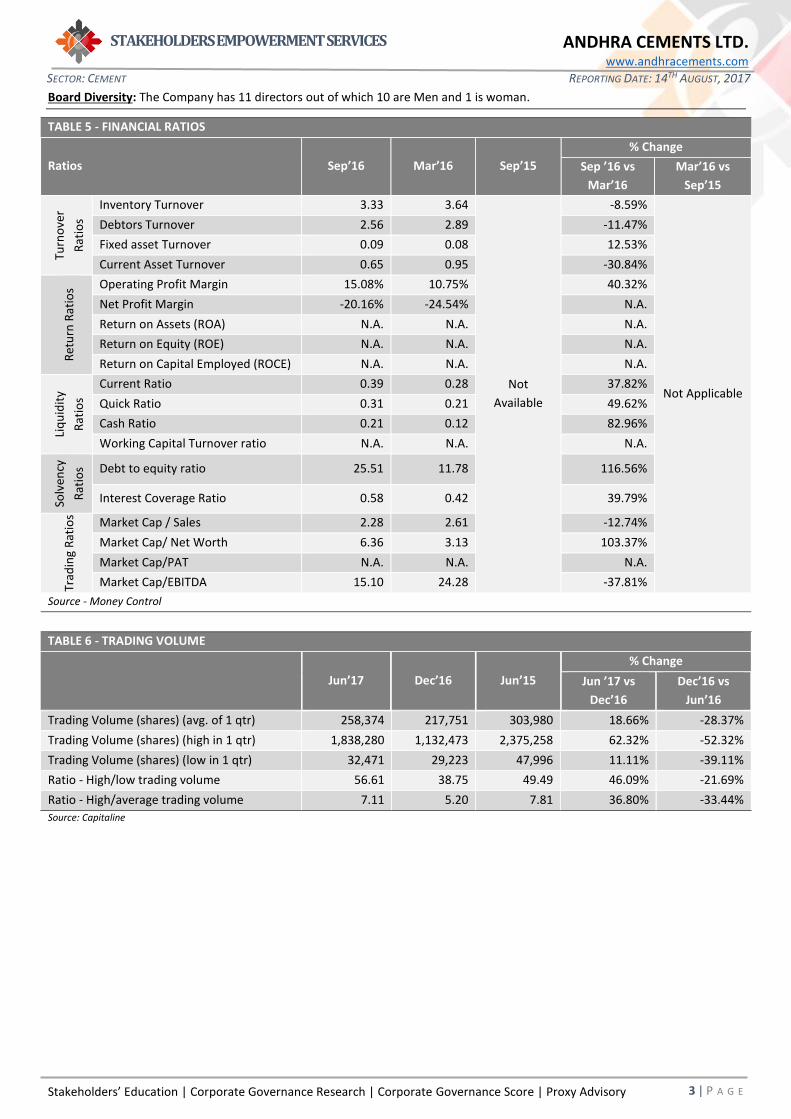
Performance vis-à-vis Market
TABLE 2- Returns
1-m 3-m 6-m 12-m
Andhra Cements Ltd -13.13% -14.53% -26.50% 8.18%
Nifty -0.72% 3.00% 11.69% 13.63%
Source: Capitaline
-
0.50
1.00
1.50
2.00
Aug16
Sep16
Oct16
Nov16
Dec16
Jan17
Feb17
Mar17
Apr17
May17
Jun17
Jul17
Andhra Cements Ltd NIFTY
101.0891.09
110.65
-20.26 -22.35
-19.82
-50
0
50
100
150
Sep'16 Mar'16 Sep'15
Quarterly revenue and Profit (₹ CRORE)
Revenue Profit
Stakeholders’ Education | Corporate Governance Research | Corporate Governance Score | Proxy Advisory
STAKEHOLDERS EMPOWERMENT SERVICES
2 | P A G E
SECTOR: CEMENT REPORTING DATE: 14TH AUGUST, 2017
ANDHRA CEMENTS LTD. www.andhracements.com
TABLE 3 - FINANCIALS
(₹ Cr.) Sep’16 Mar’16 Sep’15 % Change
Sep ’16 vs Mar’16 Mar’16 vs Sep’15
Net Worth 36.01 76.05
Not available
-52.65%
Not Applicable
Current Assets 153.53 96.22 59.56%
Non-Current Assets 1,163.28 1,186.19 -1.93%
Total Assets 1,316.80 1,282.41 2.68%
Investments 0.01 0.01 0.00%
Finance Cost 26.12 23.58 10.77%
Long Term Liabilities 885.82 865.21 2.38%
Current Liabilities 394.97 341.15 15.78%
Turnover 100.52 91.09 10.35%
Profit After Tax (PAT) -20.26 -22.35 N.A.
EPS (₹) -0.69 -0.76 N.A.
Source - Money Control/Stock exchange filing
AUDIT QUALIFICATIONS
Audit Qualifications in last 3 years:
The Auditors have not raised any qualifications for FY 2015-16 and FY 2014-15.
Audit Qualifications for FY 2013-14:
Attention is drawn to Note 36 regarding continuance of capitalization of borrowing costs in the Capital Work in Progress for
the reasons stated therein. We are unable to determine the amount of adjustment if any in this respect.
Management Response:
Interest on borrowing has been capitalised and necessary allocation/adjustment shall be carried out on completion of the
project and certain bills, claims relating to project supplies/services shall also be accounted for on completion of
documentation, negotiation, etc. (with reference to the Note No. 36)
Response Comment
Frequency of Qualifications No
Have the Auditors made any adverse remark in last 3 years? No -
Are the material accounts audited by the Principal Auditors? Not Applicable* -
Do the financial statements include material unaudited financial statements? Not Applicable* -
* Not applicable as the Company does not have any subsidiary(ies) during the financial year 2015-16.
TABLE 4: BOARD PROFILE (AS PER ANNUAL REPORT – 2015-16)
Regulatory Norms Company
% of Independent Directors on the Board 33% 36%
% of Promoter Directors on the Board - 0%
Number of Women Directors on the Board At least 1 1
Classification of Chairman of the Board - Independent Director
Is the post of Chairman and MD/CEO held by the same person? - No
Average attendance of Directors in the Board meetings (%) - No Proper Disclosure **
Source - Money Control/Annual Report
** The Company has mentioned in the Annual Report 2015-16 page number 21 that “During the year FY 2015-16 the 4 Board
meetings were held. However, on page number 20, attendance for each Directors was shown as more than 4 meetings attended.
Composition of Board: As per Regulation 17(1)(b) of the Listing Regulations, 2015, the Company should have at least 33%
Independent Directors as the Chairman of the Board is a Non-Executive/ Independent Director. The Company has 36% of
Independent Directors on the Board and hence, it meets the regulatory requirements.
Stakeholders’ Education | Corporate Governance Research | Corporate Governance Score | Proxy Advisory
STAKEHOLDERS EMPOWERMENT SERVICES
3 | P A G E
SECTOR: CEMENT REPORTING DATE: 14TH AUGUST, 2017
ANDHRA CEMENTS LTD. www.andhracements.com
Board Diversity: The Company has 11 directors out of which 10 are Men and 1 is woman.
TABLE 5 - FINANCIAL RATIOS
Ratios Sep’16 Mar’16 Sep’15
% Change
Sep ’16 vs
Mar’16
Mar’16 vs
Sep’15
Turn
ove
r
Rat
ios
Inventory Turnover 3.33 3.64
Not
Available
-8.59%
Not Applicable
Debtors Turnover 2.56 2.89 -11.47%
Fixed asset Turnover 0.09 0.08 12.53%
Current Asset Turnover 0.65 0.95 -30.84%
Ret
urn
Rat
ios Operating Profit Margin 15.08% 10.75% 40.32%
Net Profit Margin -20.16% -24.54% N.A.
Return on Assets (ROA) N.A. N.A. N.A.
Return on Equity (ROE) N.A. N.A. N.A.
Return on Capital Employed (ROCE) N.A. N.A. N.A.
Liq
uid
ity
Rat
ios
Current Ratio 0.39 0.28 37.82%
Quick Ratio 0.31 0.21 49.62%
Cash Ratio 0.21 0.12 82.96%
Working Capital Turnover ratio N.A. N.A. N.A.
Solv
ency
Rat
ios Debt to equity ratio 25.51 11.78 116.56%
Interest Coverage Ratio 0.58 0.42 39.79%
Trad
ing
Rat
ios Market Cap / Sales 2.28 2.61 -12.74%
Market Cap/ Net Worth 6.36 3.13 103.37%
Market Cap/PAT N.A. N.A. N.A.
Market Cap/EBITDA 15.10 24.28 -37.81%
Source - Money Control
TABLE 6 - TRADING VOLUME
Jun’17 Dec’16 Jun’15
% Change
Jun ’17 vs
Dec’16
Dec’16 vs
Jun’16
Trading Volume (shares) (avg. of 1 qtr) 258,374 217,751 303,980 18.66% -28.37%
Trading Volume (shares) (high in 1 qtr) 1,838,280 1,132,473 2,375,258 62.32% -52.32%
Trading Volume (shares) (low in 1 qtr) 32,471 29,223 47,996 11.11% -39.11%
Ratio - High/low trading volume 56.61 38.75 49.49 46.09% -21.69%
Ratio - High/average trading volume 7.11 5.20 7.81 36.80% -33.44%
Source: Capitaline
Stakeholders’ Education | Corporate Governance Research | Corporate Governance Score | Proxy Advisory
STAKEHOLDERS EMPOWERMENT SERVICES
4 | P A G E
SECTOR: CEMENT REPORTING DATE: 14TH AUGUST, 2017
ANDHRA CEMENTS LTD. www.andhracements.com
TABLE 7 (A): OWNERSHIP & MANAGEMENT RISKS
Jun'17 Dec'16 Jun'15 Comments
Shar
eho
ldin
g (%
)
Promoter shareholding 68.79 68.79 68.79 • No new equity shares were issued during the
period from Jun’ 2015 to Jun’ 2017.
• Promoter shareholding remains unchanged
during the said period.
• The shareholding of public institution decreased
from 18.19% to 14.98% and that of public others
increased from 13.02% to 16.23% during the
same period.
• The promoters have pledged 75.00% of their
shareholding.
Public - Institutional shareholding 14.98 17.70 18.19
Public - Others shareholding 16.23 13.51 13.02
Non-Promoter Non-Public
Shareholding 0.00 0.00 0.00
Source: NSE
MAJOR SHAREHOLDERS (AS ON 30th JUNE, 2017)
S. No. Promoters Shareholding S. No. Public Shareholders Shareholding
1 Jaypee Development Corporation Ltd 68.79% 1 Housing Development Fin Corp Ltd 8.84%
2 NRC Limited 3.07%
3. Fidelity Capital Investment Inc 2.52%
Source: NSE
TABLE 7 (B): OWNERSHIP & MANAGEMENT RISKS
Market Activity of Promoters The promoters have not sold/bought any shares in last one year.
Preferential issue to promoters No preferential issue of shares was made to the promoters in last one year.
Preferential issue to others No preferential issue of shares was made to other shareholders in last one year.
GDRs issued by the Company The Company did not issue any GDRs during last one year.
Issue of ESOPs/Issue of shares other
than Preferential allotment
The Company does not have any ESOP Scheme. Further, no new equity shares were
Issued by the Company in last 1 year.
Source - Annual Report 2015-16
TABLE 8: PRINCIPAL BUSINESS ACTIVITIES OF THE COMPANY
Sr. No. Name and Description of main products / services % to Total turnover of the Company
1 Cement Manufacturing 100
Source - Annual Report 2015-16

Stakeholders’ Education | Corporate Governance Research | Corporate Governance Score | Proxy Advisory
STAKEHOLDERS EMPOWERMENT SERVICES
5 | P A G E
SECTOR: CEMENT REPORTING DATE: 14TH AUGUST, 2017
ANDHRA CEMENTS LTD. www.andhracements.com
Glossary
Equity: The equity shares capital of the Company
Net Worth: The amount by which the Assets exceeds the liabilities excluding shareholders’ funds of the Company
Turnover: The revenue earned from the operations of the Company
EPS: Earning Per Share is net profit earned by the Company per share
𝐸𝑃𝑆 =Profit After Tax
Number of outstanding shares
P/E ratio: It is the ratio of the Company’s share price to earnings per share of the Company
𝑃/𝐸 𝑟𝑎𝑡𝑖𝑜 =Price of each share
Earnings per share
Current Assets: Cash and other assets that are expected to be converted to cash in one year
Fixed Assets: assets which are purchased for long-term use and are not likely to be converted quickly into cash, such as land,
buildings, and equipment
Total Assets: Current Assets + Fixed Assets
Investments: An investment is an asset or item that is purchased with the hope that it will generate income or appreciate in
the future.
Finance Cost: The Financing Cost (FC), also known as the Cost of Finances (COF), is the cost and interest and other charges
incurred during the year in relation to borrowed money.
Long Term Liabilities: Long-term liabilities are liabilities with a maturity period of over one year.
Current Liabilities: A company's debts or obligations that are due within one year.
Inventory Turnover ratio: Inventory Turnover is a ratio showing how many times a company's inventory is sold and replaced
over a period.
𝐼𝑛𝑣𝑒𝑛𝑡𝑜𝑟𝑦 𝑇𝑢𝑟𝑛𝑜𝑣𝑒𝑟 𝑟𝑎𝑡𝑖𝑜 =Sales Turnover
Inventory
Debtors Turnover: Accounts receivable turnover is an efficiency ratio or activity ratio that measures how many times a business
can turn its accounts receivable into cash during a period
𝐷𝑒𝑏𝑡𝑜𝑟𝑠 𝑇𝑢𝑟𝑛𝑜𝑣𝑒𝑟 𝑟𝑎𝑡𝑖𝑜 =Sales Turnover
Accounts recievables
Fixed Asset Turnover: The fixed-asset turnover ratio is a financial ratio of net sales to fixed assets
𝐹𝑖𝑥𝑒𝑑 𝐴𝑠𝑠𝑒𝑡 𝑇𝑢𝑟𝑛𝑜𝑣𝑒𝑟 𝑟𝑎𝑡𝑖𝑜 =Sales Turnover
Fixed Assets
Current Asset Turnover: The current-asset turnover ratio is a financial ratio of net sales to fixed assets
𝐶𝑢𝑟𝑟𝑒𝑛𝑡 𝐴𝑠𝑠𝑒𝑡 𝑇𝑢𝑟𝑛𝑜𝑣𝑒𝑟 𝑟𝑎𝑡𝑖𝑜 =Sales Turnover
Current Assets
Operating Profit Margin: Operating margin is a measurement of what proportion of a Company’s revenue is left over after
paying for variable costs of production such as wages, raw materials etc. It can be calculated by dividing a Company’s operating
income (also known as “operating profit”) during a given period by its sales during the same period.
𝑂𝑝𝑒𝑟𝑎𝑡𝑖𝑛𝑔 𝑃𝑟𝑜𝑓𝑖𝑡 𝑀𝑎𝑟𝑔𝑖𝑛 =Operating profit
Sales Turnover
Net Profit Margin: Net profit margin is the percentage of revenue left after all expenses have been deducted from sales
𝑁𝑒𝑡 𝑃𝑟𝑜𝑓𝑖𝑡 𝑀𝑎𝑟𝑔𝑖𝑛 =Net profit
Sales Turnover
Stakeholders’ Education | Corporate Governance Research | Corporate Governance Score | Proxy Advisory
STAKEHOLDERS EMPOWERMENT SERVICES
6 | P A G E
SECTOR: CEMENT REPORTING DATE: 14TH AUGUST, 2017
ANDHRA CEMENTS LTD. www.andhracements.com
Return on Assets: ROA tells you what earnings were generated from invested capital (assets)
𝑅𝑒𝑡𝑢𝑟𝑛 𝑜𝑛 𝐴𝑠𝑠𝑒𝑡𝑠 =Net profit
Total Assets
Return on equity/net worth: return on equity (ROE) is the amount of net income returned as a percentage of shareholders’
equity.
𝑅𝑒𝑡𝑢𝑟𝑛 𝑜𝑛 𝐸𝑞𝑢𝑖𝑡𝑦 =Net profit
Net worth
Return on Capital Employed: Return on capital employed (ROCE) is a financial ratio that measures a company's profitability
and the efficiency with which its capital is employed.
𝑅𝑒𝑡𝑢𝑟𝑛 𝑜𝑛 𝐶𝑎𝑝𝑖𝑡𝑎𝑙 𝐸𝑚𝑝𝑙𝑜𝑦𝑒𝑑 =Net profit
Total Debt + Equity share capital
Current ratio: The current ratio is a financial ratio that measures whether or not a firm has enough resources to pay its debts
over the next 12 months. It compares a firm's current assets to its current liabilities.
𝐶𝑢𝑟𝑟𝑒𝑛𝑡 𝑟𝑎𝑡𝑖𝑜 =Current Assets
Current Liabilities
Quick ratio: The quick ratio is a measure of how well a Company can meet its short term financial liabilities.
𝑄𝑢𝑖𝑐𝑘 𝑟𝑎𝑡𝑖𝑜 =Current Assets − Inventories
Current Liabilities
Cash ratio: The ratio of the liquid assets of a Company to its current liabilities.
𝑄𝑢𝑖𝑐𝑘 𝑟𝑎𝑡𝑖𝑜 =Current Assets − Inventories − Account Recievables
Current Liabilities
Working Capital Turnover ratio: The working capital turnover ratio is also referred to as net sales to working capital. It indicates
a Company's effectiveness in using its working capital.
𝑊𝑜𝑟𝑘𝑖𝑛𝑔 𝐶𝑎𝑝𝑖𝑡𝑎𝑙 𝑇𝑢𝑟𝑛𝑜𝑣𝑒𝑟 𝑟𝑎𝑡𝑖𝑜 =𝑆𝑎𝑙𝑒𝑠 𝑇𝑢𝑟𝑛𝑜𝑣𝑒𝑟
Current Assets − Current Liabilities
Debt to Equity ratio: The debt-to-equity ratio (D/E) is a financial ratio indicating the relative proportion of
shareholders' equity and debt used to finance a company's assets.
𝐷𝑒𝑏𝑡 𝑡𝑜 𝐸𝑞𝑢𝑖𝑡𝑦 𝑟𝑎𝑡𝑖𝑜 =𝑆ℎ𝑜𝑟𝑡 𝑇𝑒𝑟𝑚 𝐷𝑒𝑏𝑡 + 𝐿𝑜𝑛𝑔 𝑇𝑒𝑟𝑚 𝐷𝑒𝑏𝑡
𝑁𝑒𝑡 𝑊𝑜𝑟𝑡ℎ
Interest Coverage ratio: The Interest coverage ratio is a debt ratio and profitability ratio used to determine how easily a
Company can pay interest on outstanding debt.
𝐼𝑛𝑡𝑒𝑟𝑒𝑠𝑡 𝐶𝑜𝑣𝑒𝑟𝑎𝑔𝑒 𝑅𝑎𝑡𝑖𝑜 =𝐸𝑎𝑟𝑛𝑖𝑛𝑔 𝐵𝑒𝑓𝑜𝑟𝑒 𝐼𝑛𝑡𝑒𝑟𝑒𝑠𝑡 𝑎𝑛𝑑 𝑇𝑎𝑥
𝐹𝑖𝑛𝑎𝑛𝑐𝑒 𝐶𝑜𝑠𝑡
Market Cap/Sales ratio: Market Cap/sales ratio, Price–sales ratio, P/S ratio, or PSR, is a valuation metric for stocks. It is
calculated by dividing the company's market cap by the revenue in the most recent year; or, equivalently, divide the per-
share stock price by the per-share revenue.
𝑀𝑎𝑟𝑘𝑒𝑡 𝐶𝑎𝑝/𝑆𝑎𝑙𝑒𝑠 𝑟𝑎𝑡𝑖𝑜 =𝑀𝑎𝑟𝑘𝑒𝑡 𝐶𝑎𝑝
𝑆𝑎𝑙𝑒𝑠 𝑇𝑢𝑟𝑛𝑜𝑣𝑒𝑟
Market Cap/ Net Worth ratio: It is a valuation ratio calculated by dividing Company’s market cap to net worth.
𝑀𝑎𝑟𝑘𝑒𝑡 𝐶𝑎𝑝/𝑁𝑒𝑡𝑤𝑜𝑟𝑡ℎ 𝑟𝑎𝑡𝑖𝑜 =𝑀𝑎𝑟𝑘𝑒𝑡 𝐶𝑎𝑝
𝑁𝑒𝑡𝑤𝑜𝑟𝑡ℎ
Market Cap/ PAT ratio: It is a valuation ratio calculated by dividing Company’s market cap to net profit.
𝑀𝑎𝑟𝑘𝑒𝑡 𝐶𝑎𝑝/𝑃𝐴𝑇 𝑟𝑎𝑡𝑖𝑜 =𝑀𝑎𝑟𝑘𝑒𝑡 𝐶𝑎𝑝
𝑛𝑒𝑡 𝑝𝑟𝑜𝑓𝑖𝑡
Market Cap/ EBITDA ratio: It is a valuation ratio calculated by dividing Company’s market cap to EBITDA.

Stakeholders’ Education | Corporate Governance Research | Corporate Governance Score | Proxy Advisory
STAKEHOLDERS EMPOWERMENT SERVICES
7 | P A G E
SECTOR: CEMENT REPORTING DATE: 14TH AUGUST, 2017
ANDHRA CEMENTS LTD. www.andhracements.com
𝑀𝑎𝑟𝑘𝑒𝑡 𝐶𝑎𝑝/𝐸𝐵𝐼𝑇𝐷𝐴 𝑟𝑎𝑡𝑖𝑜 =𝑀𝑎𝑟𝑘𝑒𝑡 𝐶𝑎𝑝
𝐸𝐵𝐼𝑇𝐷𝐴
Trading Volume (shares) (avg. of 1 year): Average number of shares/day traded in 1 year
Trading volume (shares) (high in 1 year): Highest number of shares/day traded in 1 year
Trading volume (shares) (minimum in 1 year): Lowest number of shares traded on any one day in 1 year
Stakeholders’ Education | Corporate Governance Research | Corporate Governance Score | Proxy Advisory
STAKEHOLDERS EMPOWERMENT SERVICES
8 | P A G E
SECTOR: CEMENT REPORTING DATE: 14TH AUGUST, 2017
ANDHRA CEMENTS LTD. www.andhracements.com
DISCLAIMER
Sources Company Information
Only publicly available data has been used while making the factsheet. Our data sources include: BSE, NSE, SEBI, Capitaline, Moneycontrol, Businessweek, Reuters, Annual Reports, IPO Documents and Company Website.
Analyst Certification
The analysts involved in development of this factsheet certify that no part of any of the research analyst’s compensation was, is, or will be directly or indirectly related to the contents of this factsheet.
Disclaimer
While SES has made every effort and has exercised due skill, care and diligence in compiling this factsheet based on publicly available information, it neither guarantees its accuracy, completeness or usefulness, nor assumes any liability whatsoever for any consequence from its use. This factsheet does not have any approval, express or implied, from any authority, nor is it required to have such approval. The users are strongly advised to exercise due diligence while using this factsheet. This factsheet in no manner constitutes an offer, solicitation or advice to buy or sell securities, nor solicits votes or proxies on behalf of any party. SES, which is a not-for-profit Initiative or its staff, has no financial interest in the companies covered in this factsheet except what is disclosed on its website. The factsheet is released in India and SES has ensured that it is in accordance with Indian laws. Person resident outside India shall ensure that laws in their country are not violated while using this factsheet; SES shall not be responsible for any such violation. All disputes subject to jurisdiction of High Court of Bombay, Mumbai.
SEBI Reg. No. INH000000016
This factsheet or any portion hereof may not be reprinted, sold, reproduced or redistributed without the written consent of Stakeholders Empowerment Services
Contact Information
Stakeholders Empowerment Services
A 202, Muktangan, Upper Govind Nagar,
Malad East, Mumbai – 400 097
Tel +91 22 4022 0322
www.sesgovernance.com
Research Analyst: Sudarshan Shetty