ryan williams. learning objectives prepare common-sized income statements and balance sheets....
TRANSCRIPT

Financial Statement Analysis – Chapter 4
Ryan Williams

Learning ObjectivesPrepare common-sized Income Statements
and Balance Sheets.Compute financial ratios listed in Table 4.1.Discuss uses and limitations of the financial
ratios in Table 4.1.

Who does this?Creditors
• Firm’s ability to repay borrowed funds, i.e., creditworthiness
Stockholders/owners• Firm’s future prospects (cash flows )
Managers• Identify strengths & weaknesses• Improve firm performance

Two companies:Three Months Ended
April 3, 2009
NET OPERATING REVENUES $
7,169
Cost of goods sold
2,590
GROSS PROFIT
4,579
Selling, general and administrative expenses
2,624
Other operating charges
92
OPERATING INCOME
1,863
Interest income
60
Interest expense
85
Equity income — net
17
Other income (loss) — net
(40)
INCOME BEFORE INCOME TAXES
1,815
Income taxes
456
CONSOLIDATED NET INCOME
1,359
June 27,
2010
REVENUES
Sales $ 12,350
Franchise fees and royalties 1,255
License royalties 1,799
Interest income 208
Other income 14
Total revenues 15,626
COSTS AND EXPENSES
Cost of sales 9,488
Restaurant operating expenses 825
Depreciation and amortization 232
General and administrative expenses 2,564
Total costs and expenses 13,109
Income before provision for income taxes 2,517
Provision for income taxes 857
Net income $ 1,660
Step 1 -Common Size StatementsWhy common size?Allow comparisons through time
• -e.g., did company improve on last year’s performance
Allow comparisons among firms in same industry • -did company do better or worse than similar
firms in same industry
Common Size Statements – cont.How to create common size:
Balance sheet • Divide each item by total assets and express
the result in percent
Income statement• Divide each item by net sales and express the
result in percent

Common Size Statement - ContNote:In common size income statement, profit
measures are renamed. • Gross profit becomes gross profit margin• Operating income becomes operating profit margin
• Net income becomes net profit margin
Interpretation:Gross profit margin = gross profit per unit soldSimilar interpretation for operating profit
margin, net profit margin.

Step 2 – Financial RatiosExamine relationships between
• Balance sheet accounts
E.g., compare current assets to current liabilities
• Balance sheet accounts and values on the
income statement
E.g., compare net income to total assets

What ratios do we use?Liquidity ratios
Activity ratios
Debt utilization ratios
Profitability ratios
Liquidity RatiosMeasure how well company can meet short-
term obligationsCurrent ratioQuick ratio
• Same denominator as current ratio• But numerator excludes inventory
• Higher ratios mean firm is better able to meet obligations on time

Activity RatiosAlso called ‘asset utilization’ ratios or
‘efficiency’ ratiosUnused or inactive assets are nonearning
assets Either utilize assets more effectively or
eliminate them

Activity RatiosAverage collection period (ACP)
Measures how fast company collects payments from credit sales.
In number of days. Denominator uses credit sales. If not reported,
use total sales. Inventory turnover ratio
Measures how efficiently company is employing inventory.
Larger ratio more efficient. Industry specific. If COGS not available, use sales as numerator.
Activity RatiosInventory conversion period
Measures the time period that an inventory item is in stock before it is sold.
In number of daysTotal asset turnover
Measures how productive a firm’s total assets are at producing final sales.
Higher ratio means firm is more efficient in using total assets.
Industry specific.
Activity RatiosPayables period
Measures how quickly company pays its trade accounts (suppliers)
In number of days

Activity Terms, A/R and A/P industry credit terms usually include discount
for early payment Typical: 2/10 net 30• For 2/10 net 30, effective cost is 29-45% per
year
Debt Utilization RatiosMeasures the extent to which firm uses
borrowed funds to finance operations.Leverage: using debt to finance
assets/operationsDebt utilization ratios also known as leverage
ratios

Debt Utilization RatiosDebt ratio
• Measures proportion of all assets financed with debt
• Higher the ratio, higher the risk of default.Debt to equity ratio
• Ratio of total liabilities to equity

Debt Utilization RatiosTimes interest earned (TIE)
Measures how many times the firm’s annual operating earnings cover its debt-servicing charges (mainly interest).
Larger ratio means firm is more likely to pay debt-servicing charges despite a drop in sales.

Profitability RatiosCompare a firm’s earnings to various factors
that are needed to generate the earnings (assets, sales, equity)Return on assetsReturn on equityGross profit marginOperating profit marginNet profit margin

Cash conversion cycleThe length of time (in days) between cash
expenditures and cash collections• Cash expenditures: spending money to produce
goods for sale or to buy goods for resale• Cash collections: collecting money from
customers• Firm should shorten CCC without harming
business operationsCash expenditure
Cash collection
Time passes
Cash conversion cycle
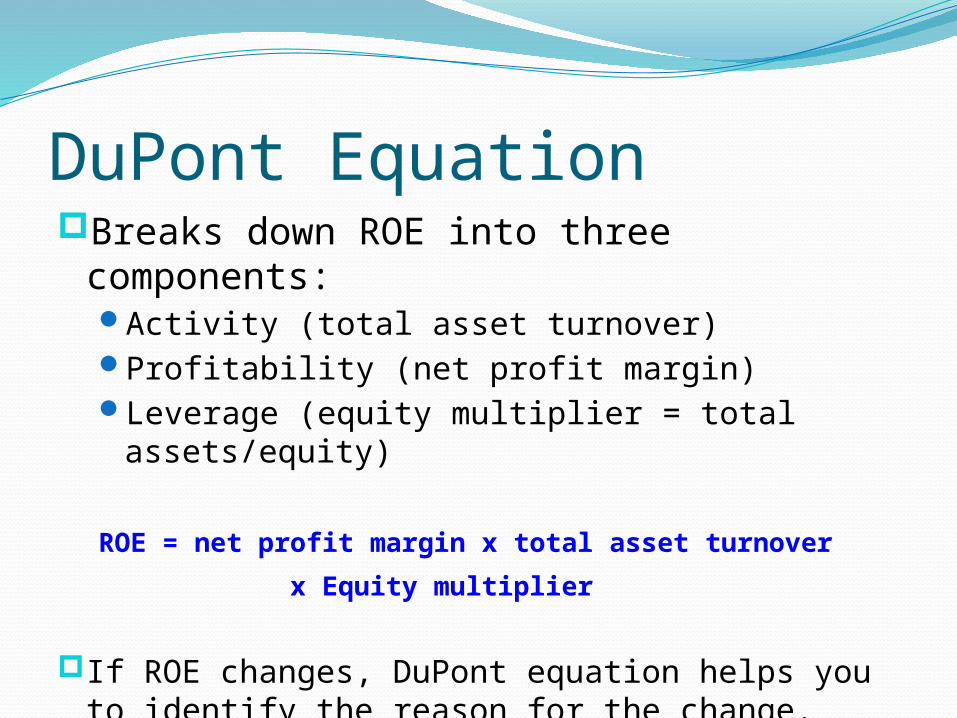
DuPont EquationBreaks down ROE into three components:
Activity (total asset turnover)Profitability (net profit margin)Leverage (equity multiplier = total
assets/equity)
ROE = net profit margin x total asset turnover
x Equity multiplier
If ROE changes, DuPont equation helps you to identify the reason for the change.
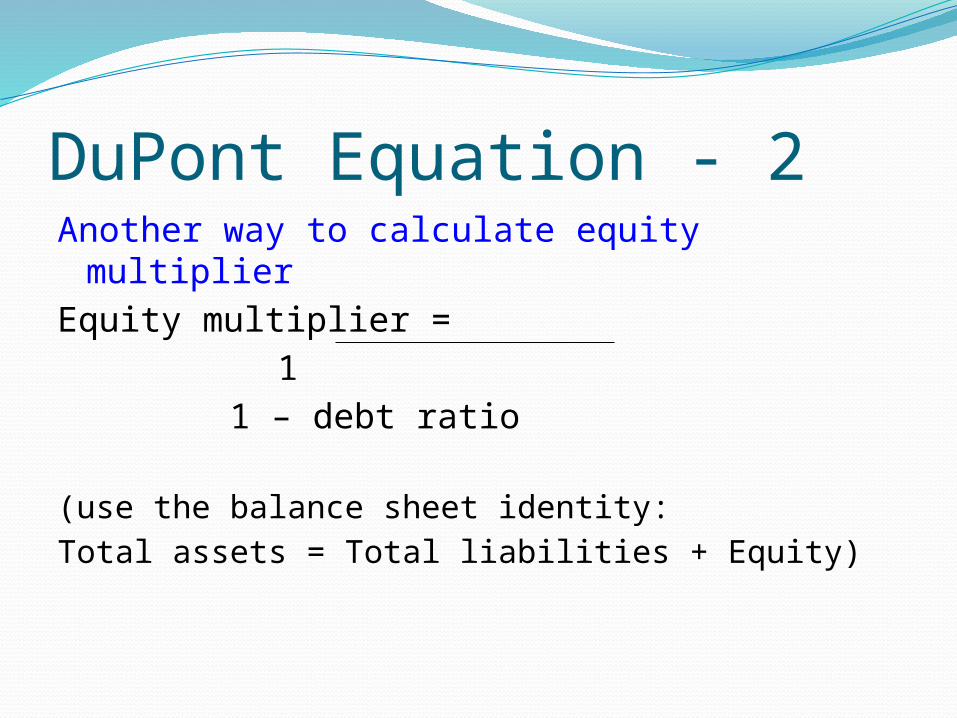
DuPont Equation - 2Another way to calculate equity multiplierEquity multiplier =
11 – debt ratio
(use the balance sheet identity:Total assets = Total liabilities + Equity)

What are the limitations?1) Balance sheet values are stock measures
• Capture values of assets & liabilities on a specific date
• Ratios using balance sheet values may not reflect company’s situation during rest of the year
• Example: A company that reports $1 million in cash on last day of fiscal year may have only $100k two days later, after paying salaries and suppliers
Limitations - 22) Financial ratios are calculated using
accounting data not market valuesAccounting data is based on an asset’s
historical costs.Market values are based on the asset’s market
value. Example: if inventory value declines below
historical cost but management did not adjust for this – every ratio involving total assets will be inaccurate.
Limitations - 33) Lack of a standard for each ratio. Example: current ratio. What is a good current
ratio value?How about using industry average ratio as
standard? Not necessarily useful. Deviations from
industry average not always bad.

What did we look at today?Reasons for conducting financial statement
analysisCommon size financial statements4 types of ratios: liquidity, activity, debt
utilization, profitabilityCash conversion cycleExtended DuPont Equation Limitations of financial ratios

Class activity