rx price watch report - aarp® official site price watch report november 2014 trends in retail...
TRANSCRIPT

Rx Price Watch ReportNovember 2014
Trends in Retail Prices of Brand NamePrescription Drugs Widely Used by
Older Americans2006 to 2013
Stephen W. SchondelmeyerPRIME Institute, University of Minnesota
Leigh PurvisAARP Public Policy Institute
601 E Street, NW | Washington, DC 20049202-434-3840 PH | 202-434-6480 F | www.aarp.org/ppi
Public Policy Institute
Rx Price Watch
AARP Public Policy Institute

Rx Price Watch ReportNovember 2014
Trends in Retail Prices of Brand NamePrescription Drugs Widely Used by
Older Americans2006 to 2013
By
Stephen W. SchondelmeyerPRIME Institute, University of Minnesota
Leigh PurvisAARP Public Policy Institute
AARP’s Public Policy Institute informs and stimulates public debate on the issues weface as we age. Through research, analysis and dialogue with the nation’s leadingexperts, PPI promotes development of sound, creative policies to address our commonneed for economic security, health care, and quality of life.
The views expressed herein are for information, debate, and discussion, and do notnecessarily represent official policies of AARP.
#2014-03November 2014© 2014, AARP.Reprinting with permission only.
AARP Public Policy Institute601 E Street, NW, Washington, DC 20049http://www.aarp.org/ppi

i
ACKNOWLEDGEMENTS
The authors gratefully acknowledge Kay Miller of Truven Health Analytics for hercomments on the detailed methodology.

ii
TABLE OF CONTENTS
ACKNOWLEDGEMENTS .............................................................................................. I
EXECUTIVE SUMMARY ............................................................................................ IV
FINDINGS..........................................................................................................................2
I. BRAND NAME PRICE TRENDS FOR MOST WIDELY USED PRESCRIPTION DRUGS............2
II. EIGHT-YEAR CUMULATIVE RETAIL PRICE CHANGES FOR MOST WIDELY USED
BRAND NAME PRESCRIPTION DRUGS, 2006 TO 2013 ....................................................5
III. A WIDE RANGE OF BRAND NAME DRUG PRICE INCREASES OCCURRED IN 2013 .........9
IV. RETAIL PRICE CHANGES FOR MOST WIDELY USED BRAND NAME PRESCRIPTION
DRUGS BY MANUFACTURER........................................................................................12
V. RETAIL PRICE CHANGES FOR MOST WIDELY USED BRAND NAME PRESCRIPTION
DRUGS BY THERAPEUTIC CATEGORY ..........................................................................14
CONCLUDING OBSERVATIONS...............................................................................16
APPENDIX A: DETAILED METHODOLOGY AND DESCRIPTION OFRETAIL PRICE DATA ..................................................................................................17
APPENDIX B: AARP MARKET BASKET EFFECT OF BRAND NAMEDRUGS FACING GENERIC COMPETITION...........................................................27
APPENDIX C: THERAPEUTIC CATEGORY ACRONYMS..................................30
LIST OF FIGURES
FIGURE 1. AVERAGE ANNUAL BRAND NAME DRUG PRICES CONTINUE TO GROW
SUBSTANTIALLY MORE THAN GENERAL INFLATION IN 2013 ........................................ 3FIGURE 2. ROLLING AVERAGE AND POINT-TO-POINT CHANGES IN RETAIL PRICES FOR
MOST WIDELY USED BRAND NAME PRESCRIPTION DRUGS WERE WELL ABOVE
INFLATION FROM 2006 TO 2013 .................................................................................... 4FIGURE 3: THE AVERAGE ANNUAL COST OF BRAND NAME DRUGS GREW
SUBSTANTIALLY IN 2013............................................................................................... 5FIGURE 4. RETAIL PRICE FOR EIGHT BRAND NAME DRUGS INCREASED BY MORE THAN
200 PERCENT FROM 2006 TO 2013 ................................................................................ 6FIGURE 5. EIGHT-YEAR CUMULATIVE CHANGE IN ANNUAL RETAIL COST OF THERAPY
IS MORE THAN $10,000 FOR CELLCEPT 500 MG TABLETS............................................. 8FIGURE 6. RETAIL PRICES INCREASED BY MORE THAN 10 PERCENT IN 2013 FOR
ALMOST TWO-THIRDS OF THE MOST WIDELY USED BRAND NAME DRUGS ................. 9FIGURE 7. SEVEN WIDELY USED BRAND NAME DRUGS HAD 1-YEAR RETAIL PRICE
INCREASES OF MORE THAN 30 PERCENT IN 2013 ........................................................ 10FIGURE 8. RETAIL PRICES FOR WIDELY USED BRAND NAME DRUG PRODUCTS
INCREASED BY MORE THAN 5 PERCENT FOR ALL BUT ONE DRUG MANUFACTURER
IN 2013........................................................................................................................ 13

iii
FIGURE 9. ALL BUT ONE THERAPEUTIC CATEGORY FOR BRAND NAME DRUGS HAD
RETAIL PRICE INCREASES THAT EXCEEDED THE RATE OF GENERAL INFLATION
IN 2013........................................................................................................................ 15
LIST OF TABLES
TABLE 1. ALL BUT ONE OF THE TOP 25 DRUG PRODUCTS IN THE BRAND NAME MARKET
BASKET HAD A RETAIL PRICE INCREASE OF MORE THAN 5 TIMES THE RATE OF
GENERAL INFLATION IN 2013...................................................................................... 11

iv
EXECUTIVE SUMMARY
Retail prices for widely used brand name prescription drugs increased substantially fasterthan general inflation in every year from 2006 to 2013. In 2013, retail prices for 227brand name prescription drugs widely used by older Americans, including Medicarebeneficiaries, increased by an average of 12.9 percent. In contrast, the general inflationrate was 1.5 percent over the same period. Brand name drug prices have routinelyincreased much faster than general inflation over the past 10 years—the entire periodduring which the AARP Public Policy Institute has been publishing this report series.
Increases in the retail price of brand name prescription drugs have a correspondingimpact on the cost of therapy for the individual and all other payers. In 2013, the averagecost of therapy for a brand name prescription drug, based on the market basket in thisstudy, was nearly $3,000 per year. Almost two-thirds of older Americans take three ormore prescription drugs on a chronic basis. Consequently, those older adults who usethree brand name prescription drugs are likely to have experienced an average annualretail cost of drug therapy of more than $8,800 in 2013.
If recent trends in brand name drug price increases continue unabated, the cost of drugswill prompt increasing numbers of older Americans to stop taking necessary medications.This will lead to poorer health outcomes and higher health care costs in the future.
Overview of Findings
In 2013, retail prices for 227 widely used brand name prescription drugs increasedby 12.9 percent. This increase was notably higher than any annual increase in theprior 7 years, which ranged from 5.7 percent to 12.3 percent.
Brand name drug prices increased more than eight times faster than generalinflation in 2013 (12.9 percent versus 1.5 percent).
The average annual cost for one brand name medication used on a chronic basiswas nearly $3,000 in 2013.
o For a consumer who takes three brand name prescription drugs on achronic basis, the annual cost of therapy would have been more than$8,800 during 2013—more than double the cost seen 8 years earlier.
Between January 2006 and December 2013, retail prices for 140 chronic usebrand name drugs that have been on the market since the beginning of the studyincreased cumulatively over 8 years by an average of 113.0 percent.
o The cumulative general inflation rate in the U.S. economy was 18.4percent during the same 8-year period.
Retail prices increased in 2013 for 97 percent (219 of 227) of the widely usedbrand name prescription drug products in the study’s market basket. All but twoof these retail price increases (217 of 227) exceeded the rate of general economicinflation in 2013.
v
Retail prices for all 32 of the drug manufacturers with at least two brand namedrug products in the study’s market basket increased faster than the rate of generalinflation (1.5 percent) in 2013.
o Twenty-two drug manufacturers, including the “All Other” category, hadaverage annual price increases for their brand name drugs of 10 percent ormore during 2013.
All but two of the 46 therapeutic categories of brand name drug products hadaverage annual retail price increases that exceeded the rate of general inflation in2013, with price increases by therapeutic category ranging from 4.2 percent to41.1 percent.
Brand Name Prescription Drug Price Increases Affect Individual Consumers andPublic Insurance Programs
This report shows that average annual increases in the retail prices of widely used brandname prescription drugs have consistently exceeded the general inflation rate. In fact, thedifference between the rate of brand name drug price increases and the rate of generalinflation has been widening over the past 8 years.
Brand name drug price increases translate into higher out-of-pocket costs, especially forconsumers who pay a percentage of drug costs (coinsurance) rather than a fixed dollaramount (copayment). Higher prices are usually passed along to consumers in the form ofincreased premiums, higher deductibles, and other forms of cost sharing.
Prescription drug price increases also affect taxpayer-funded programs like Medicare andMedicaid. For example, the Medicare Payment Advisory Commission recently attributedthe majority of “excess” growth in Medicare Part D spending to growth in the averageprice of drugs provided to enrollees. Higher government spending driven by large priceincreases eventually affects all Americans in the form of higher taxes, cuts to publicprograms, or both.
Policy makers interested in reducing the impact of brand name prescription drug pricesshould focus on options that balance the need for pharmaceutical innovation with theneed for improved health and the financial security of consumers and taxpayer-fundedprograms like Medicare and Medicaid.

1
RX PRICE WATCH REPORT:TRENDS IN RETAIL PRICES OF BRAND NAME
PRESCRIPTION DRUGS USED BY OLDER AMERICANS2006 TO 2013
AARP’s Public Policy Institute finds that average retail price increases for brand nameprescription drugs widely used by older Americans, including Medicare beneficiaries, faroutstripped the price increases for other consumer goods and services between 2006 and2013. Brand name drug prices have routinely increased much faster than general inflationover the past 10 years—the entire period since the beginning of our report series onprescription drug prices in 2004.1 In 2013, the average annual increase in retail prices2
for 227 brand name prescription drugs widely used by older Americans includingMedicare beneficiaries was 12.9 percent, and was notably higher than the rate of increaseobserved during any of the prior 7 years (i.e., 2006 to 2012), which ranged from 5.7percent to 12.3 percent. In contrast, the rate of general inflation in the U.S. economy was1.5 percent in 2013.
Increases in the retail price of brand name prescription drugs have a correspondingimpact on the cost of drug therapy for the individual and all other payers. In 2013, theaverage annual retail cost of drug therapy for a prescription drug, based on the marketbasket in this study, was nearly $3,000 per year. Almost two-thirds of older Americanstake three or more prescription drugs on a chronic basis.3 Consequently, those older
1 The AARP Public Policy Institute in its Rx Price Watch series provides reports with separate analyses ofthe price changes for three different segments of the pharmaceutical market: brand name, generic, andspecialty drug products. These three market baskets are important because a different mix of drugmanufacturers typically makes the drug products in each segment and the drug products are subject tounique market dynamics, pricing, and related behaviors. In addition, the Rx Price Watch series also reportsthe price change for an overall market basket (i.e., brand name, generic, and specialty drug productscombined) to reflect the overall market impact of drug price changes. Some critics have argued that thebrand name price index report alone overstates the effect of drug price changes on the overall prescriptiondrug market. Those critics argue that an overall measure should include the effect of generic prescriptiondrug price competition and the impact of generic substitution. This is precisely why the AARP Rx PriceWatch series of reports also provides an overall market basket (including brand name, generic, andspecialty drug products) to examine the price change impact for the overall prescription drug market. Whilethis overall perspective is useful for those interested in understanding the industrial economics of the entireprescription drug market, consumers have proven to be considerably more interested in the price trend forthe specific products that they are taking as an individual rather than all drug products on the market. Inaddition, separate analyses of the different market segments (i.e., brand name, generic, and specialty drugproducts) is important because they represent very unique and distinct segments in the prescription drugmarket and they provide an indication of policy changes that may be warranted in the various marketsegments. Previous reports from this series are on the AARP website athttp://www.aarp.org/health/medicare-insurance/info-04-2009/rx_watchdog.html andhttp://www.aarp.org/rxpricewatch.2 The retail prices used in this report are drawn from Truven Health’s MarketScan® Commercial Databaseand MarketScan® Medicare Supplemental Database (Truven Health MarketScan® Research Databases).The prices reflect the total price for a specific prescription that a pharmacy benefit manager (PBM) bills toa specific health plan for consumers enrolled in employer-sponsored or government-sponsored (i.e.,Medicare or Medicaid) health plans and not simply the out-of-pocket cost (such as the copay) which aconsumer would pay at the pharmacy. These amounts may or may not reflect what the PBM paid thepharmacy or the usual and customary price that a pharmacy would charge a cash pay consumer for thesame prescription.3 Q. Gu, C.F. Dillon, and V.L. Burt, “Prescription Drug Use Continues to Increase: U.S. Prescription DrugData for 2007–2008,” NCHS Data Brief No. 42, September 2010.
2
adults who use three brand name prescription drugs are likely to have experienced anaverage annual retail cost of drug therapy of more than $8,800 in 2013.
Prescription drug price increases also affect employers, private insurers, and taxpayer-funded programs like Medicare and Medicaid. For example, the Medicare PaymentAdvisory Commission recently attributed the majority of “excess” growth in MedicarePart D spending to growth in the average price of drugs provided to enrollees.4 Spendingincreases driven by high and growing drug prices will eventually affect all Americans insome way. Those with private health insurance will pay higher premiums and costsharing for their health care coverage5 and, over time, it could also lead to higher taxesand/or cuts to public programs to accommodate increased government spending.
This report presents annual and 8-year cumulative price changes through the end of 2013.The first set of findings shows annual rates of change in retail prices for widely usedbrand name drugs from 2006 through 2013, using both rolling average and point-to-pointmethods (see Appendix A). The point-to-point method examined the distribution of pricechanges and differences in average percent changes in retail prices for individual drugproducts, specific manufacturers, and specific therapeutic categories. The second set offindings summarizes the cumulative impact of brand name drug retail price changes thathave taken place across the entire 8-year period from 2006 through 2013.
FINDINGS
I. Brand Name Price Trends for Most Widely Used Prescription Drugs
The annual percent change in retail prices for brand name prescription drugs hasconsistently increased substantially faster than general inflation in recent years.
Retail prices for the 227 brand name drug products6 most widely used by olderAmericans rose 12.9 percent in 2013 (Figure 1).7
The average annual retail price increase in 2013 for these brand name prescriptiondrug products was more than eight times higher than the rate of general inflation(12.9 percent vs. 1.5 percent). 8
The average annual retail price increase for brand name prescription drugproducts in 2013 (12.9 percent) was more than two times higher than the averageannual brand name drug price increase in 2006 (5.7 percent).
4 Medicare Payment Advisory Commission, “Report to the Congress: Medicare Payment Policy, Chapter14: Status Report on Part D,” March 2014.5 D.I. Auerbach and A.L. Kellermann, “A Decade of Health Care Cost Growth Has Wiped Out RealIncome Gains for an Average U.S. Family,” Health Affairs, Vol 30(9) (2011): 1630-1636.6 The market basket for this analysis had 227 brand name prescription drug products. Some critics of the RxPrice Watch reports have suggested that brand name drug products in our market basket that subsequentlyface generic competition should be excluded from this analysis because they may be skewing the resultsupward. However, when only the 169 brand name drug products with no generic competition areconsidered, the average annual price change was 13.2 percent in 2013—higher than the 12.9 percent pricetrend shown in this report (for additional information and analysis, see Appendix B).7 When measured as a 12-month rolling average and weighted by actual 2011 retail prescription sales toolder Americans ages 50 and above, including Medicare beneficiaries.8 The general inflation rate used in this report is based on the average annual rate of change in theConsumer Price Index-All Urban Consumers for All Items (seasonally adjusted) (CPI-U), Bureau of LaborStatistics series CUSR0000SA0.

3
Figure 1. Average Annual Brand Name Drug Prices Continue to Grow Substantially Morethan General Inflation in 2013
5.7% 5.9%
7.9%8.4%
9.1%
11.5%12.3%
12.9%
3.2%2.9%
3.8%
-0.3%
1.6%
3.1%
2.1%1.5%
2006 2007 2008 2009 2010 2011 2012 2013
Avera
ge
Ann
ual
%C
hang
e
Brand Name Drug Prices (227 top drug products) General Inflation (CPI-U)
Note: Calculations of the average annual brand name drug price change include the 227 drug products most widely usedby older Americans (see Appendix A).Prepared by the AARP Public Policy Institute and the PRIME Institute, University of Minnesota, based on data fromTruven Health MarketScan® Research Databases.
The annual retail price change for brand name drug products reported in Figure 1averages annual point-to-point price changes for each month in a 12-month period(referred to as a rolling average change), smoothing over the entire year the annualchange in brand name drug price that occurs for a single month (referred to as an annualpoint-to-point change).
Figure 2 shows the percent change in brand name drug prices for each month comparedwith the same month in the previous year. This trend is shown alongside the 12-monthrolling average to allow more detailed examination of the rate and timing of retail brandname drug price changes over the entire study period. This analysis reveals three broadtrends since implementation of the Medicare Part D program:
The retail price of brand name drug products has steadily increased over timesince 2006;
Brand name drug price increases at the retail level have been substantially higherthan the rate of general inflation; and
The gap between the rate of brand name drug price change and the rate of changein general inflation has substantially widened over the period from 2006 to 2013.This gap has ranged from a less than two-fold difference in 2006 to a nearly nine-fold difference in 2013.

4
Figure 2. Rolling Average and Point-to-Point Changes in Retail Prices for Most WidelyUsed Brand Name Prescription Drugs Were Well Above Inflation from 2006 to 2013
Note: Calculations of the average annual brand name drug price change include the 227 drug products most widelyused by older Americans (see Appendix A).Prepared by the AARP Public Policy Institute and the PRIME Institute, University of Minnesota, based on data fromTruven Health MarketScan® Research Databases.
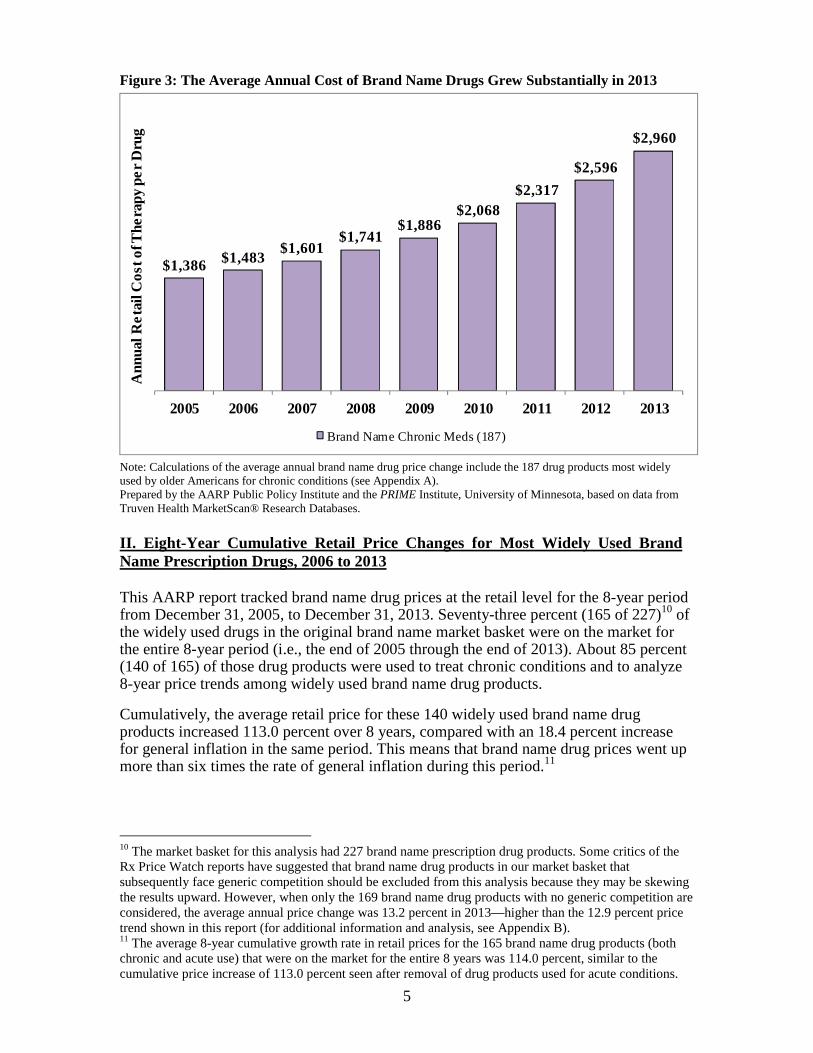
The cost of brand name drug therapy reached nearly $3,000 per drug per year in 2013.
Figure 3 presents the retail price for widely used brand name drugs indicated for treatingchronic conditions when the price is expressed as an average annual cost of therapy perdrug.
The average cost of therapy was nearly $3,000 per drug per year for brand nameprescription drugs at the retail level in 2013.
o This average annual cost ($2,960) is more than double the average annualcost ($1,386) for a brand name drug in 2006, the year Medicareimplemented Part D.
Almost two-thirds of older Americans take three or more prescription drugs in a givenyear.9 If they used brand name drugs to treat their chronic conditions, they would haveexperienced an average annual retail cost of drug therapy of $8,880 for three drugs in2013.
9 Q. Gu, C.F. Dillon, and V.L. Burt, “Prescription Drug Use Continues to Increase: U.S. Prescription DrugData for 2007–2008,” NCHS Data Brief No. 42, September 2010.
-2.0%
0.0%
2.0%
4.0%
6.0%
8.0%
10.0%
12.0%
14.0%
16.0%
Dec
-05
Ap
r-0
6
Au
g-0
6
Dec
-06
Ap
r-0
7
Au
g-0
7
Dec
-07
Ap
r-0
8
Au
g-0
8
Dec
-08
Ap
r-0
9
Au
g-0
9
Dec
-09
Ap
r-1
0
Au
g-1
0
Dec
-10
Ap
r-1
1
Au
g-1
1
Dec
-11
Ap
r-1
2
Au
g-1
2
Dec
-12
Ap
r-1
3
Au
g-1
3
Dec
-13
An
nu
al%
Ch
ange
Annual Percent Price Change (wt. avg. for point-to-point from same month in previous year)
Annual Percent Price Change (wt. avg. for 12-month rolling average)
General Inflation (CPI-U)
Affordable Care ActpassedMedicare Part D becomes available
Brand name drugmanufacturers begin
providing coverage gapdiscounts
5
Figure 3: The Average Annual Cost of Brand Name Drugs Grew Substantially in 2013
Note: Calculations of the average annual brand name drug price change include the 187 drug products most widelyused by older Americans for chronic conditions (see Appendix A).Prepared by the AARP Public Policy Institute and the PRIME Institute, University of Minnesota, based on data fromTruven Health MarketScan® Research Databases.
II. Eight-Year Cumulative Retail Price Changes for Most Widely Used BrandName Prescription Drugs, 2006 to 2013
This AARP report tracked brand name drug prices at the retail level for the 8-year periodfrom December 31, 2005, to December 31, 2013. Seventy-three percent (165 of 227)10 ofthe widely used drugs in the original brand name market basket were on the market forthe entire 8-year period (i.e., the end of 2005 through the end of 2013). About 85 percent(140 of 165) of those drug products were used to treat chronic conditions and to analyze8-year price trends among widely used brand name drug products.
Cumulatively, the average retail price for these 140 widely used brand name drugproducts increased 113.0 percent over 8 years, compared with an 18.4 percent increasefor general inflation in the same period. This means that brand name drug prices went upmore than six times the rate of general inflation during this period.11
10 The market basket for this analysis had 227 brand name prescription drug products. Some critics of theRx Price Watch reports have suggested that brand name drug products in our market basket thatsubsequently face generic competition should be excluded from this analysis because they may be skewingthe results upward. However, when only the 169 brand name drug products with no generic competition areconsidered, the average annual price change was 13.2 percent in 2013—higher than the 12.9 percent pricetrend shown in this report (for additional information and analysis, see Appendix B).11 The average 8-year cumulative growth rate in retail prices for the 165 brand name drug products (bothchronic and acute use) that were on the market for the entire 8 years was 114.0 percent, similar to thecumulative price increase of 113.0 percent seen after removal of drug products used for acute conditions.
$1,386$1,483
$1,601$1,741
$1,886$2,068
$2,317
$2,596
$2,960
2005 2006 2007 2008 2009 2010 2011 2012 2013
An
nu
alR
eta
ilC
ost
ofT
he
rap
yp
er
Dru
g
Brand Name Chronic Meds (187)

6
Three-fourths of brand name drug product prices more than doubled in 8 years.
Figure 4 presents the 8-year cumulative effect of drug price changes from the end of 2005to the end of 2013 for 8 specific brand name drug products that had the highest percentchanges in retail price. These 8 drug products are among the 123 (out of 165) brand namedrug products that have doubled in price while being on the market for the entire 8-yearstudy period.
The eight brand name drug products shown in Figure 4 had three-fold to six-foldincreases in retail price from the end of 2005 to the end of 2013. General inflation overthe same 8-year period grew less than 20 percent.
Figure 4. Retail Price for Eight Brand Name Drugs Increased by More than 200 Percentfrom 2006 to 2013
Prepared by the AARP Public Policy Institute and the PRIME Institute, University of Minnesota, based on data fromTruven Health MarketScan® Research Databases.
These eight drugs with the highest 8-year cumulative price increases were from a varietyof therapeutic classes:
Uroxatal 10 mg tablets are a drug product used to treat prostatic hypertrophy. Thisbrand name drug product had a price increase of 512.7 percent—more than a six-fold increase—over the 8-year study period ending in 2013.
Solaraze Gel 3% is a transdermal topical drug product used to treat a severe skincondition. This brand name drug product had a price increase of 445.9 percent—more than a five-fold increase—over the 8-year study period ending in 2013.
512.7%
445.9%
361.0%
295.3%
252.4%207.1%203.7%
0%
100%
200%
300%
400%
500%
600%
2006 2007 2008 2009 2010 2011 2012 2013
Uroxatral 10 mg Tablet ER (24-Hour) Solaraze Gel 3 %
Humulin R (U-500) 500 units/ml Prandin 2 mg Tablet
Atrovent HFA 17 mcg/actuation Benicar 40 mg Tablet
Lunesta 3 mg Tablet and Lunesta 2 mg Tablet
8-Y
ear
Cu
mu
lati
ve%
Ch
ange

7
Humulin R U-500—used to treat diabetes—had an 8-year price increase of 361.0percent over the entire 8-year study period ending in 2013. This retail priceincrease shows more than a four-fold jump in price over 8 years.
o It is notable that the vast majority of this increase took place over the past3 years (i.e., 2011 to 2013). Since insulins are biological products theycurrently do not have generic competition but they are likely to face entryfrom biosimilar products within the next few years.12
Prandin 2 mg tablets—another drug for diabetes—had an 8-year price increase of295.3 percent over the entire 8-year study period. This retail price increase isnearly a four-fold jump in price from 2006 to 2013.
Atrovent HFA 17 mcg/actuation—a respiratory inhaler and bronchodilator—increased in retail price by 252.4 percent over the 8-year study period. This retailprice increase is more than a three-fold jump in price over 8 years from 2006 to2013.
Benicar 40 mg tablets—used to treat hypertension—had a price increase of 207.1percent over the 8-year study period ending in 2013. This retail price increase ismore than a three-fold growth in price over 8 years.
Lunesta 3 mg tablets (and Lunesta 2 mg tablets)—drug products used forsedation—had an 8-year retail price increase of 203.7 percent. This retail priceincrease represents a three-fold price jump in 8 years.
Eight-year cumulative change in annual brand name drug cost of therapy is substantial.
Of the brand name drug products in the AARP market basket that have been on themarket since the end of 2005, 85 percent (140 of 165) treat chronic conditions.13 Theremaining 25 drug products treat acute or intermittent conditions.
The average annual retail cost of drug therapy for brand name drug products used to treatchronic conditions was $3,099 in 2013, which is an increase of $1,659 over the 2006annual cost of $1,440.
Annual cost of one brand name drug product grew more than $10,000 over 8 years.
More than one-third (50 of 140) of the brand name drugs used for chronic conditions thathave been on the market since the end of 2005 had annual cost increases of more than$1,600 during the 8 year period ending in 2013.
Figure 5 shows the widely used brand name drug products with the highest annual costhikes over the 8-year period ending in 2013.
12 L.S. Rotenstein, N. Ran, J.P. Shivers, M. Yarchoan, and K..L. Close, “Opportunities and Challenges forBiosimilars: What’s on the Horizon in the Global Insulin Market?” Clinical Diabetes, Vol. 30(4) (2012):138-150.13 The drug products in our study market basket were classified based on whether the primary indication foruse was for a chronic condition or an acute (or intermittent) condition. Eighty-five percent (140) of the 165market basket drug products that have been on the market for the 8-year period since the end of 2005 weredetermined to treat chronic conditions.

8
Figure 5. Eight-Year Cumulative Change in Annual Retail Cost of Therapy is More than$10,000 for CellCept 500 mg Tablets
Prepared by the AARP Public Policy Institute and the PRIME Institute, University of Minnesota, based on data fromTruven Health MarketScan® Research Databases.
The retail price for a 1-year supply of CellCept 500 mg tablets—animmunomodulator—increased by $10,025 over an 8-year period ending in 2013.The price rose from $8,053 per year at the end of 2005 to $18,078 by the end of2013. It is notable that the rate of price increase accelerated in the past 2 years(2012 and 2013).
The retail price of Humulin R (U-500) 500 units/ml—an insulin drug product—jumped from $2,287 at the end of 2005 to $10,519 by the end of 2013—anincrease of $8,232 per year. This substantial price hike is more than a four-foldincrease in price over an 8-year period. The vast majority of this increase tookplace over the past 2 years (2012 and 2013).
o Humulin and the other insulin drug products will likely face entry frombiosimilars products within the next few years.
The retail price of a one-year supply of Sensipar 90 mg tablets—a treatment forcertain patients with chronic kidney disease—increased by $7,421 in the eight-year period ending in 2013. The retail price for a one-year supply of this drugincreased from $10,028 in 2006 to $17,449 in 2013.
The retail price of a 1-year supply of Abilify 20 mg tablets—an atypicalantipsychotic drug—increased by $6,507 in the 8-year period ending in 2013. Theretail price for a 1-year supply of this drug rose from $5,247 in 2006 to $11,755 in2013.
$10,025
$8,232
$7,421
$6,507
$5,542
$0
$2,000
$4,000
$6,000
$8,000
$10,000
$12,000
2006 2007 2008 2009 2010 2011 2012 2013
CellCept 500 mg tablet Humulin R (U-500) 500 units/ml
Sensipar 90 mg tablet* Abilify 20 mg tablet*
Geodon 60 mg capsule*
8-Y
ear
Cum
ulat
ive
Cha
nge
inA
nnua
lC
ost
of
The
rap
y

9
The retail price of a 1-year supply of Geodon 60 mg capsules—an atypicalantipsychotic drug—increased by $5,542 in the 8-year period ending in 2013. Theretail price for a 1-year supply of this drug rose from $3,489 in 2006 to $9,030 in2013—more than a two-and-one half fold increase.
III. A Wide Range of Brand Name Drug Price Increases Occurred in 2013
Retail prices for 97 percent (219 of 227) of the most widely used brand name prescriptiondrug products had price increases in 2013 (Figure 6). Prices for 96 percent (217 of 227)of the most widely used brand name prescription drug products increased faster than therate of general inflation (1.5 percent) in 2013.
Among the 87 percent (197 of 227) of brand name drug products with annual retail priceincreases of more than 5.0 percent—or more than three times the rate of inflation—in2013:
Fifty-four (23.8 percent) increased by 5.0 percent to 9.9 percent;
Fifty-eight (25.6 percent) increased by 10.0 percent to 14.9 percent;
Fifty -five (24.2 percent) increased by 15.0 percent to 19.9 percent; and
Thirty (13.2 percent) increased by 20 percent to as much as 197.5 percent.
Figure 6. Retail Prices Increased by More than 10 Percent in 2013 for Almost Two-Thirdsof the Most Widely Used Brand Name Drugs
Note: Calculations were made using brand name drug price change from December 31, 2012 to December 31, 2013,and the analysis included the 227 brand name drug products most widely used by older Americans (see Appendix A).Prepared by the AARP Public Policy Institute and the PRIME Institute, University of Minnesota, based on data fromTruven Health MarketScan® Research Databases.
-0.1% to -5.8%decrease8 Drugs
0.1% to 4.9%increase22 Drugs
54 Drugs
58 Drugs
55 Drugs
20.0% - 24.9%increase19 Drugs 25.0% - 197.5%
increase11 Drugs
10.0% to 14.9%increase
15.0% - 19.9%increase
5.0% to 9.9%increase
Percent Change in Retail Price(TOTAL = 227 Drugs)
12-Month Rate of General Inflation = 1.5%

10
Retail prices of two widely used brand name prescription drug products (Combigan 0.2-0.5% Ophthalmic and Avapro 150 mg tablets used for hypertension) fell by 5.8 percentand 2.3 percent, respectively, in 2013 when compared with 2012. Six other brand namedrug products had a decrease in price that was 1.1 percent or less between 2012 and 2013.
Seven of the 227 widely used brand name drug products had retail price increases ofmore than 30 percent in 2013 (Figure 7). One brand name drug product (Uroxatral 10 mgextended release tablets used for prostatic hypertrophy) had a price increase of 197.5percent in 2013 when compared with 2012.
Figure 7. Seven Widely Used Brand Name Drugs Had 1-Year Retail Price Increases ofMore than 30 Percent in 2013
The general inflation rate is based on CPI-U (See Consumer Price Index-All Urban Consumers for All Items[seasonally adjusted] [CPI-U], Bureau of Labor Statistics series CUSR0000SA0).Prepared by the AARP Public Policy Institute and the PRIME Institute, University of Minnesota, based on data fromTruven Health MarketScan® Research Databases.
All of the 25 top-selling brand name drug products in the market basket had retail priceincreases in 2013 when compared with 2012 (Table 1). All but one (24 of 25) of thesetop-selling brand name drug products had a price increase of 7.6 percent or more in2013—more than five times the rate of general inflation (1.5 percent) in 2013.
Nearly one-half (12 of 25) of the top 25 drug products had price increases of 15.0 percentor more in 2013—at least 10 times the rate of general inflation. One of the top 25 drugproducts (Lantus 100 units/ml) had a price increase of 27.4 percent in 2013.
30.6%
32.2%
34.0%
38.0%
67.0%
78.6%
197.5%
0% 50% 100% 150% 200%
Welchol 625 mg tablet
Aciphex 20 mg tablet DR
Lunesta 2 mg tablet*
Prandin 2 mg tablet
Solaraze 3 % Gel
Actonel 150 mg tablet
Uroxatral 10 mg tablet ER
Annual % Change
Brand Name Retail Price General Inflation (1.5%)

11
Table 1. All But One of the Top 25 Drug Products in the Brand Name Market Basket Had a Retail Price Increaseof More than 5 Times the Rate of General Inflation in 2013
Rank bySales
among2013
MarketBasket*
Product Name, Strength, andDosage Form
PkgSize Manufacturer Therapeutic Class
2013RetailPricePerDay
AnnualPercentChange
inRetailPrice
1 Plavix 75 mg tablet 90 Bristol-Myers Squibb Platelet Aggregation Inhibitors $6.59 0.2%
2 Nexium 40 mg DR capsule 30 AstraZeneca Ulcer Drugs (PPIs) $7.74 18.4%
3 Lipitor 20 mg tablet 90 Pfizer Cholesterol Agents (HMG CoA) $6.94 18.5%
4 Lantus 100 units/ml 10 Sanofi-Aventis Antidiabetics (Insulins) $8.71 27.4%
5 Lipitor 40 mg tablet 90 Pfizer Cholesterol Agents (HMG CoA) $6.93 18.4%
6 Singulair 10 mg tablet 100 Merck Sharp & Dohme Other Therapeutic Agents $5.92 8.3%
7 Spiriva HandiHaler 18 mcg capsule 30 Boehringer Ingelheim Respiratory Agents (Bronchodilators) $9.59 7.6%
8 Lipitor 10 mg tablet 90 Pfizer Cholesterol Agents (HMG CoA) $4.84 17.9%
9 Advair Diskus 250-50 mcg/dose 60 Glaxo Smith Kline Respiratory Agents (Combinations) $9.21 9.6%10 Crestor 10 mg tablet 90 AstraZeneca Cholesterol Agents (HMG CoA) $5.94 12.2%
11 Celebrex 200 mg capsule 100 Pfizer Anti-Inflammatory Agents (COX-2) $5.99 19.5%
12 Januvia 100 mg tablet 30 Merck Sharp & Dohme Antidiabetics (Oral) $8.88 14.6%
13 Zetia 10 mg tablet 30 Merck/Schering-Plough Cholesterol Agents (HMG CoA) $5.61 13.8%
14 Cymbalta 60 mg capsule DR 30 Lilly Antidepressants (SNRIs) $7.50 11.9%
15 Actos 30 mg tablet 30 Takeda Antidiabetics (Oral) $12.50 22.1%
16 Namenda 10 mg tablet 60 Forest Antidementia Agents $9.33 11.2%
17 Tricor 145 mg tablet 90 Abbott Cholesterol Agents (Misc.) $6.05 9.3%
18 Actos 45 mg tablet 30 Takeda Antidiabetics (Oral) $13.50 22.0%19 Crestor 20 mg tablet 90 AstraZeneca Cholesterol Agents (HMG CoA) $5.93 11.9%20 Lidoderm 5 % patch 30 Endo Pharmaceuticals Dermatologicals $8.84 15.0%
21 Lipitor 80 mg tablet 90 Pfizer Cholesterol Agents (HMG CoA) $6.92 18.3%
22 Novolog FlexPen 100 units/ml 3 Novo Nordisk Antidiabetics (Insulins) $11.24 21.5%
23 Lexapro 10 mg tablet 100 Forest Antidepressants (SSRIs) $5.42 18.9%
24 Lovaza 1 Gm capsule 120 Glaxo Smith Kline Cholesterol Agents (Misc.) $7.28 14.0%
25 Evista 60 mg tablet 100 Lilly Osteoporosis Agents $6.30 13.4%
General rate of inflation (as measured by growth in CPI-U) 1.5%*Ranking based on 2011 spending data provided by the Truven Health MarketScan® Research Databases and a Medicare Part D plan provider.See Appendix A; also see Appendix C for an explanation of therapeutic category acronyms.Prepared by the AARP Public Policy Institute and the PRIME Institute, University of Minnesota, based on data from Truven HealthMarketScan® Research Databases.

12
IV. Retail Price Changes for Most Widely Used Brand Name Prescription Drugsby Manufacturer
Thirty-two drug manufacturers had at least two drug products in the study’s marketbasket of 227 widely used brand name drugs. Another eight drug manufacturers withonly one brand name drug product in the market basket were grouped into the “AllOther” category.
The average annual increase in retail price for all 33 of these drug manufacturercategories exceeded the general inflation rate in 2013 (Figure 8), suggesting that brandname drug price trends in this report are an industry-wide phenomenon.
All but one of the drug manufacturers—including the “all others” category—hada weighted average annual brand name drug price increase at the retail level ofmore than 5 percent in 2013—more than three times the rate of general inflation(1.5 percent) in 2013.
Twenty-nine drug manufacturers—21 drug manufacturers with 2 or more drugproducts in the market basket and the 8 drug manufacturers in the “all other”category—had weighted average brand name drug price increases of more than 10percent in 2013, or more than six times the rate of general inflation (1.5 percent)in 2013.
o These 29 drug manufacturers represent 77 percent (175 of 227) of thebrand name drug products in the market basket in 2013.
Twenty drug manufacturers—12 manufacturers with 2 or more drug products inthe market basket and 8 manufacturers in the “all other” category—had weightedaverage brand name drug price increases of at least 15.0 percent in 2013, or morethan 10 times the rate of general inflation (1.5 percent) in 2013.
Two of the drug manufacturers—Sanofi-Aventis and Eisai—had weightedaverage annual brand name drug price increases at the retail level of more than 20percent in 2013.
o Sanofi-Aventis had a weighted average annual increase of 27.9 percent in2013, which is more than 18 times the rate of general inflation.
o Eisai had a weighted average annual increase of 22.2 percent in 2013,which is more than 14 times the rate of general inflation.

13
Figure 8. Retail Prices for Widely Used Brand Name Drug Products Increased by Morethan 5 Percent for All but One Drug Manufacturer in 2013
Note: Calculations of the average annual brand name drug price change include the 227 drug products most widelyused by older Americans (see Appendix A). Manufacturers with only one drug product in the market basket of 227most widely used brand name prescription drugs were included in the “All Others” category. The number inparentheses after a manufacturer’s name indicates the number of drug products in the market basket for thatmanufacturer. The general inflation rate is based on CPI-U for 2013.Prepared by the AARP Public Policy Institute and the PRIME Institute, University of Minnesota, based on data fromTruven Health MarketScan® Research Databases.
2.7
5.1
6.1
6.5
6.8
7.5
7.6
7.7
8.6
9.4
9.4
10.4
10.6
10.7
10.8
12.0
13.2
13.7
13.9
14.5
15.6
15.7
15.9
16.4
16.6
16.6
16.9
17.0
17.1
18.1
19.5
22.2
27.9
Bristol-Myers Squibb (11)
Purdue Pharma (6)
Dista (3)
Gilead Sciences (2)
Amgen (3)
Genentech (4)
Teva Pharmaceuticals (3)
Allergan (5)
Merck Sharp & Dohme (7)
Galderma (2)
Alcon Vision (6)
Boehringer Ingelheim (8)
Glaxo Smith Kline (11)
Astellas (2)
AstraZeneca (18)
Warner Chilcott (7)
Janssen (4)
Schering (4)
Sankyo (7)
Abbott (11)
Novartis (16)
Merck/Schering-Plough (4)
Endo Pharmaceuticals (2)
All Other (8)
Pfizer (24)
Lilly (15)
Novo Nordisk (5)
Takeda (9)
Forest (6)
Wyeth (5)
Sunovion Pharmaceuticals (3)
Eisai (2)
Sanofi-Aventis (4)
Average Annual % Change
Brand Name Retail Price General Inflation (1.5%)
14
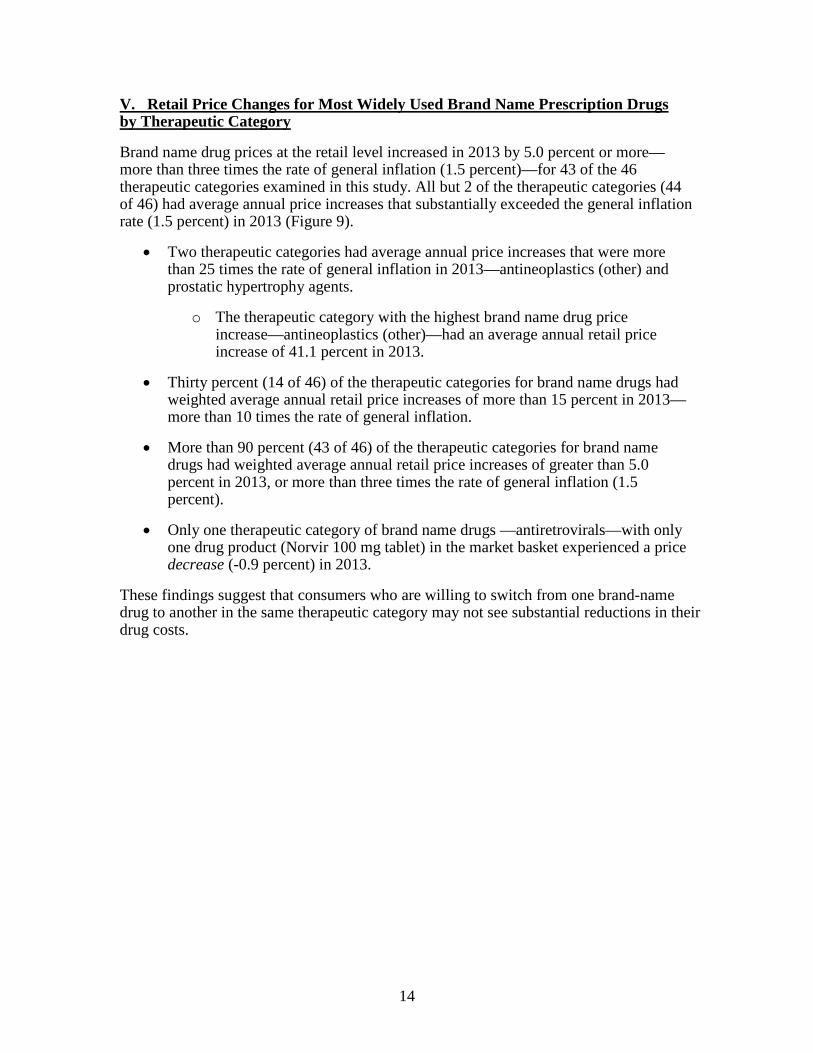
V. Retail Price Changes for Most Widely Used Brand Name Prescription Drugsby Therapeutic Category
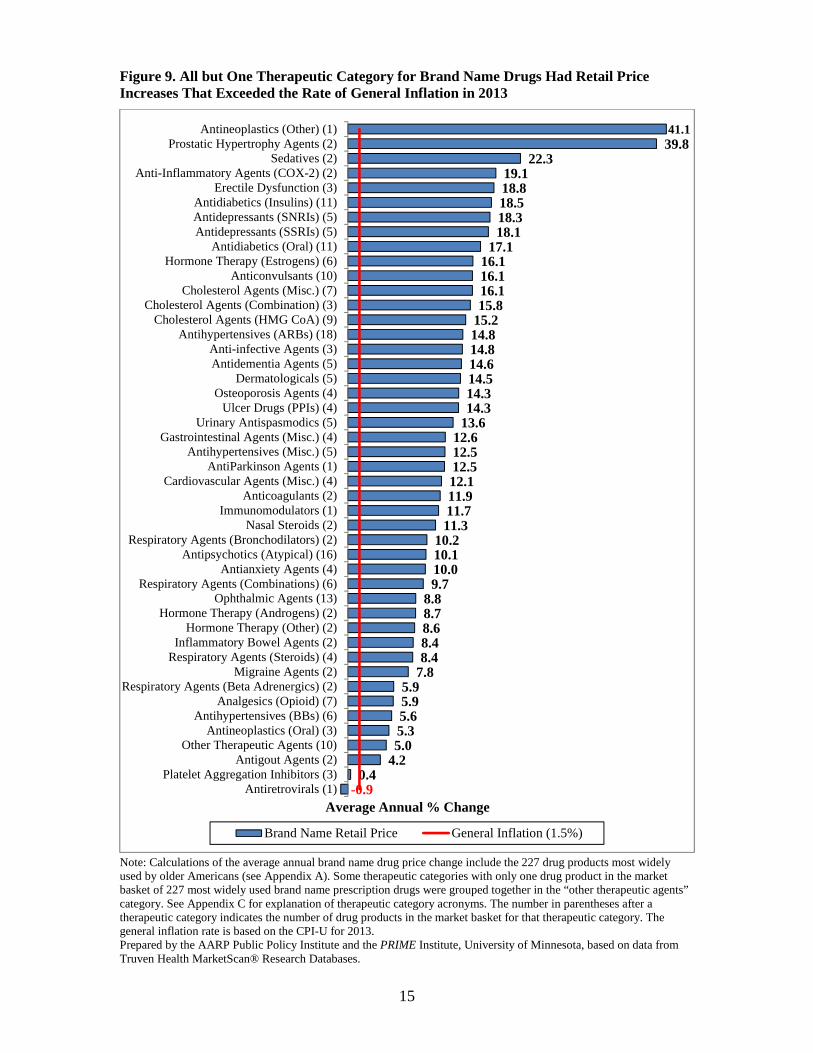
Brand name drug prices at the retail level increased in 2013 by 5.0 percent or more—more than three times the rate of general inflation (1.5 percent)—for 43 of the 46therapeutic categories examined in this study. All but 2 of the therapeutic categories (44of 46) had average annual price increases that substantially exceeded the general inflationrate (1.5 percent) in 2013 (Figure 9).
Two therapeutic categories had average annual price increases that were morethan 25 times the rate of general inflation in 2013—antineoplastics (other) andprostatic hypertrophy agents.
o The therapeutic category with the highest brand name drug priceincrease—antineoplastics (other)—had an average annual retail priceincrease of 41.1 percent in 2013.
Thirty percent (14 of 46) of the therapeutic categories for brand name drugs hadweighted average annual retail price increases of more than 15 percent in 2013—more than 10 times the rate of general inflation.
More than 90 percent (43 of 46) of the therapeutic categories for brand namedrugs had weighted average annual retail price increases of greater than 5.0percent in 2013, or more than three times the rate of general inflation (1.5percent).
Only one therapeutic category of brand name drugs —antiretrovirals—with onlyone drug product (Norvir 100 mg tablet) in the market basket experienced a pricedecrease (-0.9 percent) in 2013.
These findings suggest that consumers who are willing to switch from one brand-namedrug to another in the same therapeutic category may not see substantial reductions in theirdrug costs.
15
Figure 9. All but One Therapeutic Category for Brand Name Drugs Had Retail PriceIncreases That Exceeded the Rate of General Inflation in 2013
Note: Calculations of the average annual brand name drug price change include the 227 drug products most widelyused by older Americans (see Appendix A). Some therapeutic categories with only one drug product in the marketbasket of 227 most widely used brand name prescription drugs were grouped together in the “other therapeutic agents”category. See Appendix C for explanation of therapeutic category acronyms. The number in parentheses after atherapeutic category indicates the number of drug products in the market basket for that therapeutic category. Thegeneral inflation rate is based on the CPI-U for 2013.Prepared by the AARP Public Policy Institute and the PRIME Institute, University of Minnesota, based on data fromTruven Health MarketScan® Research Databases.
-0.90.4
4.25.05.35.65.95.9
7.88.48.48.68.78.8
9.710.010.110.2
11.311.711.912.112.512.512.6
13.614.314.314.514.614.814.815.215.816.116.116.1
17.118.118.318.518.819.1
22.339.841.1
Antiretrovirals (1)Platelet Aggregation Inhibitors (3)
Antigout Agents (2)Other Therapeutic Agents (10)
Antineoplastics (Oral) (3)Antihypertensives (BBs) (6)
Analgesics (Opioid) (7)Respiratory Agents (Beta Adrenergics) (2)
Migraine Agents (2)Respiratory Agents (Steroids) (4)Inflammatory Bowel Agents (2)
Hormone Therapy (Other) (2)Hormone Therapy (Androgens) (2)
Ophthalmic Agents (13)Respiratory Agents (Combinations) (6)
Antianxiety Agents (4)Antipsychotics (Atypical) (16)
Respiratory Agents (Bronchodilators) (2)Nasal Steroids (2)
Immunomodulators (1)Anticoagulants (2)
Cardiovascular Agents (Misc.) (4)AntiParkinson Agents (1)
Antihypertensives (Misc.) (5)Gastrointestinal Agents (Misc.) (4)
Urinary Antispasmodics (5)Ulcer Drugs (PPIs) (4)
Osteoporosis Agents (4)Dermatologicals (5)
Antidementia Agents (5)Anti-infective Agents (3)
Antihypertensives (ARBs) (18)Cholesterol Agents (HMG CoA) (9)
Cholesterol Agents (Combination) (3)Cholesterol Agents (Misc.) (7)
Anticonvulsants (10)Hormone Therapy (Estrogens) (6)
Antidiabetics (Oral) (11)Antidepressants (SSRIs) (5)Antidepressants (SNRIs) (5)Antidiabetics (Insulins) (11)
Erectile Dysfunction (3)Anti-Inflammatory Agents (COX-2) (2)
Sedatives (2)Prostatic Hypertrophy Agents (2)
Antineoplastics (Other) (1)
Average Annual % Change
Brand Name Retail Price General Inflation (1.5%)
16
CONCLUDING OBSERVATIONS
Retail prices increased substantially in 2013 for brand name prescription drugs used byolder Americans. Average annual increases in the retail prices of widely used brand nameprescription drugs have consistently exceeded the rate of general inflation (12.9 percentcompared with 1.5 percent). The gap between brand name drug price increases and therate of general inflation has been growing wider over the past few years.
Brand name drug prices at the retail level have a direct impact on the costs borne byindividual consumers and by all other payers. Brand name drug price increases oftenresult in higher out-of-pocket costs for beneficiaries at the pharmacy, especially for thosewho pay a percentage of drug costs rather than a fixed copayment. Higher brand namedrug prices are also passed along to consumers, or the end payer, in the form of increasedpremiums, higher deductibles, and other forms of cost sharing.14
Prescription drug price increases also affect taxpayer-funded programs like Medicare andMedicaid. For example, the Medicare Payment Advisory Commission recently attributedthe majority of “excess” growth in Medicare Part D spending to growth in the averageprice of drugs provided to beneficiaries. Higher government spending driven by largedrug price increases will eventually affect all Americans in the form of higher taxes, cutsto public programs, or both.
If recent trends in brand name drug prices and related price increases continue unabated,the cost of drugs will prompt increasing numbers of older Americans to stop takingnecessary medications.15 This will lead to poorer health outcomes and higher health carecosts in the future.16 Given expectations that health care reform will greatly expand thenumber of people using prescription drugs,17 it is unclear what factors are driving thecontinued price increases of brand name prescription drugs.
Policy makers interested in reducing the impact of brand name prescription drug pricesshould focus on options that balance the need for pharmaceutical innovation with theneed for improved health and the financial security of consumers and taxpayer-fundedprograms like Medicare and Medicaid.
14 D.I. Auerbach and A.L. Kellermann, “A Decade of Health Care Cost Growth Has Wiped Out RealIncome Gains for an Average U.S. Family,” Health Affairs, Vol. 30(9) (2011): 1630-1636.15 H. Naci, S.B. Soumerai, D. Ross-Degnan, F. Zhang, B.A. Briesacher, J.H. Gurwitz, and J.M. Madden ,“Medication Affordability Gains Following Medicare Part D Are Eroding among Elderly with MultipleChronic Conditions,” Health Affairs, Vol. 33(8) (2014): 1435-1443.16 Z.A. Marcum, M.A. Sevick, and S.M. Handler, “Medication Nonadherence A Diagnosable and TreatableMedical Condition,” Journal of the American Medical Association, Vol. 309(20) (2013): 2105-2106.17 A.M. Sisko, S.P. Keehan, G.A. Cuckler, A.J. Madison, S.D. Smith, C.J. Wolfe, D.A. Stone, J.M.Lizonitz, and J.A. Poisal , “National Health Expenditure Projections, 2013-23: Faster Growth Expectedwith Expanded Coverage and Improving Economy,” Health Affairs, Vol. 33(10) (2014): 1-10.

17
APPENDIX A: DETAILED METHODOLOGY AND DESCRIPTIONOF RETAIL PRICE DATA
This appendix describes in detail how brand, generic, and specialty drugs aredefined in this study; how the study identified the market basket (i.e., sample) ofdrugs; how it measured prices; and how it calculated weighted average pricechanges. In addition, it describes methods and assumptions used to determineprices and price changes by drug manufacturer and by therapeutic category.
Overview
AARP’s Public Policy Institute has been publishing a series of reports that track pricechanges for the prescription drug products most widely used by older Americans withannual and quarterly results reaching as far back as 2000. Since 2008, these reports havefocused on price changes for three market baskets—brand, generic, and specialty drugs.In addition, a combined market basket (i.e., brand, generic, and specialty) has been addedto the series, which is useful to view the price change trend across all types ofprescription drugs in the U.S. market. While this overall perspective is useful for thoseinterested in understanding the industrial economics of the entire prescription drugmarket, consumers have proven to be considerably more interested in the price trend forthe specific products that they are taking as an individual rather than all drug products onthe market.
The AARP Public Policy Institute and the University of Minnesota’s PRIME Instituteoriginally collaborated to report an index of manufacturers’ drug price changes based onthe Wholesale Acquisition Cost (WAC) from the Medi-Span Price-Chek PC database.18
In 2009, AARP and the PRIME Institute created an additional drug price index based onretail prices19 from Truven Health’s MarketScan® Commercial Database andMarketScan® Medicare Supplemental Database (Truven Health MarketScan® ResearchDatabases).20 Thus, the report series uses the same market basket of brand nameprescription drugs widely used by older Americans to examine both manufacturer-levelprices and retail-level prices in the market. The addition of retail-level prices allows theAARP Public Policy Institute to assess what prices payers (i.e., insurers, consumers or
18 Medi-Span is a private organization that collects price and other clinical and drug-related data directlyfrom drug manufacturers and wholesalers. Price-Chek PC (now Price Rx®) is a product of Medi-Span(Indianapolis, IN), a division of Wolters Kluwer Health, Inc., and uses data from the Master Drug Database(MDDB®). This commercial drug database has been published for more than 35 years. Seehttp://www.medispan.com.19 The retail prices used in this report series reflect the total price for a specific prescription that a PBM billsto a specific health plan for consumers enrolled in employer-sponsored or government-sponsored (i.e.,Medicare or Medicaid) health plans and not simply the out-of-pocket cost (such as the copay) which aconsumer would pay at the pharmacy. These amounts may or may not reflect what the PBM paid thepharmacy or the usual and customary price that a pharmacy would charge a cash-pay consumer for thesame prescription.20 The Truven Health MarketScan® Research Databases, a family of databases, contain individual-levelhealth care claims, lab test results, and hospital discharge information from large employers, managed careorganizations, hospitals, Medicare, and Medicaid programs. Truven Health constructs the MarketScan®Research Databases by collecting data from employers, health plans, and state Medicaid agencies andplacing them into databases. E. Danielson, “White Paper: Health Research Data for the Real World: TheMarketScan® Databases,” Truven Health Analytics, January 2014.
18
government programs) are paying and whether rebates and other types of discounts havebeen passed along to payers and their covered members.
Recently, the AARP Public Policy Institute and the University of Minnesota’s PRIMEInstitute collaborated again to develop a new market basket of widely used prescriptiondrugs based on 2011 data provided by the Truven Health MarketScan® ResearchDatabases and a Medicare Part D plan provider. UnitedHealthcare provides MedicarePart D coverage and is the organization that insures the AARP Medicare Rx plans. ThisMedicare Part D plan provider supplied data for all prescriptions provided to its MedicarePart D enrollees in 2011. This Rx Price Watch reports used the 2011 market basket. As inthe past, the series will include separate data sets, analyses, and reports for brand name,generic, and specialty drugs, as well the overall combined market basket.
Defining Brand, Generic, and Specialty Pharmaceuticals
A brand name drug is defined as a product marketed by the original holder of a new drugapplication (NDA) or biological license application (BLA) (or related licensees) for agiven drug entity. A generic drug is defined as any drug product marketed by an entityother than the NDA or BLA holder or related licensees.
The market conditions and pricing behavior for brand name and generic drugs are quitedifferent. For example, brand name drugs have a monopoly based on patents and otherforms of exclusivity for a number of years after market entry,21 and they do notexperience typical price competition from therapeutically equivalent drug products thatcan be routinely substituted at the pharmacy level. On the other hand, generic drugproducts face price competition from the time the generic first enters the market whenthere are two or more therapeutically equivalent drug products (as evaluated by the Foodand Drug Administration [FDA] and reported in the Orange Book), including the brandname product. However, certain generic drugs—that is, those for which the manufacturerfiles a paragraph IV certification of patent non-infringement—may receive 180 days ofexclusivity as the sole generic after this first generic drug product is approved. In caseswhere there is only one generic drug product on the market, the level of economiccompetition may be somewhat limited until other generics enter the market.
Specialty pharmaceuticals are drugs that treat complex, chronic conditions and that oftenrequire special administration, handling, and care management. Specialty drugs areexpected to be the fastest growing group of drug products in the next decade. Thisimportant group of drugs and biologicals is not precisely defined, but it includes productsbased on one or more of the following: (1) how they are made, (2) how they are approvedby the FDA, (3) conditions they treat, (4) how they are used or administered, (5) theircost, and (6) other special features. The operational definition of specialty drugs for thisstudy is further described in a later section of the methodology.
Creating the Market Basket of Drugs
The AARP Public Policy Institute has been reporting prescription drug product pricechanges since 2004. The original reports were based on a market basket of retail and
21 The average market exclusivity period for a brand name drug is almost 13 years. H. Grabowski, G. Long,and R. Mortimer, “Brief report: Recent trends in brand-name and generic drug competition,” Journal ofMedical Economics, Vol. 17(3) (2014): 207-214.

19
mail-order prescriptions provided to about two million people ages 50 and older whoused the AARP Pharmacy Service in 2003. Following the implementation of theMedicare Part D program, we chose to develop a new market basket of drugs using 2006data provided by UnitedHealthcare–PacifiCare, now UnitedHealthcare, which is also theorganization that insures the AARP Medicare Part D plans. All AARP price trend reportspublished between 2007 and 2012 used this market basket.
Subsequently, we updated the AARP market baskets again using 2011 data provided byTruven Health MarketScan® Research Databases and the same Medicare Part D planprovider that was used for the 2006 market basket. We weighted the data from theMedicare Part D plan provider by Part D enrollment and the Truven Health MarketScan®data by the 50 plus population less Part D enrollment, based on data from the Centers forMedicare and Medicaid Services and the U.S. Census. We then merged the weighted datato develop and rank a weighted master list by prescription volume and sales at theNational Drug Code (NDCs) level for the new AARP market baskets.
Our selection of the market basket of drugs to track in the price index was a multi-stepprocess. First, prescriptions covered and adjudicated by the commercial entities includedin the merged data set were grouped by NDC number. The NDC is a number that refersto a specific drug product presentation with a unique combination of active chemicalingredient, strength, dosage form, package type and size, and manufacturer (e.g., Nexium[esomeprazole magnesium] 40 mg, capsule, bottle of 30, AstraZeneca). As a result, somedrug entities (i.e., molecules) could appear more than once among the widely used drugproducts e.g., when there are different strengths, such as Lipitor 10 mg, Lipitor 20 mg,and Lipitor 40 mg). For each NDC, we calculated total sales revenue from adjudicatedprescription claims, including the patient cost-sharing amount, as well as the totalprescriptions dispensed, the total units supplied, and the total days of therapy providedduring 2011.
The next step involved merging the use and expenditure data from the Truven HealthMarketScan® Research Databases and the Medicare Part D plan provider by NDC codeand then linking the data with descriptive information from Medi-Span’s Price Rx® drugdatabase,22 using the NDC number as the key linking variable. The descriptive data fromPrice Rx included drug product information such as brand name, generic name,manufacturer, patent status, package size, route of administration, usual dose, therapeuticcategory, usual duration, and each drug product’s price history.
All NDCs were classified by the patent status of the drug product presentation—that is,patented brand name (i.e., brand single source [SS]), off-patent brand name (i.e., brandmultiple source [BMS] or innovator multiple source [IMS]), and off-patent generic (i.e.,generic multiple source [GMS] or non-innovator multiple source [NMS]). We thengrouped all NDC numbers by the Generic Product Indicator (GPI) code into GPI-patentstatus groups using the GPI code from Price Rx®. The GPI combines drug products intoa common group when they have the same active ingredients, dosage form, andstrength—a single GPI includes the NDCs for any package type and size and from allmanufacturers. When patent status is combined with the GPI categories, each GPI willtypically be either a single source GPI (GPI-brand-single source) or a multiple source
22 Price Rx® is a product of Medi-Span (Indianapolis, IN), a division of Wolters Kluwer Health, Inc., andis based on data from the Master Drug Database (MDDB®).
20
GPI with both a GPI-brand multiple source group and a GPI-generic multiple sourcegroup.
The next step involved summing the total expenditures, number of prescriptionsdispensed, and days of therapy provided across all NDCs within each GPI-patent statusgroup. The NDCs within each GPI-patent status group were then rank ordered based ontotal annual expenditure for each NDC. The designated “representative NDC” was theNDC that had the highest level of expenditure within each GPI-patent status group. If theNDC with the greatest expenditure level was inactive, the NDC with the next highestlevel of expenditure became the representative NDC.
This analysis excluded less than 0.5 percent of the expenditures and the prescriptionsbecause they were for non-drug items. These non-drug items included devices, medicaland diabetic supplies, syringes, compounding service fees, and other professionalservices. After exclusion of non-drug items, the 2011 data set contained 35,119 NDCsgrouped into 6,710 GPI-patent status categories.
We then coded all GPIs to distinguish the specialty prescription drugs from other regularprescription drugs. The definition of specialty prescription drugs used here is aprescription drug that is: (1) administered by injection, such as intravenous,intramuscular, sub-cutaneous, or other injection site (not including insulin); (2) anydosage form that has a total average prescription cost greater than $1,000 perprescription; or (3) any dosage form that has a total average cost per day of therapygreater than $33 per day. The drugs meeting this definition were considered “specialtydrugs” and all other prescription drugs were considered “regular” or “non-specialtydrugs.” Throughout this report, references to the market basket of drugs refer to theregular (non-specialty) drugs unless otherwise indicated. Only specialty drugs providedthrough a Medicare Part D program or under a prescription drug benefit program areincluded. The specialty drugs provided under Medicare Part B, or under a commercialhealth plan and administered in a clinic or physician’s office and billed as a medicalclaim, are not included in this data set or this analysis.
All NDCs were classified by the patent status of the drug product presentation—that is,patented brand name (or SS), off-patent brand name (or IMS), or off-patent generic(NMS). We classified both the regular and the specialty drug data sets by patent status.
We sorted the list of all GPI-patent status groups in the merged data set for 2011 by threecriteria: (1) total prescription expenditures, (2) number of prescriptions dispensed, and (3)days of therapy provided. The top 400 GPI-patent status categories were identified foreach of these three criteria. Since some GPI-patent status groups appeared in more thanone of these top 400 lists, the combined list of all GPI-patent status groups totaled to 627GPI-patent status groups. There were 227 brand name GPI-patent status groups (i.e., bothbrand single source and brand multiple source) and 283 generic GPI-patent status groups.Another 117 GPI-patent status groups in this combined top 400 list were classified asspecialty drugs.
The three market baskets (brand name, generic, and specialty drugs) combined accountedfor 83.0 percent of all prescription drug expenditures and 82.8 percent of all prescriptionsdispensed.
21
Monitoring Retail Drug Prices
The original Rx Watchdog reports were based on market baskets of drugs constructedusing data from a Medicare Part D plan provider for 2006 and manufacturer drug pricechanges measured using WAC data from the Medi-Span Price-Chek PC database. TheAARP Public Policy Institute and the University of Minnesota’s PRIME Institutecollaborated to develop a new retail drug price index known as the Rx Price Watchreports based on retail-level prescription prices from the Truven Health MarketScan®Research Databases. This retail price index allows the AARP Public Policy Institute toassess retail prices actually paid by consumers or insurers and whether the rebates anddiscounts sometimes given to payers are being passed along to their clients.
Retail Data Description
The Truven Health MarketScan® Research Databases are comprised of 12 fullyintegrated claims databases, and contain the largest and oldest collection of privately andpublicly insured, de-identified patient data in the United States. 23 The warehouse featuresan opportunity sample from multiple sources (employers, states, health plans), more than20 billion patient records, and 196 million covered lives since 1995.24 The data used inthe Rx Price Watch analyses are drawn from the Truven Health MarketScan®Commercial Claims and Encounters Database (Commercial Database) and the TruvenHealth MarketScan® Supplemental and Coordination of Benefits Database (MedicareSupplemental Database).
The Truven Health MarketScan® Commercial Database consists of employer- and healthplan-sourced data containing medical and drug data for several million individualsannually. It encompasses employees, their spouses, and dependents covered by employer-sponsored private health insurance. Health care for these individuals is available under avariety of fee-for-service (FFS), fully capitated, and partially capitated health plans.These include PPOs and exclusive provider organizations (EPOs), POS plans, indemnityplans, HMOs, and consumer-directed health plans.25
The Truven Health MarketScan® Medicare Supplemental Database is composed of datafrom retirees with Medicare supplemental insurance sponsored by employers or unions.In 2010, 14 percent of the 46.5 million Medicare beneficiaries received their drugbenefits through a retiree coverage plan.26 The Truven Health MarketScan® MedicareSupplemental Database includes the Medicare-covered portion of payment, the employer-paid portion, and any patient out-of-pocket expenses. The database provides detailed costand use data for health care services performed in both inpatient and outpatient settings.
The retail price data drawn from the Truven Health MarketScan® Commercial Databaseand Truven Health MarketScan® Medicare Supplemental Database had to meet severalconditions in order to be included in the analysis:
1. Claimant must be age 50 and older;
23 E. Danielson, “White Paper: Health Research Data for the Real World: The MarketScan® Databases,”Truven Health Analytics, January 2014.24 Ibid.25 Ibid.26 Ibid.

22
2. Claim must have a value of greater than zero in the following fields;a. Total payment amountb. Metric quantityc. Ingredient costd. Days’ supplye. Average wholesale price
3. Payment amount cannot be less than 100 percent of the ingredient cost;4. Metric quantity value must fall within pre-defined ranges developed using
reference data from the Price Rx Pro database; and5. Claim must come from a non-capitated health plan.
Truven Health Analytics then combined the two databases and provided the AARPPublic Policy Institute with datasets that included the monthly median (as well as the 25th
and 75th percentile) retail price from January 2005 through December 2013 for all of thedrug products in the Rx Price Watch market baskets. We then compiled the monthlymedian retail prices in spreadsheets designed to track price changes among all of the drugproducts in the AARP market baskets.
Calculating Annual Price Changes for Each Drug
This Rx Price Watch report calculates average retail price changes for drug products inthe following ways:
The annual point-to-point percent change in retail price is the percent change in pricefor a given month compared with the same month in the previous year (e.g., January2013 vs. January 2012, February 2013 vs. February 2012).
The 12-month rolling average percent change in retail price is the average of thepoint-to-point changes over the preceding 12 months. For example, the averageannual retail price changes for 2013 refer to the average of the annual point-to-pointprice changes for each of the 12 months from January 2013 through December 2013compared with the same months in the 2012.
We calculated average annual price changes for each drug product for each year that thedrug was on the market from 2006 to 2013. The first step was to calculate the annualpoint-to-point percent change for each month by comparing the price in a specific monthwith the same month in the previous year (e.g., January 2013 vs. January 2012, February2013 vs. February 2012). The next step was to calculate the average of these annualpoint-to-point changes for the 12 months in each calendar year. For example, averageannual price changes for 2013 refer to the average of the annual point-to-point price foreach of the 12 months in 2013. This 12-month rolling average tends to be a moreconservative estimate of price changes than the point-to-point method (that is, a simplepercentage change for a single month from the same month in the previous year), and itaccounts for seasonal variations in drug manufacturers’ pricing policies.
Table A-1 shows how 12-month rolling average price changes are calculated. Suppose,for example, that drug A had the following pattern of price changes in 2013 whencompared to the same month in 2012:

23
Table A-1. Average Annual Percent Change in Price for Hypothetical Prescription Drug A,2013
Ja
n1
2-
Ja
n1
3
Feb
12
-F
eb1
3
Ma
r1
2-
Ma
r1
3
Ap
r1
2-
Ap
r1
3
Ma
y1
2-
Ma
y1
3
Ju
n1
2-
Ju
n1
3
Ju
l1
2-
Ju
l1
3
Au
g1
2-
Au
g1
3
Sep
12
-S
ep1
3
Oct
12-
Oct
13
No
v1
2-N
ov
13
Dec
12
-D
ec1
3
AV
ER
AG
E
2.0 2.0 2.0 2.0 3.0 3.0 3.0 3.0 3.0 3.0 3.0 3.0 2.67
In this example, the retail price of drug A was 2 percent higher than the price for thesame months in the previous year, for the period from January through April 2013. Aprice hike in May increased the percentage difference to 3 percent for each of thesubsequent months in 2013. The 12-month average of these price differences is
(2.0+2.0+2.0+2.0+3.0+3.0+3.0+3.0+3.0+3.0+3.0+3.0)/12, or 2.67 percent.27
Calculating Aggregate Average Price Changes across Multiple Drugs
To aggregate price changes for multiple drugs, we calculated a weighted average of pricechanges by weighting each drug’s annual price change (calculated from the TruvenHealth MarketScan® Commercial Database and the Truven Health MarketScan®Medicare Supplemental Database, as shown in the hypothetical example in Table A-1) byits share of total 2011 prescription sales within its given market basket (i.e., brand name,generic, specialty, or combined). As an example, Table A-2 shows that the sample fromwhich drug A was drawn has 10 drugs (we chose this small sample size to simplify thisillustrative example). The second column of Table A-2 gives the average annual pricechange for each of these drugs, denoted as drugs A-J. A straight (or unweighted) average,which adds up individual values and divides by the number of drugs, would result in anaverage annual price change of 4.76 percent for the drugs in this hypothetical sample.Assuming the hypothetical changes in the dollar cost of therapy for these drugs, shown inthe third column, the straight average change in the annual cost of therapy would be$236.13.
A straight average, however, distorts the actual impact of price changes because it doesnot account for each product’s “weight” within the sample (that is, it gives equal weightto price changes of both commonly used drugs and drugs that are used less frequently).As a result, it does not accurately capture the average impact of price changes in themarketplace. In Table A-2, drugs with low price increases in percentage terms (drugs Eand J) account for a small share (7 percent) of total 2011 sales for the specific group ofdrugs analyzed. By contrast, drugs with the highest percentage changes (drugs B, D, andI) account for a much larger share (37 percent) of sales. To reflect the relative importanceof each drug’s price change in the market basket of products, we weighted each annualprice change by the drug’s share of total 2011 sales. In this simple example, the weightedaverage price increase in 2007 is the sum of:
27 If the drug was introduced to the market in July of the previous year, then the price change for the givenyear is averaged using only the 6 months that the product was on the market in the previous year (i.e., July-December).

24
(Unweighted average price change for drug A × drug A’s share of total sales) +
(Unweighted average price change for drug B × drug B’s share of total sales) +
(Unweighted average price change for drug C × drug C’s share of total sales) +
… +
(Unweighted average price change for drug J × drug J’s share of total sales)
or,
(2.67 × 0.15) + (10.0 × 0.14) + (2.67 × 0.07) + … + (1.0 × 0.02).
Table A-2. Average Changes in Price and Cost of Therapy for 10 Hypothetical PrescriptionDrugs, 2013
DrugName
UnweightedAverage
Annual PriceChange (%)
UnweightedAverage Change
in Cost ofTherapy ($/year)
Share ofTotalSales
WeightedAverage
Annual PriceChange (%)
WeightedAverage Change
in Cost ofTherapy ($/year)
A 2.67% $623.48 15% 0.40% $93.52B 10.00% $108.68 14% 1.40% $15.22C 2.67% $433.68 7% 0.19% $30.36D 8.00% $54.08 10% 0.80% $5.41E 1.50% $162.76 5% 0.08% $8.14F 4.33% $54.08 14% 0.61% $7.57G 6.40% $216.84 2% 0.13% $4.34H 3.25% $433.68 18% 0.59% $78.06I 7.80% $27.04 13% 1.01% $3.52J 1.00% $247.00 2% 0.02% $4.94
TOTAL 4.76% $236.13 100% 5.22% $251.07
The results of this calculation are in the fifth column of Table A-2, which shows that theweighted annual average price change for drugs is 5.22 percent, or approximately one-half percentage point higher than the unweighted average of 4.76 percent. The weighteddollar change in the annual cost of therapy would be $251.07, compared to anunweighted average dollar change of $236.13.
Calculating Average Price Changes across Multiple Drugs for Years before 2011
The process for aggregating price changes for multiple drugs pre-2011 is similar to thatfor 2013. Average price changes for 2006 through 2010 were derived by first calculatingthe rolling-average annual price change for each drug (as shown in Table A-1), thenweighting each drug’s price change by its share of total sales in the sample. The weightsused for all years in this study are from 2011 sales from the Medicare Part D plans of aMedicare Part D plan provider, including the AARP plans, as well as from the TruvenHealth MarketScan® Commercial Database, and the Truven Health MarketScan®Medicare Supplemental Database. The 2011 weights keep the market basket constantover time so that the change in prices would be a function of price changes alone and nota function of changes in market basket.

25
However, some drugs that were in the 2011 sample were not on the market in all earlieryears. We dropped these drug products out of the analysis in the month before theyentered the market and for all previous months, and recalculated the weights of theproducts present in the market prior to 2011 to reflect their relative share of the total salesas adjusted to reflect only drugs on the market during that period.
For example, suppose that drugs I and J in Table A-2 were not on the market in 2008.Furthermore, assume that total drug spending in 2011 was $100,000. To capture the lossof drugs I and J from the analysis for 2008, the weights are redistributed across the drugsthat remain in the analysis (drugs A through H); the new weights are still based on their2011 sales but as a share of total sales for the smaller number of drugs in the analysis forthe year. In this example, the total 2011 sales would be $85,000 without drugs I and J.Drug A’s $15,000 in sales, which represented 15 percent of sales for all 10 drugs, rises to18 percent of sales when I and J are excluded. This weight, along with the analogousweights for drugs B-H, was used to derive the weighted average price change for 2008(see Table A-3).
Table A-3. Recalculating Weights When Prescription Drugs Drop out of the Sample
2011 Weights 2008 Weights
Drug NameShare of2011 Sales
Dollar Value of2011 Sales
Dollar Value of2008 Sales
Share of2008 Sales
A 15% $15,000 $15,000 18%B 14% $14,000 $14,000 16%C 7% $ 7,000 $ 7,000 8%D 10% $10,000 $10,000 12%E 5% $ 5,000 $ 5,000 6%F 14% $14,000 $14,000 16%G 2% $ 2,000 $ 2,000 2%H 18% $18,000 $18,000 21%I 13% $13,000 − − J 2% $ 2,000 − −
TOTAL 100% $100,000 $85,000 100%
Weighting the previous years’ price changes by 2011 sales potentially creates a biasrelative to using each specific year’s sales as the basis for assigning weights for that year.Using 2011 sales gives more weight to drugs that, relative to other drugs, had high ratesof sales growth in 2011 or earlier years compared to the year analyzed. In general,however, newer drugs initially have higher rates of sales growth, but relatively lowerrates of price growth, than do older drugs. This pattern occurs both because newer drugsmay have been introduced at higher prices and because price increases for brand namedrugs tend to accelerate in rate and amount closer to the end of a product’s effectivepatent life.
Calculating Annual Cost of Therapy for a Drug Product
To assess the impact of price changes on dollars spent, we calculated an annual cost oftherapy for each drug product. This annual cost of therapy analysis excludes drugproducts in the market basket that are used primarily for treatment of acute conditionsand are typically taken for a limited period of time. The amount of a drug that an averageadult would take on a daily basis was determined using the “usual daily dose” reported in

26
the Medi-Span Price Rx® database. When this information was not available from Medi-Span, we used dosing information in the FDA-approved labeling for the drug product.The weighted average annual cost of therapy was also calculated using the 2011 salesvolumes to weight the annual cost of each drug product to produce the aggregate annualcost of therapy across all drug products in the study’s market basket.
Defining Manufacturer
We defined a drug manufacturer as the firm marketing the drug product under itscorporate name in 2013. If a listed manufacturer is a division of another firm, we definedits drugs as manufactured by the parent firm. This includes cases where the firmmarketing a drug product may have changed over time due to mergers and acquisitions,divestitures of specific drug products, or for other reasons. The analysis of drugmanufacturers reported separately on manufacturers with at least two drug products (atthe NDC level) among the most widely used drugs.
Defining Therapeutic Category
Drug products can be classified by the therapeutic purpose for which they are used. If adrug has multiple uses, the most common indication typically becomes the classifier. Togroup drug products in this study into similar therapeutic categories, we used Medi-Span’s therapeutic coding scheme known as the GPI (or generic product indicator) code.
The therapeutic categories used in this study use an intermediate GPI level code thatspecifies the groupings of similar chemical entities such as “Proton Pump Inhibitors.” Atherapeutic category may include drug products that are brand single-source or brandmultiple-source.

27
APPENDIX B: AARP MARKET BASKET EFFECT OF BRANDNAME DRUGS FACING GENERIC COMPETITION
This AARP report tracked prices at the retail level for widely used brand name drugproducts for the 8-year period from December 31, 2005, to December 31, 2013. Themarket basket for this analysis included 227 brand name prescription drug products. One-fourth (58 of 227) of the widely used brand name drugs in the brand name market basketfaced generic competition in 2011, 2012, or 2013.
Figure B1 shows the annual percent increase in brand name drug prices using thecomplete brand name market basket (227 drugs). Figure B1 also shows the annualpercent increase using only those drugs in the brand name market basket that did not facegeneric competition at any point during the 8-year study period (169 drugs).
Figure B-1. Retail Price Trends Are Similar in AARP Market Baskets with andwithout Brand Name Drugs with Generic Equivalents
Prepared by the AARP Public Policy Institute and the PRIME Institute, University of Minnesota, based on data fromTruven Health MarketScan® Research Databases.
Comparing the annual price change trends for all brand name drugs in the market basket(227 drugs) with annual price change trends for only those brand name drugs with nogeneric competition (169 drugs), we found:
The average annual price change for the complete brand name market basket (227drugs) was 12.9 percent for 2013, while the average annual price change for thebrand name market basket with only those drugs not facing generic competition(169 drugs) was 13.2 percent.
5.7
%
5.9
%
7.9
% 8.4
% 9.1
%
11
.5% 12
.3%
12
.9%
5.9
% 6.4
%
8.4
%
8.8
%
8.6
%
10
.0%
11
.8%
13
.2%
2006 2007 2008 2009 2010 2011 2012 2013
Ave
rage
An
nu
al%
Ch
ange
All Brand Name Drugs in the Market Basket (227)
Only Brand Name Drugs with No Generic Competition (169)
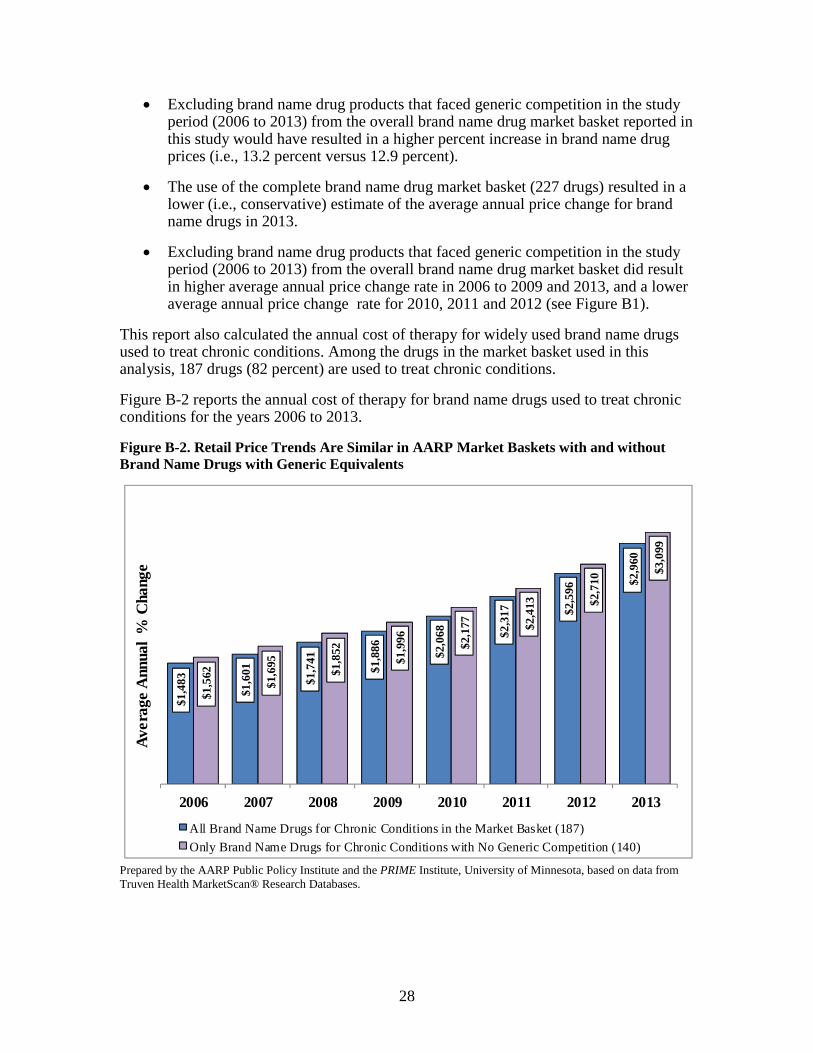
28
Excluding brand name drug products that faced generic competition in the studyperiod (2006 to 2013) from the overall brand name drug market basket reported inthis study would have resulted in a higher percent increase in brand name drugprices (i.e., 13.2 percent versus 12.9 percent).
The use of the complete brand name drug market basket (227 drugs) resulted in alower (i.e., conservative) estimate of the average annual price change for brandname drugs in 2013.
Excluding brand name drug products that faced generic competition in the studyperiod (2006 to 2013) from the overall brand name drug market basket did resultin higher average annual price change rate in 2006 to 2009 and 2013, and a loweraverage annual price change rate for 2010, 2011 and 2012 (see Figure B1).
This report also calculated the annual cost of therapy for widely used brand name drugsused to treat chronic conditions. Among the drugs in the market basket used in thisanalysis, 187 drugs (82 percent) are used to treat chronic conditions.
Figure B-2 reports the annual cost of therapy for brand name drugs used to treat chronicconditions for the years 2006 to 2013.
Figure B-2. Retail Price Trends Are Similar in AARP Market Baskets with and withoutBrand Name Drugs with Generic Equivalents
$1
,48
3
$1,6
01
$1
,74
1
$1,
88
6
$2,
06
8
$2
,31
7 $2,
59
6 $2,
960
$1,5
62
$1,
695
$1,
852
$1
,99
6
$2,
177 $2
,41
3 $2,
710
$3,0
99
2006 2007 2008 2009 2010 2011 2012 2013
Av
era
ge
An
nu
al
%C
ha
ng
e
All Brand Name Drugs for Chronic Conditions in the Market Basket (187)
Only Brand Name Drugs for Chronic Conditions with No Generic Competition (140)
Prepared by the AARP Public Policy Institute and the PRIME Institute, University of Minnesota, based on data fromTruven Health MarketScan® Research Databases.
29
When we compared the average annual cost of therapy for the complete market basket ofwidely used chronic-use, brand name drugs (187 drugs) to widely used chronic-use,brand name drugs that did not face generic competition at any point during the 8-yearstudy period (140 drugs) we found:
The average annual cost of therapy for the complete brand name market basket(187 drugs) was $2,960 for 2013, while the average annual cost of therapy for thebrand name market basket with only those drugs not facing generic competition(140 drugs) was $3,099.
Excluding widely used brand name drug products that faced generic competitionin the study period (2006 to 2013) from the complete brand name drug marketbasket as reported in this study would have resulted in a higher average annualcost of therapy in 2013 ($3,099 versus $2,960).
The use of the complete chronic-use brand name drug market basket (187 drugs)resulted in a conservative estimate of the average annual cost of therapy forwidely used brand name drugs.
Excluding widely used brand name drug products that faced generic competitionin the study period (2006 to 2013) from the complete chronic-use, brand namedrug market basket would have resulted in a higher average annual cost of therapyfor every year in the study (2006 through 2013) (see Figure B2).
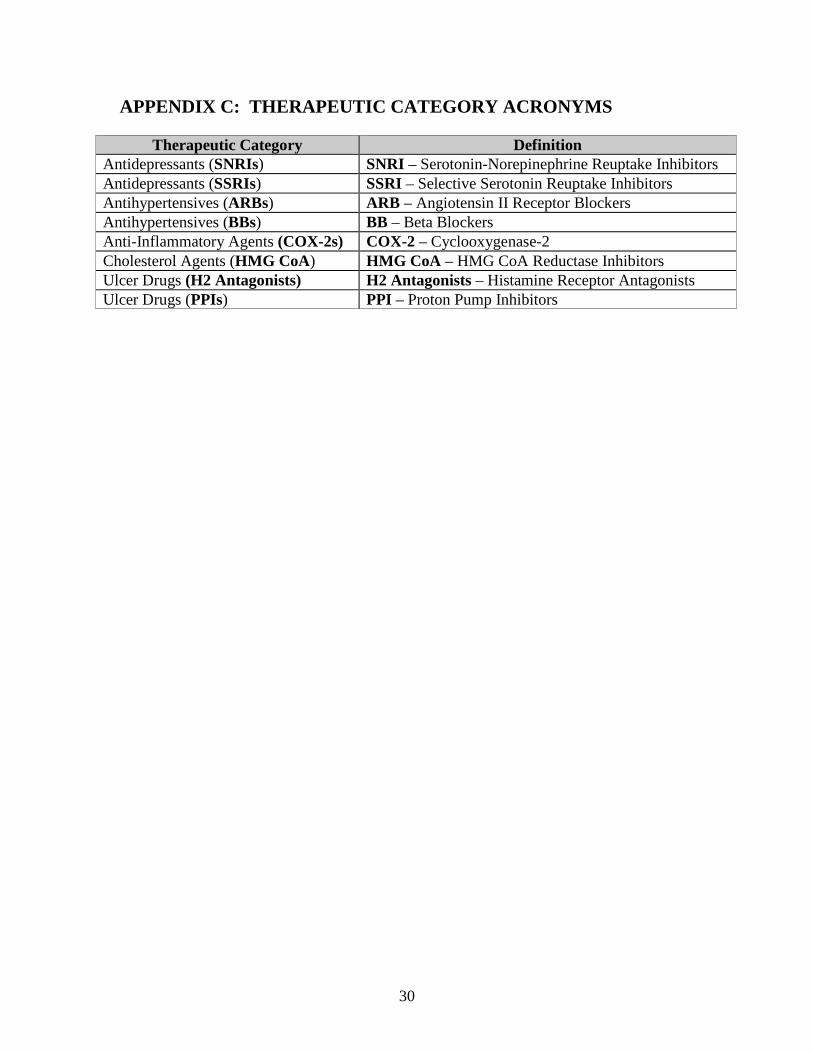
30
APPENDIX C: THERAPEUTIC CATEGORY ACRONYMS
Therapeutic Category DefinitionAntidepressants (SNRIs) SNRI – Serotonin-Norepinephrine Reuptake InhibitorsAntidepressants (SSRIs) SSRI – Selective Serotonin Reuptake InhibitorsAntihypertensives (ARBs) ARB – Angiotensin II Receptor BlockersAntihypertensives (BBs) BB – Beta BlockersAnti-Inflammatory Agents (COX-2s) COX-2 – Cyclooxygenase-2Cholesterol Agents (HMG CoA) HMG CoA – HMG CoA Reductase InhibitorsUlcer Drugs (H2 Antagonists) H2 Antagonists – Histamine Receptor AntagonistsUlcer Drugs (PPIs) PPI – Proton Pump Inhibitors

601 E Street, NW | Washington, DC 20049202-434-3840 PH | 202-434-6480 F | www.aarp.org/ppi
Public Policy Institute
Rx Price Watch
AARP Public Policy Institute