russian olive (elaeagnus angustifolia) removal in the western
TRANSCRIPT
Sustainability 2012, 4, 3346-3361; doi:10.3390/su4123346
sustainability ISSN 2071-1050
www.mdpi.com/journal/sustainability
Article
Russian Olive (Elaeagnus angustifolia) Removal in the Western United States: Multi-Site Findings and Considerations for Future Research
Margaret Gaddis †,* and Anna Sher
Department of Biological Sciences, University of Denver, F. W. Olin Hall, Room 102, 2190 E. Iliff Ave.,
Denver, CO 80208, USA
† Current address: Colorado Mountain College, Division of Natural Sciences 27900 County Road 319,
PO Box 897, Buena Vista, CO 81211, USA.
* Author to whom correspondence should be addressed; E-Mail: [email protected];
Tel.: +1-719-530-7173; Fax: +1-719-395-2173.
Received: 3 September 2012; in revised form: 4 December 2012 / Accepted: 11 December 2012 /
Published: 14 December 2012
Abstract: Elaeagnus angustifolia (Russian olive) is an introduced tree that has become one
of the dominant species in many watersheds in the American West. Although it is a target
of restoration efforts, very little is known about vegetation response after removal of this
exotic species. To address this gap we surveyed 25 sites in Colorado, Wyoming, and
Montana where E. angustifolia was removed. We collected information regarding plant
cover and richness, climate, soil characteristics, management history, and geography. We
analyzed these data using regression tree modeling. Our results indicate that moisture and
temperature are key environmental factors relating to restoration success as measured by
abundance of native cover; lower temperatures and greater availability of water were generally
associated with more native cover. These results have important implications for selection of
restoration sites, and for understanding the consequences of removing this species.
Keywords: Russian olive; Elaeagnus angustifolia; riparian; restoration; regression tree
modeling; invasive species removal
OPEN ACCESS
Sustainability 2012, 4 3347
1. Introduction
Restoration of riparian ecosystems in the Western United States increasingly includes removal of
Elaeagnus angustifolia (Russian olive), an invasive, nitrogen-fixing, non-native tree, however there is
currently little research that investigates the resulting ecosystem impact. Invasive species are those that
expand dramatically beyond their native range and thereby effect changes to historic ecosystem
structure or function [1]. As a nitrogen-fixer, E. angustifolia has the potential to significantly alter soil
nitrogen dynamics not only when alive [2], but perhaps especially when it is killed and the unused
nitrogen is released into the soil [3]. This pulse in soil nitrogen has the potential to change vegetative
communities in sites where this tree is being removed. Because many invasive plants are associated
with elevated nitrogen levels, there is particular concern that E. angustifolia removal sites may be
prone to high exotic cover [4]. E. angustifolia is the fourth most dominant riparian tree species in the
western United States [5,6]. Introduced in the early 1900’s from Eurasia, it is a shade-tolerant, climax
species, spread primarily through bird dispersal of seeds [7].
In contrast, native Populus spp. are pioneer species requiring disturbance for germination
success [8,9]. Due to changes in stream flow and geomorphology, some riparian corridors lose their
dynamic disturbance patterns and shift from an early to late successional overstory. They eventually
become more like the adjacent upland habitats, which are predominantly agricultural wastelands and/or
xeric steppe where exotic species coverage is more abundant than native species coverage [10–12].
The majority of research in the western US in the field of riparian restoration focuses on invasive
Tamarix spp. restoration, especially in terms of water storage and removal from the
watershed [13–15]. Tamarix spp. are early successional invaders that are now more dominant than
native cottonwood (Populus spp.) [5,16]. Two studies report on a quantitative synthesis of vegetation
response across sites and over time after Tamarix spp. removal [17,18]. Still others report on the
restoration of mixed native and invasive stands [12,19,20], but none have synthesized vegetation
response across sites after removal of E. angustifolia alone.
Ecological statistical models can be used to synthesize the results of riparian restoration projects by
evaluating the relative importance of various site characteristics (e.g., soil type, elevation, rainfall) for
predicting restoration success (e.g., relative native plant cover and richness). Previous research to
identify patterns in riparian revegetation where Tamarix spp. was removed has used ordination
analysis [17] and regression trees [18]. While no significant pattern was found among abiotic and
biotic variables in the first study, the later study was able to identify several, easy to measure
environmental variables associated with higher native cover across the 28 Tamarix removal sites
surveyed, including moisture availability and soil characteristics [18]. In light of the complexity of
riparian ecosystems, regression tree analysis appears to be a useful way to deal with many variables
across highly variable sites.
To determine if similar factors were important for determining restoration success following
E. angustifolia removal, we sampled vegetation and soils at 25 riparian sites in Colorado, Montana,
and Wyoming where E. angustifolia was invasive and was removed. Given that maximizing native
species cover and overall species diversity are common goals in restoration [21], for the purposes of
this research, success was evaluated by several different measures including total cover, total exotic
(i.e., non-native) cover, total native cover, relative exotic cover, relative native cover, richness, and
Sustainability 2012, 4 3348
diversity. It is important to note that “exotic” is not synonymous with “invasive”, as not all introduced
(i.e., non-native) species cause harm, even if maximizing native cover (at the expense of exotics) is
usually considered desirable. Our interest was in determining which, if any, site characteristics such as
those associated with the hydrology, soil, or management of a site were associated with success factors
in sites where E. angustifolia had been removed. Given previous research on Tamarix removal sites,
we expected that greater moisture availability (as measured by hydrological and weather patterns)
would correspond significantly with success of native species over exotics.
2. Methods
2.1. Site Selection
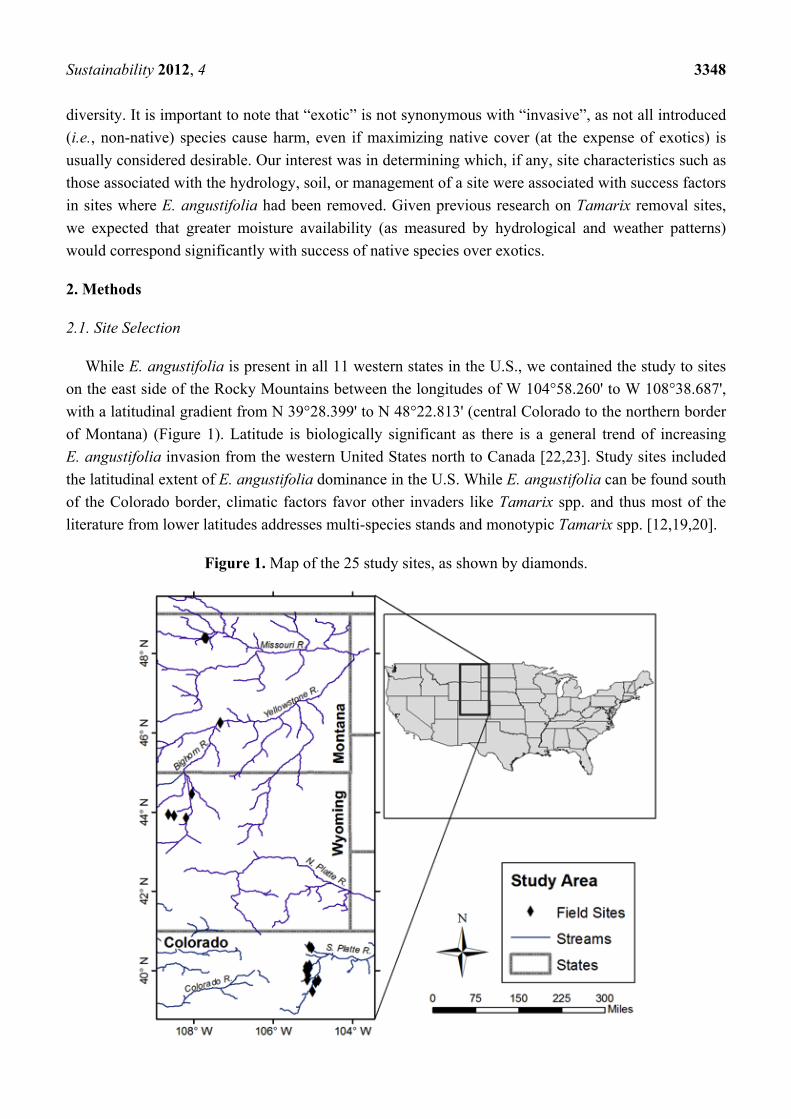
While E. angustifolia is present in all 11 western states in the U.S., we contained the study to sites
on the east side of the Rocky Mountains between the longitudes of W 104°58.260' to W 108°38.687',
with a latitudinal gradient from N 39°28.399' to N 48°22.813' (central Colorado to the northern border
of Montana) (Figure 1). Latitude is biologically significant as there is a general trend of increasing
E. angustifolia invasion from the western United States north to Canada [22,23]. Study sites included
the latitudinal extent of E. angustifolia dominance in the U.S. While E. angustifolia can be found south
of the Colorado border, climatic factors favor other invaders like Tamarix spp. and thus most of the
literature from lower latitudes addresses multi-species stands and monotypic Tamarix spp. [12,19,20].
Figure 1. Map of the 25 study sites, as shown by diamonds.
Sustainability 2012, 4 3349
We identified sites by contacting land managers of private and public land (approximately 30) who
had engaged in E. angustifolia removal. Sites were managed for varying objectives including
recreation, grazing, conservation, and wildlife habitat. Historic land use was predominantly
agricultural. To be included, sites had to be large enough to fit three plots with the dimensions of
15 m × 40 m, running parallel to a river or lake. We found only one site in all three states where active
revegetation had occurred, thus the sites were limited to passive revegetation after tree removal. In all
sites E. angustifolia trees were removed between 1 and 10 years. We found 25 sites that met our size
criteria. The sites are somewhat clustered geographically, a consequence of the patchy nature of
E. angustifolia removal projects, however sites remain independent. The final site list included 15 in
Colorado, 4 in Wyoming, and 6 in Montana (Figure 1).
2.2. Data Collection
Both abiotic and biotic data were collected for each site to determine if there is a relationship
between site attributes and restoration success, measured in terms of vegetation cover and richness.
Vegetation cover by species and richness were sampled using modified Whittaker plots, which have
been shown to describe more accurately measures of diversity than other quadrat or transect
designs [24,25]. Three 15 m × 40 m Whittaker plots were surveyed at each site with the following
subplots within each: (10) 1 m2, (2) 6 m2 and (1) 40 m2. Plots were oriented with the long side parallel
to the water source to maintain proximity to the water source. Where the site was sufficiently large,
placement of the Whittaker plots was random, but in many sites the sampling effort covered the entire
removal effort.
Plant species richness was recorded in each plot and subplot. Within each subplot percent cover of
vegetation types (native vs. exotic) was estimated and recorded. Percent cover in 1 m2 plots was
determined using a metal grid frame that subdivided the square meter into 50 squares, to improve
cover estimation.
Site characteristics were grouped into geographic, soil, management history, hydrology, and climate
categories (Table 1). Slope was determined with a slope meter and elevation with a GarminTM Etrex
GPS unit. Soil characteristics for each site were determined from a composite of 10 soil cores 10 cm
deep by 2 cm in diameter from a random location in each of the 1 m2 subplots. Samples were frozen
until analyzed by the Colorado State University Soil Testing Laboratory at the end of the field season.
From this soil analysis, we used pH, texture, electroconductivity (a standard measurement of soil
salinity), and percent organic matter. These are frequently used edaphic features that are likely to
influence revegetation in riparian zones and can have high variability between sites [15]. Although
inorganic soil nitrogen (nitrate) was analyzed from these samples, estimates of available N are highly
unreliable from field collections due to their rapid temporal fluctuations [26]. It should be noted that in
a related study that measured available soil N (nitrate and ammonium) before and after E. angustifolia
removal, available soil N concentrations were five times higher before E. angustifolia removal than
after removal. In addition, soil moisture was found to affect available soil N to a greater degree than
other abiotic factors, as evidenced by inorganic nitrogen fluctuations over a five-month time
period [3]. Since we had neither a time series of measurements nor soil N measurements from before
Sustainability 2012, 4 3350
E. angustifolia removal efforts in these sites, precipitation was favored as more accurate abiotic factor
over post-season analysis of nitrate concentrations.
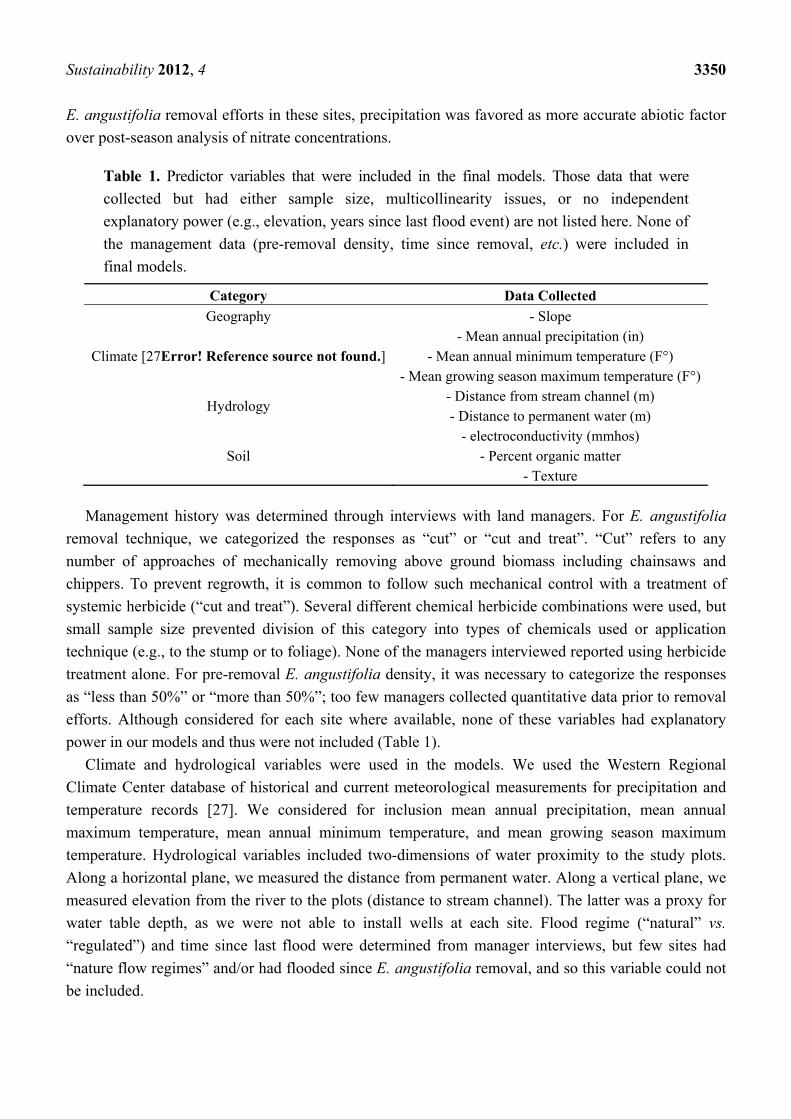
Table 1. Predictor variables that were included in the final models. Those data that were
collected but had either sample size, multicollinearity issues, or no independent
explanatory power (e.g., elevation, years since last flood event) are not listed here. None of
the management data (pre-removal density, time since removal, etc.) were included in
final models.
Category Data Collected
Geography - Slope
Climate [27Error! Reference source not found.]- Mean annual precipitation (in)
- Mean annual minimum temperature (F°) - Mean growing season maximum temperature (F°)
Hydrology - Distance from stream channel (m) - Distance to permanent water (m)
Soil - electroconductivity (mmhos)
- Percent organic matter - Texture
Management history was determined through interviews with land managers. For E. angustifolia
removal technique, we categorized the responses as “cut” or “cut and treat”. “Cut” refers to any
number of approaches of mechanically removing above ground biomass including chainsaws and
chippers. To prevent regrowth, it is common to follow such mechanical control with a treatment of
systemic herbicide (“cut and treat”). Several different chemical herbicide combinations were used, but
small sample size prevented division of this category into types of chemicals used or application
technique (e.g., to the stump or to foliage). None of the managers interviewed reported using herbicide
treatment alone. For pre-removal E. angustifolia density, it was necessary to categorize the responses
as “less than 50%” or “more than 50%”; too few managers collected quantitative data prior to removal
efforts. Although considered for each site where available, none of these variables had explanatory
power in our models and thus were not included (Table 1).
Climate and hydrological variables were used in the models. We used the Western Regional
Climate Center database of historical and current meteorological measurements for precipitation and
temperature records [27]. We considered for inclusion mean annual precipitation, mean annual
maximum temperature, mean annual minimum temperature, and mean growing season maximum
temperature. Hydrological variables included two-dimensions of water proximity to the study plots.
Along a horizontal plane, we measured the distance from permanent water. Along a vertical plane, we
measured elevation from the river to the plots (distance to stream channel). The latter was a proxy for
water table depth, as we were not able to install wells at each site. Flood regime (“natural” vs.
“regulated”) and time since last flood were determined from manager interviews, but few sites had
“nature flow regimes” and/or had flooded since E. angustifolia removal, and so this variable could not
be included.
Sustainability 2012, 4 3351
2.3. Data Analysis
We employed regression tree analysis to determine the relative importance of each of our site
variables for explaining vegetation response at E. angustifolia removal sites. Regression tree analysis
estimates which site attributes (predictor variables) explained the most variation in the vegetation
measurements (response variables) [28]. In ecological studies with necessarily smaller sample sizes,
the statistical assumption of normality required for parametric analysis is often difficult to attain.
Regression tree analysis is a non-parametric alternative that allows investigators to explore both
continuous and categorical data, thus with no assumptions regarding the distribution of the underlying
data, only requiring that the data be random and represent independent measures [28]. It is a
descriptive tool that compares one response variable, in our case vegetation response, to a suite of
predictor variables. We also explored one-to-one relationships between response variables and selected
important predictor variables were investigated.
We ran regression tree models using geographic, climatic, hydrologic, and soil variables tested
against each vegetation response variable. It is not advisable to incorporate more than nine variables in
a regression tree model because of the risk of multicollinearity [29]. Therefore, we first narrowed our
list (Table 1) by dropping those that were highly correlated to other variables, and those variables for
which there were highly disparate sample sizes between groups.
We used Systat statistical package [29] to build regression tree models, first defining our response
variables: richness, total cover, total native cover, total exotic cover, relative native cover, relative
exotic cover, and diversity. We then input categories of abiotic site attributes (Table 1), which were the
predictor variables. By using least squares, the model computes the proportional reduction of error
(PRE) in the response variable due to each predictor variable. The model continues to dichotomously
split vegetation data by predictor variables into most-similar groups until there are five or fewer data
units in each group. Both the site variables employed in the model and the values at which the data are
split are of biological interest. Each regression tree model splits the response data based on divisions in
the predictor data that best reduce the error in the response data. The mean value of the response data
in each group, the standard deviation of the means, and the sample size are reported. Regression tree
results are descriptive rather than purely quantitative; the numbers reported are not as important as the
relationship between variables used in each model. We noted which site variables were used first and
most in these models and our discussion centers on these variables.
3. Results
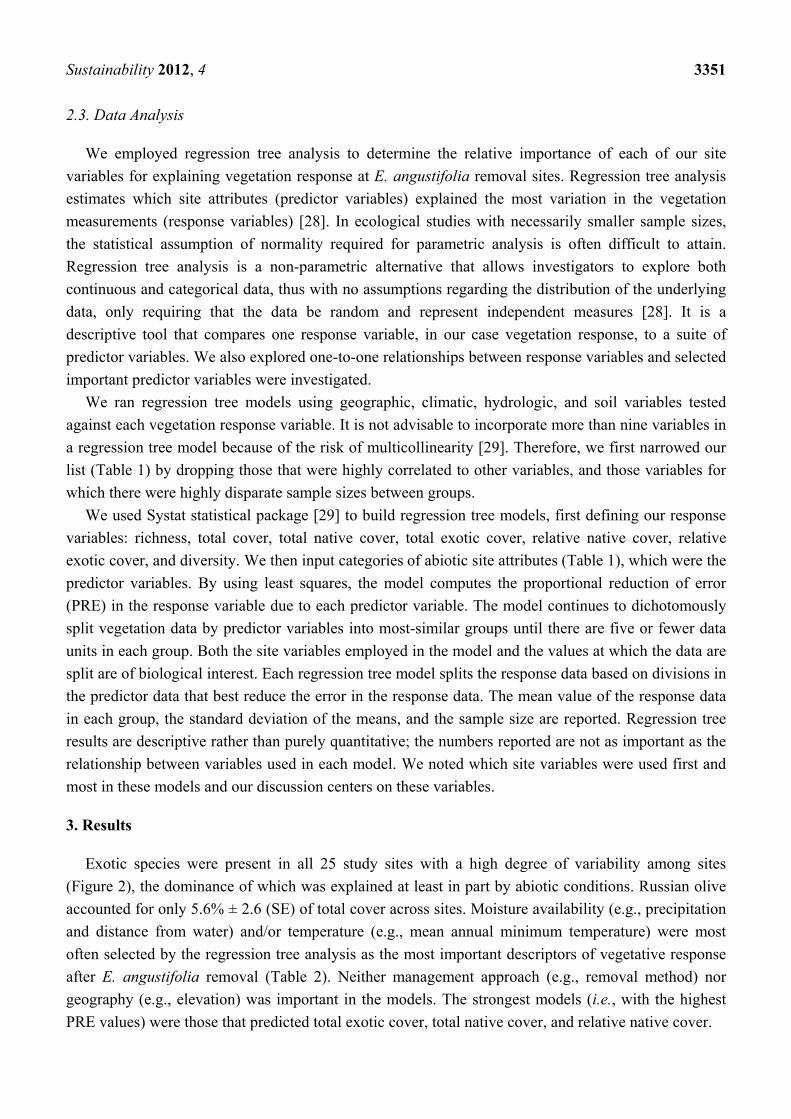
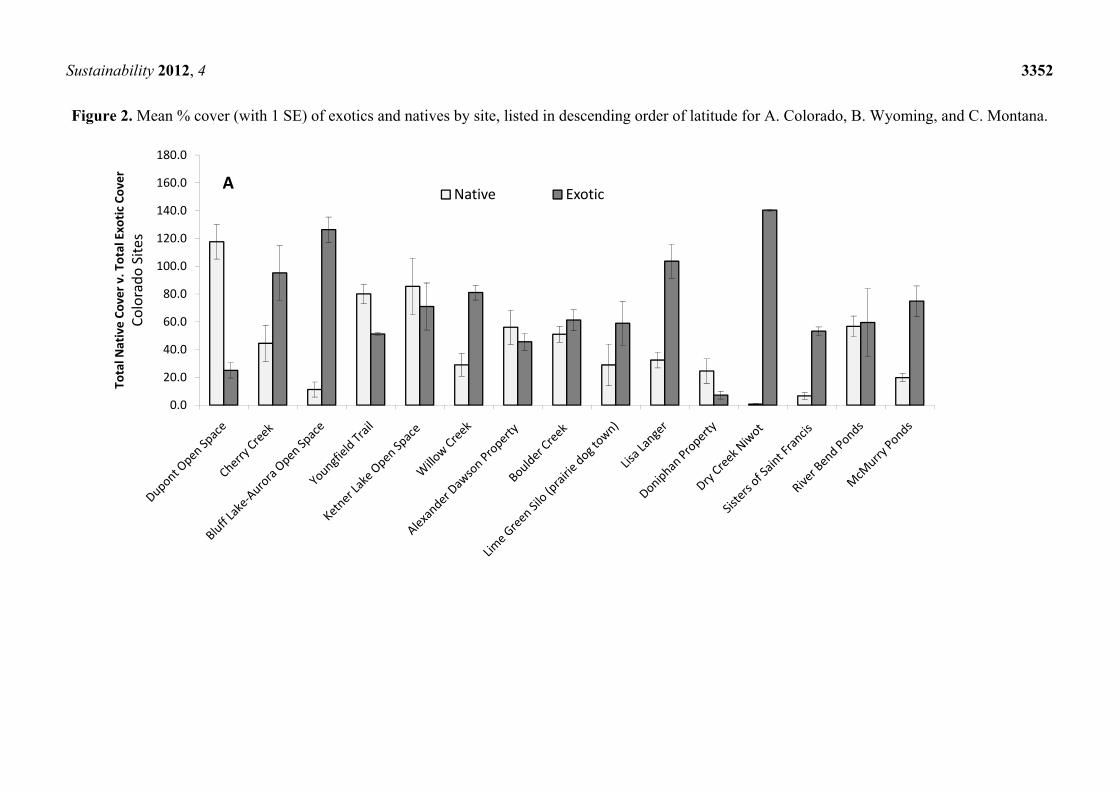
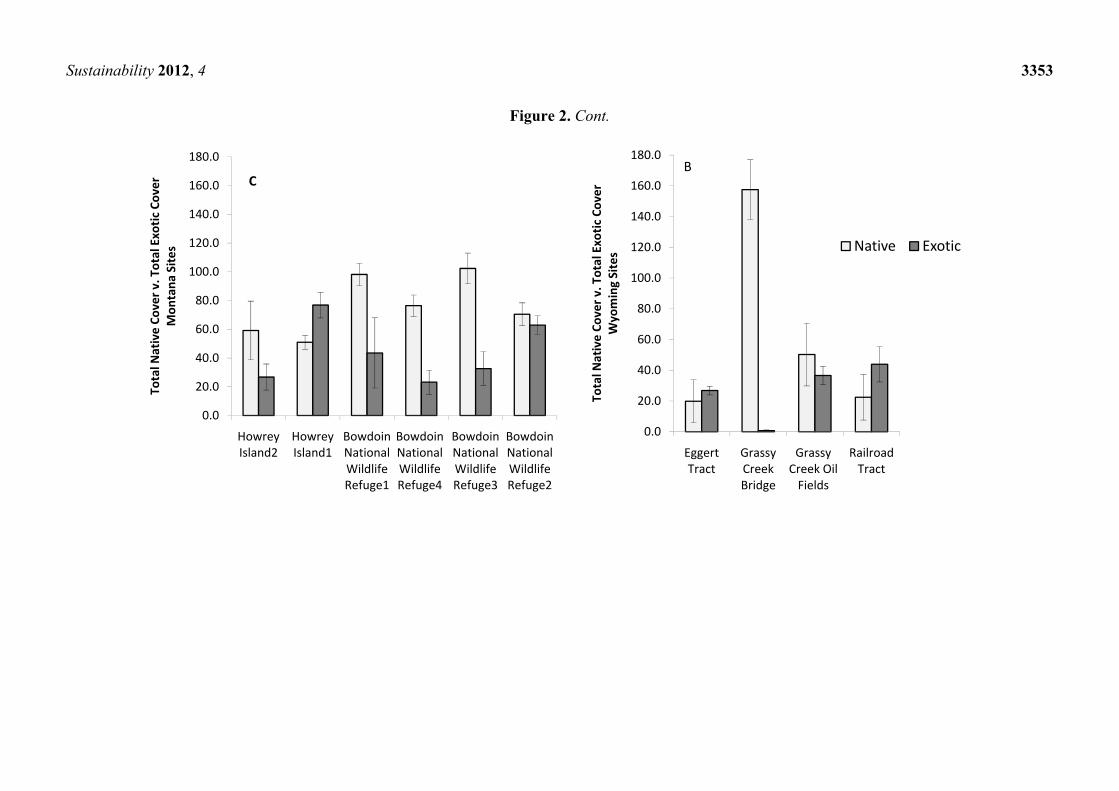
Exotic species were present in all 25 study sites with a high degree of variability among sites
(Figure 2), the dominance of which was explained at least in part by abiotic conditions. Russian olive
accounted for only 5.6% ± 2.6 (SE) of total cover across sites. Moisture availability (e.g., precipitation
and distance from water) and/or temperature (e.g., mean annual minimum temperature) were most
often selected by the regression tree analysis as the most important descriptors of vegetative response
after E. angustifolia removal (Table 2). Neither management approach (e.g., removal method) nor
geography (e.g., elevation) was important in the models. The strongest models (i.e., with the highest
PRE values) were those that predicted total exotic cover, total native cover, and relative native cover.
Sustainability 2012, 4 3352
Figure 2. Mean % cover (with 1 SE) of exotics and natives by site, listed in descending order of latitude for A. Colorado, B. Wyoming, and C. Montana.
0.0
20.0
40.0
60.0
80.0
100.0
120.0
140.0
160.0
180.0
Total N
ative Co
ver v
. Total Exotic
Cover
Colorado
Site
s
Native ExoticA
Sustainability 2012, 4 3353
Figure 2. Cont.
0.0
20.0
40.0
60.0
80.0
100.0
120.0
140.0
160.0
180.0
Howrey Island2
Howrey Island1
Bowdoin National Wildlife Refuge1
Bowdoin National Wildlife Refuge4
Bowdoin National Wildlife Refuge3
Bowdoin National Wildlife Refuge2
Total N
ative Co
ver v
. Total Exotic
Cover
Mon
tana
Site
s C
0.0
20.0
40.0
60.0
80.0
100.0
120.0
140.0
160.0
180.0
Eggert Tract
Grassy Creek Bridge
Grassy Creek Oil Fields
Railroad Tract
Total N
ative Co
ver v
. Total Exotic
Cover
Wyoming Sites Native Exotic
B
Sustainability 2012, 4 3354
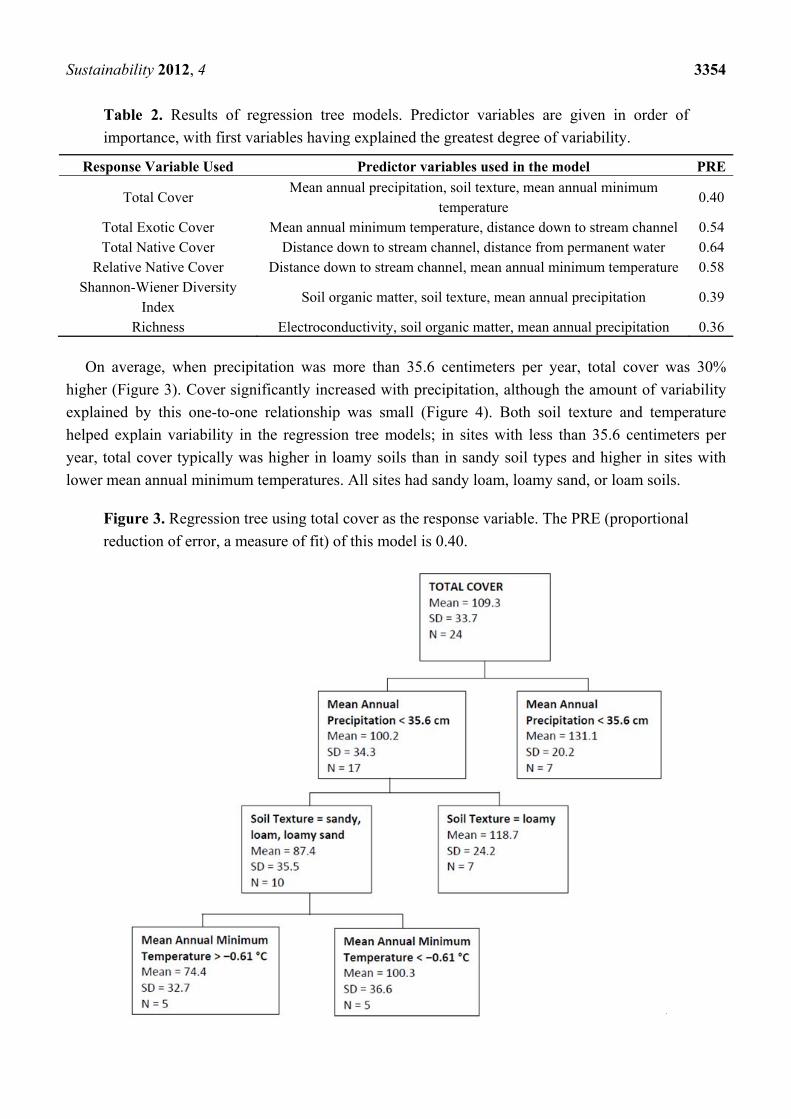
Table 2. Results of regression tree models. Predictor variables are given in order of
importance, with first variables having explained the greatest degree of variability.
Response Variable Used Predictor variables used in the model PRE
Total Cover Mean annual precipitation, soil texture, mean annual minimum
temperature 0.40
Total Exotic Cover Mean annual minimum temperature, distance down to stream channel 0.54Total Native Cover Distance down to stream channel, distance from permanent water 0.64
Relative Native Cover Distance down to stream channel, mean annual minimum temperature 0.58Shannon-Wiener Diversity
Index Soil organic matter, soil texture, mean annual precipitation 0.39
Richness Electroconductivity, soil organic matter, mean annual precipitation 0.36
On average, when precipitation was more than 35.6 centimeters per year, total cover was 30%
higher (Figure 3). Cover significantly increased with precipitation, although the amount of variability
explained by this one-to-one relationship was small (Figure 4). Both soil texture and temperature
helped explain variability in the regression tree models; in sites with less than 35.6 centimeters per
year, total cover typically was higher in loamy soils than in sandy soil types and higher in sites with
lower mean annual minimum temperatures. All sites had sandy loam, loamy sand, or loam soils.
Figure 3. Regression tree using total cover as the response variable. The PRE (proportional
reduction of error, a measure of fit) of this model is 0.40.
Sustainability 2012, 4 3355
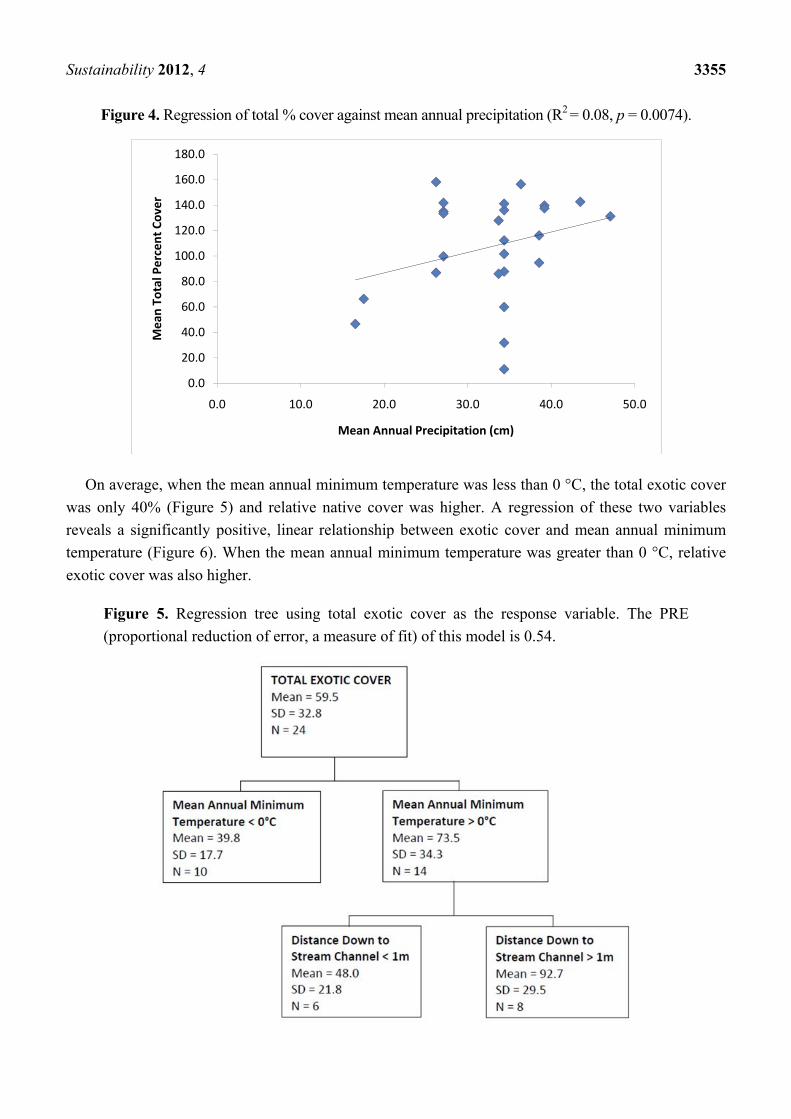
Figure 4. Regression of total % cover against mean annual precipitation (R2 = 0.08, p = 0.0074).
On average, when the mean annual minimum temperature was less than 0 °C, the total exotic cover
was only 40% (Figure 5) and relative native cover was higher. A regression of these two variables
reveals a significantly positive, linear relationship between exotic cover and mean annual minimum
temperature (Figure 6). When the mean annual minimum temperature was greater than 0 °C, relative
exotic cover was also higher.
Figure 5. Regression tree using total exotic cover as the response variable. The PRE
(proportional reduction of error, a measure of fit) of this model is 0.54.
0.0
20.0
40.0
60.0
80.0
100.0
120.0
140.0
160.0
180.0
0.0 10.0 20.0 30.0 40.0 50.0
Mean To
tal Percent Cover
Mean Annual Precipitation (cm)
Sustainability 2012, 4 3356
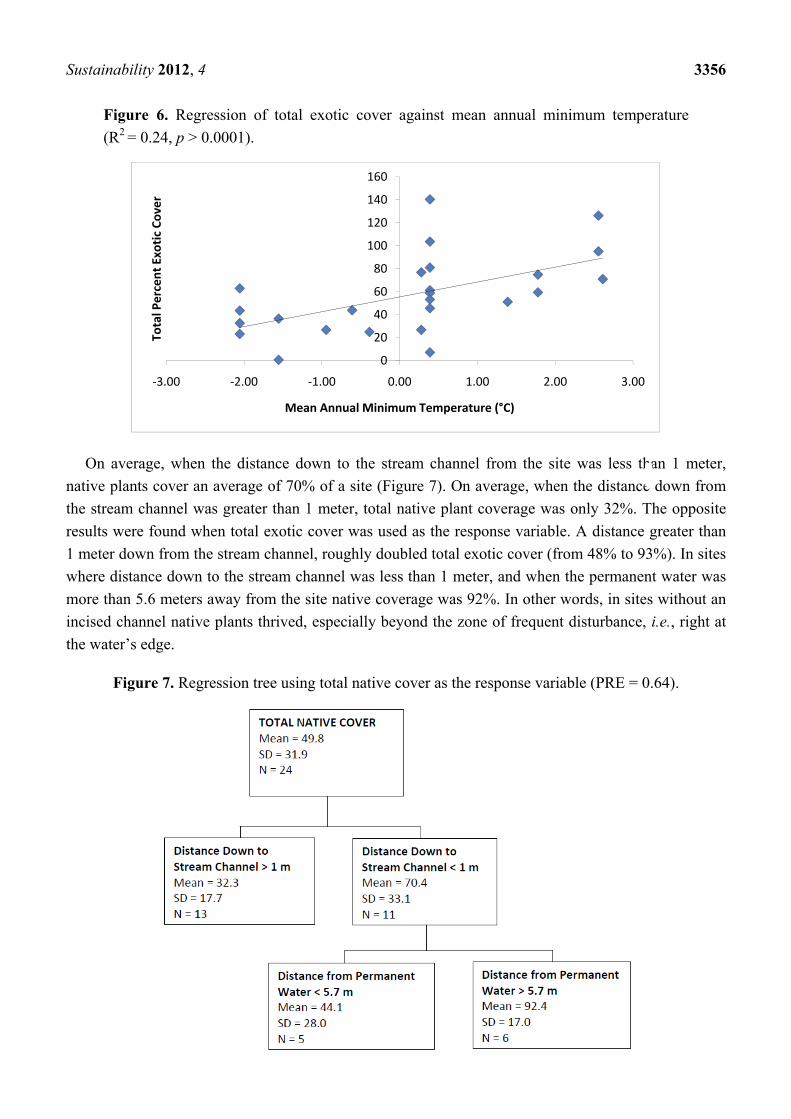
Figure 6. Regression of total exotic cover against mean annual minimum temperature
(R2 = 0.24, p > 0.0001).
On average, when the distance down to the stream channel from the site was less than 1 meter,
native plants cover an average of 70% of a site (Figure 7). On average, when the distance down from
the stream channel was greater than 1 meter, total native plant coverage was only 32%. The opposite
results were found when total exotic cover was used as the response variable. A distance greater than
1 meter down from the stream channel, roughly doubled total exotic cover (from 48% to 93%). In sites
where distance down to the stream channel was less than 1 meter, and when the permanent water was
more than 5.6 meters away from the site native coverage was 92%. In other words, in sites without an
incised channel native plants thrived, especially beyond the zone of frequent disturbance, i.e., right at
the water’s edge.
Figure 7. Regression tree using total native cover as the response variable (PRE = 0.64).
0
20
40
60
80
100
120
140
160
‐3.00 ‐2.00 ‐1.00 0.00 1.00 2.00 3.00
Total Percent Exotic
Cover
Mean Annual Minimum Temperature (°C)
Sustainability 2012, 4 3357
When using Shannon-Wiener Index values as the response data, the relative cover of each species
was more disparate when organic matter was less than 5% of soil mass. In the group where soil organic
matter was less than 5% soil mass, species abundance is more even when sandy soils were present. In
the loamy soil sites, species were more even when mean annual precipitation was less than
34.3 centimeters. When electroconductivity was less than 2.35 mmhos, richness was 16 as compared to
13 when electroconductivity was higher than 2.35 mmhos. Among sites with less than 2.35 mmhos of
electroconductivity, and when organic matter was less than 5.4%, richness was even higher [18].
4. Discussion
Our survey of E. angustifolia removal sites suggests that although there was little evidence of
regrowth by the target tree, many sites were still dominated by other exotic (i.e., non-native) species,
with evidence that exotic plants are favored over natives in restoration sites with hotter, drier
conditions. It is not uncommon for non-native species to dominate when disturbance regimes have
been altered and create newly stressful conditions for natives [30–32], as they have been in these
riparian systems [33]. Non-native Tamarix is the most well-understood example of this, dominating in
areas that are more arid [6], generally as a consequence of dam building and channelization of rivers,
which dis-favor native trees [9,33]. Previous surveys of riparian restoration sites have similarly found
associations between increased exotic cover and low water availability [18,19].
Although not unexpected, our observed relationship between exotic species and aridity is
particularly notable given that we only had indirect measures of moisture availability; precipitation,
distance down to stream channel, and distance from permanent water were proxies for moisture
availability in the absence of wells or direct soil moisture measurements which were logistically
unfeasible in this study. With few exceptions, temperature and moisture predictor variables were most
important for understanding vegetation response.
Understanding the mechanism of the relationship between moisture and exotic cover requires that
we consider native species distribution. In all models, opposite trends are reported for native and exotic
cover. In other words, conditions that promoted native species were associated with a decrease in the
coverage of exotic species. This is consistent with similar surveys of Tamarix removal sites [18,19,34],
and may indicate competitive interactions between native and exotics [35]. This theory offers the
explanation that although both exotic and native species are expected to respond positively to
increased water availability, exotics will dominate only where native species cannot—suggesting that
exotics in this system are competitively excluded where conditions are generally favorable [34]. This
mechanism has been repeatedly demonstrated for Tamarix trees [34–36], however further research is
necessary to determine whether it holds true for other exotic species, particularly those that have been
considered invasive [37].
Of the few native species we found in these sites, most were either early succession species adapted
to disturbance or salt tolerant grasses. The latter are native species usually found in the more xeric,
upland habitats adjacent to mesic riparian habitats. Future research should address the efficacy of
restoring to mesic, riparian, native vegetation communities versus xeric, native, upland vegetation
communities [12]. With reduced flooding to promote disturbance-adapted early succession species, the
Sustainability 2012, 4 3358
mechanisms to maintain riparian vegetation communities are absent. Therefore adjacent native xeric
communities may be more desirable than exotic riparian species in the riparian zone.
It should be noted that many of our sites were unusually dry during a year of drought. Only five of
our sites in Colorado actually had precipitation greater than 32.3 centimeters despite the statewide
average of 38.4 centimeters that year. Native plants in the riparian corridor are accustomed to a mesic
habitat, thus drought conditions may explain the abundance of exotic species in these sites. There were
many plants that did not flower for the duration of our field collection period. All of the sites were in
areas categorized as experiencing moderate to extreme drought [38]. Thus, the role of moisture for
determining vegetative response may have been especially heightened the year of our study [39].
There are several site descriptor variables that would be expected to be important for explaining
vegetative response but could not be used in the final models because of missing information; most
managers simply did not have baseline data or good records of site histories. Even if including these
data would be unlikely to change the patterns observed, there is no doubt that our models would have
been more powerful and informative with the inclusion of site history data. It is our intent that our
work and other research on the outcomes of restoration projects will encourage monitoring practices in
general, including the collection of baseline information.
Removal of any dominant tree will result in a pulse of resources which are likely to affect
vegetative response; these include an increase in light availability at the very least, and likely soil
resources as well because of competitive release. It is critical to understand what factors are associated
with greater or lesser exotic cover among restoration sites. We found soil factors to be more important
for understanding species richness and diversity than for cover estimates, and to be less predictive
overall, however we did not have good nutrient measurements and therefore can only speculate about
their potential role. Nor was our experimental design intended to study the effects of E. angustifolia
removal (e.g., relative to sites where it was not removed). As these are important questions, we would
recommend their pursuit for future work.
5. Conclusions
This quantitative study incorporated site data from Colorado, Wyoming, and Montana where
E. angustifolia was removed. The models suggest that moisture and temperature site attributes were
the best predictors of plant cover and richness, the response variables measured to quantify restoration
success. As was found in Tamarix removal sites in an earlier study [18], increased availability of
water, as measured by precipitation or by distance to stream channel, was associated with higher
percentage of natives both in total, and relative to exotic species, which dominated in hotter and drier
areas. This has important implications in the context of climate change, which predicts the latter
conditions to increase in the future, and also for restoration site selection by land managers. These
results suggest that when revegetation is dependent upon passive means, wetter sites are more likely to
recover with native species than drier ones.
It is imperative that ecologists and land managers work together to develop a management and
restoration plan for E. angustifolia, given the expectation that this species is likely to dominate in the
future. We hope this research will promote further study regarding E. angustifolia so we can develop a
sound management plan for this species.
Sustainability 2012, 4 3359
Acknowledgments
We would like to acknowledge Mike Monahan, Buck Sanford, Pat Shafroth, Stephanie Strudley,
Melissa Tank, and Rebecca Powell for their assistance and support throughout this project. This
project was supported in part by a Center for Invasive Plant Management Information Synthesis Grant,
a Colorado Dissertation Fellowship, a University of Denver Pustmueller Summer Fellowship and by a
Grant-in-Aid of Research by Sigma Xi, The Scientific Research Society.
Conflict of Interest
The authors declare no conflict of interest.
References and Notes
1. Mack, R.N.; Simberloff, D.; Lonsdale, W.M.; Evans, H.; Clout, M.; Bazzaz, F.A. Biotic Invasions:
Causes, Epidemiology, Global Consequences, and Control. Ecol. Appl. 2000, 10, 689–710.
2. DeCant, J.B. Russian olive, Elaeagnus angustifolia, alters patterns in soil nitrogen pools along the
Rio Grande River, New Mexico, USA. Wetlands 2008, 28, 896–904.
3. Gaddis, M.L.; Sher, A.A. Environmental impact of restoration of riparian ecosystems: Fitting
Russian olive (Elaeagnus angustifolia) into the picture. M.S. Thesis, University of Denver,
Denver, CO, USA, 2008.
4. Vitousek, P.M.; Walker, L.R. Biological invasion by Myrica faya in Hawai’i: Plant demography,
nitrogen fixation, ecosystem effects. Ecol. Monogr. 1989, 59, 247–265.
5. Friedman, J.M.; Auble, G.T.; Shafroth, P.B.; Scott, M.L.; Merigliano, M.F.; Freehling, M.D.;
Griffin, E.R. Dominance of non-native riparian trees in western USA. Biol. Invasions 2005, 7,
747–751.
6. Nagler, P.L.; Glenn, E.P.; Jarnevich, C.S.; Shafroth, P.B. Distribution and Abundance of
Saltcedar and Russian olive in the Western United States. Crit. Rev. Plant Sci. 2011, 30, 508–523.
7. Katz, G.L.; Shafroth, P.B. Biology, ecology and management of Elaeagnus angustifolia L.
(Russian olive) in western North America. Wetlands 2003, 23, 763–777.
8. Shafroth, P.B.; Auble, G.T.; Scott, M.L. Germination and establishment of the native plains
cottonwood (Populus deltoides Marshall subsp. Monilifera) and the exotic Russian olive
(Elaeagnus angustifolia L.). Conserv. Biol. 1995, 9, 1169–1175.
9. Friedman, J.M.; Scott, M.L.; Auble, G.T. Water management and cottonwood dynamics along
prairie streams. Ecology 1997, 125, 49–71.
10. Poff, N.L.; Allan, J.D.; Bain, M.B.; Karr, J.R.; Prestegaard, K.L.; Richter, B.D.; Stromberg, J.C.
The natural flow regime: A paradigm for river conservation and restoration. BioScience 1997, 47,
769–784.
11. Stromberg, J.C. Restoration of riparian vegetation in the south-western United States: Importance
of flow regimes and fluvial dynamism. J. Arid Environ. 2001, 49, 17–34.
12. Reynolds, L.V.; Cooper, D.J. Ecosystem response to removal of exotic riparian shrubs and a
transition to upland vegetation. Plant Ecol. 2011, 212, 1243–1261.
Sustainability 2012, 4 3360
13. Pollen-Bankhead, N.; Simon, A.; Jaeger, K.; Wohl, E. Destabilization of streambanks by removal
of invasive species in Canyon de Chelly National Monument, Arizona. Geomorphology 2009, 103,
363–374.
14. Scott, R.L.; Cable, W.L.; Huxman, T.E.; Nagler, P.L. Multiyear riparian evapotranspiration and
groundwater use for a semiarid watershed. J. Arid Environ. 2008, 72, 1232–1246.
15. Jaeger, K.L.; Wohl, E. Channel response in a semiarid stream to removal of tamarisk and Russian
olive. Water Resour. Res. 2011, 47, W02536.
16. Glenn, E.; Nagler, P. Comparative ecophysiology of saltcedar and native trees in western U.S.
riparian zones. J. Arid Environ. 2005, 61, 419–446.
17. Harms, R.S.; Heibert, R.D. Vegetation response following invasive tamarisk (Tamarix spp.):
Removal and implications for riparian restoration. Restor. Ecol. 2006, 14, 461–472.
18. Bay, R.F.; Sher, A.A. Success of active revegetation after Tamarix removal in riparian ecosystems
of the southwestern United States: A quantitative assessment of past restoration projects. Restor.
Ecol. 2008, 16, 113–128.
19. Huddle, J.A.; Awada, T.; Martin, D.L.; Zhou, X.H. Understory response following the removal of
invasive woody species from a cottonwood riparian forest depends on overstory type. In
Proceedings of the Meeting of the Ecological Society of America, Albuquerque, NM, USA,
2 August, 2009.
20. Hummel, O.; Caplan, T. Evaluating restoration success and applying adaptive management in the
Middle Rio Grande Bosque. In Proceedings of the Meeting of the Ecological Society of America,
Albuquerque, NM, USA, 2 August 2009.
21. Sher, A.A.; Lair, K.; DePrenger-Levin, M.; Dohrenwend, K. Best Management Practices for
Revegetation in the Upper Colorado River Basin; Denver Botanic Gardens: Denver, CO, USA,
2010; p. 55.
22. Shafroth, P.B.; Brown, C.A.; Merritt, D.M. Saltcedar and Russian olive control demonstration act
science assessment. In Scientific Investigations Report 2009–5247; US Geological Survey: Reston,
VA, USA, 2010; p. 143.
23. Olson, T.E.; Knopf, F.L. Naturalization of Russian-olive in the western United States. West. J.
Appl. Forestry 1986 1, 65–69.
24. Shmida, A. Whittaker’s plant diversity sampling method. Isr. J. Bot. 1984, 33, 41–46.
25. Stohlgren, T.J.; Falkner, M.B.; Schell, L.D. A Modified-Whittaker Nested Vegetation Sampling
Method. Vegetation 1995, 117, 113–121.
26. Bradshaw, A.D.; Chadwick, M.J. The Restoration of Land: The Ecology and Reclamation of
Derelict and Degraded Land; Anderson, D.J., Greig-Smith, P., Pitelka, F.A., Eds.; University of
California Press: Berkeley and Los Angeles, CA, USA, 1980; p. 116.
27. Western Regional Climate Center: Historical Climate Information. Available online:
http://www.wrcc.dri.edu/summary/Climsmco.html (accessed on 29 August 2007).
28. Quinn, G.P.; Keough, M.J. Experimental Design and Data Analysis for Biologists; Cambridge
University Press: Cambridge, UK, 2002; p. 206.
29. Systat Software Inc. SYSTAT 11 Statistical Software. Richmond, CA, USA, 2004.
30. Sher, A.A.; Hyatt, L.H. The Disturbance-Invasion Matrix: A new framework for predicting plant
invasions. Biol. Invasions 1999, 1, 109–114.
Sustainability 2012, 4 3361
31. Hobbs, R.J.; Huenneke, L.F. Disturbance, diversity, and invasion: implications for conservation.
Conserv. Biol. 1992, 6, 324–337.
32. Forcella, F.; Harvey, S.J. Relative abundance in an alien weed flora. Oecologia 1983, 59, 292–295.
33. Shafroth, P.B.; Stromberg, J.C.; Patten, D.T. Riparian vegetation response to altered disturbance
and stress regimes. Ecol. Appl. 2002, 12, 107–123.
34. Sher, A.A.; Marshall, D.L. Competition between native and exotic floodplain tree species across
water regimes and soil textures. Am. J. Bot. 2003, 90, 413–422.
35. Sher, A.A.; Marshall, D.L.; Taylor, J. Spatial partitioning within southwestern floodplains:
Patterns of establishment of native Populus and Salix in the presence of invasive, non-native
Tamarix. Ecol. Appl. 2002, 12, 760–772.
36. Sher, A.A.; Marshall, D.L.; Gilbert, S.A. Competition between native Populus deltoides and
invasive Tamarix ramosissima and the implications of reestablishing flooding disturbance.
Conserv. Biol. 2000, 14, 1744–1754.
37. Stromberg, J.C.; Lite, S.J.; Marler, R.; Paradzick, C.; Shafroth, P.B.; Shorrock, D.; White, J.M.;
White, M.S. Altered stream-flow regimes and invasive plant species: The Tamarix case. Global
Ecol. Biogeogr. 2007, 16, 381–393.
38. National Climate Data Center: Palmer Hydrological Drought Index. Available online:
http://www.ncdc.noaa.gov/temp-and-precip/drought/historical-palmers.php (accessed on 2
February 2007).
39. Didham, R.K.; Tylianakis, J.M.; Hutchison, M.A.; Ewers, R.M.; Gemmell, N.J. Are invasive
species the drivers of ecological change? Trends Ecol. Evol. 2005, 20, 470–474.
© 2012 by the authors; licensee MDPI, Basel, Switzerland. This article is an open access article
distributed under the terms and conditions of the Creative Commons Attribution license
(http://creativecommons.org/licenses/by/3.0/).