runtime monitoring, performance analysis - department of
TRANSCRIPT

DEPARTMENT OF DISTRIBUTED AND DEPENDABLE SYSTEMShttp://d3s.mff.cuni.cz
CHARLES UNIVERSITY PRAGUEFaculty of Mathematics and Physics
Runtime Monitoring,Performance Analysis
Peter Libič, Pavel Parízek

Runtime monitoring

Runtime monitoring
• Basic idea Recording information about program’s runtime behavior
• Long-time statistics (average number of clients, etc) Notification about specific important events
• e.g. usage of “root” account
• What is it good for Identification of performance-related problems
• e.g. running out of memory under heavy load, average request processing time, …
Identification of security issues• e.g. port scanning, denial-of-service, …
• Used mainly for long-running programs Application servers (JBoss, Tomcat, …) Network servers and daemons (Sendmail, Apache, …)

Runtime monitoring – main approaches
• Logging Focus on high-level information for administrators
• e.g. an important file is missing, a program failed to start
Tools: Syslog, Log4j, Java Logging API, Windows Event Log
• Tracing Focus on low-level information for developers
• e.g. thrown exceptions, function running time, …
Tools: strace, DTrace
• Monitoring and management Java Management Extensions (JMX)
Syslog

Syslog
• Standard logging framework for Unix-like systems Two components: service and protocol
• Syslog service Collects log messages from different sources and stores them
in different destinations• According to configuration in /etc/syslog.conf
• Syslog protocol Format of data exchanged between applications (clients) and
the syslog service (server) Message
• Content: plaintext, < 1024 bytes• Priority (low to high): debug, info, notice, warning, error, critical,
alert, emergency Defined by RFC 3164, 3195

Syslog – features
• Support for several output destinations Log files in a dedicated directory (/var/log) Another computer connected via a network
• Storing of messages from different applications in different destinations Example configuration
• Logs from Apache are written to /var/log/httpd/httpd.log• Logs from Sendmail are sent over network to another computer
• Log rotation Prevents log files from becoming too large Example
• /var/log/messages current log file• /var/log/messages.{1-X} older log files

Syslog – use case
Syslogd
ApacheSendmail MySQL
/var/log/mail.log /var/log/mysql.log
/var/log/httpd/httpd.log

Using Syslog in a C program
• Necessary functions are provided by GNU C library
• Opening a connection to Syslog void openlog (const char *ident, int option, int facility)
• Submitting a message to Syslog void syslog (int priority, char *format, ...)
• Closing current Syslog connection void closelog (void)
• Example #include <syslog.h> openlog (“myprog”, LOG_CONS | LOG_PID, LOG_LOCAL1); syslog (LOG_NOTICE, “Program runs for %d seconds”, 10000); syslog (LOG_ERROR, “File %s does not exist”, file_name); closelog ();
name of a program thatsubmits log messages
printf-style string

Log4j

Log4j
• Popular logging library for Java platform Project of the Apache Software Foundation
• Components Loggers
• Logging interface for an application
Layouts• Formatting of log messages
Appenders• Output to target destinations

Logger
• Implemented by the org.apache.log4j.Logger class Supports several logging levels
• TRACE < DEBUG < INFO < WARNING < ERROR < FATAL Important methods
public static Logger getLogger(String name); public void setLevel(Level level);
public void info(Object message); public void info(Object message, Throwable t);
• Logger object Identified by a logical name
• e.g. cz.cuni.mff.MyApp Created via the getLogger method Current logging level
• Messages of lower level are disabled (ignored) e.g. if the current level is ERROR, then only messages with levels
ERROR or FATAL are printed
pair of methodsfor each level

Hierarchy of Loggers
• Logger objects are organized in an inheritance hierarchy Root logger
• Always exists and has a current logging level
• Hierarchical naming scheme Corresponds to Java class/package hierarchy Parent-child relation is based on logger names
• For example, logger with name cz.cuni.mff is a parent of the logger with name cz.cuni.mff.d3s
• Inheritance of logging levels If the current level is not set for a logger, then it is inherited Example
Logger name Assigned level Inherited level Root INFO INFO cz.cuni.mff none INFO cz.cuni.mff.d3s ERROR ERROR

Layout
• Responsible for formatting of log messages Converts instances of Object and Throwable into
a string representation
• Available layouts PatternLayout
• Uses format string similar to printf
HTMLLayout XMLLayout …

Appender
• Responsible for printing of log messages to actual output destinations
• M-N relation among loggers and appenders Multiple appenders can be attached to any logger
• Inheritance of appenders from loggers higher in the hierarchy• e.g. each message is written to a file and printed on console
Multiple loggers can be attached to one appender• e.g. one log file for all loggers used by an application
• Available appenders ConsoleAppender FileAppender SyslogAppender …

Use of Log4j in a Java program
// get a Logger object Logger logger = Logger.getLogger(“cz.cuni.mff”);
// set current logging level logger.setLevel(Level.WARN);
logger.warn(“Running out of disk space”); ... logger.error(“File “+f+” not found”, ex); ...
// this message is disabled logger.info(“Something normal happened”);
strace

strace
• Tool for monitoring of interactions with OS kernel System calls performed by a program Signals received by a program
• Available for Unix and Linux systems
• Usage strace <program> Output is a list of system calls and signals
open(“/etc/passwd”, O_RDONLY) = 3open(“/etc/passwords”, O_RDONLY) = -1 ENOENT (No such file)
Attaching to a running process• via -p <pid> option
system call name
arguments in symbolic form
return value
error value and string

Java Management Extensions (JMX)

Java Management Extensions (JMX)
• Framework for management and monitoring of Java applications and services Part of the standard Java platform
• Since J2SE 5.0 Provides information relevant to system administrators
• Amount of available memory• Number of active clients• …
• Implemented by Java Virtual Machine (JVM)
• Monitoring of JVM itself and/or programs running in it Modern application servers (JBoss, WebSphere)
• Monitoring of servers and applications running in the servers

JMX – key components
• Managed Bean (MBean) Object providing information about a Java
application (or JVM)• Implemented by the application
• MBean server Responsible for management of MBeans Provides MBeans to remote management
applications• Connectors (RMI, SOAP)• Adaptors (HTML/HTTP)
• Management application Retrieves information from MBeans and
presents it to users• User = system administrator
Tools: JConsole, web interface to an application server
MBean MBean
MBean server
RMIconnector
HTMLadaptor
JConsole Webbrowser
Java application

JMX – usage scenario
• Development Implementation of several MBeans
• Instrumentation of an application with several management interfaces
Embedding of the MBean server
• Runtime1. Instantiation of the MBeans2. Registration of MBeans in the server3. Accessing MBeans from the management
application (e.g. JConsole)

Management interface provided by MBean
• Attributes Read and possibly written by management application Usage: run-time configuration of an application server
• Operations Invoked by the management application Usage: restart of application running in a J2EE server
• Notifications Emitted by MBean asynchronously Usage: notification about important events
• e.g. running out of disk space
MBean – example
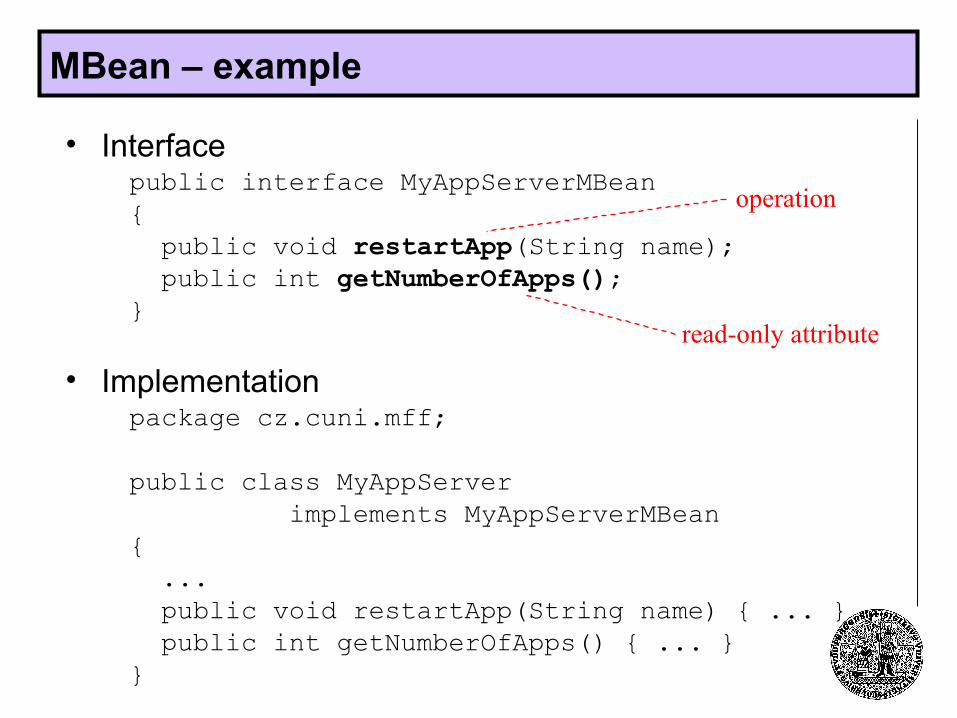
• Interface public interface MyAppServerMBean { public void restartApp(String name); public int getNumberOfApps(); }
• Implementation package cz.cuni.mff;
public class MyAppServer implements MyAppServerMBean { ... public void restartApp(String name) { ... } public int getNumberOfApps() { ... } }
read-only attribute
operation

Making MBeans available – example
package cz.cuni.mff;
import java.lang.management.*;import javax.management.*;
public class MyAppServer implements MyAppServerMBean { public static void main(String[] args) { MBeanServer mbServer = ManagementFactory.getPlatformMBeanServer();
ObjectName mbName = new ObjectName(“cz.cuni.mff:type=MyAppServer”);
MyAppServer mb = new MyAppServer();
mbs.registerMBean(mb, mbName);
... // start and run the app server }}
obtain MBean serverrunning in JVM
create a name for the MBean domain (package) + properties
register the MBean

JConsole
• Management application for JMX Available in (Oracle) JDK
• Key features Provides lot of useful information
• CPU usage, memory usage, MBean attributes
Connection to local or remote JVM

JConsole – demo

Performance analysis

Performance analysis
• Special case of runtime monitoring
• Goal: identification of Performance issues
• Code that should be optimized for speed or resource usage (memory, disk)
General performance characteristics• throughput, maximal load, ….
• Main approaches Use of profilers Benchmarking Load testing

Use of profilers

Profiler
• What it is Tool measuring frequency and duration of calls at runtime
• How it works Probing of target program’s counter (PC) at regular intervals
using interrupts (HW, SW)• Not 100% accurate ( sampling), but the target program runs at
near full speed Instrumentation of the target program (source code, binary)
with the goal of acquiring additional information• May slow down the program significantly
Reading information from HW performance counters• Provided by modern CPUs
• Existing tools Gprof, OProfile, Valgrind, Intel VTune, AMD CodeAnalyst, …
Gprof
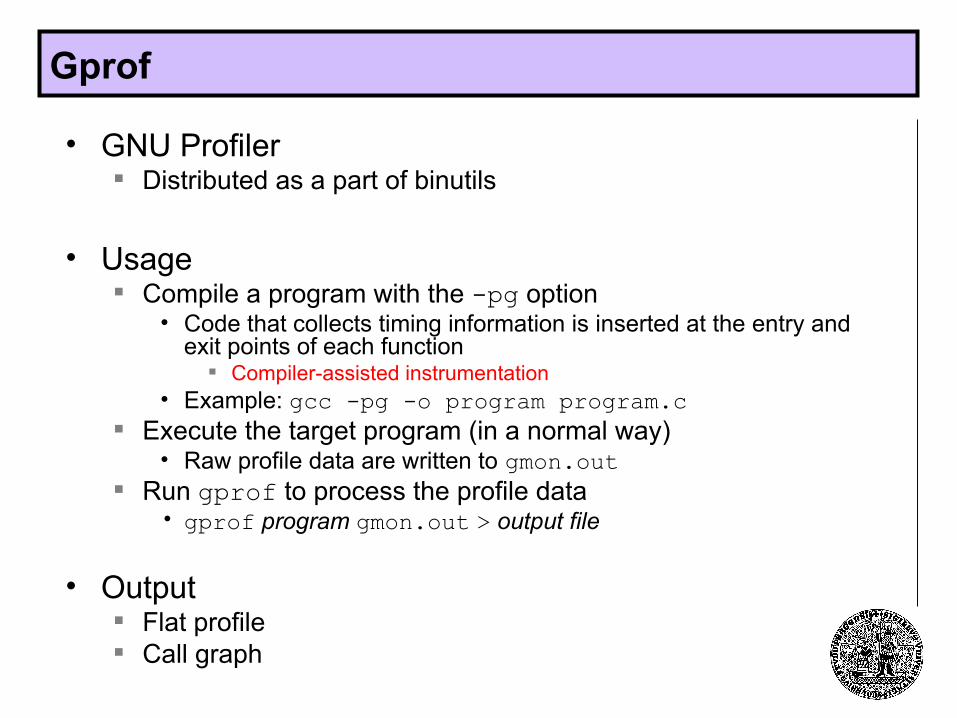
• GNU Profiler Distributed as a part of binutils
• Usage Compile a program with the -pg option
• Code that collects timing information is inserted at the entry and exit points of each function
Compiler-assisted instrumentation• Example: gcc -pg -o program program.c
Execute the target program (in a normal way)• Raw profile data are written to gmon.out
Run gprof to process the profile data• gprof program gmon.out > output file
• Output Flat profile Call graph

Gprof – flat profile
• Shows how much execution time was spent in each function (total, %)
• Example % cumulative self self total time seconds seconds calls ms/call ms/call name
33.34 0.02 0.02 7208 0.00 0.00 open
16.67 0.03 0.01 244 0.04 0.12 offtime
16.67 0.05 0.01 7 1.43 1.43 write
0.00 0.06 0.00 192 0.00 0.00 tolower
0.00 0.06 0.00 47 0.00 0.00 strlen
Taken from http://sourceware.org/binutils/docs-2.16/gprof/

Gprof – call graph
• Shows how much execution time was spent in each function and its children (caller) Allows to identify functions that don’t use much time by themselves
but call other “time-consuming” functions
• Example
index % time self children called name
[1] 100.0 0.00 0.05 start [1] 0.00 0.05 1/1 main [2] 0.00 0.00 1/1 exit [59] ----------------------------------------------- 0.00 0.05 1/1 start [1] [2] 100.0 0.00 0.05 1 main [2] 0.00 0.05 1/1 report [3]
Taken from http://sourceware.org/binutils/docs-2.16/gprof/
OProfile
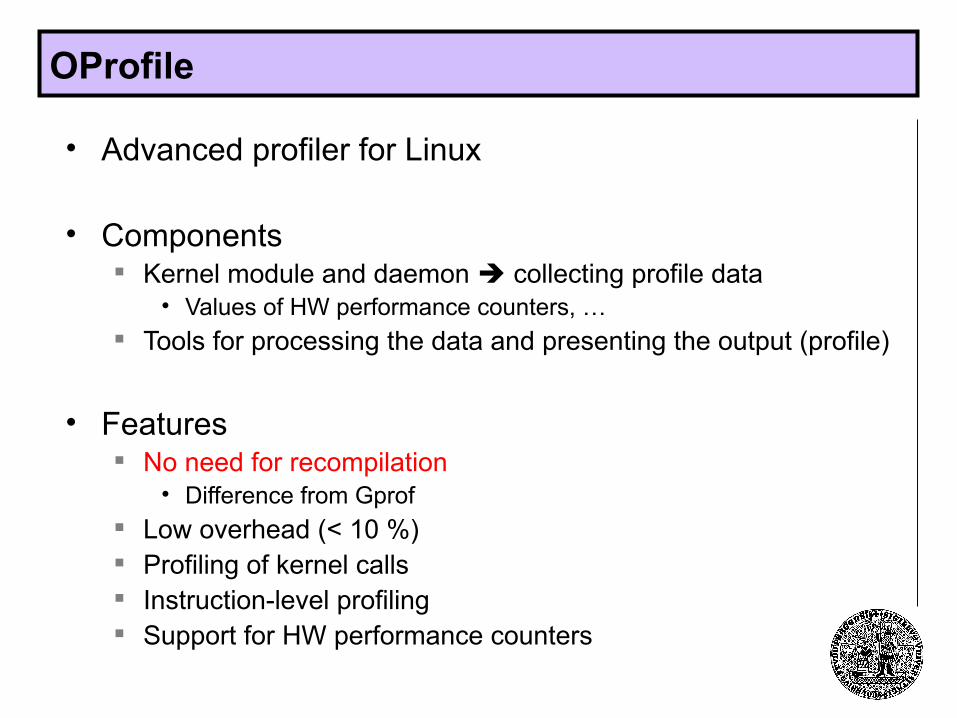
• Advanced profiler for Linux
• Components Kernel module and daemon collecting profile data
• Values of HW performance counters, … Tools for processing the data and presenting the output (profile)
• Features No need for recompilation
• Difference from Gprof Low overhead (< 10 %) Profiling of kernel calls Instruction-level profiling Support for HW performance counters

OProfile – usage
• Set up the profiler Profiling with kernel
opcontrol --vmlinux=/boot/vmlinux-`uname -r` Profiling without kernel
opcontrol –-no-vmlinux• Start the daemon
opcontrol –-start
• Profiler is running and collecting data run the target programs
• Stop the daemon opcontrol --shutdown
• Generate the profile summary System-wide (all programs)
opreport For a particular program
opreport -l program

OProfile – alternate usage [oprofile 0.9.8]
• operf [params] program [args]
• opreport [args]

OProfile – examples of output
• System-wide binary image summary Running time of various programs (total, %)
450385 75.6634 cc1plus 29313 8.9245 XFree86 1633 3.9543 as 0204 1.7142 oprofiled 7289 1.2245 vmlinux 7066 1.1871 bash 6417 1.0780 oprofile 1165 0.1957 kdeinit
• Symbol summary for a single application Running time for functions in a program (Lyx)
vma samples % symbol name0810c4ec 3323 5.6375 Paragraph::getFontSettings(...)081319d8 3220 5.4627 LyXText::getFont(...)080e3d78 2623 4.4499 LyXFont::LyXFont()080e3cf0 1804 3.0605 operator==(...)081ed020 1380 2.3412 font_metrics::width(...)
Taken from http://oprofile.sourceforge.net/examples/

Performance analysis – general issue
• Accurate performance analysis is hard and tricky Results of profiling are typically not 100% precise
• Statistical approximation is used
Many things influence performance in real environment• Resource sharing (cache), garbage collection, …
Benchmarking of programs running in a VM is even harder (e.g. Java)
• Behavior of Java programs depends on the behavior of JVM
• Recommended practice Use profilers only to identify those parts of your program
that are significantly slower than others
Instrumentation
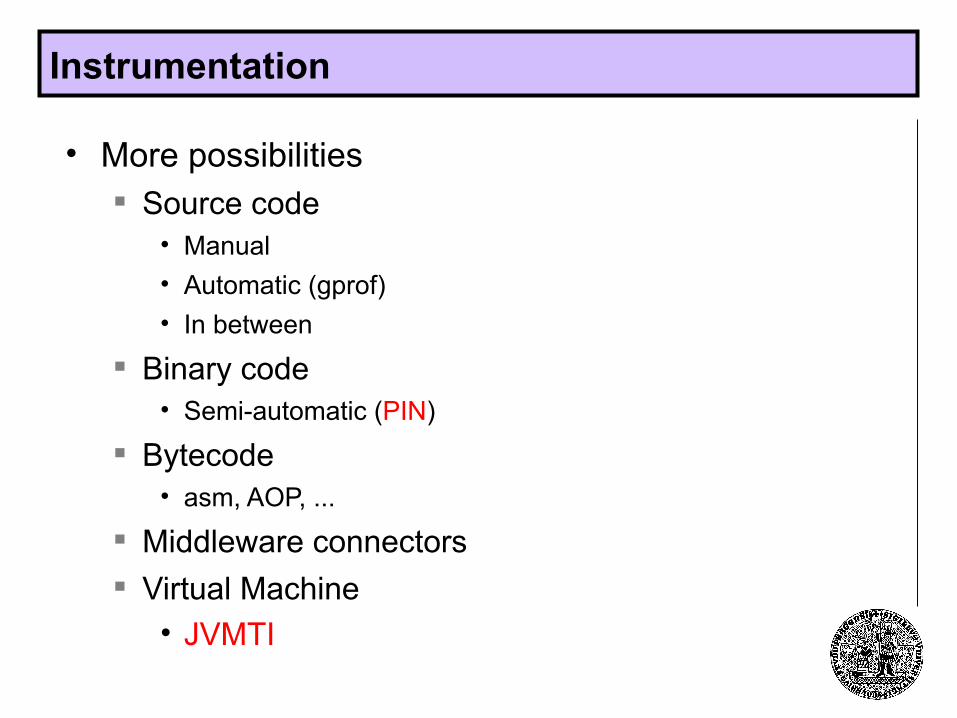
• More possibilities Source code
• Manual
• Automatic (gprof)
• In between
Binary code• Semi-automatic (PIN)
Bytecode• asm, AOP, ...
Middleware connectors
Virtual Machine• JVMTI
PIN
• Originally by Intel• Operation resembles JIT compilers
• Easy to use Many PINTools available
PIN Example – Instruction Counting
http://www.pintool.org/docs/43611/Pin/html/
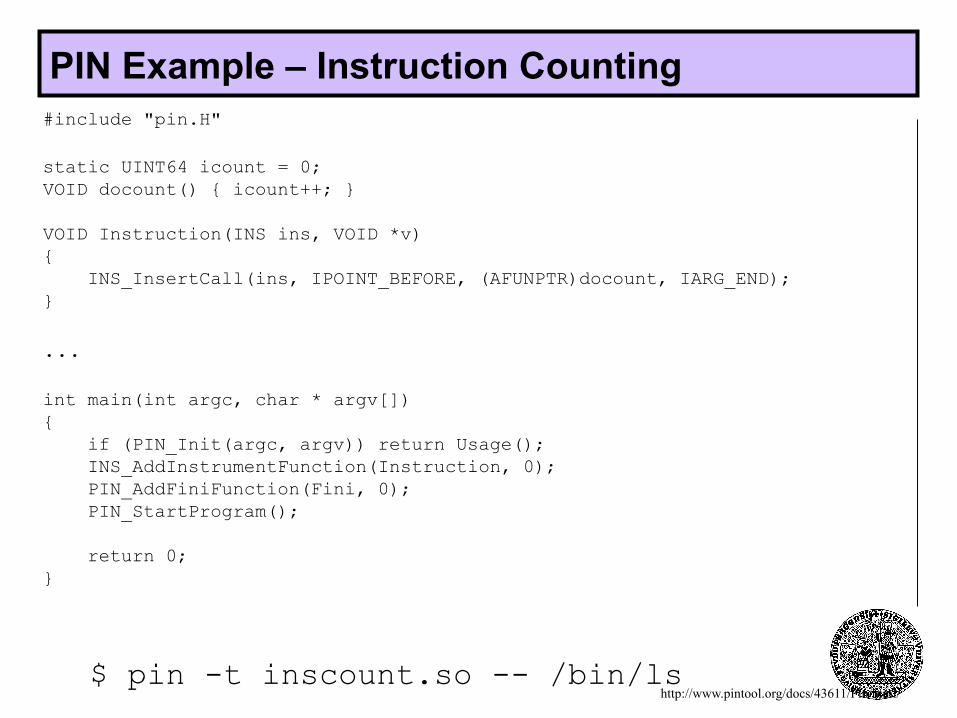
#include "pin.H"
static UINT64 icount = 0;VOID docount() { icount++; } VOID Instruction(INS ins, VOID *v){ INS_InsertCall(ins, IPOINT_BEFORE, (AFUNPTR)docount, IARG_END);}
...
int main(int argc, char * argv[]){ if (PIN_Init(argc, argv)) return Usage(); INS_AddInstrumentFunction(Instruction, 0); PIN_AddFiniFunction(Fini, 0); PIN_StartProgram(); return 0;}
$ pin -t inscount.so -- /bin/ls

PIN Example – Procedure Instruction Counting
http://www.pintool.org/docs/43611/Pin/html/
#include "pin.H"
...VOID docount(UINT64 * counter) {(*counter)++;}struct RTN_COUNT {...} VOID Routine(RTN rtn, VOID *v){ RTN_COUNT * rc = new RTN_COUNT; rc->_name = RTN_Name(rtn); rc->_icount = 0; rc->_rtnCount = 0; RTN_Open(rtn); RTN_InsertCall(rtn, IPOINT_BEFORE, (AFUNPTR)docount, IARG_PTR, &(rc->_rtnCount), IARG_END); for (INS ins = RTN_InsHead(rtn); INS_Valid(ins); ins = INS_Next(ins)) { INS_InsertCall(ins, IPOINT_BEFORE, (AFUNPTR)docount, IARG_PTR, &(rc->_icount), IARG_END); } RTN_Close(rtn);}
...int main(int argc, char * argv[]){ PIN_InitSymbols(); if (PIN_Init(argc, argv)) return Usage(); RTN_AddInstrumentFunction(Routine, 0); PIN_AddFiniFunction(Fini, 0); PIN_StartProgram(); return 0;}

JVMTI
• Java Virtual Machine Tool Interface
• Events gc, classes, threads, ...
• Functions allocations, threads, gc, ...

JVMTI Example#include "jni.h"#include "jvmti.h"...void JNICALL vm_GCStart(jvmtiEnv *jvmti_env) { // do something useful}...JNIEXPORT jint JNICALL Agent_OnLoad(JavaVM *vm, char *options, void *reserved) { jvmtiError err; jvmtiCapabilities capabilities; jvmtiEventCallbacks callbacks;
rc = (*vm)->GetEnv(vm, (void **)&jvmti, JVMTI_VERSION); if (rc != JNI_OK) { return -1; }
(void)memset(&capabilities,0, sizeof(capabilities)); capabilities.can_tag_objects = 1; ... capabilities.can_generate_garbage_collection_events = 1;
err = (*jvmti)->AddCapabilities(jvmti, &capabilities); if (err != JVMTI_ERROR_NONE) { return -1; }
memset(&callbacks, 0, sizeof(callbacks)); callbacks.VMInit = &vm_init; callbacks.VMStart = &vm_start; callbacks.VMDeath = &vm_death; callbacks.GarbageCollectionStart = &vm_GCStart; (*jvmti)->SetEventCallbacks(jvmti, &callbacks, sizeof(callbacks));
(*jvmti)->SetEventNotificationMode(jvmti, JVMTI_ENABLE, JVMTI_EVENT_GARBAGE_COLLECTION_START, NULL); ... return JNI_OK;}

Load testing

Load testing
• Basic idea Testing application’s behavior under heavy load
• Both functional and performance aspects
• Target domains Distributed systems Web applications
• Tools JMeter, …

JMeter
• Tool for performance testing of network applications under heavy load Designed mainly for Web applications
• Key features Simulator of different types of load
• Many concurrent requests for small pieces of data• Few concurrent requests for large data files• …
Supported server types• WWW (HTTP), Mail (POP3), Database (JDBC), …

Using JMeter
• Building a test plan Definition of tests via GUI
• Running the tests Two options: GUI, command-line
• Inspecting test results Graphical representation

Test plan
• Determines an ordered list of actions• Nesting is possible hierarchy
• Components Thread group Samplers Logical controllers Timers Listeners

Components of a test plan
• Thread group Controls the number of threads “Ramp-up” period
• Each thread starts some time after the previous one
• Sampler Instruction to send a request (HTTP, JDBC, …)
• Logical controller Control-flow between requests
• loops, interleaving, …
• Timer Delays between successive requests
• Listener Access to test results and other information
• Graph results, …

Example of a test plan
• Order of requests One, Two, Three, Four
Picture taken from http://jakarta.apache.org/jmeter/usermanual/build-test-plan.html
Running the tests
• GUI Menu “Run -> Start”
• Command-line jmeter -n -t my_plan.jmx -l my_log.jtl

JMeter demo

Want to learn more ?
• NSWI131: Vyhodnocování výkonnosti počítačových systémů LS

Links
• Syslog http://www.syslog.org/
• Log4j http://logging.apache.org/log4j/index.html
• Java Management Extensions (JMX) http://java.sun.com/javase/technologies/core/mntr-mgmt/javamanagement/ http://java.sun.com/docs/books/tutorial/jmx/ http://java.sun.com/javase/6/docs/technotes/guides/management/jconsole.html
• Gprof
http://sourceware.org/binutils/docs/gprof/
• OProfile http://oprofile.sourceforge.net/
• JMeter http://jakarta.apache.org/jmeter/
• PIN
http://www.pintool.org
• JVMTI
http://docs.oracle.com/javase/6/docs/platform/jvmti/jvmti.html