running the british economy economic ,fiscal and monetary strategy … · · 2010-04-26fiscal and...
TRANSCRIPT
HM Treasury ME REPORT BY LINUS FERNANDES, ERACLIS ACHNIOTIS, MARIOS PAUL PETRIDES
A SPECIAL REVIEW AND ANALYSIS REPORT OF THE FISCAL AND MONETARY STRATEGY FOLLOWED BY OF THE CHANCELLOR OF THE
EXCHEQUER OVER THE LAST DECADEFOR THE YEARS XXO6 TO XX15
RUNNING THE BRITISH ECONOMY
ECONOMIC ,FISCAL AND MONETARY STRATEGYREPORT
As laid before the House of Commons by the LEM Team acting as Chancellor of the Exchequer for the UK
BY LINUS FERNANDES
ERACLIS ACHNIOTIS
MARIOS PAUL PETRIDES

A strong and strengthening British economy Team2 RBE Report -HM Treasury
1
Rt. Hon John McFall MPChairman of the treasury committee The House of Commons
Dear Sir,Subject: Special review and analysis report of the fiscal and monetary policy
followed by the Chancellor of the Exchequer (the LEM team) over the past decade with the Vision of strengthening the British economy and maximising the well being of the British People.
I. Terms of Engagement and Vision
The Vision
of the Team
is to
Strengthen
the British
Economy
and
maximise the
well being of
the British
People
In accordance with the terms of our engagement and always with the intention of maximising the well being of the British People in mind we have assessed the situation inherited from the previous chancellor and have taken fiscal and monetary measures so as to improve the inherited situation, reduce unemployment and inflation, maximise economic growth and generally improve the state of the British Economy.
The purpose of this report is to present to you our analysis of the inherited situation (as in XX06) and to explain the reasoning behind the Fiscal and /or monetary measures undertaken and the impact that these measures have had on the British economy and the economic well being of the British people over the last decade.
This report is addressed to the House of Commons Treasury Committee and is to be delivered via its chairman.
II. MethodologyThe Analysis
of the state
of the
Economy at
each point
with the use
of Macro-
economic
concepts and
the Fiscal
and
Monetary
Instruments
used formed
the Basis of
the Teams
Methodology
Specifically, the work carried out mainly included the following:
(a) Analysed the situation in existence when the LEM team took over as Chancellor of the Exchequer and Identified problem areas and potentially problem/risk areas and prepared an overall assessment report of the inherited situation.
(b) Analysed the effects of exogenous shocks faced by the British economy year by year and their short term and possible long term effects on the British economy as these occurred.
(c) Using Fiscal and Monetary measures the team tried to minimise the negative effects of exogenous shocks on the British economy and to maximise country’s economic well being.
(d) Using Macroeconomic theory and concepts we analysed the effect that our Fiscal and Monetary strategy has had on the British economy
(e) Prepared an overall assessment for our time in office including an analysis of policy actions that did not achieve the intended goals and the reasoning as to why these measures did not have the desirable outcomes expected by the LEM team
A strong and strengthening British economy Team2 RBE Report -HM Treasury
This report is set out in the following paragraphs:
100.EXECUTIVE SUMMARY.................................................................................................................................................3200.INTRODUCTION.............................................................................................................................................................12300.INHERITED SITUATION – A DETAILED DESCRIPTION.........................................................................................16400.DETAIL ANALYSIS OF THE SITUATION IN EACH YEAR ....................................................................................22500.CONCLUSIONS...............................................................................................................................................................46600. APPENDICES.................................................................................................................................................................47
2
Page
A strong and strengthening British economy Team2 RBE Report -HM Treasury
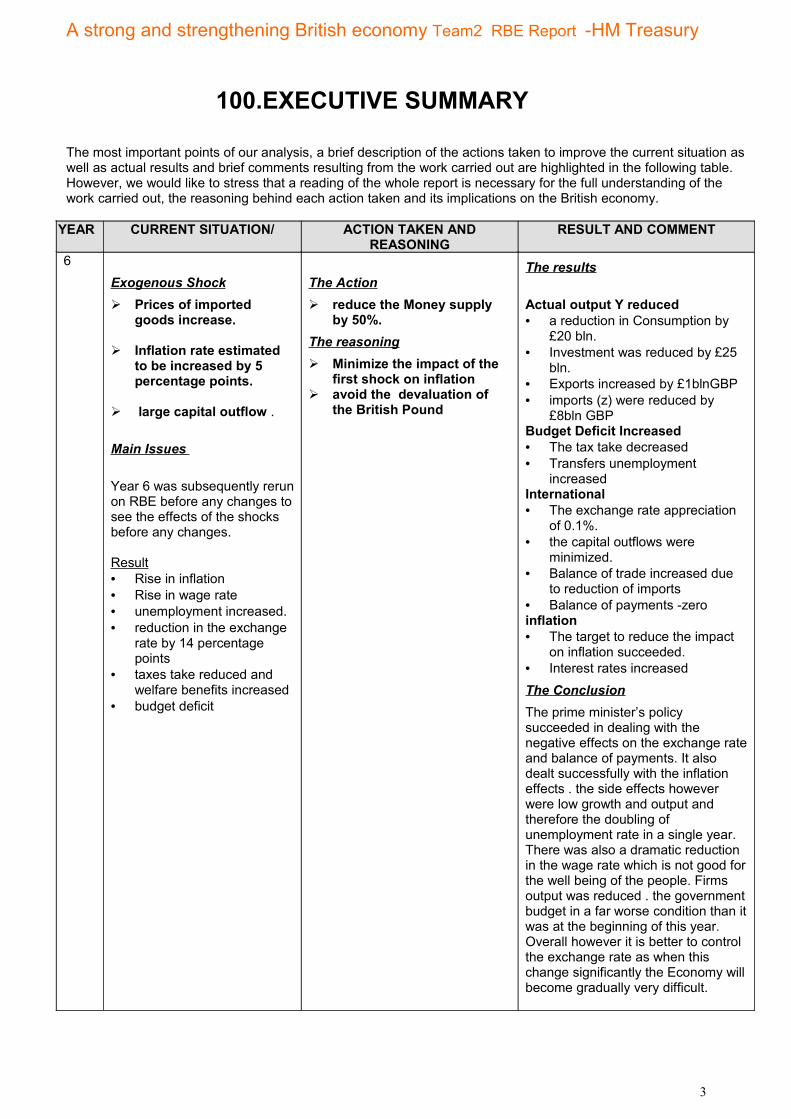
100.EXECUTIVE SUMMARY
The most important points of our analysis, a brief description of the actions taken to improve the current situation as well as actual results and brief comments resulting from the work carried out are highlighted in the following table. However, we would like to stress that a reading of the whole report is necessary for the full understanding of the work carried out, the reasoning behind each action taken and its implications on the British economy.
YEAR CURRENT SITUATION/ ACTION TAKEN AND REASONING
RESULT AND COMMENT
6Exogenous Shock Prices of imported
goods increase.
Inflation rate estimated to be increased by 5 percentage points.
large capital outflow .
Main Issues
Year 6 was subsequently rerun on RBE before any changes to see the effects of the shocks before any changes.
Result• Rise in inflation• Rise in wage rate• unemployment increased.• reduction in the exchange
rate by 14 percentage points
• taxes take reduced and welfare benefits increased
• budget deficit
The Action reduce the Money supply
by 50%.The reasoning Minimize the impact of the
first shock on inflation avoid the devaluation of
the British Pound
The results
Actual output Y reduced• a reduction in Consumption by
£20 bln.• Investment was reduced by £25
bln.• Exports increased by £1blnGBP• imports (z) were reduced by
£8bln GBPBudget Deficit Increased• The tax take decreased • Transfers unemployment
increasedInternational• The exchange rate appreciation
of 0.1%.• the capital outflows were
minimized.• Balance of trade increased due
to reduction of imports• Balance of payments -zeroinflation• The target to reduce the impact
on inflation succeeded.• Interest rates increasedThe ConclusionThe prime minister’s policy succeeded in dealing with the negative effects on the exchange rate and balance of payments. It also dealt successfully with the inflation effects . the side effects however were low growth and output and therefore the doubling of unemployment rate in a single year. There was also a dramatic reduction in the wage rate which is not good for the well being of the people. Firms output was reduced . the government budget in a far worse condition than it was at the beginning of this year. Overall however it is better to control the exchange rate as when this change significantly the Economy will become gradually very difficult.
3
A strong and strengthening British economy Team2 RBE Report -HM Treasury
YEAR CURRENT SITUATION/ ACTION TAKEN AND REASONING
RESULT AND COMMENT
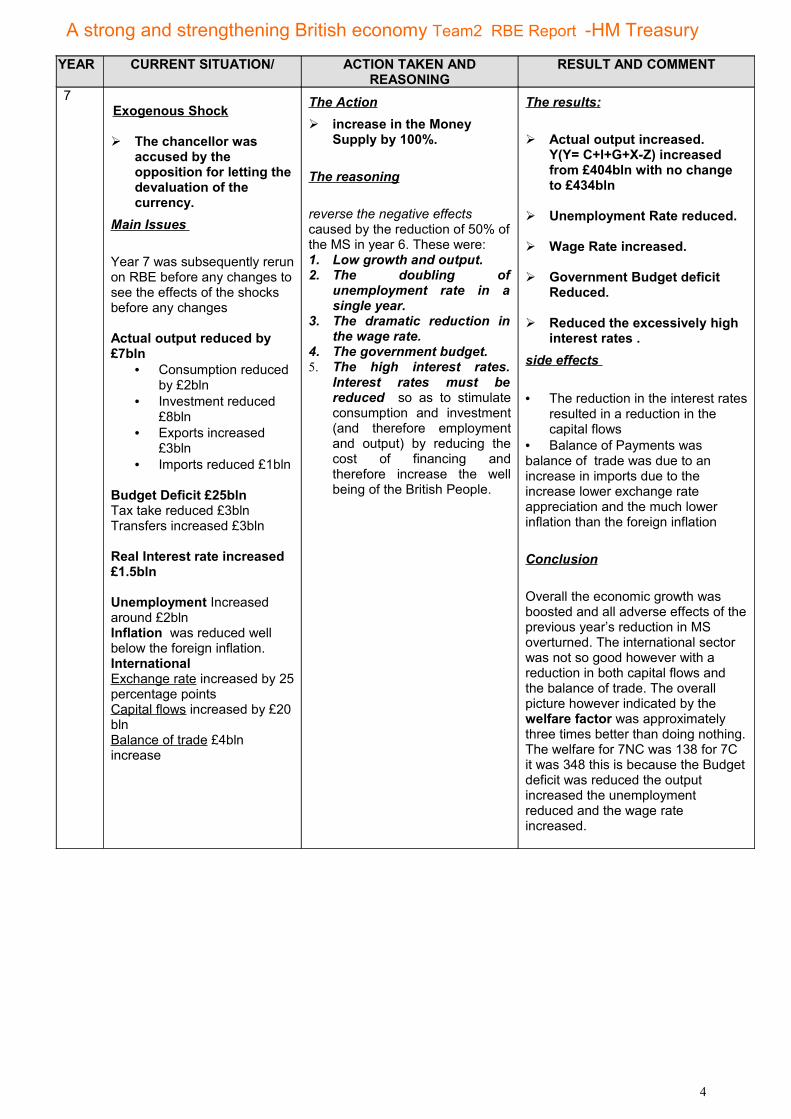
7Exogenous Shock
The chancellor was accused by the opposition for letting the devaluation of the currency.
Main Issues
Year 7 was subsequently rerun on RBE before any changes to see the effects of the shocks before any changes
Actual output reduced by £7bln
• Consumption reduced by £2bln
• Investment reduced £8bln
• Exports increased £3bln
• Imports reduced £1bln
Budget Deficit £25blnTax take reduced £3blnTransfers increased £3bln
Real Interest rate increased £1.5bln
Unemployment Increased around £2blnInflation was reduced well below the foreign inflation.International Exchange rate increased by 25 percentage pointsCapital flows increased by £20 blnBalance of trade £4bln increase
The Action increase in the Money
Supply by 100%.
The reasoning
reverse the negative effects caused by the reduction of 50% of the MS in year 6. These were:1. Low growth and output.2. The doubling of
unemployment rate in a single year.
3. The dramatic reduction in the wage rate.
4. The government budget. 5. The high interest rates.
Interest rates must be reduced so as to stimulate consumption and investment (and therefore employment and output) by reducing the cost of financing and therefore increase the well being of the British People.
The results:
Actual output increased. Y(Y= C+I+G+X-Z) increased from £404bln with no change to £434bln
Unemployment Rate reduced.
Wage Rate increased.
Government Budget deficit Reduced.
Reduced the excessively high interest rates .
side effects
• The reduction in the interest rates resulted in a reduction in the capital flows
• Balance of Payments was balance of trade was due to an increase in imports due to the increase lower exchange rate appreciation and the much lower inflation than the foreign inflation
Conclusion
Overall the economic growth was boosted and all adverse effects of the previous year’s reduction in MS overturned. The international sector was not so good however with a reduction in both capital flows and the balance of trade. The overall picture however indicated by the welfare factor was approximately three times better than doing nothing. The welfare for 7NC was 138 for 7C it was 348 this is because the Budget deficit was reduced the output increased the unemployment reduced and the wage rate increased.
4
A strong and strengthening British economy Team2 RBE Report -HM Treasury
YEAR CURRENT SITUATION/ ACTION TAKEN AND REASONING
RESULT AND COMMENT
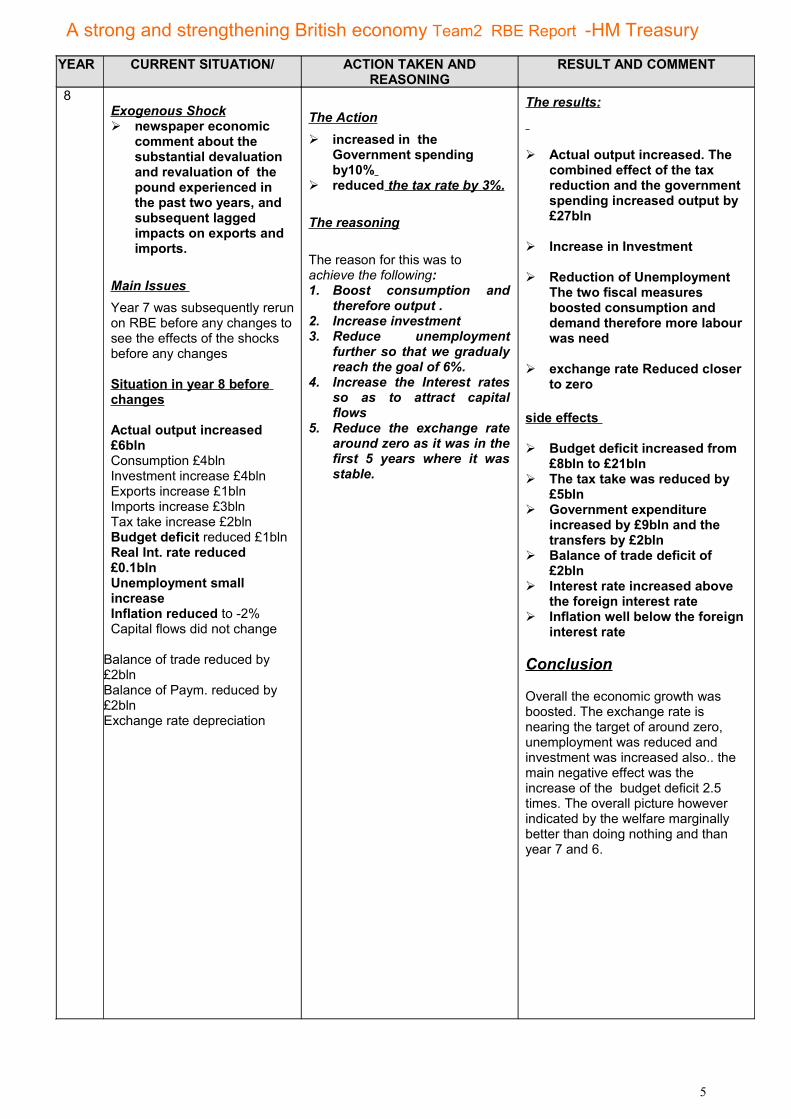
8Exogenous Shock newspaper economic
comment about the substantial devaluation and revaluation of the pound experienced in the past two years, and subsequent lagged impacts on exports and imports.
Main Issues Year 7 was subsequently rerun on RBE before any changes to see the effects of the shocks before any changes
Situation in year 8 before changes
Actual output increased £6blnConsumption £4blnInvestment increase £4blnExports increase £1blnImports increase £3blnTax take increase £2blnBudget deficit reduced £1bln Real Int. rate reduced £0.1blnUnemployment small increaseInflation reduced to -2%Capital flows did not change
Balance of trade reduced by £2blnBalance of Paym. reduced by £2blnExchange rate depreciation
The Action increased in the
Government spending by10%
reduced the tax rate by 3%.
The reasoning
The reason for this was to achieve the following:1. Boost consumption and
therefore output .2. Increase investment3. Reduce unemployment
further so that we gradualy reach the goal of 6%.
4. Increase the Interest rates so as to attract capital flows
5. Reduce the exchange rate around zero as it was in the first 5 years where it was stable.
The results:
Actual output increased. The combined effect of the tax reduction and the government spending increased output by £27bln
Increase in Investment
Reduction of Unemployment The two fiscal measures boosted consumption and demand therefore more labour was need
exchange rate Reduced closer to zero
side effects
Budget deficit increased from £8bln to £21bln
The tax take was reduced by £5bln
Government expenditure increased by £9bln and the transfers by £2bln
Balance of trade deficit of £2bln
Interest rate increased above the foreign interest rate
Inflation well below the foreign interest rate
Conclusion
Overall the economic growth was boosted. The exchange rate is nearing the target of around zero, unemployment was reduced and investment was increased also.. the main negative effect was the increase of the budget deficit 2.5 times. The overall picture however indicated by the welfare marginally better than doing nothing and than year 7 and 6.
5

A strong and strengthening British economy Team2 RBE Report -HM Treasury
YEAR CURRENT SITUATION/ ACTION TAKEN AND REASONING
RESULT AND COMMENT
9 Exogenous Shock
Investment plans worth £10 billion might be shelved due to uncertainty in International Markets
Main Issues
Gap between potential and actual output has been reduced but still need for further
Unemployment has been reduced to 8,5% but still higher than our target rate of 6%.
The Action
Decision to continue with expansive fiscal and monetary policy by increasing both, government expenditure (+20%) and money supply (+20%).The reasoning
• Uncertainty in international markets and estimates would have a negative effect on investment (I).
• Our decision targeted decrease in gap between Y and Q, lower unemployment and reduction of interest rate.
The results• Unemployment has been
decreased to 5,4%.
• Noticeable increase in potential output (Q) attributed to growth in quality and quantity of labour force and the capital stock as well as technological progress,
10 Exogenous Shock
Planned Tax reduction from 26% to 22% and reduction in Investment
Main Issues
Actual output exceeds potential output.
Unemployment reduced to 5,4%.
Further significant increase in budget deficit.
The ActionDecision follow a more conservative approach with a reduction in government
expenditure (-1%) reduction in money supply
(-7%).
The reasoning
Business community still forced to invest less due to uncertainty in economic environment.
Predicted reduction in direct taxes would function as an incentive to consumers.
Increase in consumption would raise the level of demand and encourage economic growth.
The results
Gap between actual and potential output has been increased.
Relatively small reduction in the budget deficit.
Unemployment rate has been reduced.
Improvement in percentage values of C, I ,G (60%, 17% 23%) but still a need for improvement in order to reach the ideal 60%, 20%, 20%.
Exchange rate, as a result of decrease in money supply, increased. This may affect the balance of trade with a possible increase in imports.
6
A strong and strengthening British economy Team2 RBE Report -HM Treasury
YEAR CURRENT SITUATION/ ACTION TAKEN AND REASONING
RESULT AND COMMENT
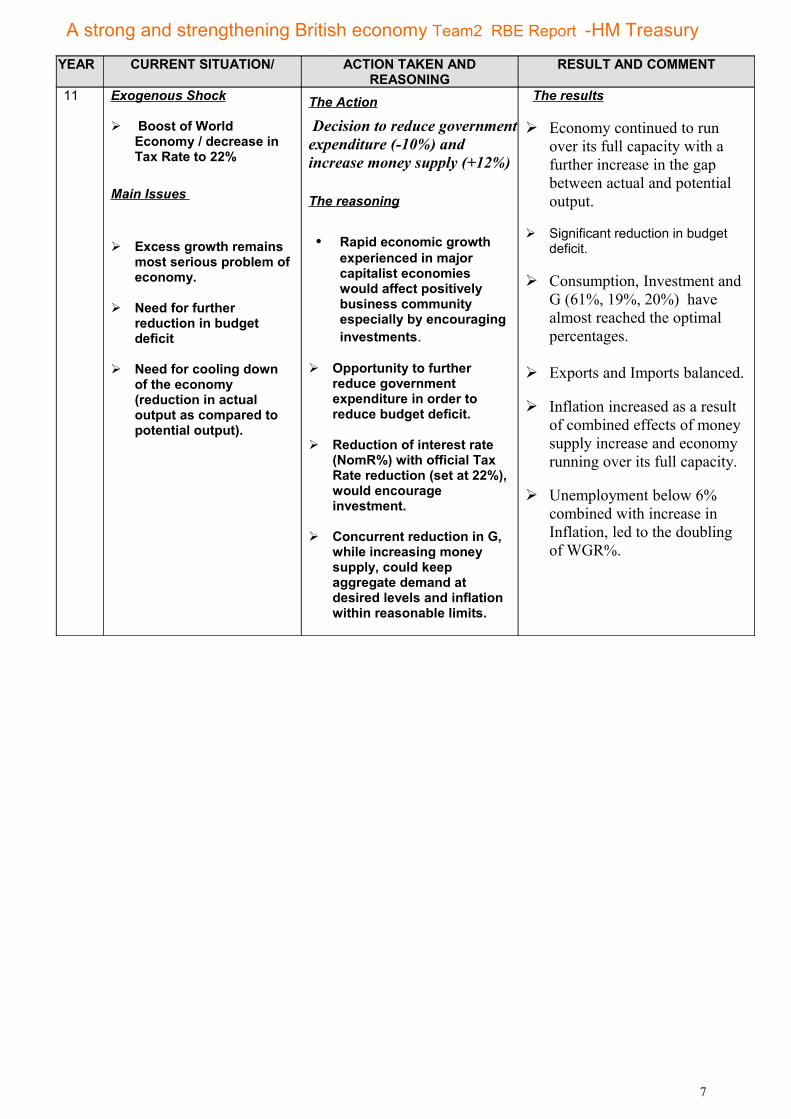
11 Exogenous Shock
Boost of World Economy / decrease in Tax Rate to 22%
Main Issues
Excess growth remains most serious problem of economy.
Need for further reduction in budget deficit
Need for cooling down of the economy (reduction in actual output as compared to potential output).
The Action
Decision to reduce government expenditure (-10%) and increase money supply (+12%)
The reasoning
• Rapid economic growth experienced in major capitalist economies would affect positively business community especially by encouraging investments.
Opportunity to further reduce government expenditure in order to reduce budget deficit.
Reduction of interest rate (NomR%) with official Tax Rate reduction (set at 22%), would encourage investment.
Concurrent reduction in G, while increasing money supply, could keep aggregate demand at desired levels and inflation within reasonable limits.
The results
Economy continued to run over its full capacity with a further increase in the gap between actual and potential output.
Significant reduction in budget deficit.
Consumption, Investment and G (61%, 19%, 20%) have almost reached the optimal percentages.
Exports and Imports balanced.
Inflation increased as a result of combined effects of money supply increase and economy running over its full capacity.
Unemployment below 6% combined with increase in Inflation, led to the doubling of WGR%.
7
A strong and strengthening British economy Team2 RBE Report -HM Treasury
YEAR CURRENT SITUATION/ ACTION TAKEN AND REASONING
RESULT AND COMMENT
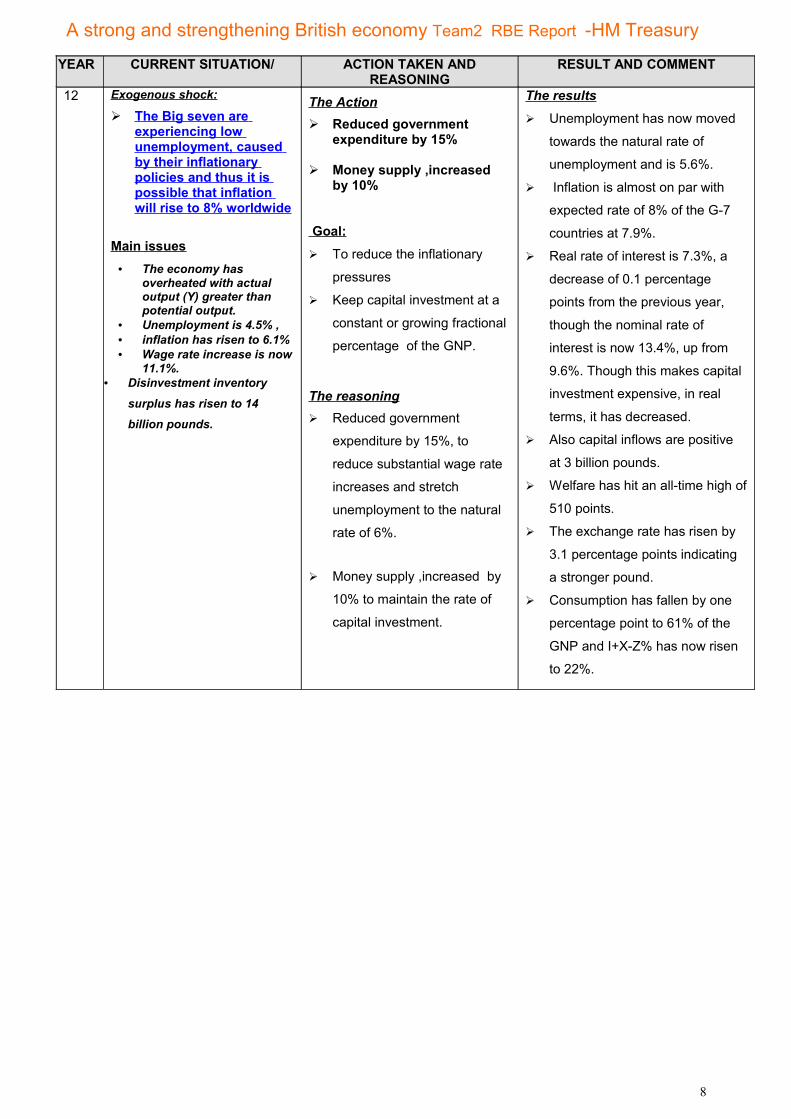
12 Exogenous shock:
The Big seven are experiencing low unemployment, caused by their inflationary policies and thus it is possible that inflation will rise to 8% worldwide
Main issues• The economy has
overheated with actual output (Y) greater than potential output.
• Unemployment is 4.5% , • inflation has risen to 6.1% • Wage rate increase is now
11.1%.• Disinvestment inventory
surplus has risen to 14
billion pounds.
The Action Reduced government
expenditure by 15%
Money supply ,increased by 10%
Goal: To reduce the inflationary
pressures
Keep capital investment at a
constant or growing fractional
percentage of the GNP.
The reasoning Reduced government
expenditure by 15%, to
reduce substantial wage rate
increases and stretch
unemployment to the natural
rate of 6%.
Money supply ,increased by
10% to maintain the rate of
capital investment.
The results Unemployment has now moved
towards the natural rate of
unemployment and is 5.6%.
Inflation is almost on par with
expected rate of 8% of the G-7
countries at 7.9%.
Real rate of interest is 7.3%, a
decrease of 0.1 percentage
points from the previous year,
though the nominal rate of
interest is now 13.4%, up from
9.6%. Though this makes capital
investment expensive, in real
terms, it has decreased.
Also capital inflows are positive
at 3 billion pounds.
Welfare has hit an all-time high of
510 points.
The exchange rate has risen by
3.1 percentage points indicating
a stronger pound.
Consumption has fallen by one
percentage point to 61% of the
GNP and I+X-Z% has now risen
to 22%.
8
A strong and strengthening British economy Team2 RBE Report -HM Treasury
YEAR CURRENT SITUATION/ ACTION TAKEN AND REASONING
RESULT AND COMMENT
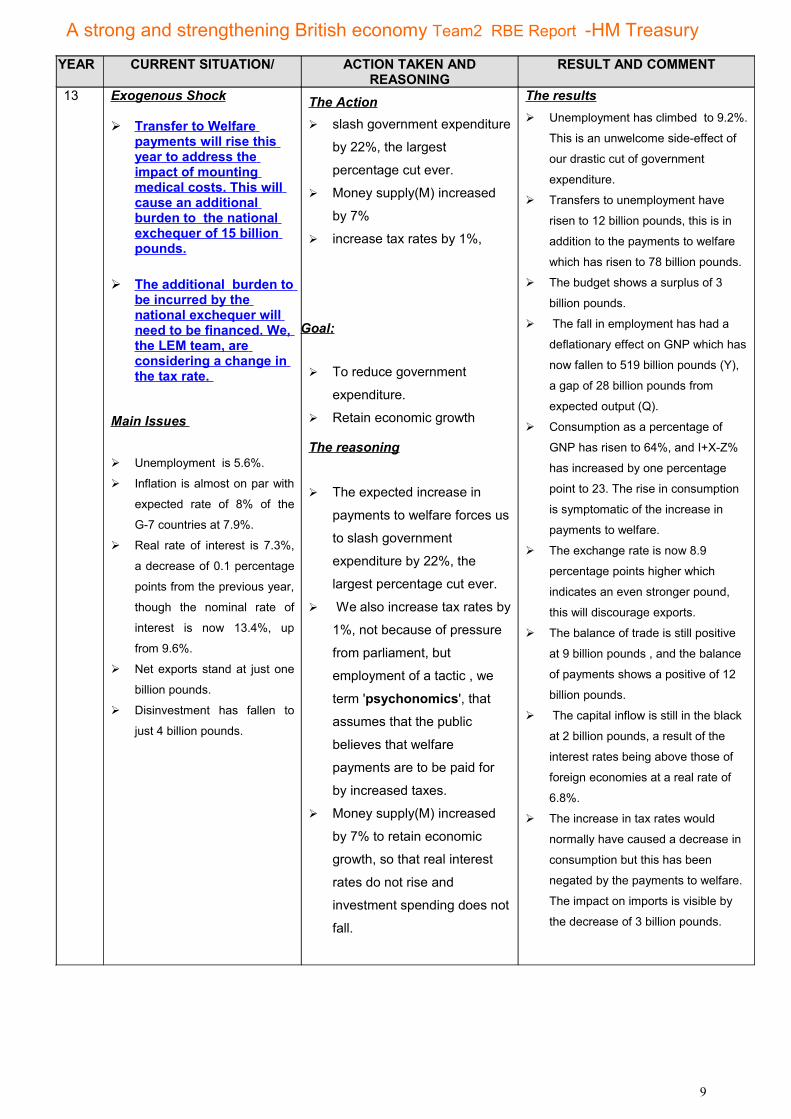
13 Exogenous Shock
Transfer to Welfare payments will rise this year to address the impact of mounting medical costs. This will cause an additional burden to the national exchequer of 15 billion pounds.
The additional burden to be incurred by the national exchequer will need to be financed. We, the LEM team, are considering a change in the tax rate.
Main Issues
Unemployment is 5.6%.
Inflation is almost on par with
expected rate of 8% of the
G-7 countries at 7.9%.
Real rate of interest is 7.3%,
a decrease of 0.1 percentage
points from the previous year,
though the nominal rate of
interest is now 13.4%, up
from 9.6%.
Net exports stand at just one
billion pounds.
Disinvestment has fallen to
just 4 billion pounds.
The Action slash government expenditure
by 22%, the largest
percentage cut ever.
Money supply(M) increased
by 7%
increase tax rates by 1%,
Goal:
To reduce government
expenditure.
Retain economic growth
The reasoning
The expected increase in
payments to welfare forces us
to slash government
expenditure by 22%, the
largest percentage cut ever.
We also increase tax rates by
1%, not because of pressure
from parliament, but
employment of a tactic , we
term 'psychonomics', that
assumes that the public
believes that welfare
payments are to be paid for
by increased taxes.
Money supply(M) increased
by 7% to retain economic
growth, so that real interest
rates do not rise and
investment spending does not
fall.
The results Unemployment has climbed to 9.2%.
This is an unwelcome side-effect of
our drastic cut of government
expenditure.
Transfers to unemployment have
risen to 12 billion pounds, this is in
addition to the payments to welfare
which has risen to 78 billion pounds.
The budget shows a surplus of 3
billion pounds.
The fall in employment has had a
deflationary effect on GNP which has
now fallen to 519 billion pounds (Y),
a gap of 28 billion pounds from
expected output (Q).
Consumption as a percentage of
GNP has risen to 64%, and I+X-Z%
has increased by one percentage
point to 23. The rise in consumption
is symptomatic of the increase in
payments to welfare.
The exchange rate is now 8.9
percentage points higher which
indicates an even stronger pound,
this will discourage exports.
The balance of trade is still positive
at 9 billion pounds , and the balance
of payments shows a positive of 12
billion pounds.
The capital inflow is still in the black
at 2 billion pounds, a result of the
interest rates being above those of
foreign economies at a real rate of
6.8%.
The increase in tax rates would
normally have caused a decrease in
consumption but this has been
negated by the payments to welfare.
The impact on imports is visible by
the decrease of 3 billion pounds.
9

A strong and strengthening British economy Team2 RBE Report -HM Treasury
YEAR CURRENT SITUATION/ ACTION TAKEN AND REASONING
RESULT AND COMMENT
14 Exogenous Shock
The Prime Minister's announcement of the ban on harmful food products from abroad, will have a deflationary impact on the import bill, with a tendency to lead to a surplus balance of trade.
Main issues
Unemployment (9.2%) ,
transfers to unemployment
(12 billion pounds),
payments to welfare (78
billion pounds) make the
LEM team's job doubly
burdensome.
The fall in employment has
had a deflationary effect
on GNP which has now
fallen to 519 billion pounds
(Y), a gap of 28 billion
pounds from expected
output (Q).
The exchange rate has
risen by 8.9 percentage
points which indicates an
even stronger pound, this
will discourage exports,
The Action to decrease money supply by
17% increasing government
expenditure by 10%.
Goal: To curb inflationary
To curb unemployment
The reasoning
We aim to curb
unemployment by increasing
government expenditure by
10%.
We have also decided to
decrease money supply by
17% to bring down inflation.
This should have a stabilizing
effect on the economy.
The results The deflationary policies that we
implemented have succeeded and
have caused deflation at 0.1%.
Unemployment though has
increased by 1.4 percentage points
to 10.6.
The gap between actual and
potential output has widened further,
an indicator that an increase in the
unemployment rate
above the natural rate of
unemployment always leads
to a decline in
productivity of the economy.
Consumption has decreased by one
percentage point to 63% and so is
the case with I + (X-Z) % to 22%.
The increase in the interest rates is
another contributing factor to the
decrease in capital investment..
Welfare has fallen to 432 points.
The government expenditure has
increased by 2 percentage points to
15% but has failed to stimulate the
economy sufficiently.
The real rate of interest has
increased to 11.3% attracting
foreign capital inflow to the
tune of 9 billion pounds, balance
of trade and balance of payments
are positive at 25 & 33 billion
pounds respectively.
The exchange rate has climbed 26.5
percentage points keeping the pound
strong.
10

A strong and strengthening British economy Team2 RBE Report -HM Treasury
YEAR CURRENT SITUATION/ ACTION TAKEN AND REASONING
RESULT AND COMMENT
15 Exogenous Shock
The food scare continues continuing the deflationary effect on the import bill.
The LEM team is under time pressure since the results from a GALLUP poll indicate the public's disfavor. We are now under the microscope, every action taken in this fiscal and election year, wil l be disassembled, for public consumption.
Main Issues:
The economy is
experiencing deflation at
0.1%.
Unemployment is 10.6 %
Consumption has
decreased by one
percentage point to 63%
and so is the case with I +
(X-Z) % to 22%.
The increase in the
interest rates is another
contributing factor to the
decrease in capital
investment..
Welfare has fallen to 432
points. .
The Action increase government
expenditure by 20% and increase money supply by
20%
Goal:
To reduce unemployment.
Increase capital investnment
The reasoning
We feel the need to reduce
unemployment by increasing
government expenditure and
increase capital investment by
increasing money supply to lower
the rate of interest i.e. the cost of
money.
We increase government
expenditure by 20% and increase
money supply by 20% to hope to
jump-start the economy.
The results: At the end of year 15
,unemployment has fallen by 0.4
percentage points to 10.2 , an
indicator that a 20% increase in
government expenditure was too
little, too late. However, a 2 year
span would reveal the true
effects of this expansionist policy.
However, we were constrained
by our policy of minimizing the
government's role in the running
of the economy.
Wage rates have fallen by 0.2%,
a worrisome indicator that the economy is probably moving towards a recession.
Consumption increased by one
percentage point to 64 but I
+(X-Z) has fallen to 19%
indicating that the monetary
policy implemented has not had
the desired effect.
Capital investment has increased
by 8 billion pounds , an increase
of approximately 9%. This has
however been offset by the
decrease in the balance of trade
from a high of 25 to 5 billion
pounds.
The fall in the real rate of interest
will make borrowing money for
capital investment more attractive
to firms. The exchange rate has
climbed 7.1 percentage points ,
indicating the pound's strength.
The gap between potential and
actual output has narrowed to 40
billion pounds, indicating that
unemployment is still the most
crucial aspect of this economy.
11

A strong and strengthening British economy Team2 RBE Report -HM Treasury
200.INTRODUCTIONOur Vision
Our vision from the beginning of our term in office was to create and maintain a strong British economy and to maximising the well being of the British People.
Our missionThe mission of this team while acting as Chancellor of the Exchequer was to create an economic framework within which the British people will be given the prospect of steady employment, relatively stable prices and a rising standard of living.
Four main goals
In order to achieve our mission four goals during our time in office were to achieve the following:• keep inflation low.• keep a low unemployment level.• to sustain a high and stable level of economic growth. • Maintain a balance of Payments.
(Note : for definitions of the colored terms above please refer to Appendix I)
Our first two goals were as mentioned above to keep inflation and unemployment low while at the same time realising that these two variables are inversely related according to the Philips Curve at least in the short run (according to subsequent theories).
Philips Curve According to the Philips Curve theory in periods of high unemployment and low demand for labour the excess supply of labour holds wages and prices down (i.e. low inflation).In periods of low unemployment and high labour demand however the excess labour demand pushes wages and prices up faster thus gives rise to high inflation. Into the 1970s, however, many countries experienced high levels of both inflation and unemployment also known as stagflation.Subsequent theories however have proven that this relationship does not stand in the long run. The theory of the "natural" rate of unemployment – distinguishes between the short-term Phillips curve and the long-term one. The short-term PC looked like a normal PC but shifted in the long run as expectations for inflation changed. In the long run, only a single rate of unemployment (the NAIRU or "natural" rate) was consistent with a stable inflation rate. Therefore the long-run PC is vertical, so there was no trade-off between inflation and unemployment.
In the diagram, the long-run Phillips curve is the vertical red line. The NAIRU theory says that when unemployment is at the rate defined by this line, inflation will be stable. However, in the short-run policymakers will face an inflation-unemployment rate tradeoff marked by the Initial Short-Run Phillips Curve. Policymakers can therefore reduce the unemployment rate temporarily, moving from point A to point B through expansionary policy. However, according to the NAIRU, exploiting this short-run tradeoff will raise inflation expectations, shifting the short-run curve rightward to the New Short-Run Phillips Curve and moving the point of equilibrium from B to C. Thus the
12

A strong and strengthening British economy Team2 RBE Report -HM Treasury
reduction in unemployment below the "Natural Rate" will be temporary, and lead only to higher inflation in the long run
We realise that full employment can never mean zero registered unemployment (if only because of dynamic change within society) we therefore accept that even when the economy is running at full capacity (i.e. the Gross National Product equals the potential output i.e. Y=Q) some unemployment will still exist (6% rate of unemployment).
Apart from unemployment inflation also depends on the demand for goods and services, on expectations based on the previous year’s inflation and on the exchange rate.
The exchange rate affects the standard of living as it determines in simple terms how many goods we can get for what we sell abroad. It affects the price of exported goods and therefore their demand and sales quantity hence affecting output and jobs in the export industry. It determines the extend to which imported goods can compete with home made goods and therefore affects the viability of the UK companies. As the price of imports enters into the RPI any variation in the exchange rate will also affect the rate of inflation.The remaining two goals were to sustain a high and stable level of economic growth maintain a balance between imports and exports.
Economic Growth Economic growth is the increase in value of the goods and services produced by an economy. It is conventionally measured as the percent rate of increase in real gross domestic product, or GDP.One of our most important goals was and is to generate economic growth . Economic growth means higher incomes and higher living standards.Although our ideal target would be to generate as much growth as possible we realise that too much growth causes other problems. So our realistic aim is to generate as much growth as possible with as low inflation as possible and no balance of payments problems.Economic growth tends to follow a cyclical pattern. There may be boom periods when economic growth is faster, but these may well be followed later by periods when the economy slows right down.The Economic growth is measured as the growth in the level of national income (the percentage change in Gross Domestic Product) .Gross Domestic Product (GDP)The GDP of a country is defined as the market value of all final goods and services produced within a country in a given period of time. It is also considered the sum of value added at every stage of production of all final goods and services produced within a country in a given period of time.GDP = consumption + investment + government spending + (exports − imports)
Gross Domestic Product is the sum of Consumption expenditure, Investment expenditure, Government expenditure and Net exports (Exports less Imports).At times that the economy is growing too slowly then one can try to boost demand. To do this one needs to encourage spending and so one could either cut taxes or cut interest rates. Either of these will help give people more money to spend, therefore boosting demand. Alternatively, one could as a government spend more - increase the level of government expenditure. GDP and OutputGDP equals Y which is the actual output . Our main economic variant that we tried to control here was Y ( Actual Output) . Our aim was to equate Q with Y . Controlling Y Is important as if Y is not close to the potential Output the result would be unemployment . Unemployment effects the wage rate and inflation at least in the short run the chain effect that could be caused would also affect the budget and the balance of payments so this would make the task of balancing the economy a very complex.
Output Y= C+I +G+X-ZConsumption expenditure depends on disposable income (national income less taxes plus welfare and unemployment transfers. Consumption also depends on the level of interest rates as if interest rates are low then loans used to finance consumption are cheaper and also there is less incentive to invest due to low return.Investment expenditure is the purchase by the firms of assets such as the purchase of machines, equipment, factories and other resources that firms need to enable them to produce goods and services for immediate consumption. investment could be in the form replacement expenditure to replace equipment that was worn out or inefficient. Another form of investment is Net investment which is the estimate of the addition in any given year to the stock of Fixed capital and inventories . in the short run investment is a determinant of aggregate demand which stimulates growth of the economy. In the long run investment will also affect the supply side of the economy raising its productive potential and thus pushing upwards the production frontier.Government expenditure the following is a definition of government expenditure from the Bized .co internet site:“Government capital expenditure refers to government spending on investment goods. This means spending on things that last for a period of time. This may include investment in hospitals, schools, equipment and roads.
13

A strong and strengthening British economy Team2 RBE Report -HM Treasury
Government current expenditure refers to government day to day spending. This means spending on recurring items. This includes salaries and wages that keep recurring, spending on consumables and everyday items that get used up as the good or service is provided.”Exports and Imports are determined by the exchange rate changes , prices of British goods compared with prices of foreign goods ( prices are included in the RPI -retail price index ) so we will look at domestic versus foreign inflation which will give us an indication of the comparative increase in prices. Imports depend on domestic Income and exports on foreign income.
The balance of payments has two main components: • the Balance of Trade which is Exports minus Imports and • the Net capital Flows which represents the inflow and outflow of capital depending on the rate of return
(hot money theory)
The balance of trade When a country exports goods, it sells them to a foreign market, that is, to consumers, businesses, or governments in another country. Those exports bring money into the country, which increases the exporting nation's GDP. When a country imports goods, it buys them from foreign producers the money spent on imports leaves the economy, and that decreases the importing nation's GDP. Since the change in GDP is used to measure growth having greater imports than exports in a country reduces the growth rate of that country.The aim here is to keep the flows of money in to and out of the country roughly balanced over a period of several years. If the outflows are systematically greater that the inflows (i.e. imports of goods and services more than exports ) then this outflow has to financed through foreign debt which cannot be sustained for long periods.
Net capital FlowsInvestment in a foreign country depends on that country’s interest rates if UK interest rates are higher than US interest rates this will induce US investors to hold their cash in the UK so there will be an inflow of capital from the US to the UK. This inflow therefore demand for GBP will increase the price of British Pound and will in turn reduce exports as UK goods will be more expensive for the US importer so the balance of trade will be affected.
THE INSTRUMENTS OF OUR STRATEGYSince market forces alone according to empirical evidence have failed to lead to ‘full employment’ equilibrium, with stable prices and a rapid economic growth governments have to intervene in the economy to correct the ‘market failure’. If governments are to intervene in the economy the problem remains of which instruments of policy to use . In order to implement our strategy we used Fiscal and monetary measures .The measures we had at disposal were the following :
Monetary measures
• Money supply
Monetary Policy aims to influence monetary variables such as rate of interest and the money supply. Monetarists believe that money supply mainly affects the prices while according to the Keynesians the main impact is on the unemployment and the output. In our (model)economy an increase in Money Supply increases consumption, Investment but also imports (as exchange rate is reduced-GBP is devalued).Overall output increases as the effect on consumption is much greater that the other two determinants of output (Y= C+G+I+X-Z).
One monetarist view is listed below:“ Because money is used in virtually all economic transactions, it has a powerful effect on economic activity. An increase in the supply of money puts more money in the hands of consumers, making them feel wealthier, thus stimulating increased spending. Business firms respond to increased sales by ordering more raw materials and increasing production. The spread of business activity increases the demand for labour and raises the demand for capital goods. In a buoyant economy, stock market prices rise and firms issue equity and debt. If the money supply continues to expand, prices begin to rise, especially if output growth reaches capacity limits. As the public begins to expect inflation, lenders insist on higher interest rates to offset an expected decline in purchasing power over the life of their loans”
14
A strong and strengthening British economy Team2 RBE Report -HM Treasury
Fiscal measures
Fiscal policy involves the use of Government spending and Taxation to influence he composition and level of aggregate demand in the economy. The increase in Government spending increases output directly (Y= C+I+G+X-Z )while a reduction in the income tax rate increase income and therefore increases Consumption
• Government expenditure
Increases in Government spending is usually used to raise consumption and output in order to stimulate the economy during a recession (in reality however the effect is subject to a time lag so the effect could be felt a couple of years later when the economy is in a different situation).
• Income tax rate
The income tax rate changes in the economy mainly affect the income available for spending therefore the main impact is on consumption (and therefore output). Another effect observed in the economy is that the exchange rate changes by changes in the Income tax rate. The reason for this is that as Income is reduced or increased the change in demand causes the demand curve for goods and services to shift so the demand for imports also changes with the analogous effects on the balance of trade ,the exchange rate, capital flows and the Balance of payments. Tax rate changes also affect the wage rate and unemployment rate
• VAT rate
Vat rate changes have a direct effect on the prices of the products and therefore change the quantity demanded . the demand for imports also drops with the chain reaction explained in the previous point.
.
15
A strong and strengthening British economy Team2 RBE Report -HM Treasury
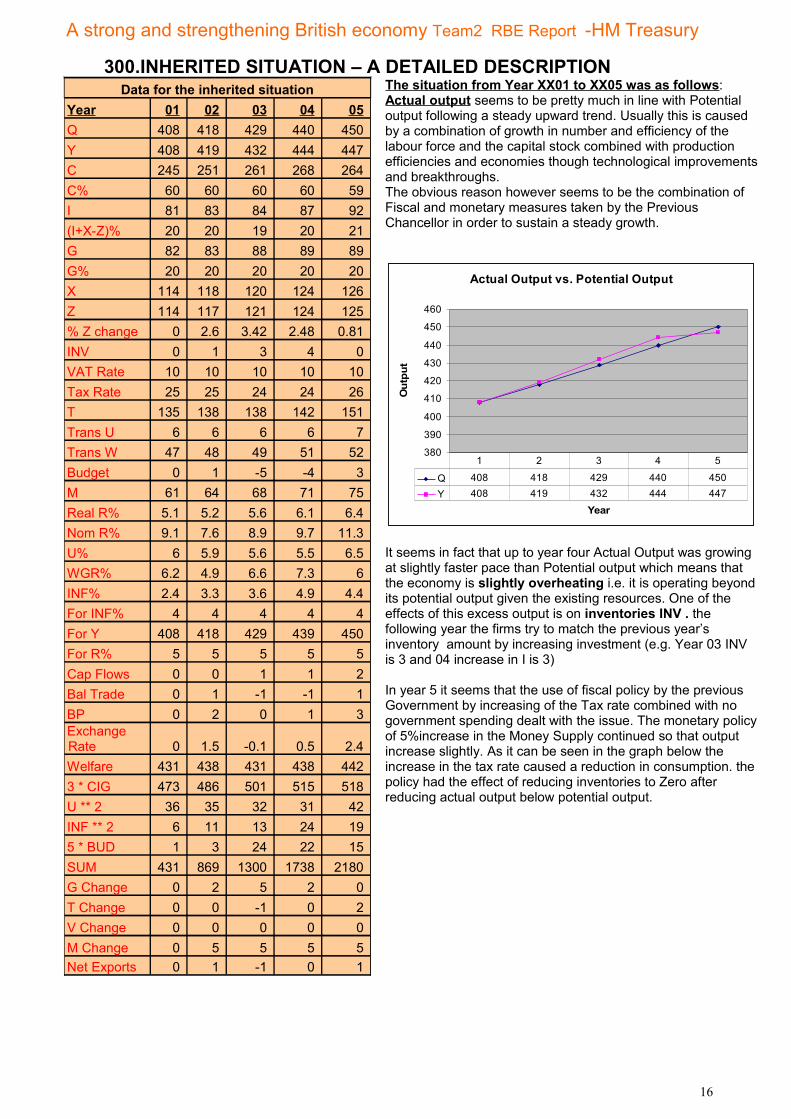
300.INHERITED SITUATION – A DETAILED DESCRIPTIONData for the inherited situation
Year 01 02 03 04 05Q 408 418 429 440 450Y 408 419 432 444 447C 245 251 261 268 264C% 60 60 60 60 59I 81 83 84 87 92(I+X-Z)% 20 20 19 20 21G 82 83 88 89 89G% 20 20 20 20 20X 114 118 120 124 126Z 114 117 121 124 125% Z change 0 2.6 3.42 2.48 0.81INV 0 1 3 4 0VAT Rate 10 10 10 10 10Tax Rate 25 25 24 24 26T 135 138 138 142 151Trans U 6 6 6 6 7Trans W 47 48 49 51 52Budget 0 1 -5 -4 3M 61 64 68 71 75Real R% 5.1 5.2 5.6 6.1 6.4Nom R% 9.1 7.6 8.9 9.7 11.3U% 6 5.9 5.6 5.5 6.5WGR% 6.2 4.9 6.6 7.3 6INF% 2.4 3.3 3.6 4.9 4.4For INF% 4 4 4 4 4For Y 408 418 429 439 450For R% 5 5 5 5 5Cap Flows 0 0 1 1 2Bal Trade 0 1 -1 -1 1BP 0 2 0 1 3Exchange Rate 0 1.5 -0.1 0.5 2.4Welfare 431 438 431 438 4423 * CIG 473 486 501 515 518U ** 2 36 35 32 31 42INF ** 2 6 11 13 24 195 * BUD 1 3 24 22 15SUM 431 869 1300 1738 2180G Change 0 2 5 2 0T Change 0 0 -1 0 2V Change 0 0 0 0 0M Change 0 5 5 5 5Net Exports 0 1 -1 0 1
The situation from Year XX01 to XX05 was as follows:Actual output seems to be pretty much in line with Potential output following a steady upward trend. Usually this is caused by a combination of growth in number and efficiency of the labour force and the capital stock combined with production efficiencies and economies though technological improvements and breakthroughs.The obvious reason however seems to be the combination of Fiscal and monetary measures taken by the Previous Chancellor in order to sustain a steady growth.
Actual Output vs. Potential Output
380
390
400
410
420
430
440
450
460
Year
Out
put
Q 408 418 429 440 450Y 408 419 432 444 447
1 2 3 4 5
It seems in fact that up to year four Actual Output was growing at slightly faster pace than Potential output which means that the economy is slightly overheating i.e. it is operating beyond its potential output given the existing resources. One of the effects of this excess output is on inventories INV . the following year the firms try to match the previous year’s inventory amount by increasing investment (e.g. Year 03 INV is 3 and 04 increase in I is 3)
In year 5 it seems that the use of fiscal policy by the previous Government by increasing of the Tax rate combined with no government spending dealt with the issue. The monetary policy of 5%increase in the Money Supply continued so that output increase slightly. As it can be seen in the graph below the increase in the tax rate caused a reduction in consumption. the policy had the effect of reducing inventories to Zero after reducing actual output below potential output.
16
A strong and strengthening British economy Team2 RBE Report -HM Treasury
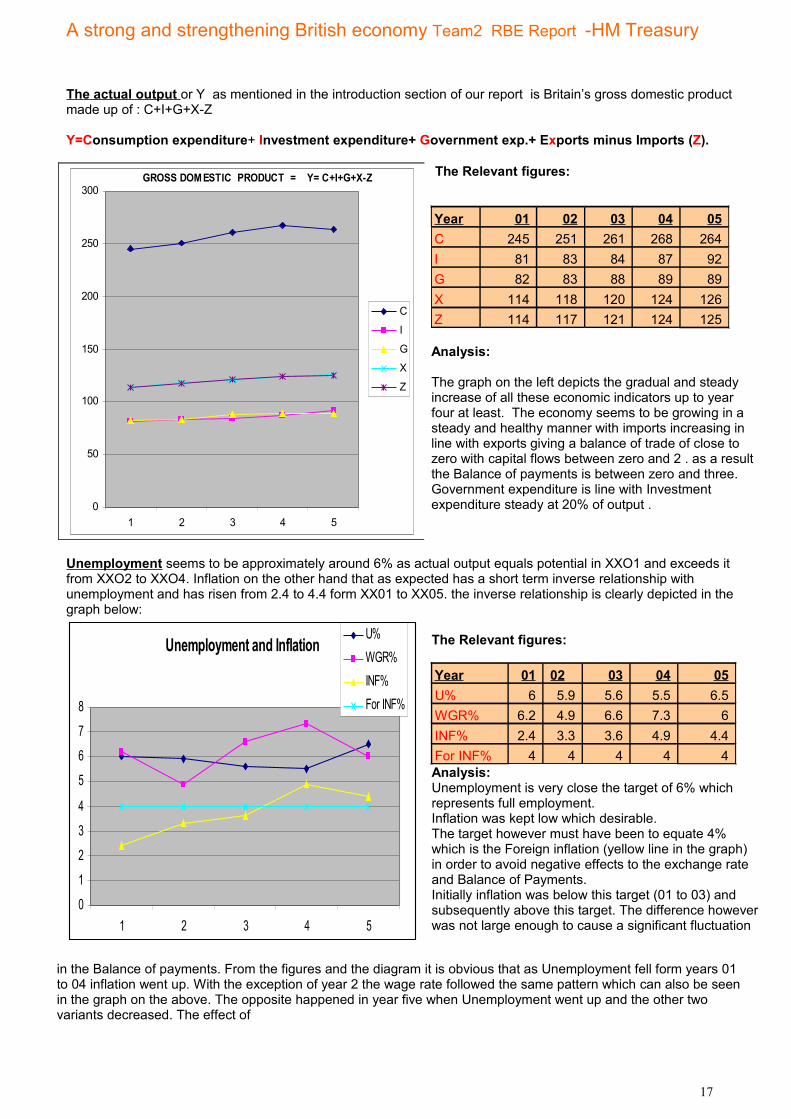
The actual output or Y as mentioned in the introduction section of our report is Britain’s gross domestic product made up of : C+I+G+X-Z
Y=Consumption expenditure+ Investment expenditure+ Government exp.+ Exports minus Imports (Z).
GROSS DOMESTIC PRODUCT = Y= C+I+G+X-Z
0
50
100
150
200
250
300
1 2 3 4 5
C
I
G
X
Z
The Relevant figures:
Analysis:
The graph on the left depicts the gradual and steady increase of all these economic indicators up to year four at least. The economy seems to be growing in a steady and healthy manner with imports increasing in line with exports giving a balance of trade of close to zero with capital flows between zero and 2 . as a result the Balance of payments is between zero and three. Government expenditure is line with Investment expenditure steady at 20% of output .
Unemployment seems to be approximately around 6% as actual output equals potential in XXO1 and exceeds it from XXO2 to XXO4. Inflation on the other hand that as expected has a short term inverse relationship with unemployment and has risen from 2.4 to 4.4 form XX01 to XX05. the inverse relationship is clearly depicted in the graph below:
Unemployment and Inflation
0
1
2
3
4
5
6
7
8
1 2 3 4 5
U%WGR%INF%For INF%
The Relevant figures:
Year 01 02 03 04 05U% 6 5.9 5.6 5.5 6.5WGR% 6.2 4.9 6.6 7.3 6INF% 2.4 3.3 3.6 4.9 4.4For INF% 4 4 4 4 4Analysis:Unemployment is very close the target of 6% which represents full employment.Inflation was kept low which desirable.The target however must have been to equate 4% which is the Foreign inflation (yellow line in the graph) in order to avoid negative effects to the exchange rate and Balance of Payments.Initially inflation was below this target (01 to 03) and subsequently above this target. The difference however was not large enough to cause a significant fluctuation
in the Balance of payments. From the figures and the diagram it is obvious that as Unemployment fell form years 01 to 04 inflation went up. With the exception of year 2 the wage rate followed the same pattern which can also be seen in the graph on the above. The opposite happened in year five when Unemployment went up and the other two variants decreased. The effect of
17
Year 01 02 03 04 05C 245 251 261 268 264I 81 83 84 87 92G 82 83 88 89 89X 114 118 120 124 126Z 114 117 121 124 125

A strong and strengthening British economy Team2 RBE Report -HM Treasury
The Government’s Budget The budget is made up of the tax take, the government spending and the benefits paid out for welfare and unemployment.
The Gov/t Budget
-20
0
20
40
60
80
100
120
140
160
1 2 3 4 5
GTTrans UTransWBudget
The Relevant figures:
Year 1 2 3 4 5T 135 138 138 142 151G 82 83 88 89 89Trans U 6 6 6 6 7Trans W 47 48 49 51 52Budget 0 1 -5 -4 3
Analysis:A relatively small deficit problem was encountered in years XX03 and XX04 . this problem was solved In year XX05. By increasing the tax rate and cutting on government expenditure the previous government managed to solve the problem of larger outflows than inflows.The increase in Money Supply was used to achieve an increase in output instead of the usual combination of Government spending and Money Supply so that the budget deficit would not increase.
INTERNATIONAL SECTOR
Exports(X) and Im ports(Z)
108
110
112
114
116
118
120
122
124
126
128
X 114 118 120 124 126
Z 114 117 121 124 125
1 2 3 4 5
The Relevant figures:
Year 1 2 3 4 5X 114 118 120 124 126Z 114 117 121 124 125Analysis: during the years 01 to 05 there was an equal increase of exports and imports so that the net exports was around zero.
18
A strong and strengthening British economy Team2 RBE Report -HM Treasury
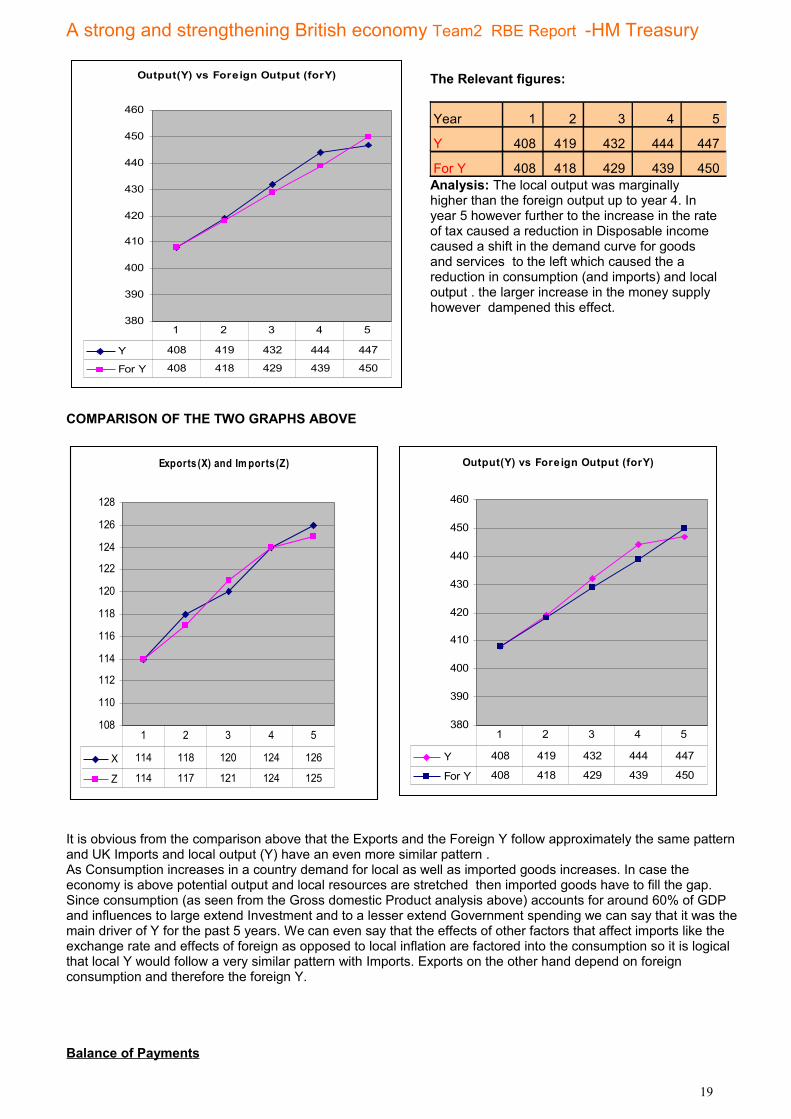
Output(Y) vs Foreign Output (forY)
380
390
400
410
420
430
440
450
460
Y 408 419 432 444 447
For Y 408 418 429 439 450
1 2 3 4 5
The Relevant figures:
Year 1 2 3 4 5
Y 408 419 432 444 447
For Y 408 418 429 439 450Analysis: The local output was marginally higher than the foreign output up to year 4. In year 5 however further to the increase in the rate of tax caused a reduction in Disposable income caused a shift in the demand curve for goods and services to the left which caused the a reduction in consumption (and imports) and local output . the larger increase in the money supply however dampened this effect.
COMPARISON OF THE TWO GRAPHS ABOVE
Exports (X) and Im ports(Z)
108
110
112
114
116
118
120
122
124
126
128
X 114 118 120 124 126
Z 114 117 121 124 125
1 2 3 4 5
Output(Y) vs Fore ign Output (forY)
380
390
400
410
420
430
440
450
460
Y 408 419 432 444 447
For Y 408 418 429 439 450
1 2 3 4 5
It is obvious from the comparison above that the Exports and the Foreign Y follow approximately the same pattern and UK Imports and local output (Y) have an even more similar pattern . As Consumption increases in a country demand for local as well as imported goods increases. In case the economy is above potential output and local resources are stretched then imported goods have to fill the gap.Since consumption (as seen from the Gross domestic Product analysis above) accounts for around 60% of GDP and influences to large extend Investment and to a lesser extend Government spending we can say that it was the main driver of Y for the past 5 years. We can even say that the effects of other factors that affect imports like the exchange rate and effects of foreign as opposed to local inflation are factored into the consumption so it is logical that local Y would follow a very similar pattern with Imports. Exports on the other hand depend on foreign consumption and therefore the foreign Y.
Balance of Payments
19

A strong and strengthening British economy Team2 RBE Report -HM Treasury
Balance of Payments and Balance of Trade
-1.5
-1
-0.5
0
0.5
1
1.5
2
2.5
3
1 2 3 4 5
Cap Flow s
Bal Trade
Exchange Rate
Net Exports
The Relevant figures:
Year 1 2 3 4 5
Bal Trade 0 1 -1 -1 1
BP 0 2 0 1 3Exchange Rate 0 1.5 -0.1 0.5 2.4
Net Exports 0 1 -1 0 1
Cap Flows 0 0 1 1 2Analysis:The balance of trade for the five years was close to zero which reflected mainly the movement of the net exports . it is obvious from the pattern of the Capital Flows however that it also affects the shaping of the Balance of Trade curve. The main reason for this is that it affects the exchange rate which in turn has an effect on the balance of trade.
The exchange rate’s main determinant is the Balance of Payments which is the sum of the balance of trade and the capital flows. The way it works is demand for British goods is high then demand for British pounds will be high in order to buy British goods. This change in quantity demanded leads to a movement (increase ) along the demand curve. Since increase in quantity demanded is higher than the supply their will be an appreciation of the British Pound. A high Exchange rate however may lead to a decrease in exports if it makes British goods to expensive on the foreign market. The exchange rate seems to affect and be affected by the Net Exports during the five years in question as it follows the same pattern. The capital flows are affected by the rates of local Interest rate as compared with the foreign interest rate. The trend is described below but what is obvious is that when the local rate was stronger than the foreign rate Capital investments were attracted.
Interest rates
0
2
4
6
8
10
12
1 2 3 4 5
Real R% Nom R%For R% Cap Flows
The Relevant figures:
Year 1 2 3 4 5
Nom R% 9.1 7.6 8.9 9.7 11.3
Real R% 5.1 5.2 5.6 6.1 6.4
For R% 5 5 5 5 5RR less For R 0.1 0.2 0.6 1.1 1.4Cap Flows 0 0 1 1 2
Analysis: from year 01 to 5 the British real interest rates were higher than the Foreign interest rates this meant that foreign investors earn more by investing in Britain than they would if they invested in their own country. in years 01 and 02 it seems that the difference was too small to attract foreign investment but in years 03, 04 and 05 capital inflows came into the country as the marginal revenue from investing in Britain must have been greater than the marginal cost.
20

A strong and strengthening British economy Team2 RBE Report -HM Treasury
Tax and Iflation effects on Net exports
-2
-1
0
1
2
3
4
5
6
1 2 3 4 5
INF%For INF%T ChangeNet Exports
The Relevant figures:
Year 1 2 3 4 5
INF% 2.4 3.3 3.6 4.9 4.4
For INF% 4 4 4 4 4
Net Exports 0 1 -1 0 1
T Change 0 0 -1 0 2Analysis:When the local inflation was under the foreign inflation in year 2 net exports increased as the price of British goods abroad were cheaper than the foreign ones .In year 3 the reduction in income tax rate increased income and boosted demand by shifting the demand curve to the right therefore imports increased more than exports. In year local inflation was lower than foreign so British goods became more expensive.
abroad and foreign goods cheaper in Britain . the difference however in the inflation rates was too small to create a balance of trade problem.In year 5 the difference in the inflation rates was smaller than year 4 therefore to small to be an issue. The tax rate increase however of 2 % reduced consumption on local and foreign goods and therefore imports were reduced and Net exports increased.
.
21

A strong and strengthening British economy Team2 RBE Report -HM Treasury
400.DETAIL ANALYSIS OF THE SITUATION IN EACH YEAR Year 6
Exogenous Shock 1) Prices of imported goods increase. Inflation rate es tim ated to be increased by 5 percentage points. 2) City is gearing itself for a large capital outflow this year. Current Situation In this situation year 6 was run again on the RBE simulation with no change at all in order to see the effects on the economy of the exogenous shocks and other changes that would have taken place in year 6 without any changes from our part. The fourth column lists the main Economic Indicators as after this Government’s policy changes.
Main Economic Indicators – Year 6 Economic Indicator
Year 5
Year6 NC No change
Year6C -50%MS
Q 450 461 461 Y 447 441 411
C 264 263 244
I 92 86 67 G 89 89 89
X 126 127 127 Z 125 125 117
INV 0 0 0 T 151 150 138
Trans U 7 10 14 Trans W 52 53 53
Budget 3 -2 -19 Real R% 6.4 6.9 13.6
Economic Indicator
YEAR 5
Year6 NC No change
Year 6C -50%MS
Nom R% 11.3 11.3 17.9 U% 6.5 8.5 12.5
WGR% 6 2.4 0.2
INF% 4.4 6.4 5.1 For INF% 4 4 4
For Y 450 462 462 For R% 5 5 5 Cap Flows 2 -18 -10 Bal Trade 1 3 10 BP 3 -15 0 Exchange Rate 2.4 -12.6 0.1
Welfare 442 385 201 The situation after the shock but before 50% reduction in Money supply (Year6 No change) The effect of the rise in import prices was that inflation rose from 4.4 in year 5 to 6.4 in year 6. The increase in inflation caused a wage rate reduction from 6% to 2.4 %. Normally this would have resulted in a reduction of unemployment as due to the reduction in the wage rate firms would take on more workers so unemployment would fall and output would rise. There seems to a time lag however on this effect. The immediate effect on unemployment was that because the output was less than the potential unemployment increased. The rise of inflation above the foreign inflation means that our prices are increasing faster than those in other countries so our goods will be less competitive and less in demand. This will have a negative effect on the balance of payments as exports will fall and imports will rise. The second shock caused a reduction in the exchange rate by 14 percentage points as Capital F lows affect the balance of payments. The reduction of Capital Outflows by 20bln reduced the Balance of Payments (which is the main determinant of the exchange rate) by 18bln. In fact the exchange rate fell from 2.4 to -12.6 this dramatic reduction of the exchange rate would have been expected to reduce imports as foreign goods would become even more expensive and
POLICY CHANGES YEAR 6 M Change (%) -50
22
A strong and strengthening British economy Team2 RBE Report -HM Treasury
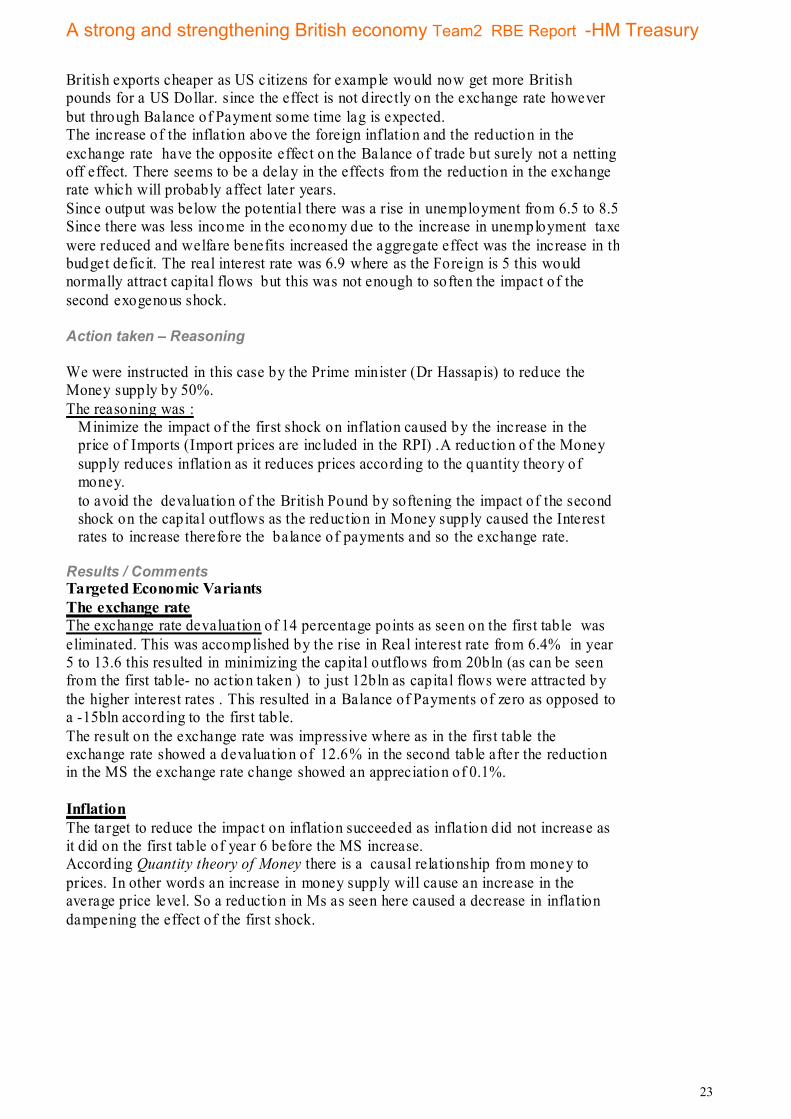
British exports cheaper as US citizens for example would now get more British pounds for a US Dollar. since the effect is not directly on the exchange rate however but through Balance of Payment some time lag is expected. The increase of the inflation above the foreign inflation and the reduction in the exchange rate have the opposite effect on the Balance of trade but surely not a netting off effect. There seems to be a delay in the effects from the reduction in the exchange rate which will probably affect later years. Since output was below the potential there was a rise in unemployment from 6.5 to 8.5. Since there was less income in the economy due to the increase in unemployment taxes were reduced and welfare benefits increased the aggregate effect was the increase in the budget deficit. The real interest rate was 6.9 where as the Foreign is 5 this would normally attract capital flows but this was not enough to soften the impact of the second exogenous shock. Action taken – Reasoning We were instructed in this case by the Prime minister (Dr Hassapis) to reduce the Money supply by 50%. The reasoning was :
Minimize the impact of the first shock on inflation caused by the increase in the price of Imports (Import prices are included in the RPI) .A reduction of the Money supply reduces inflation as it reduces prices according to the quantity theory of money. to avoid the devaluation of the British Pound by softening the impact of the second shock on the capital outflows as the reduction in Money supply caused the Interest rates to increase therefore the balance of payments and so the exchange rate.
Results / Comments Targeted Economic Variants The exchange rate The exchange rate devaluation of 14 percentage points as seen on the first table was eliminated. This was accomplished by the rise in Real interest rate from 6.4% in year 5 to 13.6 this resulted in minimizing the capital outflows from 20bln (as can be seen from the first table- no action taken ) to just 12bln as capital flows were attracted by the higher interest rates . This resulted in a Balance of Payments of zero as opposed to a -15bln according to the first table. The result on the exchange rate was impressive where as in the first table the exchange rate showed a devaluation of 12.6% in the second table after the reduction in the MS the exchange rate change showed an appreciation of 0.1%. Inflation The target to reduce the impact on inflation succeeded as inflation did not increase as it did on the first table of year 6 before the MS increase. According Quantity theory of Money there is a causal relationship from money to prices. In other words an increase in money supply will cause an increase in the average price level. So a reduction in Ms as seen here caused a decrease in inflation dampening the effect of the first shock.
23
A strong and strengthening British economy Team2 RBE Report -HM Treasury
Output Y= C+I +G+X-Z Output was reduced from year 5 by 36blnGBP. The increase in prices caused by the reduction of the money supply caused a reduction in Consumption by £20 bln GBP Investment was reduced by £25 bln GBP due to the reduction in demand and high input prices. Government spending did not change. Exports increased by £1blnGBP as foreign demand (Y)was more than the local demand and imports (z) were reduced by £8bln GBP since the price of imported goods had increased and consumption decreased. Balance of Payment BP= Bal T + CAP Flows Balance of trade was £10bln GBP as that was the Net exports Capital F lows was -£10bln GBP for the reasons mentioned above. -------- BP = 0 Budget = T-G-TransU-TransW The tax take decreased as income decreased when unemployment increased and the wage rate decreased . Budget expenses are = Government spending (no change) 89bln GBP. As the unemployment doubled mainly due to the reduction in output the unemployment benefit doubled from year 5 (7bln GBP) to year 6 when it was 14bln The welfare benefit in year 5 was 52 bln GBP and in Year 6 it became 53 bln ------ 156 Budget Income Tax Take 138 --------- Deficit 19 Conclusion The prime minister’s policy succeeded in dealing with the negative effects on the exchange rate and balance of payments. It also dealt successfully with the inflation effects . the side effects however were low growth and output and therefore the doubling of unemployment rate in a single year. There was also a dramatic reduction in the wage rate which is not good for the well being of the people. F irms output was reduced . the government budget in a far worse condition than it was at the beginning of this year. O verall however it is better to control the exchange rate as when this change significantly the Economy will become gradually very difficult to control.
24
A strong and strengthening British economy Team2 RBE Report -HM Treasury
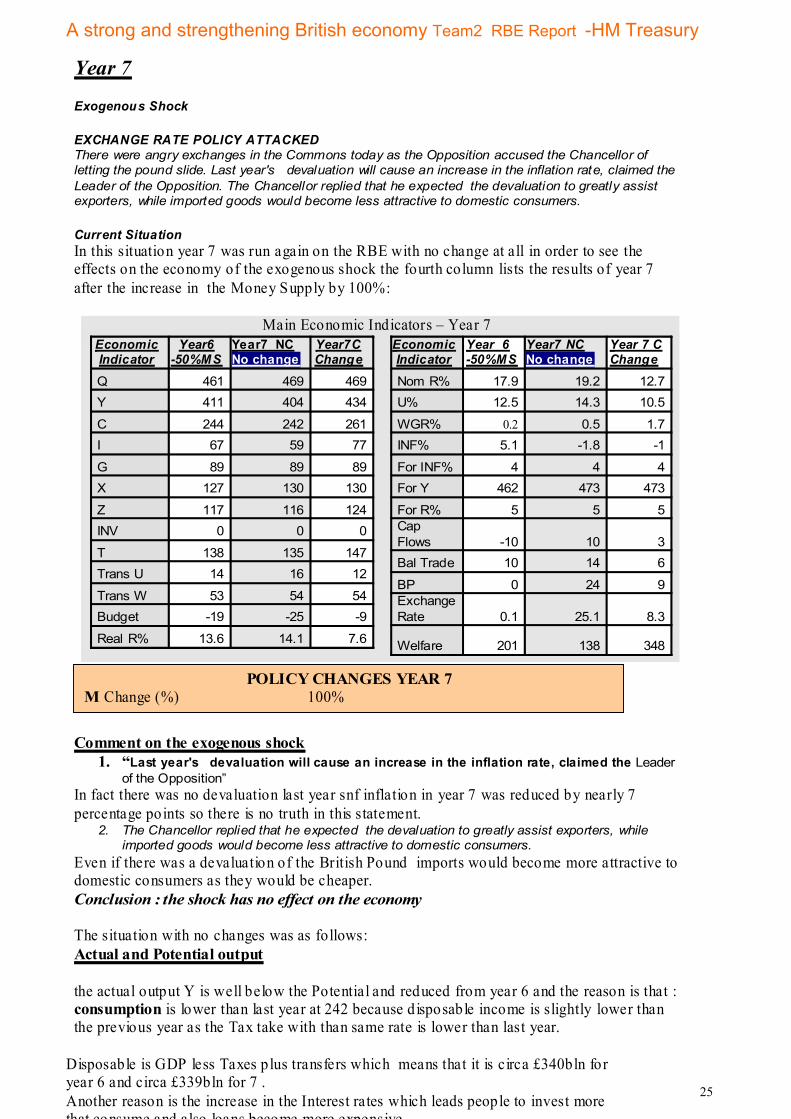
Year 7 Exogenous Shock EXCHANGE RATE POLICY ATTACKED There were angry exchanges in the Commons today as the Opposition accused the Chancellor of letting the pound slide. Last year's devaluation will cause an increase in the inflation rate, claimed the Leader of the Opposition. The Chancellor replied that he expected the devaluation to greatly assist exporters, while imported goods would become less attractive to domestic consumers. Current Situation In this situation year 7 was run again on the RBE with no change at all in order to see the effects on the economy of the exogenous shock the fourth column lists the results of year 7 after the increase in the Money Supply by 100%:
Main Economic Indicators – Year 7 Economic Indicator
Year6 -50%MS
Year7 NC No change
Year7C Change
Q 461 469 469 Y 411 404 434
C 244 242 261 I 67 59 77
G 89 89 89 X 127 130 130
Z 117 116 124 INV 0 0 0
T 138 135 147 Trans U 14 16 12
Trans W 53 54 54 Budget -19 -25 -9
Real R% 13.6 14.1 7.6
Economic Indicator
Year 6 -50%MS
Year7 NC No change
Year 7 C Change
Nom R% 17.9 19.2 12.7 U% 12.5 14.3 10.5
WGR% 0.2 0.5 1.7 INF% 5.1 -1.8 -1
For INF% 4 4 4 For Y 462 473 473
For R% 5 5 5 Cap Flows -10 10 3 Bal Trade 10 14 6
BP 0 24 9 Exchange Rate 0.1 25.1 8.3
Welfare 201 138 348 Comment on the exogenous shock
1. “Last year's devaluation will cause an increase in the inflation rate, claimed the Leader of the Opposition”
In fact there was no devaluation last year snf inflation in year 7 was reduced by nearly 7 percentage points so there is no truth in this statement.
2. The Chancellor replied that he expected the devaluation to greatly assist exporters, while imported goods would become less attractive to domestic consumers.
Even if there was a devaluation of the British Pound imports would become more attractive to domestic consumers as they would be cheaper. Conclusion : the shock has no effect on the economy The situation with no changes was as follows: Actual and Potential output the actual output Y is well below the Potential and reduced from year 6 and the reason is that : consumption is lower than last year at 242 because disposable income is slightly lower than the previous year as the Tax take with than same rate is lower than last year.
POLICY CHANGES YEAR 7 M Change (%) 100%
Disposable is GDP less Taxes plus transfers which means that it is circa £340bln for year 6 and circa £339bln for 7 . Another reason is the increase in the Interest rates which leads people to invest more that consume and also loans become more expensive. Government spending was unchanged. The investment was lower than year 6 because output and consumption is lower and therefore demand is lower, interest rates have increased so financing is dearer , the unemployment is on the rise and there is no need for inventories as the actual output is much lower than potential. Exports The appreciation of the GBP£ to 25.1 form 0.1 should have had a devastating effect on exports as UK goods would become more expensive for foreign buyers and therefore less attractive. However there seems to be a time lag in this effect. A factor that has an opposite effect that of the appreciation of the GBP is that the local inflation (-1.8% )however is lower than the foreign inflation (4%) so prices of British goods should have gone down. A third factor which is positive for British Exports is that Foreign Y has increased from last year from 462 bln GBP to 473bln where as the British Y has gone down from £411bln to £407bln. In order to satisfy the increase in foreign demand the foreign countries will increase their demand for British goods. It seems that the accumulated effect of the inflation and the foreign Y combined with the time lag factor have counterbalanced the effects of the appreciation of the exchange rate. Imports Imports were reduced because as consumption and output were reduced so demand for imported goods was also reduced . There was also a negative effect on imports by foreign prices increasing at a higher rate than the local prices as foreign inflation was 4% were as local inflation was -1.8 %. The reason however that imports were not affected that much by this was that the exchange rate has been appreciated to 25.1% from 1% thus making imports prices a great deal cheaper. Interest rates The increase in interest rates as explained above reduced consumption and investment expenditure and contributed to the reduction of actual output. The fact that the Real interest rate was 14.1% and the foreign R only 5% meant that the British F inancial markets became very attractive for foreign capital . there was an increase in Capital flows of £20bln which increases the balance of payments by £24bln and the exchange rate by 25 percentage points. The balance of trade of £14bln is the net exports. Unemployment Unemployment increased by 2 percentage points due to the shortfall of the output and the reduction in Investment . Budget Government income The tax take was reduced due to the reduction in Income as explained above Govt. Expenses Transfers increased as unemployment increased and Government expenditure remained the same as last year. Due to the reasons mentioned above there was a budget deficit of 25
25

A strong and strengthening British economy Team2 RBE Report -HM Treasury
Disposable is GDP less Taxes plus transfers which means that it is circa £340bln for year 6 and circa £339bln for 7 . Another reason is the increase in the Interest rates which leads people to invest more that consume and also loans become more expensive. Government spending was unchanged. The investment was lower than year 6 because output and consumption is lower and therefore demand is lower, interest rates have increased so financing is dearer , the unemployment is on the rise and there is no need for inventories as the actual output is much lower than potential. Exports The appreciation of the GBP£ to 25.1 form 0.1 should have had a devastating effect on exports as UK goods would become more expensive for foreign buyers and therefore less attractive. However there seems to be a time lag in this effect. A factor that has an opposite effect that of the appreciation of the GBP is that the local inflation (-1.8% )however is lower than the foreign inflation (4%) so prices of British goods should have gone down. A third factor which is positive for British Exports is that Foreign Y has increased from last year from 462 bln GBP to 473bln where as the British Y has gone down from £411bln to £407bln. In order to satisfy the increase in foreign demand the foreign countries will increase their demand for British goods. It seems that the accumulated effect of the inflation and the foreign Y combined with the time lag factor have counterbalanced the effects of the appreciation of the exchange rate. Imports Imports were reduced because as consumption and output were reduced so demand for imported goods was also reduced . There was also a negative effect on imports by foreign prices increasing at a higher rate than the local prices as foreign inflation was 4% were as local inflation was -1.8 %. The reason however that imports were not affected that much by this was that the exchange rate has been appreciated to 25.1% from 1% thus making imports prices a great deal cheaper. Interest rates The increase in interest rates as explained above reduced consumption and investment expenditure and contributed to the reduction of actual output. The fact that the Real interest rate was 14.1% and the foreign R only 5% meant that the British F inancial markets became very attractive for foreign capital . there was an increase in Capital flows of £20bln which increases the balance of payments by £24bln and the exchange rate by 25 percentage points. The balance of trade of £14bln is the net exports. Unemployment Unemployment increased by 2 percentage points due to the shortfall of the output and the reduction in Investment . Budget Government income The tax take was reduced due to the reduction in Income as explained above Govt. Expenses Transfers increased as unemployment increased and Government expenditure remained the same as last year. Due to the reasons mentioned above there was a budget deficit of 25
26

A strong and strengthening British economy Team2 RBE Report -HM Treasury
Welfare The welfare function of the RBE gives us the overall state of the economy after taking into account the positive and negative effects of the changes in the different economic indicator welfare gives a result of the overall effect on the economy. The welfare with no action was 138 points. Action taken – Reasoning The action taken by the LEM team was to increase in the Money Supply by 100%. The reason for this was to reverse the negative effects caused by the reduction of 50% of the MS in year 6 . These were: 1. Low growth and output. 2. The doubling of unemployment rate in a single year. 3. The dramatic reduction in the wage rate. 4. The government budget. 5. The high interest rates. Interest rates must be reduced so as to stimulate consumption and
investment (and therefore employment and output) by reducing the cost of financing and therefore increase the well being of the British People.
Results / Comments Increase in Actual output.(Target achieved) Y(Y= C+I+G+X-Z) increased from £404bln with no change to £434bln (year6 was£411bln). Consumption The increase in disposable income (due to reduction in unemployment and in crease in wage rate) and reduction in prices (inflation decrease) and interest rates caused by the increase in the Money Supply stimulated an increase in Consumption circa £20 bln GBP. Investment Investment was also increased by £18 bln GBP due to the increase in demand (lower prices), reduction in capital assets prices (lower inflation) and reduction in finance costs (lower interest rates) Government spending did not change. Exports remained unchanged where as Imports (z) were increased by 8bln GBP due to the increase in consumption Reduction of Unemployment Rate.(Target achieved) As it can be seen from the no change column of the table above if no measures were taken the unemployment rate would have increased to 14.3 % with our change the unemployment rate fell by nearly 4 percentage points to 10.5% and two percentage points from year 6(12.5%). As consumption, output and demand for products increased demand for labour increased. The reduction in inflation meant that prices fell therefore demand for products increased. Increase in Wage Rate.(Target achieved) As demand for labour increased price of labor i.e. the wage rate increased from 0.5% to 1.7% (Y6 was 0.2%) Reduced the Government Budget deficit. .(Target achieved) The government budget deficit was reduced from £25bln with no changes to just £9bln a reduction of £16bln Year6 was 19bln. Due to the reduction in unemployment and the wage rate the taxable income and thus the tax take increased from £135 bln –Y7 No change to £147bln -Y7 with our change (Y6 was £138 bln). The Unemployment benefit (transfers) was reduced from £16bln to £12bln. The sum of the benefit by the increase in the Tax take (£12bln) and the reduction in the unemployment transfer (£4bln) accounts fro the reduction in the budget deficit of £16bln. Reduced the excessively high interest rates .(Target achieved) The increase in money supply caused a reduction in the Real interest rate from 14.1% in year 7 with no change to 7.6.% with the increase in money supply this reduction boosted consumption , demand and therefore actual output . this was achieved as finance cost have been reduced and also since rates for bank deposits have gone down firms are investing more in production and people are consuming more .
27

A strong and strengthening British economy Team2 RBE Report -HM Treasury
side effects The reduction in the interest rates resulted in a reduction in the capital flows from £10bln in Year7 with no change to £3bln in year 7 with change(a reduction of £7bln) . Balance of Payments was reduced from £24bln in year 7 with no changes(7NC)made to £9bln with the 100% increase in Money supply(7C). In year 7NC the balance of trade was £14bln where us in 7C only £6bln representing the icrease in imports due to the increase lower exchange rate appreciation and the much lower inflation than the foreign inflation Conclusion Overall the economic growth was boosted and all adverse effects of the previous year’s reduction in MS overturned. The international sector was not so good however with a reduction in both capital flows and the balance of trade. The overall p icture however indicated by the welfare factor was approximately three times better than doing nothing. The welfare for 7NC was 138 for 7C it was 348 this is because the Budget deficit was reduced the output increased the unemployment reduced and the wage rate increased.
28

A strong and strengthening British economy Team2 RBE Report -HM Treasury
Year 8 Exogenous Shock AT THE MERCY OF THE EXCHA NGE RATE! - newspaper economic comment. While this Newspaper has been a stern critic of past government policies, we have considerable sympathy for the Chancellor as he attempts to enact stabilization policies in light of rapidly changing international factors. The substantial devaluation and revaluation of the pound experienced in the past two years, and subsequent lagged impacts on exports and imports, makes economic policy making a hazardous occupation. Such sympathy does not imply that we shall not be critically examining the policy measures chosen by the Chancellor Current Situation In this situation year 8 was run again on the RBE with no change at all in order to see the effects on the economy of the exogenous shock or other changes that did not have anything to do with the changes that our team made the fourth column lists the results of year 8 after our changes. For short column 3 will be referred to as 8NC i.e. year 8 no changes and column 4 will be referred to as 8C year 8 with changes.
Main Economic Indicators – Year 8 Economic Indicator
Year7 Change
Year8 NC No change
Year8C Change
Q 469 479 481 Y 434 440 461
C 261 265 283 I 77 81 82
G 89 89 98
X 130 131 131 Z 124 127 134
INV 0 0 0 T 147 149 142
Trans U 12 13 10 Trans W 54 55 55
Budget -9 -8 -21 Real R% 7.6 7.5 8.6
Economic Indicator
Year 7 Change
Year8 NC No change
Year 8 C Change
Nom R% 12.7 6.4 7.5 U% 10.5 10.9 8.5
WGR% 1.7 -1.2 -0.8 INF% -1 -2 -2
For INF% 4 4 4
For Y 473 485 485 For R% 5 5 5 Cap Flows 3 3 4 Bal Trade 6 4 -2 BP 9 7 2 Exchange Rate 8.3 6.3 1.5
Welfare 348 349 353 Comment on the exogenous shock The article about rapidly changing international factors affecting the exchange rate may or may not affect potential foreign capital inflows who may read the article. It will also discourage local investors investing abroad. The effect on the economy if any is not material. The situation with no changes was as follows: Actual and Potential output the actual output Y is well below the Potential and above year 7 and the reason is that : consumption is higher than last year because disposable income is slightly higher than the previous year as the Tax take with than same rate is lower than last year. Another reason is the decrease in the Interest rates which leads people to consume more as financing becomes less expensive. Government spending was unchanged. The investment was higher than year 7 because consumption is higher and therefore demand is higher, interest rates have decreased so financing is cheaper .
POLICY CHANGES YEAR 8 G Change (%) +10% T Change (%) - 3%
29
A strong and strengthening British economy Team2 RBE Report -HM Treasury
Unemployment is on the rise as the actual output is lower than potential the wage rate is lower so demand for labour is less. Inflation is reduced and that usually has some inverse relationship with unemployment in the short run. Exports increase by £1bln The appreciation of the GBP£ does not seem to have effect exports since the effect seems to have been reversed by the fact that local inflation is lower than the foreign inflation (4%) so while prices of British goods are lower than the previous year the foreign ones have been rising steadily by four percent for the last 8 years. A third factor which is positive for British Exports is that Foreign Y has increased from last year from by £12bln . In order to satisfy the increase in foreign demand the foreign countries will increase their demand for British goods. Imports increased by £3bln. Imports were increased because as consumption and output were increased so demand for imported goods was also increased . Foreign inflation was 4% were as local inflation was 2 %. So imported goods are more expensive The GBP£ was depreciated by 2% so imported goods were more expensive There seems to be a time lag in the effect of the two factors named above. Interest rates The increase in interest rates as explained above have contributed to the increase in consumption as they are lower than last year. The Real interest rate was 7.5% and the foreign R 5% meant the difference seems that d id not justify the flow of more capital due to other factors like finance and other administrative costs plus the instability of foreign markets and bad publicity. Unemployment Unemployment increased by slightly by .04% percentage points most probably due to reduction in the wage rate. Budget Government income The tax take has increased as taxable income has gone up. Govt. Expenses Transfers increased as unemployment increased and Government expenditure remained the same as last year. Due to the reasons mentioned above there was a budget deficit of 8 Welfare As expalaine above the welfare function of the RBE gives us the overall state of the economy after taking into account the positive and negative effects The welfare with no action was 349 points. Action taken – Reasoning The action taken by the LEM team was to increase in the Government spending by10% and reduced the tax rate by 3%.
30
A strong and strengthening British economy Team2 RBE Report -HM Treasury
The reason for this was to achieve the following: 1. Boost consumption and therefore output . 2. Increase investment 3. Reduce unemployment further so that we gradualy reach the goal of 6%. 4. Increase the Interest rates so as to attract capital flows 5. Reduce the exchange rate around zero as it was in the first 5 years where it was
stable. Results / Comments
Increase in Actual output.(Target achieved) Y(Y= C+I+G+X-Z) increased from (year 7 £434bln) £440bln in Year 8NC to £461bln with our combined changes. Consumption The effect of the tax rate cut of 3 % lead to an increase in disposable income and despite the increase in interest rates (caused by inflationary pressure as the nominal rate was reduced.) boosted consumtion.
Increase in Investment .(Target achieved) Investment was also increased by £18 bln GBP due to the increase in demand and despite the increase in interest rates(increase in finance costs). Government spending was increased by 10% giving a direct boost to output. Exports increased by £1bln due to a reduction in the exchange rate and the fact that local inflation was lower that the foreign one. Imports (z) were increased by 7bln GBP (comparing year 8NC with year 8 with the changes due to the £21bln increase in consumption and dispite the depreciation of the exchange rate from 6.3 to 1.5 and the fact that local inflation was lower that the foreign one.
Reduction of Unemployment Rate.(Target achieved) As it can be seen from the no change column of the table above if no measures were taken the unemployment rate would have increased to 10.9 % with our changes the unemployment rate fell by nearly 2.4 percentage points to 8.5% and two percentage points from year 7(10.5%). As consumption , output and demand for products increased demand for labour increased.
Reduce the exchange rate around zero as it was in the first 5 years where it was stable. (Target achieved)
The boost in demand as expected increased imports that caused a balance of trade deficit of £2bln which reduced the exchange rate as it affect the Balance of payments. Due to the increase in interest rates the capital flows increased and greater reduction of the exchange rate avoided. side effects A Budget deficit increased from £8bln to £21bln. It seems that both of our policies were fiscal and both affect the Budget directly. The reduction of the tax rate resulted in a lower tax take of £7bln (comparing 8NC and 8C ) the Government expenditure increased by £9bln and the transfers by £2bln Conclusion Overall the economic growth was boosted. The exchange rate is nearing the target of around zero, unemployment was reduced and investment was increased also.. the main negative effect was the increase of the budget deficit 2.5 times. The overall picture however indicated by the welfare marginally better than doing nothing and than year 7 and 6.
31

A strong and strengthening British economy Team2 RBE Report -HM Treasury
Year 9 Shock in Year 9∗ : Investment plans worth £10 billion might be shelved due to uncertainty in International Markets Current Situation Although the expansive fiscal and monetary policy of previous Year 8 has reduced the gap between potential and actual output and has improved the situation with unemployment, there is still a significant difference between actual output (Y) and potential output (Q) and a need for a further improvement of employment which is higher than our target rate of 6%, despite the fact of the budgetary deficit of £21 billion which we are also experiencing. We also consider that the uncertainty in international markets and estimates suggesting that many companies are cutting back on their investment plans, would have a negative effect on investment (I) and as a result of that, the gap between potential output and actual output would grow bigger. Action taken – Reasoning Based on the above mentioned facts and estimates, we decided to continue with an expansive fiscal and monetary policy. Therefore, we increased both, government expenditure (+20%) and money supply (+20%) so as to decrease the gap between Y and Q, to lower unemployment and reduce the interest rate as well, which, based on last year’s results, was still high (7,5%) (higher than ForR (5%). The negative inflation allowed us to adopt this policy since we were not facing problems in price increases. Our policy would result in the reduction of interest rates and consequently this would encourage firms to borrow money for investment purposes.
∗ Exogenous Shock (Year 9) INVESTMENT PLANS SLASHED The latest CBI surv ey rev eals that, because of uncertainty in international markets, many companies are cutting back on their
inv estment plans. The CBI estimates that inv estment plans totalling £10 bill ion hav e been temporarily shelv ed. Our Business Editor
points out that inv estment expenditure will not necessarily be £10 billion less than last year's, because the interest rate and other
f actors affecting inv estment decisions may not be the same as they were last y ear.
POLICY CHANGES YEAR 9 G Change (%) 20 Tax Rate Change (%) 0 VAT Rate Change (%) 0 M Change (%) 20
32
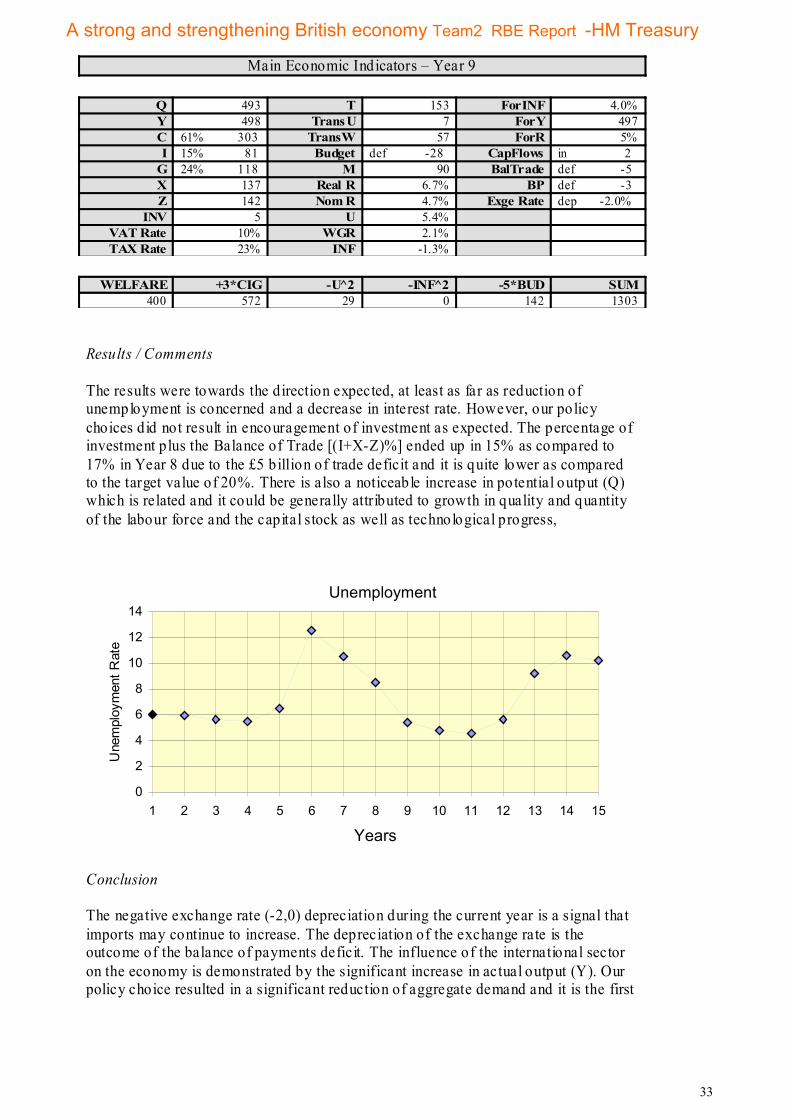
A strong and strengthening British economy Team2 RBE Report -HM Treasury
Main Economic Indicators – Year 9
Results / Comments The results were towards the direction expected, at least as far as reduction of unemployment is concerned and a decrease in interest rate. However, our policy choices did not result in encouragement of investment as expected. The percentage of investment plus the Balance of Trade [(I+X-Z)%] ended up in 15% as compared to 17% in Year 8 due to the £5 billion of trade deficit and it is quite lower as compared to the target value of 20%. There is also a noticeable increase in potential output (Q) which is related and it could be generally attributed to growth in quality and quantity of the labour force and the capital stock as well as technological progress,
Unemployment
0
2
4
6
8
10
12
14
1 2 3 4 5 6 7 8 9 10 11 12 13 14 15
Years
Une
mpl
oym
ent R
ate
Conclusion The negative exchange rate (-2,0) depreciation during the current year is a signal that imports may continue to increase. The depreciation of the exchange rate is the outcome of the balance of payments deficit. The influence of the international sector on the economy is demonstrated by the significant increase in actual output (Y). Our policy choice resulted in a significant reduction of aggregate demand and it is the first
Q 493 T 153 ForINF 4.0% Y 498 TransU 7 ForY 497 C 61% 303 TransW 57 ForR 5% I 15% 81 Budget def -28 CapFlows in 2
G 24% 118 M 90 BalTrade def -5 X 137 Real R 6.7% BP def -3 Z 142 Nom R 4.7% Exge Rate dep -2.0%
INV 5 U 5.4% VAT Rate 10% WGR 2.1% TAX Rate 23% INF -1.3%
WELFARE +3*CIG -U 2 -INF 2 -5*BUD SUM 400 572 29 0 142 1303
33
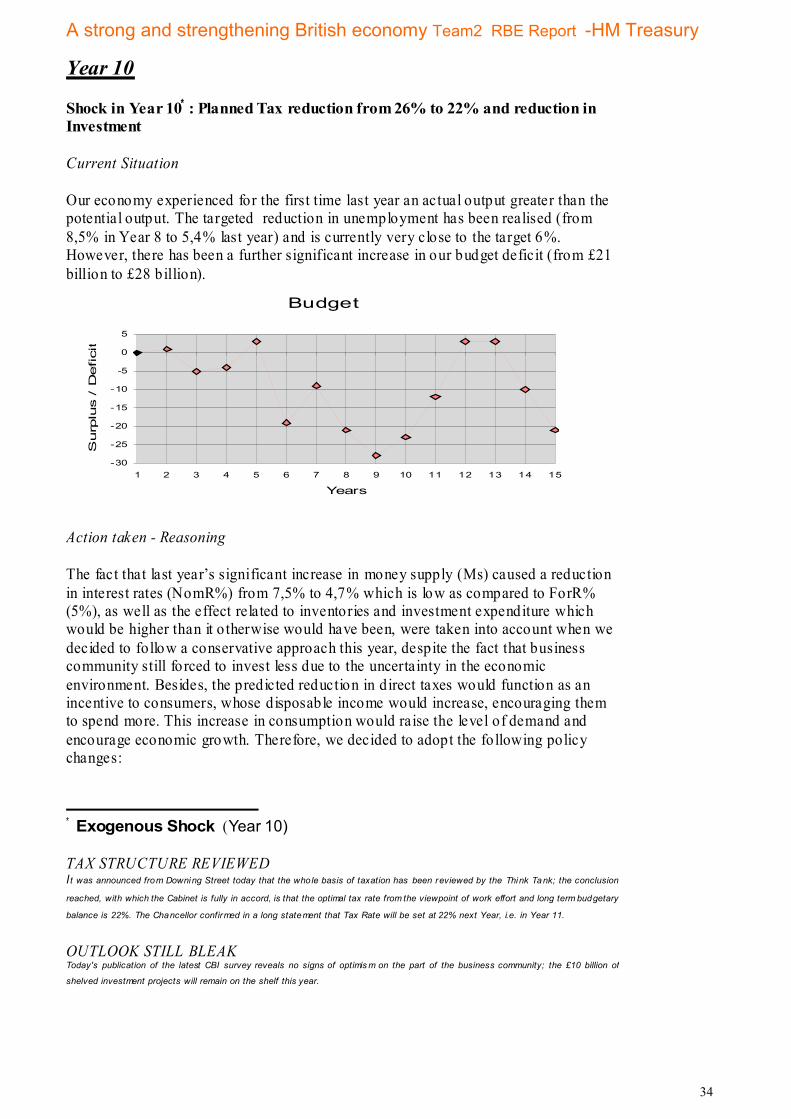
A strong and strengthening British economy Team2 RBE Report -HM Treasury
Year 10 Shock in Year 10∗ : Planned Tax reduction from 26% to 22% and reduction in Investment Current Situation Our economy experienced for the first time last year an actual output greater than the potential output. The targeted reduction in unemployment has been realised (from 8,5% in Year 8 to 5,4% last year) and is currently very close to the target 6%. However, there has been a further significant increase in our budget deficit (from £21 billion to £28 billion).
Budget
-30
-25
-20
-15
-10
-5
0
5
1 2 3 4 5 6 7 8 9 10 11 12 13 14 15
Years
Surp
lus / D
eficit (
bilio
n)
Action taken - Reasoning The fact that last year’s significant increase in money supply (Ms) caused a reduction in interest rates (NomR%) from 7,5% to 4,7% which is low as compared to ForR% (5%), as well as the effect related to inventories and investment expenditure which would be higher than it o therwise would have been, were taken into account when we decided to follow a conservative approach this year, despite the fact that business community still forced to invest less due to the uncertainty in the economic environment. Besides, the predicted reduction in direct taxes would function as an incentive to consumers, whose disposable income would increase, encouraging them to spend more. This increase in consumption would raise the level of demand and encourage economic growth. Therefore, we decided to adopt the following policy changes:
∗ Exogenous Shock (Year 10) TAX STRUCTURE REVIEWED I t was announced from Downing Street today that the whole basis of taxation has been reviewed by the Think Tank; the conclusion
reached, with which the Cabinet is fully in accord, is that the optimal tax rate from the viewpoint of work effort and long term budgetary
balance is 22%. The Chancellor confirmed in a long statement that Tax Rate will be set at 22% next Year, i.e. in Year 11.
OUTLOOK STILL BLEAK Today's publication of the latest CBI survey reveals no signs of optimis m on the part of the business community; the £10 billion of
shelved investment projects will remain on the shelf this year.
34

A strong and strengthening British economy Team2 RBE Report -HM Treasury
Main Economic Indicators – Year 10
Results / Comments The results of our policy changes were not as satisfactory as we expected them to be since the gap between actual and potential output increased from £5 billion in year 9 to £10 billion this year with a relatively small reduction in the budget deficit which is still of a great concern. Unemployment rate was reduced further (from 5,4% to 4,8%) and the interest rate (NomR%) as a result of the decrease in money supply, increased from 4,7% to 7,0% which is high as compared to ForR% (5%). Inflation increased from –1,3% to 2,1% mainly due to the fact that Y>Q, but it is still lower than ForR% (4%). Balance of trade is positive again as compared to the last two years’ negative values indicating an increase in exports as compared to imports. This is partly due to the difference between inflation rates (domestic and foreign). Although there has been a slight improvement in the percentage values of C, I and G (60%, 17% and 23% respectively) as compared to 61%, 15% and 24% in year 9, there is still a need for improvement in order to reach the ideal 60%, 20%, 20%. The exchange rate, as a result of the decrease in money supply, increased from –2,0% in year 9 to 5,4% this year, which may affect the balance of trade with a possible increase in imports. Conclusion Having in mind the uncertainty in international markets and the significant cut back on firm investment plans, the achieved increase in investment, despite our decision to reduce government expenditure and money supply, could be considered as a successful policy measure. However, we still have to continue our efforts to reduce further budget deficit by adopting a more conservative approach introducing contractionary measures as far as the government expenditure is concerned. O ur decision to decrease money supply resulted in an increase of the value of NomR% (from 4,7% to 7,0%) which exceeds even more, as compared to previous year results, the value of ForR% (4%).
Q 505 T 157 ForINF 4.0% Y 515 TransU 6 ForY 509 C 60% 311 TransW 58 ForR 5% I 17% 85 Budget def -23 CapFlows in 4
G 23% 117 M 83 BalTrade sur 3 X 146 Real R 8.3% BP sur 7 Z 143 Nom R 7.0% Exge Rate app 5.4%
INV 10 U 4.8% VAT Rate 10% WGR 5.4% TAX Rate 23% INF 2.1%
WELFARE +3*CIG -U 2 -INF 2 -5*BUD SUM 450 595 23 5 117 1753
35
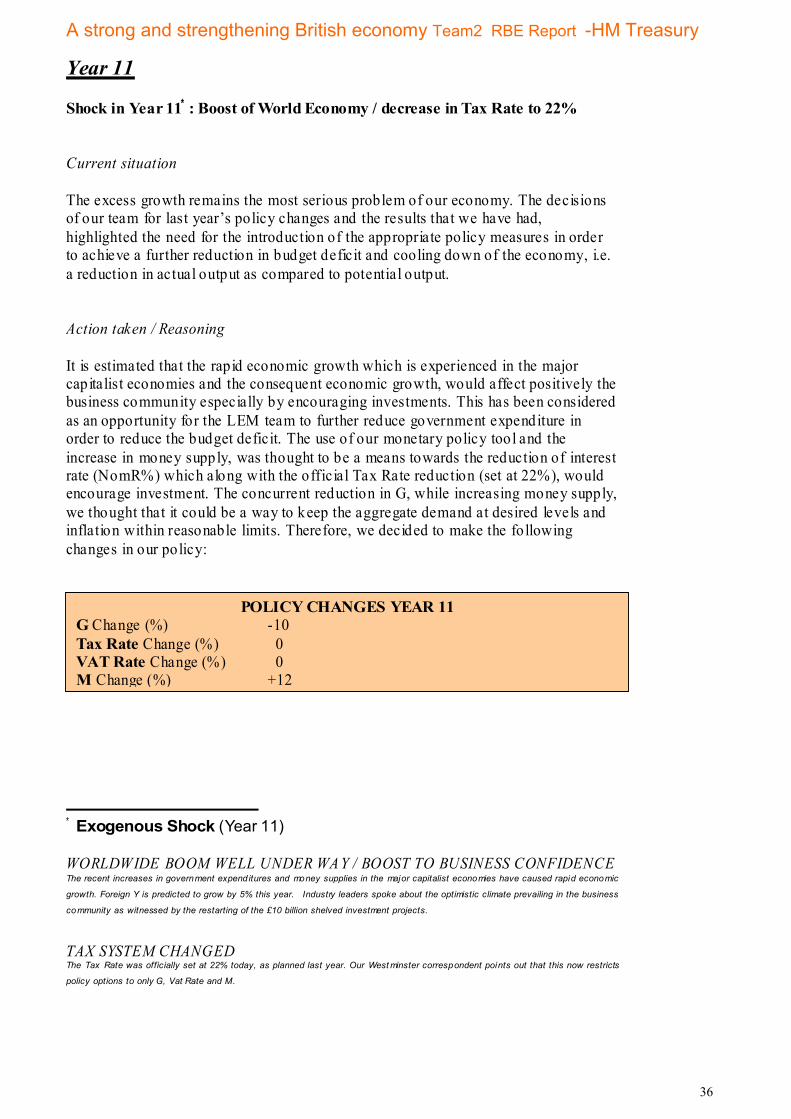
A strong and strengthening British economy Team2 RBE Report -HM Treasury
Year 11 Shock in Year 11∗ : Boost of World Economy / decrease in Tax Rate to 22% Current situation The excess growth remains the most serious problem of our economy. The decisions of our team for last year’s policy changes and the results that we have had, highlighted the need for the introduction of the appropriate policy measures in order to achieve a further reduction in budget deficit and cooling down of the economy, i.e. a reduction in actual output as compared to potential output. Action taken / Reasoning It is estimated that the rapid economic growth which is experienced in the major capitalist economies and the consequent economic growth, would affect positively the business community especially by encouraging investments. This has been considered as an opportunity for the LEM team to further reduce government expenditure in order to reduce the budget deficit. The use of our monetary policy tool and the increase in money supply, was thought to be a means towards the reduction of interest rate (NomR%) which along with the official Tax Rate reduction (set at 22%), would encourage investment. The concurrent reduction in G, while increasing money supply, we thought that it could be a way to keep the aggregate demand at desired levels and inflation within reasonable limits. Therefore, we decided to make the following changes in our policy:
∗ Exogenous Shock (Year 11) WORLDWIDE BOOM WELL UNDER WA Y / BOOST TO BUSINESS CONFIDENCE The recent increases in government expend itures and money supplies in the major capitalist economies have caused rapid economic
growth. Foreign Y is predicted to grow by 5% this year. Industry leaders spoke about the optimistic climate prevailing in the business
community as witnessed by the restarting of the £10 billion shelved investment projects.
TAX SYSTEM CHANGED The Tax Rate was officially set at 22% today, as planned last year. Our West minster correspondent points out that this now restricts
policy options to only G, Vat Rate and M.
POLICY CHANGES YEAR 11 G Change (%) -10 Tax Rate Change (%) 0 VAT Rate Change (%) 0 M Change (%) +12
36
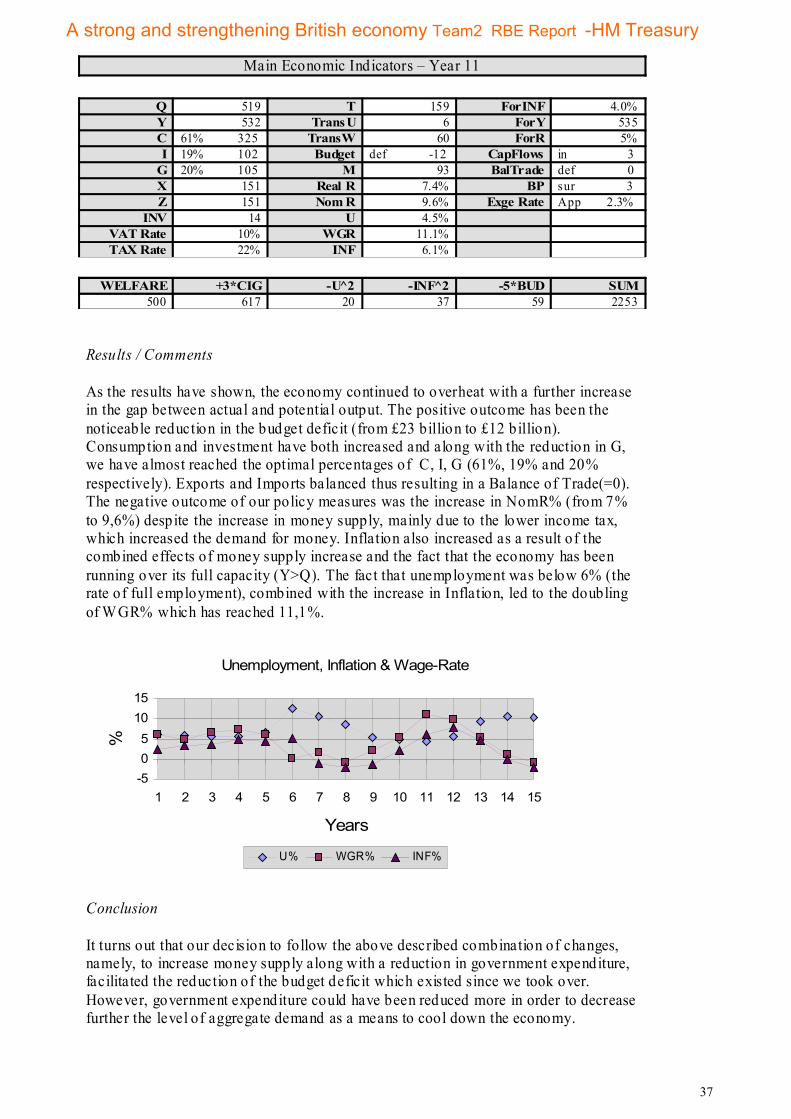
A strong and strengthening British economy Team2 RBE Report -HM Treasury
Main Economic Indicators – Year 11
Results / Comments As the results have shown, the economy continued to overheat with a further increase in the gap between actual and potential output. The positive outcome has been the noticeable reduction in the budget deficit (from £23 billion to £12 billion). Consumption and investment have both increased and along with the reduction in G, we have almost reached the optimal percentages of C, I, G (61%, 19% and 20% respectively). Exports and Imports balanced thus resulting in a Balance of Trade(=0). The negative outcome of our policy measures was the increase in NomR% (from 7% to 9,6%) despite the increase in money supply, mainly due to the lower income tax, which increased the demand for money. Inflation also increased as a result of the combined effects of money supply increase and the fact that the economy has been running over its full capacity (Y>Q). The fact that unemployment was below 6% (the rate of full employment), combined with the increase in Inflation, led to the doubling of WGR% which has reached 11,1%.
Unemployment, Inflation & Wage-Rate
-505
1015
1 2 3 4 5 6 7 8 9 10 11 12 13 14 15
Years
%
U% WGR% INF%
Conclusion It turns out that our decision to follow the above described combination of changes, namely, to increase money supply along with a reduction in government expenditure, facilitated the reduction of the budget deficit which existed since we took over. However, government expenditure could have been reduced more in order to decrease further the level of aggregate demand as a means to cool down the economy.
Q 519 T 159 ForINF 4.0% Y 532 TransU 6 ForY 535 C 61% 325 TransW 60 ForR 5% I 19% 102 Budget def -12 CapFlows in 3
G 20% 105 M 93 BalTrade def 0 X 151 Real R 7.4% BP sur 3 Z 151 Nom R 9.6% Exge Rate App 2.3%
INV 14 U 4.5% VAT Rate 10% WGR 11.1% TAX Rate 22% INF 6.1%
WELFARE +3*CIG -U 2 -INF 2 -5*BUD SUM 500 617 20 37 59 2253
37

A strong and strengthening British economy Team2 RBE Report -HM Treasury
Year 12
Exogenous Shock The Big seven are experiencing low unemployment, caused by their inflationary policies and
thus it is possible that inflation will rise to 8% worldwide.1
We, the LEM team, have advised the Chancellor to make no changes to the fiscal tax policy
and retain the current tax rate at 22%. We believe that frequent changes in the tax structure is
a needless drain on the national exchequer.2
Current Situation
Macro Economic Indicators
Main Econom ic Indicators – Year 12
Q
533 T
161 ForINF 8.0%
Y
537
TransU
7
ForY
562
C 61% 330 TransW 61 ForR 5% I 22% 116 Budget sur 3 CapFlows in 3
G 17% 89 M 103 BalTrade sur 1 X 155 Real R 7.3% BP sur 4 Z 154 Nom R 13.4% Exge Rate app 3.1%
INV 4 U 5.6% VAT Rate 10% WGR 9.7% TAX Rate 22% INF 7.9%
WELFARE +3*CIG -U^2 -INF 2 -5*BUD SUM 510 620 31 62 17 2763
Action Taken:
Decrease Governm ent Expenditure b y 15%
1 The expansionary policies of the Big Seven over the past year have led to the lowest unemployment rates for many
years . The Prime M inister's personal Econo mic Adviser stated on TV last night that this will lead to worldwide inflationary pressures, and predicted that Foreign INF will rise to 8% this year.
2 In the face of Opposition catcalls in the Co mmons today, the Chancellor argued that the success of the 22% Tax Rate policy cannot be judged on the basis of one year's experience, and that the 22% rate will prevail this year. He c la imed that he was quite happy to run the economy using only government expenditure, VAT Rate and money supply.
38
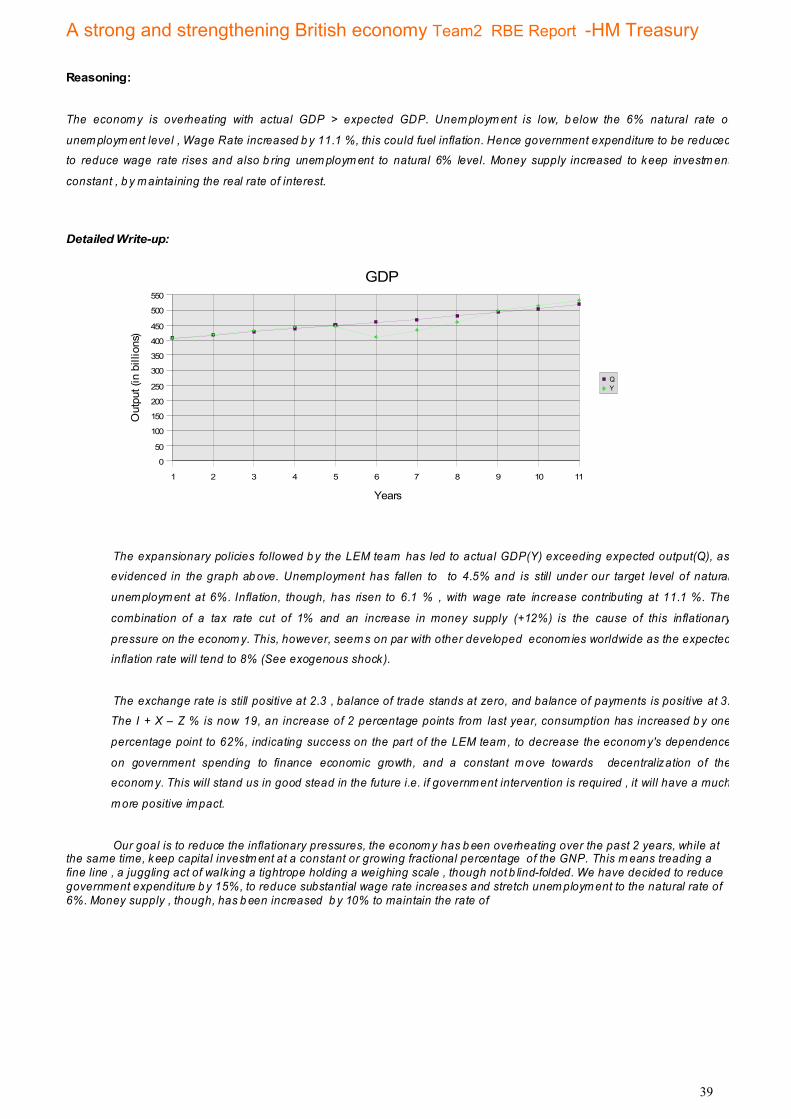
A strong and strengthening British economy Team2 RBE Report -HM Treasury
Reasoning:
The econom y is overheating with actual GDP > expected GDP. Unem ploym ent is low, b elow the 6% natural rate of
unem ploym ent level , Wage Rate increased b y 11.1 %, this could fuel inflation. Hence government expenditure to be reduced
to reduce wage rate rises and also b ring unem ploym ent to natural 6% level. Money supply increased to keep investm ent
constant , b y m aintaining the real rate of interest.
Detailed Write-up:
The expansionary policies followed b y the LEM team has led to actual GDP(Y) exceeding expected output(Q), as
evidenced in the graph ab ove. Unemployment has fallen to to 4.5% and is still under our target level of natural
unem ploym ent at 6%. Inflation, though, has risen to 6.1 % , with wage rate increase contributing at 11.1 %. The
combination of a tax rate cut of 1% and an increase in money supply (+12%) is the cause of this inflationary
pressure on the econom y. This, however, seem s on par with other developed econom ies worldwide as the expected
inflation rate will tend to 8% (See exogenous shock).
The exchange rate is still positive at 2.3 , balance of trade stands at zero, and balance of payments is positive at 3.
The I + X – Z % is now 19, an increase of 2 percentage points from last year, consumption has increased b y one
percentage point to 62%, indicating success on the part of the LEM team , to decrease the econom y's dependence
on government spending to finance economic growth, and a constant m ove towards decentralization of the
econom y. This will stand us in good stead in the future i.e. if governm ent intervention is required , it will have a much
m ore positive im pact.
Our goal is to reduce the inflationary pressures, the econom y has b een overheating over the past 2 years, while at the same time, keep capital investm ent at a constant or growing fractional percentage of the GNP. This m eans treading a fine line , a juggling act of walk ing a tightrope holding a weighing scale , though not b lind-folded. We have decided to reduce government expenditure b y 15%, to reduce substantial wage rate increases and stretch unem ploym ent to the natural rate of 6%. Money supply , though, has b een increased b y 10% to maintain the rate of
1 2 3 4 5 6 7 8 9 10 11
0
50
100
150
200
250
300
350
400
450
500
550
GDP
QY
Years
Out
put (
in b
illio
ns)
39

A strong and strengthening British economy Team2 RBE Report -HM Treasurycapital investm ent.
Year 13
Exogenous Shock & Impact Analysis
Transfer to Welfare payments will rise this year to address the impact of mounting medical
costs. This will cause an additional burden to the national exchequer of 15 billion pounds.1
The additional burden to be incurred by the national exchequer will need to be financed. We,
the LEM team, are considering a change in the tax rate. 2
Macro Economic Indicators
Main Econom ic Indicators – Year 13
1 A statement from Downing Street today revealed that the Cabinet has agreed that allowances to the old, the
sick and the disabled will be substantially increased this year. The statement continued that these increases were necessary because of mounting medical costs caused by a non-accountable national health service. Treasury sources predict that the cost to the exchequer will be an additional £15 billion (TransW).
2 The Chancellor's statement to the Commons that he now reserved the right to alter the 22% Tax Rate came as no surprise, given the increases announced earlier today in welfare payments. The Chancellor refused to respond to Opposition derision which centered on his inflexibility last year.
WELFARE +3*CIG -U 2 -INF 2 -5*BUD SUM
472 592 84 22 14 3234
Q
547 T
163 ForINF
8.0%
Y
519
TransU
12
ForY
590
C 64% 332 TransW 78 ForR 5% I 23% 108 Budget sur 3 CapFlows in 2
G 13% 70 M 110 BalTrade sur 9 X 160 Real R 6.8% BP sur 12 Z 151 Nom R 14.7% Exge Rate app 8.9%
INV 0 U 9.2% VAT Rate 10% WGR 5.4% TAX Rate 23% INF 4.7%
40

A strong and strengthening British economy Team2 RBE Report -HM Treasury
Action Taken:
Reduce Governm ent Expenditure b y 22%
Increase Taxes b y 1%
Increase Money Supply b y 7%
Reasoning:
Inflation is 7.9%. Also NHS costs are to escalate. So we reduced governm ent spending to b oth reduce inflation and to be
ab le to ab sorb the additional b urden in Transfers to Welfare paym ents.
Taxes increased b y 1% to increase governm ent revenue.
Money supply increased b y 7% to retain econom ic growth, so that real interest rates do not rise and investm ent spending
does not fall.
Detailed Write-up:
The increase in the payments to welfare dominates the LEM team's agenda while formulating policy for the financial year 13. Unem ploym ent has now m oved towards the natural rate of unem ploym ent and is 5.6%. Inflation is alm ost on par with expected rate of 8% of the G-7 countries at 7.9%. Real rate of interest is 7.3%, a decrease of 0.1 percentage points from the previous year, though the nominal rate of interest is now 13.4%, up from 9.6%. Though this makes capital investment expensive, in real term s, it has decreased. Also capital inflows are positive at 3 b illion pounds, implying that the economic growth has managed to keep the British econom y attractive to outside investors.
Welfare has hit an all-tim e high of 510 points, a reflection of the steady improvem ent in the LEM team 's handling of the econom y. The exchange rate is 3.1 indicating a strong pound. Consum ption has fallen by one percentage point to 61% of the GNP and I+X-Z% has now risen to 22%, in line with our policy of keeping government out, allowing for the rule of the invisible hand at the macro-economic level.
The expected increase in paym ents to welfare forces us to slash governm ent expenditure b y 22%, the largest percentage cut ever. We also increase tax rates by 1%, not because of pressure from parliament, but em ploym ent of a tactic , we term 'psychonomics', that assum es that the pub lic believes that welfare paym ents are to be paid for b y increased taxes. This , of course, follows precedent. Money supply(M) increased b y 7% to retain econom ic growth, so that real interest rates do not rise and investm ent spending does not fall.
1 2 3 4 5 6 7 8 9 10 11 12-2
0
2
4
6
8
10
12
14
Inflation Vs Unemployment
U%INF%
Years
Perc
enta
ge R
ate
41

A strong and strengthening British economy Team2 RBE Report -HM Treasury
Year 14
Exogenous Shock and Impact Analysis
The Prime Minister's announcement of the ban on harmful food products from abroad, will
have a deflationary impact on the import bill, with a tendency to lead to a surplus balance of
trade. 1
Macro Economic Indicators
Main Econom ic Indicators – Year 14
Policy Decision:
Increase Government Expenditure b y 10%
Decrease Money Supply b y 17%
Reasoning:
Inflation is under control b ut unem ploym ent has risen. Hence governm ent expenditure increased b y 10%. Money supply
1 The Prime Minister announced in Par liament today that empirical data from carefully controlled diet programmes show that many imported foods
containing steroids and certain preservatives are injurious to health. Accordingly, there will be a ban from midnight on the import of a wide range of foods and beverages. The Board of Trade estimates that the value of the banned imports will be £15 billion. Our economics correspondent points out that this will have an impact on the country's import bill; the final import bill, however, will also be affected by the change in last year's exchange rate, last year's domestic versus foreign inflation rate, and this year's growth in domestic demand.
Q
561 T
161 ForINF
8.0%
Y
518
TransU
15
ForY
619
C 63% 329 TransW 80 ForR 5% I 22% 88 Budget def -10 CapFlows in 9
G 15% 77 M 91 BalTrade sur 25 X 164 Real R 11.3% BP sur 33 Z 139 Nom R 15.9% Exge Rate app 26.5%
INV 0 U 10.6% VAT Rate 10% WGR 1.2% TAX Rate 23 INF -0.1%
WELFARE +3*CIG -U 2 -INF 2 -5*BUD SUM 432 595 113 0 50 3667
42
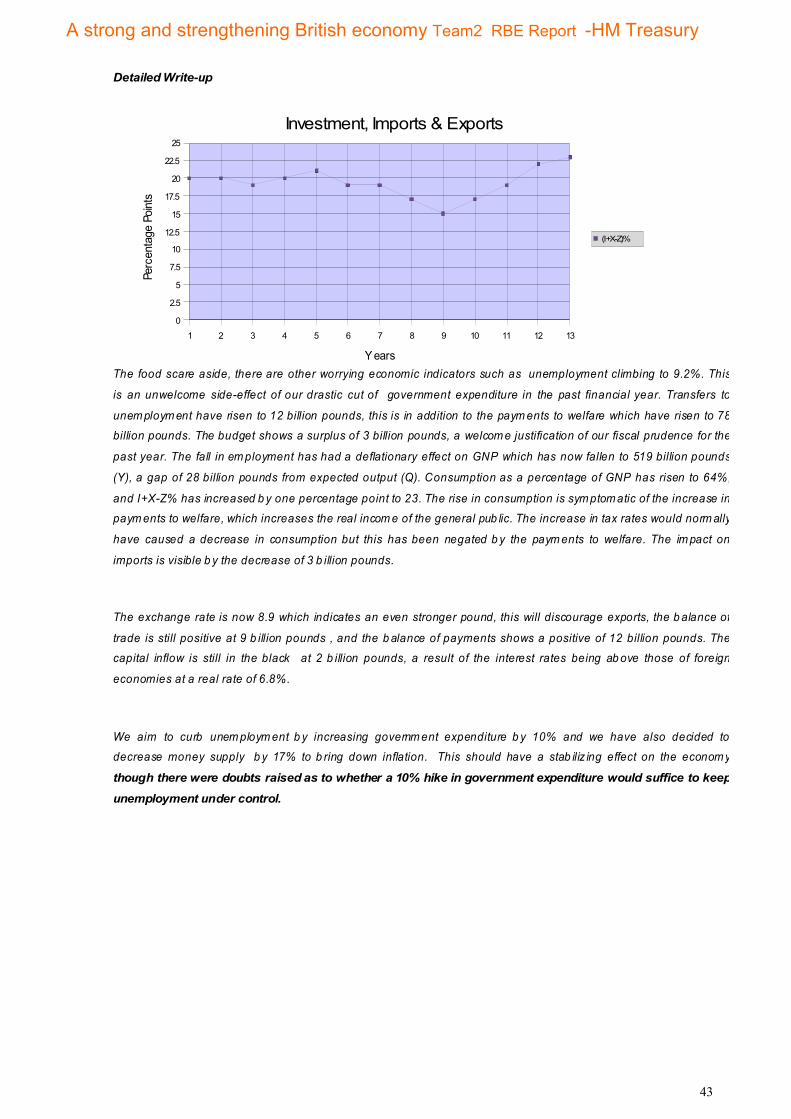
A strong and strengthening British economy Team2 RBE Report -HM Treasury
Detailed Write-up
The food scare aside, there are other worrying economic indicators such as unemployment climbing to 9.2%. This
is an unwelcome side-effect of our drastic cut of government expenditure in the past financial year. Transfers to
unem ploym ent have risen to 12 billion pounds, this is in addition to the paym ents to welfare which have risen to 78
billion pounds. The budget shows a surplus of 3 billion pounds, a welcom e justification of our fiscal prudence for the
past year. The fall in em ployment has had a deflationary effect on GNP which has now fallen to 519 billion pounds
(Y), a gap of 28 billion pounds from expected output (Q). Consumption as a percentage of GNP has risen to 64%,
and I+X-Z% has increased b y one percentage point to 23. The rise in consumption is sym ptom atic of the increase in
paym ents to welfare, which increases the real incom e of the general pub lic. The increase in tax rates would norm ally
have caused a decrease in consumption but this has been negated b y the paym ents to welfare. The im pact on
imports is visible b y the decrease of 3 b illion pounds.
The exchange rate is now 8.9 which indicates an even stronger pound, this will discourage exports, the b alance of
trade is still positive at 9 b illion pounds , and the b alance of payments shows a positive of 12 billion pounds. The
capital inflow is still in the black at 2 b illion pounds, a result of the interest rates being ab ove those of foreign
economies at a real rate of 6.8%.
We aim to curb unem ploym ent b y increasing governm ent expenditure b y 10% and we have also decided to
decrease money supply b y 17% to b ring down inflation. This should have a stab iliz ing effect on the econom y
though there were doubts raised as to whether a 10% hike in government expenditure would suffice to keep
unemployment under control.
1 2 3 4 5 6 7 8 9 10 11 12 13
0
2.5
5
7.5
10
12.5
15
17.5
20
22.5
25
Investment, Imports & Exports
(I+X-Z)%
Y ears
Perc
enta
ge P
oints
43

A strong and strengthening British economy Team2 RBE Report -HM Treasury
Year 15
Exogenous Shock:
The food scare continues continuing the deflationary effect on the import bill1
The LEM team is under time pressure since the results from a GALLUP poll indicate the
public's disfavor. We are now under the microscope, every action taken in this fiscal and
election year, wil l be disassembled, for public consumption 2
Macro Economic Indicators
Main Econom ic Indicators – Year 15
Policy Decision:
Increase Government Expenditure b y 20%
Increase Money Supply b y 20%
Reasoning:
The econom y is now experiencing deflation. Hence government expenditure increased b y 20% to reduce unem ploym ent and fuel inflation. The real rate of interest has risen to 11.3 % , discouraging capital investm ent. Money supply loosened to
1 The Depart ment of Health has decided to prolong the ban on suspect food and drink imports.
2 The latest Gallup Poll shows that the Opposition has a lead of 11% over the government. Supplementary questions revealed that this was primarily due to the poor performance of the economy. LadBooks, a leading bookmaker, announced today that the odds on this government remaining in power are 8-1 against!
Q
574 T
167 ForINF
8.0%
Y
534
TransU
14
ForY
650
C 64% 341 TransW 81 ForR 5% I 19% 96 Budget def -21 CapFlows in 5
G 17% 92 M 109 BalTrade sur 5 X 160 Real R 8.6% BP sur 10 Z 155 Nom R 8.4% Exge Rate app 7.1%
INV 0 U 10.2% VAT Rate 10% WGR -0.8% TAX Rate 23% INF -0.2%
WELFARE +3*CIG -U 2 -INF 2 -5*BUD SUM 410 617 103 0 104 4077
44

A strong and strengthening British economy Team2 RBE Report -HM Treasury
Detailed Write-up:
The poor perform ance of the econom y over the past year has raised concerns ab out the future of the
current government that we are advising. We are under pressure to deliver and turnaround the econom y especially
since this is an election year. The deflationary policies that we im plemented have succeeded and have caused
deflation at 0.1%. Unem ploym ent has increased b y 1.4 percentage points to 10.6.. (Note: This follows the
principle outlined by the Philips curve that unemployment rate is inversely proportional to inflation, in the
short run. The diagram below displays the trend of the unemployment and inflation rates,
illustrating the validity of the Philips curve in the short run.)
The gap b etween actual and potential output has widened further, an indicator that an increase in the
unem ploym ent rate ab ove the natural rate of unemployment always leads to a decline in productivity of the
econom y. Consum ption has decreased b y one percentage point to 63% and so is the case with I + (X-Z) % to 22%.
The increase in the interest rates is another contributing factor to the decrease in capital investm ent.. Welfare has
fallen to 432 points. The governm ent expenditure has increased b y 2 percentage points to 15% but has failed to
stim ulate the econom y sufficiently.
The real rate of interest has increased to 11.3% attracting foreign capital inflow to the tune of 9 billion pounds,
balance of trade and b alance of paym ents are positive at 25 & 33 b illion pounds respectively. The exchange rate is
26.5 keeping the pound strong.
We feel the need to reduce unemployment b y increasing government expenditure and increase capital investm ent
b y increasing m oney supply to lower the rate of interest i.e. the cost of m oney. We increase government expenditure
b y 20% and increase m oney supply b y 20% to hope to jum p-start the econom y.
1 2 3 4 5 6 7 8 9 10 11 12 13 14
-2
0
2
4
6
8
10
12
14
Unemployment Vs Inflation
U%INF%
Years
Per
cent
age
Poi
nts
45
A strong and strengthening British economy Team2 RBE Report -HM Treasury
500.CONCLUSIONS
Tenure Results Analysis:
At the end of year 15 , unemployment has fallen by 0.4 percentage points to 10.2 , an indicator that a 20%
increase in government expenditure was too little, too late. However, a 2 year span would reveal the true effects
of the continual of this expansionist policy of government expenditure. However, we were constrained by our
policy of minimizing the government's role in the running of the economy. Wage rates have fallen by 0.8%, and
the continuing deflation are a worrisome indicator that the economy is probably heading towards a recession.
Consumption increased by one percentage point to 64 but I +(X-Z) has dropped to 19% indicating that the
monetary policy implemented has not had the desired effect. Capital investment has increased by 8 billion
pounds , an increase of approximately 9%. This has however been offset by the decrease in the balance of
trade from a high of 25 to 5 billion pounds. The fall in the real rate of interest will make borrowing money for
capital investment more attractive to firms. The exchange rate has risen further by 7.1 percentage points . The
gap between potential and actual output has narrowed to 40 billion pounds, indicating that unemployment is still
the most crucial aspect of this economy. This will probably be the reason why the current government will not
survive the ballot box, leaving the LEM team holding the reins of a recovering economy to be handed over to
the successive government's economic think-tank. The LEM team believes that if it had been more aggressive
with government spending over the past 2 years, the unemployment rate could have been brought under control.
The drastic slash in government expenditure in year 13 necessitated a corresponding increase in government
expenditure over the next 2 years, so that rising unemployment was curbed. The monetary policy could have
been better managed with more prudence shown in the %age cuts especially in year 14.
(a)Overall Conclusion
We took over after a period of a quite stable performance and although we managed to handle relatively well the situation after the first shock, we had never actually achieved the targeted stability in our economy.
Among our objectives was to keep unemployment low (around 6%), to have a low inflation rate and maintain a balance between imports and exports so as to protect local industries from outside competition and avoid undesirable implications of a negative balance of trade. During the first 7 years and after the first shock and turmoil in our economy, we had managed to improve the key economic indicators and had brought them to relatively satisfactory levels, mainly during years 11 and 12. There had been a steady progress from year 6 to year 12 which can easily be traced from the welfare values which is a “sensor” value of the overall performance of the economy.
However, despite the fact that we had managed to get an unemployment rate of 5,6%, a budget surplus of 3 billion after a long period of budget deficits, we did not succeed in maintaining and further improving those positive outcomes, which were associated with a relatively good balance in the distribution of consumption, investment and government spending (61-19-20).
Our policy choices and results, highlighted the importance of controlling actual output as compared to potential output. Also in terms of the policy measures that we had introduced and based on supply side economic principles, we conclude that we could had used more the tool of tax rate changes. This in turn would affect work incentives that is perceived as a change in the labour stock which in turn affects the growth rate of potential output.
We realize that the only period we had managed to have a “reasonable” unemployment rate of 5,6% was during year 12, when we also had the smallest output gap (Q = 533, Y = 537). The same happened during year 9 with a difference in output of 5 billion (Q = 493, Y = 498), a 5,4% unemployment rate, NomR% of 4,7% as compared to ForR% of 5,0%. Unfortunately the fact that we eventually did not manage to control Y in relation to Q, had brought a series of effects and made it very difficult to keep the economy in balance, especially during the last period we were in office.
46
A strong and strengthening British economy Team2 RBE Report -HM Treasury
600. APPENDICES
INDEX
100.EXECUTIVE SUMMARY.................................................................................................................................................3200.INTRODUCTION.............................................................................................................................................................12 Philips Curve ................................................................................................................................................................................12 Subsequent theories however have proven that this relationship does not stand in the long run. The theory of the "natural" rate of unemployment – distinguishes between the short-term Phillips curve and the long-term one. The short-term PC looked like a normal PC but shifted in the long run as expectations for inflation changed. In the long run, only a single rate of unemployment (the NAIRU or "natural" rate) was consistent with a stable inflation rate. Therefore the long-run PC is vertical, so there was no trade-off between inflation and unemployment...................................................................................................12 Gross Domestic Product (GDP)....................................................................................................................................................13300.INHERITED SITUATION – A DETAILED DESCRIPTION.........................................................................................16400.DETAIL ANALYSIS OF THE SITUATION IN EACH YEAR ....................................................................................22500.CONCLUSIONS...............................................................................................................................................................46(a) Overall Conclusion ................................................................................................................................................................... 46 600. APPENDICES.................................................................................................................................................................47 I RESULTS AS PER RBE SIMULATION RESULT SCREEN...........................................48 II ECONOMIC INDICATORS..............................................................................................52(b) > Economic Indicators For Years XX01 - XX15 ..................................................................................................................... 52 III THE BASIC GRAPHS DEPICTING RELATIONSHIPS OF KEY ECONOMIC VARIANTS...................................................................................................................................................................................54(a) 4> Unemployment Vs Inflation................................................................................................................................................56(b) 5> Actual & Potential Output & The Unemployment Rate.....................................................................................................57(d) 6> Unemployment , Inflation & Wage-Rate............................................................................................................................58(e) 8> Income Tax To Total Taxes................................................................................................................................................60(f) 9> International (Real)..............................................................................................................................................................61(g) 10> International Finance........................................................................................................................................................63(h) 11> Inflation.............................................................................................................................................................................65(i) 12> Taxes..................................................................................................................................................................................66(j) 13> Policy Tracker....................................................................................................................................................................67(k) 14> Welfare..............................................................................................................................................................................68(l) 15> Money In Circulation.........................................................................................................................................................69(m) 16> Net Exports......................................................................................................................................................................70 IV EXOGENOUS SHOCKS ......................................................................................71 1> Exogenous Shocks...................................................................................................................................................................72 16> Closing Note..........................................................................................................................................................................74
47
A strong and strengthening British economy Team2 RBE Report -HM Treasury
APPENDIX
I RESULTS AS PER RBE SIMULATION
RESULT SCREEN
YEAR XX06 TO XX15
48
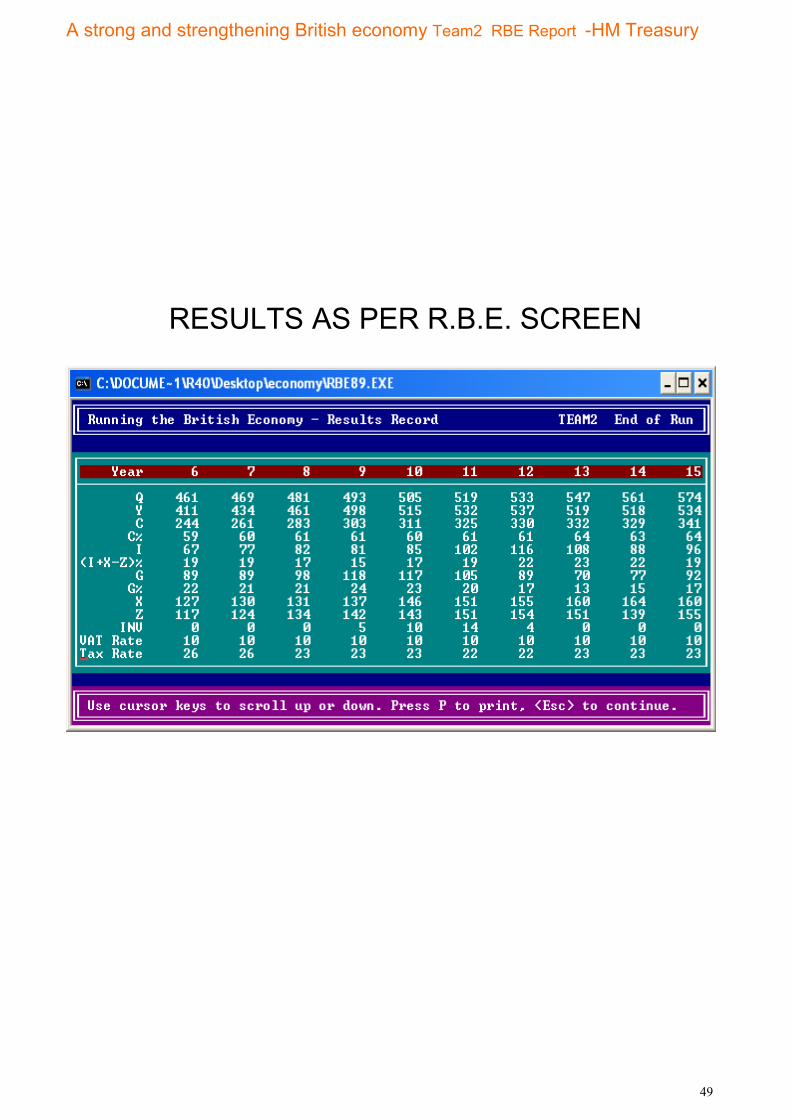
A strong and strengthening British economy Team2 RBE Report -HM Treasury
RESULTS AS PER R.B.E. SCREEN
49

A strong and strengthening British economy Team2 RBE Report -HM Treasury
50
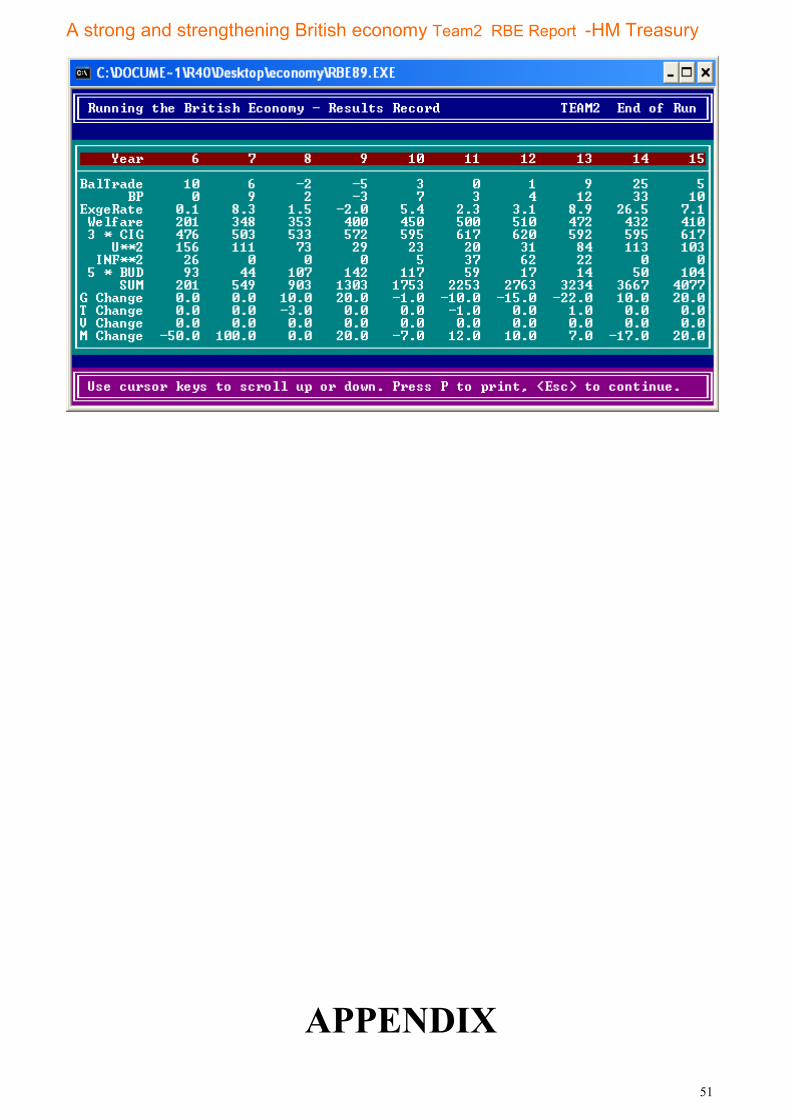
A strong and strengthening British economy Team2 RBE Report -HM Treasury
APPENDIX 51

A strong and strengthening British economy Team2 RBE Report -HM Treasury
II ECONOMIC INDICATORS
YEAR XX01 TO XX15
(b)> Economic Indicators For Years XX01 - XX15
Year 1 2 3 4 5 6 7 8 9 10 11 12 13 14 15Q 408 418 429 440 450 461 469 481 493 505 519 533 547 561 574Y 408 419 432 444 447 411 434 461 498 515 532 537 519 518 534C 245 251 261 268 264 244 261 283 303 311 325 330 332 329 341C% 60 60 60 60 59 59 60 61 61 60 61 61 64 63 64I 81 83 84 87 92 67 77 82 81 85 102 116 108 88 96(I+X-Z)% 20 20 19 20 21 19 19 17 15 17 19 22 23 22 19G 82 83 88 89 89 89 89 98 118 117 105 89 70 77 92G% 20 20 20 20 20 22 21 21 24 23 20 17 13 15 17X 114 118 120 124 126 127 130 131 137 146 151 155 160 164 160Z 114 117 121 124 125 117 124 134 142 143 151 154 151 139 155INV 0 1 3 4 0 0 0 0 5 10 14 4 0 0 0VAT Rate 10 10 10 10 10 10 10 10 10 10 10 10 10 10 10Tax Rate 25 25 24 24 26 26 26 23 23 23 22 22 23 23 23T 135 138 138 142 151 138 147 142 153 157 159 161 163 161 167Trans U 6 6 6 6 7 14 12 10 7 6 6 7 12 15 14TransW 47 48 49 51 52 53 54 55 57 58 60 61 78 80 81Budget 0 1 -5 -4 3 -19 -9 -21 -28 -23 -12 3 3 -10 -21M 61 64 68 71 75 37 75 75 90 83 93 103 110 91 109Real R% 5.1 5.2 5.6 6.1 6.4 13.6 7.6 8.6 6.7 8.3 7.4 7.3 6.8 11.3 8.6
52
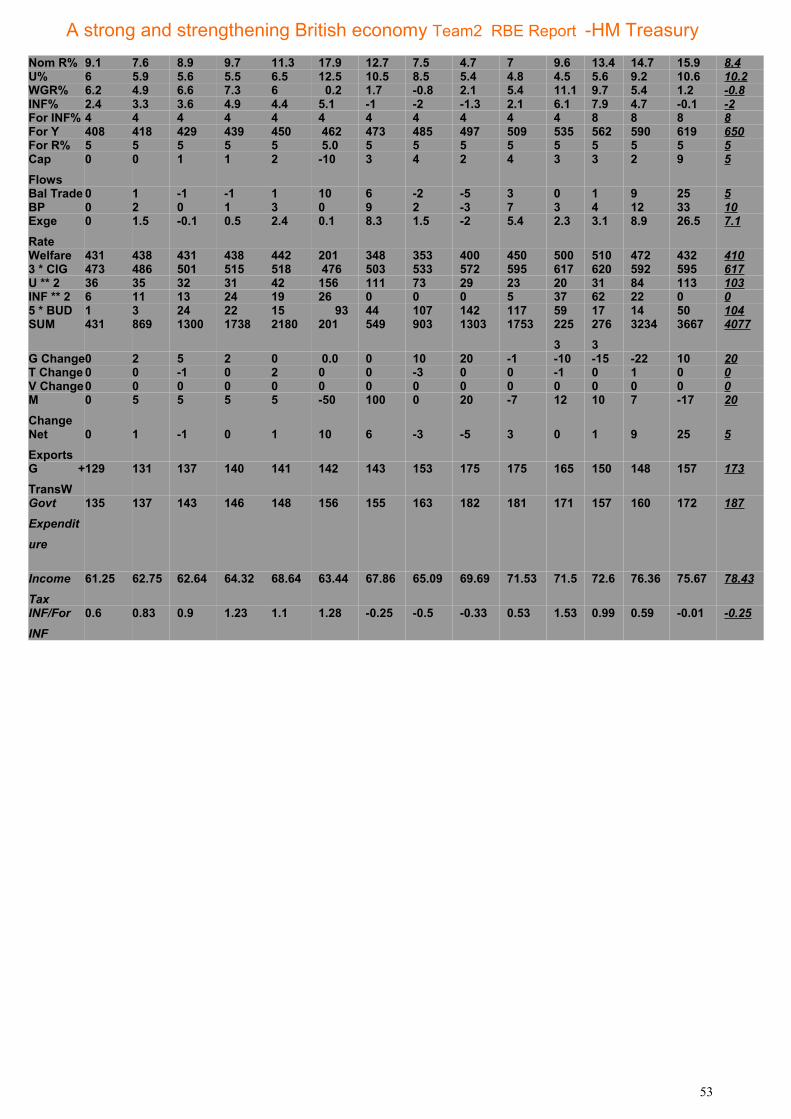
A strong and strengthening British economy Team2 RBE Report -HM TreasuryNom R% 9.1 7.6 8.9 9.7 11.3 17.9 12.7 7.5 4.7 7 9.6 13.4 14.7 15.9 8.4U% 6 5.9 5.6 5.5 6.5 12.5 10.5 8.5 5.4 4.8 4.5 5.6 9.2 10.6 10.2WGR% 6.2 4.9 6.6 7.3 6 0.2 1.7 -0.8 2.1 5.4 11.1 9.7 5.4 1.2 -0.8INF% 2.4 3.3 3.6 4.9 4.4 5.1 -1 -2 -1.3 2.1 6.1 7.9 4.7 -0.1 -2For INF% 4 4 4 4 4 4 4 4 4 4 4 8 8 8 8For Y 408 418 429 439 450 462 473 485 497 509 535 562 590 619 650For R% 5 5 5 5 5 5.0 5 5 5 5 5 5 5 5 5Cap Flows
0 0 1 1 2 -10 3 4 2 4 3 3 2 9 5
Bal Trade 0 1 -1 -1 1 10 6 -2 -5 3 0 1 9 25 5BP 0 2 0 1 3 0 9 2 -3 7 3 4 12 33 10Exge Rate
0 1.5 -0.1 0.5 2.4 0.1 8.3 1.5 -2 5.4 2.3 3.1 8.9 26.5 7.1
Welfare 431 438 431 438 442 201 348 353 400 450 500 510 472 432 4103 * CIG 473 486 501 515 518 476 503 533 572 595 617 620 592 595 617U ** 2 36 35 32 31 42 156 111 73 29 23 20 31 84 113 103INF ** 2 6 11 13 24 19 26 0 0 0 5 37 62 22 0 05 * BUD 1 3 24 22 15 93 44 107 142 117 59 17 14 50 104SUM 431 869 1300 1738 2180 201 549 903 1303 1753 225
32763
3234 3667 4077
G Change0 2 5 2 0 0.0 0 10 20 -1 -10 -15 -22 10 20T Change 0 0 -1 0 2 0 0 -3 0 0 -1 0 1 0 0V Change0 0 0 0 0 0 0 0 0 0 0 0 0 0 0M Change
0 5 5 5 5 -50 100 0 20 -7 12 10 7 -17 20
Net Exports
0 1 -1 0 1 10 6 -3 -5 3 0 1 9 25 5
G + TransW
129 131 137 140 141 142 143 153 175 175 165 150 148 157 173
Govt
Expendit
ure
135 137 143 146 148 156 155 163 182 181 171 157 160 172 187
Income
Tax
61.25 62.75 62.64 64.32 68.64 63.44 67.86 65.09 69.69 71.53 71.5 72.6 76.36 75.67 78.43
INF/For
INF
0.6 0.83 0.9 1.23 1.1 1.28 -0.25 -0.5 -0.33 0.53 1.53 0.99 0.59 -0.01 -0.25
53
A strong and strengthening British economy Team2 RBE Report -HM Treasury
APPENDIX
III THE BASIC GRAPHS DEPICTING
RELATIONSHIPS OF KEY ECONOMIC VARIANTS
54
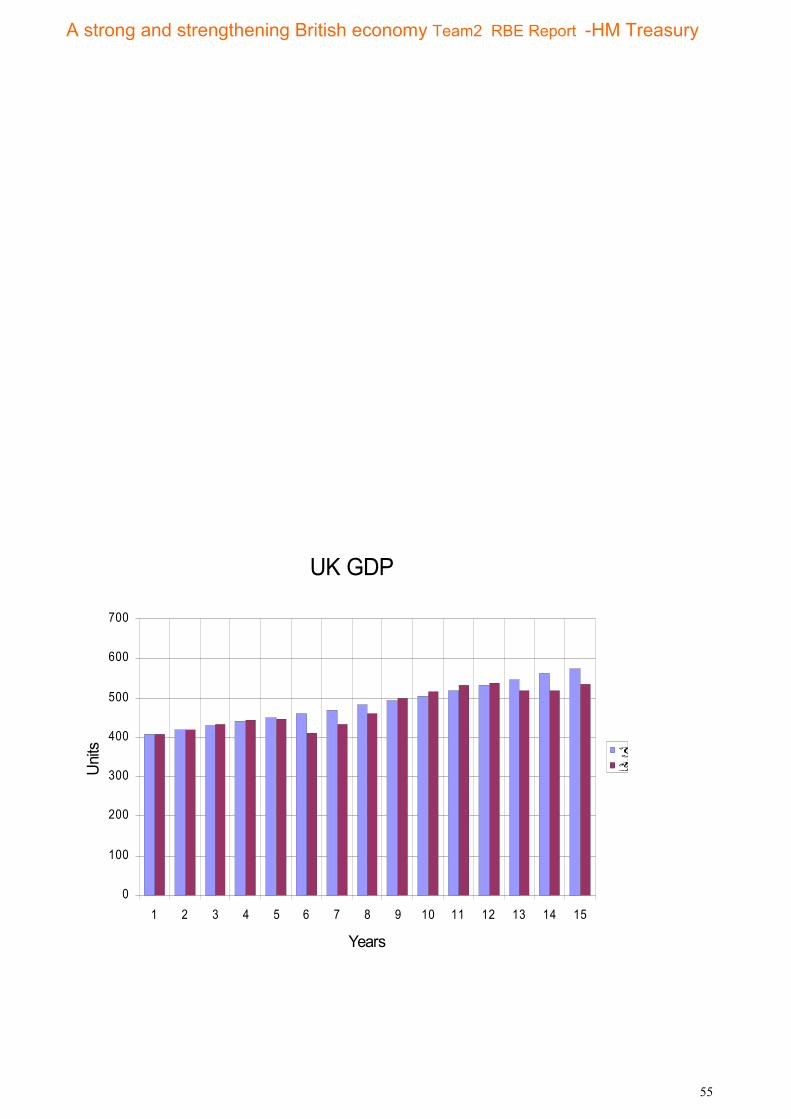
A strong and strengthening British economy Team2 RBE Report -HM Treasury
UK GDP
0
100
200
300
400
500
600
700
1 2 3 4 5 6 7 8 9 10 11 12 13 14 15
Years
Uni
ts QY
55

A strong and strengthening British economy Team2 RBE Report -HM Treasury
(a)4> Unemployment Vs Inflation
Unemployment Vs Inflation
-4
-2
0
2
4
6
8
10
12
14
Years
%age
U%INF%
U% 6 5.9 5.6 5.5 6.5 12.5 10.5 8.5 5.4 4.8 4.5 5.6 9.2 10.6 10.2
INF% 2.4 3.3 3.6 4.9 4.4 5.1 -1 -2 -1.3 2.1 6.1 7.9 4.7 -0.1 -2
1 2 3 4 5 6 7 8 9 10 11 12 13 14 15
56
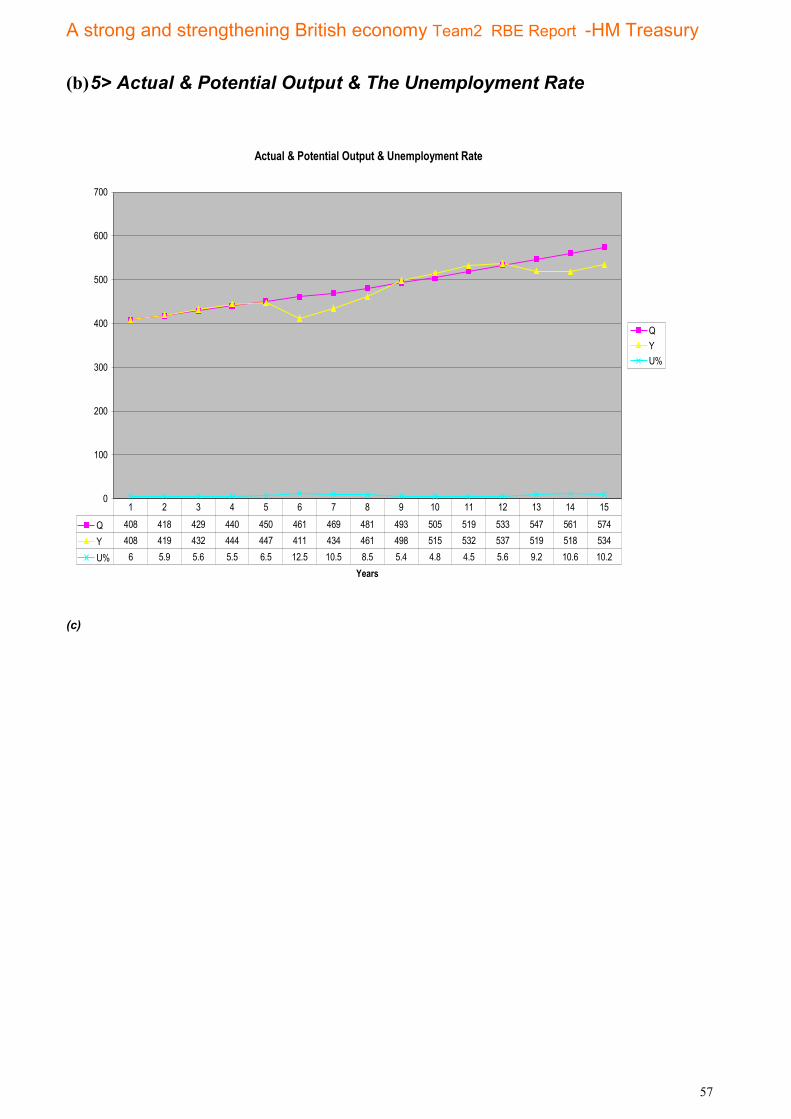
A strong and strengthening British economy Team2 RBE Report -HM Treasury
(b)5> Actual & Potential Output & The Unemployment Rate
Actual & Potential Output & Unemployment Rate
0
100
200
300
400
500
600
700
Years
QYU%
Q 408 418 429 440 450 461 469 481 493 505 519 533 547 561 574
Y 408 419 432 444 447 411 434 461 498 515 532 537 519 518 534
U% 6 5.9 5.6 5.5 6.5 12.5 10.5 8.5 5.4 4.8 4.5 5.6 9.2 10.6 10.2
1 2 3 4 5 6 7 8 9 10 11 12 13 14 15
(c)
57
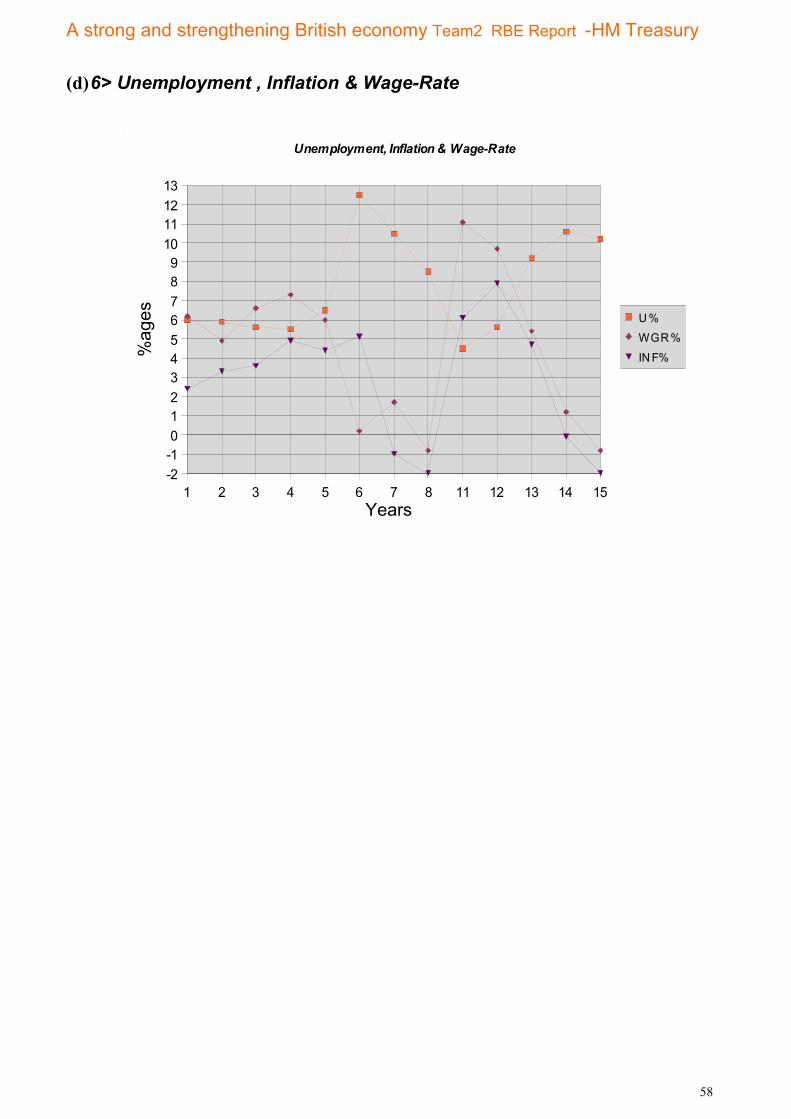
A strong and strengthening British economy Team2 RBE Report -HM Treasury
(d)6> Unemployment , Inflation & Wage-Rate
58
1 2 3 4 5 6 7 8 11 12 13 14 15-2-10123456789
10111213
Unemployment, Inflation & Wage-Rate
U %
WGR %
IN F%
Years
%ag
es

A strong and strengthening British economy Team2 RBE Report -HM Treasury
7> Government Budget
59
1 2 3 4 5 6 7 8 11 12 13 14 15
0
25
50
75
100
125
150
175
200
Government Expenditure (Stacked)
TransWTrans U
G
Y ears
Am
ount
in b
ilions
1 2 3 4 5 6 7 8 11 12 13 14 150
50
100
150
200
250
300
350
400
450
500
Government Expenditure
GG + TransWGov t Expenditure
Years
Am
t in
bilio
ns
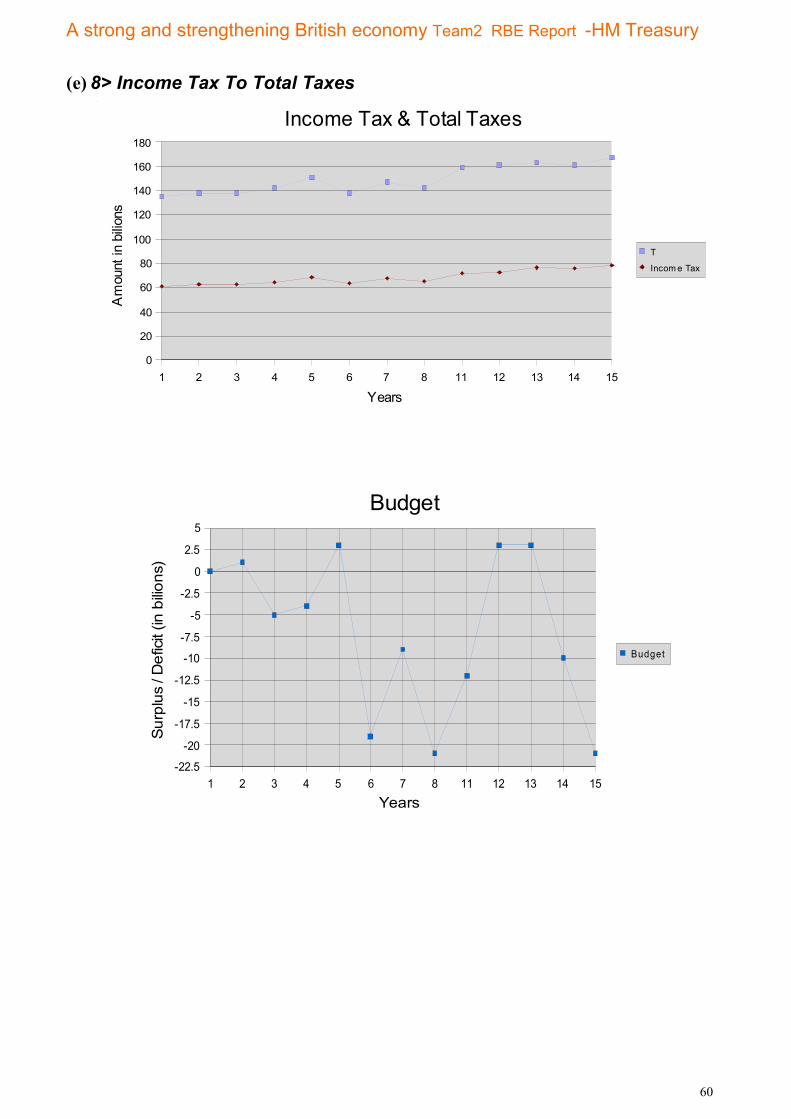
A strong and strengthening British economy Team2 RBE Report -HM Treasury
(e) 8> Income Tax To Total Taxes
60
1 2 3 4 5 6 7 8 11 12 13 14 150
20
40
60
80
100
120
140
160
180
Income Tax & Total Taxes
T
Incom e Tax
Years
Am
ount
in b
ilions
1 2 3 4 5 6 7 8 11 12 13 14 15-22.5
-20
-17.5
-15
-12.5
-10
-7.5
-5
-2.5
0
2.5
5
Budget
Budget
Years
Sur
plus
/ D
efic
it (in
bilio
ns)
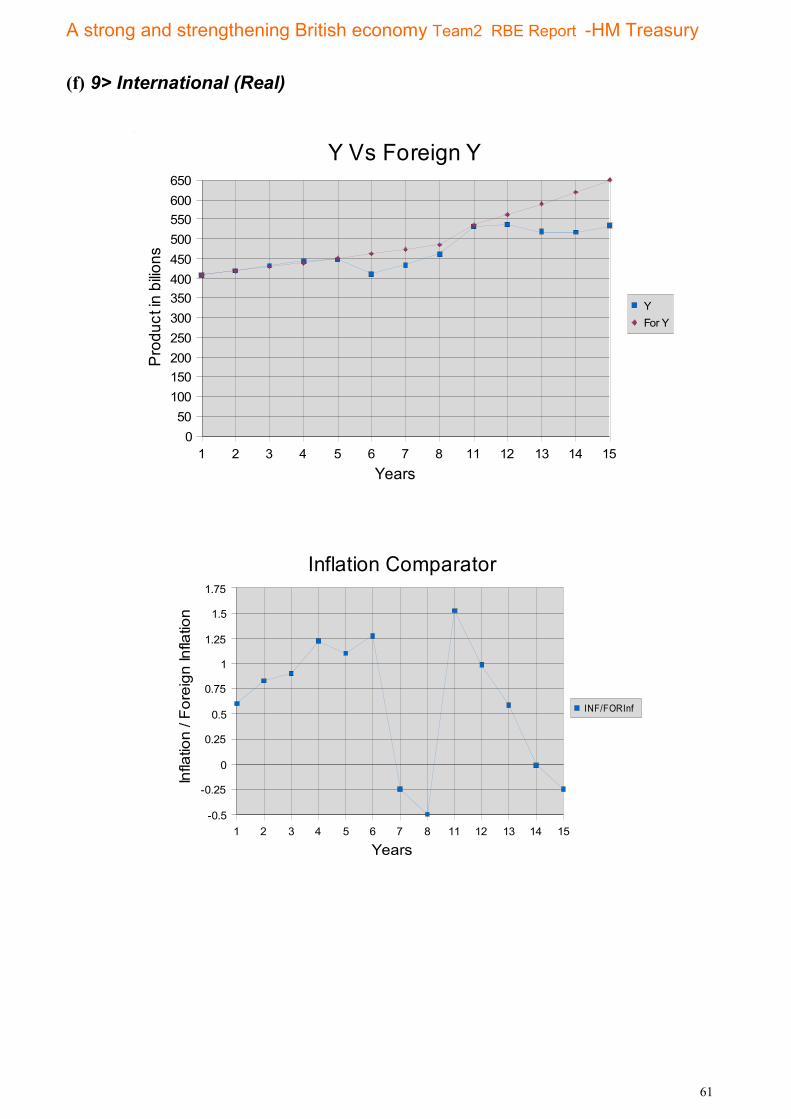
A strong and strengthening British economy Team2 RBE Report -HM Treasury
(f) 9> International (Real)
61
1 2 3 4 5 6 7 8 11 12 13 14 150
50100150200250300350400450500550600650
Y Vs Foreign Y
YFor Y
Years
Pro
duct
in b
ilions
1 2 3 4 5 6 7 8 11 12 13 14 15-0.5
-0.25
0
0.25
0.5
0.75
1
1.25
1.5
1.75
Inflation Comparator
INF/FORInf
Years
Infla
tion
/ For
eign
Infla
tion

A strong and strengthening British economy Team2 RBE Report -HM Treasury
62
1 2 3 4 5 6 7 8 11 12 13 14 15-2.5
0
2.5
5
7.5
10
12.5
15
17.5
20
22.5
25
BALANCE OF TRADE
Bal Trade
Years
1 2 3 4 5 6 7 8 11 12 13 14 150
20
40
60
80
100
120
140
160
180
Imports / Exports
X
Z
Years
Am
ount
in b
ilions

A strong and strengthening British economy Team2 RBE Report -HM Treasury
(g)10> International Finance
63
1 2 3 4 5 6 7 8 11 12 13 14 15-10
-7.5
-5
-2.5
0
2.5
5
7.5
10
Capital Flows
Cap Flows
Years
Am
ount
in b
ilions
1 2 3 4 5 6 7 8 11 12 13 14 150
2.5
5
7.5
10
12.5
15
17.5
20
Rates of Interest
Nom R%
For R%
Years
Rat
e of
inte
rest
A strong and strengthening British economy Team2 RBE Report -HM Treasury
64
1 2 3 4 5 6 7 8 11 12 13 14 15-2.5
0
2.5
5
7.5
10
12.5
15
17.5
20
22.5
25
27.5
Exchange Rate Fluctuations in %ages
Exge Rate
Years
%ag
e
1 2 3 4 5 6 7 8 11 12 13 14 150
2.55
7.510
12.515
17.520
22.525
27.530
32.535
Balance of Payments
BP
Years
Amou
nt in
bilio
ns
A strong and strengthening British economy Team2 RBE Report -HM Treasury
(h)11> Inflation
Inflation
-4
-2
0
2
4
6
8
10
1 2 3 4 5 6 7 8 9 10 11 12 13 14 15
Years
UK an
d Fore
ign In
flatio
n Rate
s
INF%For INF%
65
A strong and strengthening British economy Team2 RBE Report -HM Treasury
(i) 12> Taxes
Taxes
0
20
40
60
80
100
120
140
160
180
1 2 3 4 5 6 7 8 9 10 11 12 13 14 15
Years
Uni
ts (
in b
illio
ns p
ound
s)
T
66

A strong and strengthening British economy Team2 RBE Report -HM Treasury
(j) 13> Policy Tracker
Policy Tracker
-60
-40
-20
0
20
40
60
80
100
120
Years
% a
ge c
hang
e
G ChangeT ChangeV ChangeM Change
G Change 0 2 5 2 0 0 0 10 20 -1 -10 -15 -22 10 20
T Change 0 0 -1 0 2 0 0 -3 0 0 -1 0 1 0 0
V Change 0 0 0 0 0 0 0 0 0 0 0 0 0 0 0
M Change 0 5 5 5 5 -50 100 0 20 -7 12 10 7 -17 20
1 2 3 4 5 6 7 8 9 10 11 12 13 14 15
67

A strong and strengthening British economy Team2 RBE Report -HM Treasury
(k)14> Welfare
Welfare
0
100
200
300
400
500
600
Years
Welf
are
Scor
e
Welfare 431 438 431 438 442 201 348 353 400 450 500 510 472 432 410
1 2 3 4 5 6 7 8 9 10 11 12 13 14 15
68

A strong and strengthening British economy Team2 RBE Report -HM Treasury
(l) 15> Money In Circulation
Money in Circulation
0
20
40
60
80
100
120
Years
Poun
ds in
billi
ons
M 61 64 68 71 75 37 75 75 90 83 93 103 110 91 109
1 2 3 4 5 6 7 8 9 10 11 12 13 14 15
69

A strong and strengthening British economy Team2 RBE Report -HM Treasury
(m)16> Net Exports
Net Exports
-10
-5
0
5
10
15
20
25
30
Years
Uni
ts o
f Net
Exp
orts
Net Exports 0 1 -1 0 1 10 6 -3 -5 3 0 1 9 25 5
1 2 3 4 5 6 7 8 9 10 11 12 13 14 15
70
A strong and strengthening British economy Team2 RBE Report -HM Treasury
APPENDIX
IV EXOGENOUS SHOCKS
71
A strong and strengthening British economy Team2 RBE Report -HM Treasury
1> Exogenous Shocks
Year 6
i. BRUSSELS CLAMPS DOWN ON DUMPING BUT INFLATION AT RISK The threat of heavy fines has finally put an end to world wide dumping practices. However, this means that Britain's import bill will soar, as the prices of imported
goods increase to reflect real costs in exporting countries. The CSO estimates that this will cause the inflation rate to be 5 percentage points higher this year
than it otherwise would have been.
ii. CONFIDENCE IN POUND THREATENED A consortium of Japanese fund managers, fearful that the government might enact a drastic deflationary policy, is withdrawing £20 billion from the London
money market and diverting these funds to New York. While City economists point out that total capital outflows may not be precisely £20 billion because of
domestic and foreign interest rate differentials, the City is gearing itself for a large capital outflow this year.
Year 7
iii. EXCHANGE RATE POLICY ATTACKED There were angry exchanges in the Commons today as the Opposition accused the Chancellor of letting the pound slide. Last year's devaluation will cause an
increase in the inflation rate, claimed the Leader of the Opposition. The Chancellor replied that he expected the devaluation to greatly assist exporters, while
imported goods would become less attractive to domestic consumers.
Year 8
iv. AT THE MERCY OF THE EXCHANGE RATE! While this Newspaper has been a stern critic of past government policies, we have considerable sympathy for the Chancellor as he attempts to enact stabilization
policies in light of rapidly changing international factors. The substantial devaluation and revaluation of the pound experienced in the past two years, and
subsequent lagged impacts on exports and imports, makes economic policy making a hazardous occupation. Such sympathy does not imply that we shall not
be critically examining the policy measures chosen by the Chancellor.
Year 9
v. INVESTMENT PLANS SLASHED The latest CBI survey reveals that, because of uncertainty in international markets, many companies are cutting back on their investment plans. The CBI
estimates that investment plans totaling £10 billion have been temporarily shelved. Our Business Editor points out that investment expenditure will not
necessarily be £10 billion less than last year's, because the interest rate and other factors affecting investment decisions may not be the same as they were last
year.
Year 10
vi. TAX STRUCTURE REVIEWED
It was announced from Downing Street today that the whole basis of taxation has been reviewed by the Think Tank; the conclusion reached, with which the
Cabinet is fully in accord, is that the optimal tax rate from the viewpoint of work effort and long term budgetary balance is 22%. The Chancellor confirmed in a
long statement that Tax Rate will be set at 22% next Year, i.e. in Year 11.
72

A strong and strengthening British economy Team2 RBE Report -HM Treasury
vii. OUTLOOK STILL BLEAK Today's publication of the latest CBI survey reveals no signs of optimism on the part of the business community; the £10 billion of shelved investment projects
will remain on the shelf this year.
Year 11
viii. WORLDWIDE BOOM WELL UNDER WAY / BOOST TO BUSINESS CONFIDENCE
The recent increases in government expenditures and money supplies in the major capitalist economies have caused rapid economic growth. Foreign Y is
predicted to grow by 5% this year. Industry leaders spoke about the optimistic climate prevailing in the business community as witnessed by the restarting of the
£10 billion shelved investment projects.
ix. TAX SYSTEM CHANGED The Tax Rate was officially set at 22% today, as planned last year. Our Westminster correspondent points out that this now restricts policy options to only G,
Vat Rate and M.
Year 12
x. EXPANSION FUELS WORLD WIDE INFLATION The expansionary policies of the Big Seven over the past year have led to the lowest unemployment rates for many years. The Prime Minister's personal
Economic Adviser stated on TV last night that this will lead to worldwide inflationary pressures, and predicted that Foreign INF will rise to 8% this year.
xi. CHANCELLOR HOLDS TAX RATE AT 22% In the face of Opposition catcalls in the Commons today, the Chancellor argued that the success of the 22% Tax Rate policy cannot be judged on the basis of
one year's experience, and that the 22% rate will prevail this year. He claimed that he was quite happy to run the economy using only government expenditure,
VAT Rate and money supply.
Year 13
xii. NHS COSTS ESCALATE/MORE HELP FOR THE NEEDY
A statement from Downing Street today revealed that the Cabinet has agreed that allowances to the old, the sick and the disabled will be substantially increased
this year. The statement continued that these increases were necessary because of mounting medical costs caused by a non-accountable national health
service. Treasury sources predict that the cost to the exchequer will be an additional £15 billion (TransW).
xiii. TAX RATE TO CHANGE? The Chancellor's statement to the Commons that he now reserved the right to alter the 22% Tax Rate came as no surprise, given the increases announced
earlier today in welfare payments. The Chancellor refused to respond to Opposition derision which centered on his inflexibility last year.
Year 14
73

A strong and strengthening British economy Team2 RBE Report -HM Treasury
xiv. FOOD SCARE
The Prime Minister announced in Parliament today that empirical data from carefully controlled diet programmes show that many imported foods containing
steroids and certain preservatives are injurious to health. Accordingly, there will be a ban from midnight on the import of a wide range of foods and beverages.
The Board of Trade estimates that the value of the banned imports will be £15 billion.
Our economics correspondent points out that this will have an impact on the country's import bill; the final import bill, however, will also be affected by the
change in last year's exchange rate, last year's domestic versus foreign inflation rate, and this year's growth in domestic demand.
Year 15
xv. FOOD SCARE CONTINUES
The Department of Health has decided to prolong the ban on suspect food and drink imports.
xvi. GALLUP POLL SHOCK / POOR PROSPECTS FOR GOVERNMENT The latest Gallup Poll shows that the Opposition has a lead of 11% over the government. Supplementary questions revealed that this was primarily due to the
poor performance of the economy. LadBooks, a leading bookmaker, announced today that the odds on this government remaining in power are 8-1 against!
16> Closing Note
This report is a collaborative effort of the 3 team members of the LEM team. Thus, there may appear
differences in writing styles , the result of different pieces of the action , contributed by different actors in this drama.
74