running head: time spent preparing for class 1cpr.indiana.edu/uploads/time spent_paper...
TRANSCRIPT

Running head: TIME SPENT PREPARING FOR CLASS 1
Undergraduates in the Professional Fields: Exploring the Impact of Institutional Characteristics on Time
Spent Preparing for Class
Amy K. Ribera, Louis M. Rocconi, and Alexander C. McCormick
Indiana University Bloomington
Center for Postsecondary Research
Authors’ Note
Paper presented at the annual meeting of the American Educational Research Association in San Francisco, CA, April 28, 2013. Please direct correspondence concerning this article to Amy Ribera at 1900
East Tenth Street, Suite 419, Bloomington, IN 47406‐7512. Email: [email protected]
Running head: TIME SPENT PREPARING FOR CLASS 2
Abstract
Using data from over 137,000 full‐time seniors enrolled at 543 four‐year colleges and universities in
2011, this study explores the relationship between the amount of time students spent preparing for
class each week and both institutional context and field of study, with a particular focus on five
professional fields (business, education, engineering, nursing, and allied health) relative to arts &
sciences. Controlling for student and institutional characteristics, results indicate both systematic
differences in study time related to field of study and a positive relationship between selectivity,
Carnegie type, and study time. Moderating effects were found between discipline and institutional
selectivity, Carnegie type, and control. Findings promise to inform national and disciplinary discussions
about academic rigor, student effort, and learning outcomes.

Running head: TIME SPENT PREPARING FOR CLASS 3
Undergraduates in the Professional Fields: Exploring the Impact of Institutional Characteristics on
Time Spent Preparing for Class
Colleges and universities are often scrutinized by internal and external stakeholders for alleged
diminishing quality and academic rigor (e.g., Hersh & Merrow, 2005; Rojstaczer & Healy, 2012). As an
indicator of this decline, the national media has recently focused on the amount of time undergraduates
spend studying (de Vise, 2012; Ellis, 2012). The notion that study time corresponds to learning in college
has both intuitive appeal and empirical support, dating to Ralph Tyler’s pioneering assessment work in
the 1930s (Merwin, 1969). More recently, Arum and Roksa (2011) found that the amount of time
devoted to studying was positively related to gains on a test of college students’ analytical reasoning
and problem solving. According to the 2012 National Survey of Student Engagement (NSSE) (2012), first‐
year students who reported most of their grades to be A or A‐ averaged about four more hours per
week on class preparation that did those with grades of C+ or lower. Those earning Bs were almost
exactly in the middle. A similar pattern held for seniors, but the groups with high and low grades were
separated by only 2.3 hours in study time.
Recent evidence suggests that college students are indeed studying less than they once did. In
an analysis of survey results spanning four decades, Babcock and Marks (2011) concluded that after
adjusting for differences between surveys, the average full‐time college student studied about ten more
hours per week in 1961 than in 2003. Interestingly, technological change does not appear to account for
these changes, because most of the decline occurred between 1961 and 1981, well before the advent
and widespread adoption of technologies that have revolutionized certain aspects of academic work
(e.g., personal computers and Internet‐based research tools) (McCormick, 2011). Results from NSSE
indicate that contrary to the conventional wisdom that students should plan to study two hours for each
hour of class, the actual ratio is closer to parity (NSSE, 2012).

Running head: TIME SPENT PREPARING FOR CLASS 4
Although these studies open the discussion about declining student effort and academic
standards, they do not take full account of the growing complexity of American higher education. In
other words, the decrease in study time may be partly due to the expansion of higher education since
World War II (Altbach, 2011). The ‘massification’ of higher education has led to more diverse
institutions, academic programs, and students (Lucas, 1994). College and universities are enrolling more
students from socially diverse backgrounds with regard to race/ethnicity, gender, age, and
socioeconomic status (McCormick, 2011). Many of these students have competing demands on their
time, such as work and family obligations, which may leave them with less discretionary time to devote
to schoolwork (Plant, Anders Ericsson, Hill, & Asberg, 2005). More college students are working for pay
than in previous decades, and the average number of hours worked by full‐time students has also
increased (McCormick, 2011).
An important part of the study‐time puzzle involves students’ major field of study. Recent
decades have seen dramatic changes in the mix of college majors, characterized by a shift of students
away from the traditional arts and sciences to what Brint, Riddle, Turk‐Bicakci, and Levy (2005) call the
“practical arts”. Recent NSSE findings have documented substantial variability by college major in the
average amount of time full‐time seniors spend preparing for class, with students majoring in
professional fields represented at both extremes: in 2011, full‐time engineering majors averaged about
19 hours per week on class preparation, while business majors on average spent only 14 hours per week
preparing for class (NSSE, 2011). Examined another way, about two‐thirds of engineering majors
reported spending more than 20 hours per week preparing for class, compared with only one‐fifth of
business majors (NSSE, 2011). In their analysis of declines in study time over four decades, Babcock and
Marks (2011) investigated the role of compositional changes in the student body. While demographic
changes accounted for a very small portion of the change, adding major and number of hours worked
substantially increased the share of the decline in study time that is attributable to compositional

Running head: TIME SPENT PREPARING FOR CLASS 5
changes (to about 18 percent). In their analysis of gains in analytical reasoning and problem‐solving skills
during the first two years of college, Arum and Roska (2011) found that smallest gains were among
students in professional fields such as business, education and social work. Finally, in Brint, Cantwell,
and Saxena’s (2012) analysis of study time, they found the lowest study times by humanities and social
science majors and the highest study times for science and engineering majors. However, their analysis
did not include professional fields other than engineering.
In light of the growth of the practical arts and Arum and Roksa’s findings of diminished learning
gains among students majoring in certain professional fields, it is important to better understand how
one element of learning—study time—varies among professional fields and the arts and sciences, and
how much these differences may reflect differences among both students and institutions. (In this
paper, “professional” refers broadly to undergraduate majors with a direct occupational connection,
without regard to formal certification or control of entry into a profession.)
Interestingly, students with greater non‐academic obligations (e.g., working, caring for
dependents, commuting) tend to gravitate towards certain majors. According to NSSE (2011), business
majors reported spending an average of 27 hours per week on non‐academic obligations, contrasted
with about 16 hours per week for engineering majors. What is less clear from these aggregate findings
is the influence of the institutional context on students’ time spent preparing for class. Previous studies
have shown selectivity, control, and Carnegie classification are related to students’ academic and social
behaviors (McCormick, Pike, Kuh, & Chen, 2009; Porter, 2006; Titus, 2004; Toutkoushian & Smart, 2001).
Colleges and universities also differ in the mix of majors available. In view of the fact that some of the
most popular and fastest growing college majors today are in the professional fields (Crosby, O., &
Moncarz, R., 2006; NCES, 2011), it is important to examine how institutional context may moderate the
relationship between major and study time.

Running head: TIME SPENT PREPARING FOR CLASS 6
Purpose and Research Questions
This study seeks to identify factors that contribute to how students allocate their time to inform
the conversation about quality, rigor, and student effort. Controlling for student background
characteristics, nondiscretionary time (that is, time devoted to work, family obligations, and commuting
to campus), and college grades, this study investigates the amount of time that full‐time college seniors
spend preparing for class in five professional fields of study (business, education, engineering, allied
health, and nursing) and in the arts and sciences majors. We also investigate the direct and moderating
effect of institutional characteristics (e.g., selectivity, control, Carnegie classification) on time spent
preparing for class. This study seeks to answer the following research questions:
1. What are the effects of majoring in one of these professional fields, as opposed to the arts and
sciences, on time spent studying among full‐time senior students?
2. What are the effects of institutional characteristics (e.g., selectivity, control, Carnegie
classification) on time spent studying among full‐time senior students?
3. Do institutional characteristics (e.g., selectivity, control, Carnegie classification) moderate the
relationship between discipline and time spent studying among full‐time senior students?
Findings from this study will help advance our understanding of institutional quality and academic rigor
as well as the intersection of professional fields of study and institutional characteristics with study time.
Methods
Sample
The sample for this study was drawn from the 2011 administration of the National Survey of
Student Engagement (NSSE). It includes 137,258 full‐time seniors enrolled at 543 four‐year institutions
who had complete data on the variables described below. Table 1 shows approximately 63% of the
sample were female and 24% were of non‐traditional age (i.e., 24 years or older). About 5% of students
were allied health majors, 5% nursing majors, 8% engineering majors, 10% education majors, 19%

Running head: TIME SPENT PREPARING FOR CLASS 7
business majors, and 53% arts and science majors. The racial‐ethnic makeup of the sample was as
follows: 75% classified themselves as White, 7% as African‐American/Black, 8% as Asian, 8% as Latino or
Hispanic, with the rest selecting another racial‐ethnic group or multiracial.
Table 1 Student‐level descriptive statistics (n=137,258)
Variable Mean SD Minimum Maximum
Time spent preparing for class 15.54 8.81 0 33Female 0.63 0.48 0 1Non‐traditional age 0.24 0.43 0 1Race/ethnicity Asian/Asian‐American 0.08 0.28 0 1 Black/African American 0.07 0.25 0 1 Latino/Hispanic 0.08 0.27 0 1 Other race/ethnicity 0.02 0.15 0 1 White 0.75 0.44 0 1Self‐reported college grades Mostly A’s 0.49 0.50 0 1 Mostly B’s 0.46 0.50 0 1 Mostly C’s or lower 0.05 0.22 0 1Nondiscretionary time 22.03 17.80 0 132Major field Arts and sciences 0.53 0.50 0 1 Allied health 0.05 0.21 0 1 Nursing 0.05 0.21 0 1 Business 0.19 0.40 0 1 Education 0.10 0.30 0 1 Engineering 0.08 0.28 0 1
With regard to the institutions represented, Table 2 displays about 16% of institutions were
classified as research universities, 5% doctoral universities, 28% master’s large institutions, 17% smaller
master’s institutions, 17% baccalaureate arts and sciences institutions, and 16% baccalaureate diverse
institutions. About half (49%) of the institutions were classified as competitive in admissions, with the
remainder distributed among noncompetitive (16%), very competitive (22%), and highly/most
competitive (13%). About three out of five institutions in the sample were private institutions. As
expected, there was considerable variation among institutions with respect to the concentration of
students in the various major‐field groups.

Running head: TIME SPENT PREPARING FOR CLASS 8
Variables
The dependent variable was student‐reported time spent preparing for class. The survey asked
students to indicate how many hours in a typical seven‐day week they spend “preparing for class (e.g.,
studying, reading, writing, doing homework or lab work, analyzing data, rehearsing, and other academic
activities).” The response options were 0, 1‐5, 6‐10, 11‐15, 16‐20, 21‐25, 26‐30, and more than 30 hours
per week. We recoded each response to the interval’s midpoint, with a value of 33 assigned for the last
option. The average time spent preparing for class for senior students in our sample was 15.5 hours with
a standard deviation of 8.8 hours.
Student‐level control variables included non‐traditional age (i.e., 24 years or older), gender (with
males as the reference group), race/ethnicity (with White as the reference group), self‐reported grades,
a measure of nondiscretionary time commitment, and student’s academic major. Students were asked
Table 2 Institution‐level descriptive statistics (n=543)
Variable Mean SD Minimum Maximum
Selectivity Noncompetitive 0.16 0.36 0 1 Competitive 0.49 0.50 0 1 Very competitive 0.22 0.41 0 1 Highly or most competitive 0.13 0.34 0 1Carnegie type Research universities 0.16 0.37 0 1 Doctoral universities 0.05 0.23 0 1 Master’s large 0.28 0.45 0 1 Master’s medium and small 0.17 0.38 0 1 Baccalaureate arts and science 0.17 0.38 0 1 Baccalaureate diverse 0.16 0.37 0 1Private control 0.57 0.50 0 1Proportion of major field Arts and sciences 53.55 19.41 4.55 100.00 Allied health 3.87 5.47 0.00 47.37 Nursing 5.97 9.18 0.00 54.90 Business 18.78 11.63 0.00 75.78 Education 12.28 10.89 0.00 60.00 Engineering 5.57 12.62 0.00 90.72

Running head: TIME SPENT PREPARING FOR CLASS 9
to report what most of their grades had been at their current institution. Grade categories were
collapsed into mostly A’s, mostly B’s and C’s or below (reference group). Nondiscretionary time was
derived from four items on the survey asking how many hours in a typical seven‐day week are spent
working for pay on or off campus, caring for dependents, and commuting to class. Response categories
were the same as for class preparation and recoded in the same way, then summed.
Students were classified into one of six broad disciplinary categories based on their reported
major: (1) allied health, (2) business, (3) education, (4) engineering, (5) nursing, and (6) arts and
sciences. Five of the disciplines were from the professional fields (allied health, business, education,
engineering, and nursing) with students majoring in the arts and sciences serving as the reference
group. Appendix A outlines the specific majors that are represented by each broad category. As shown
in Table 3, the average time spent preparing for classed varied by major category. Mean study time
ranged from 13.5 hours per week in business to about 19 hours per week in engineering. Majors in the
arts & sciences averaged 15.6 hours per week of study time.
Table 3 Average time spent preparing for class among full‐time seniors by major field
# of students Mean SD Minimum Maximum
Arts and sciences 72,512 15.63 8.75 0 33Allied health 6,387 15.46 8.62 0 33Nursing 6,360 18.10 9.41 0 33Business 26,619 13.46 8.10 0 33Education 13,889 15.15 8.59 0 33Engineering 11,491 18.95 9.32 0 33
The institution‐level variables included institutional control (public or private), selectivity, Basic
Carnegie classification, and the proportion of seniors in each major. Four selectivity tiers were created
based on Barron’s ratings of institutional selectivity: noncompetitive or less competitive, competitive
including competitive+ (reference group), very competitive including very competitive+, and highly or
most competitive. Carnegie classification was collapsed into six groupings: research universities,
doctoral universities, master’s large institutions (reference group), master’s medium and small

Running head: TIME SPENT PREPARING FOR CLASS 10
institutions, baccalaureate arts and sciences institutions, and baccalaureate diverse institutions. Average
time spent preparing for class by institutional characteristic is given in Table 4. Students at highly or
most competitive institutions study on average 17.5 hours per week while students at noncompetitive
and competitive institutions average 14.9 hours per week. With regard to Carnegie type, seniors at
baccalaureate arts and sciences institutions averaged 17.2 hours per week of study time, compared with
14.7‐15.6 hours per week at the other types.
Table 4 Average time spent preparing for class among full‐time seniors by institutional selectivity, Carnegie type, and control
# of institutions Mean SD Minimum Maximum
Selectivity Noncompetitive 85 14.89 1.60 11.44 19.81 Competitive 268 14.87 1.69 8.75 21.75 Very competitive 119 15.88 1.71 12.33 20.61 Highly competitive 71 17.54 2.35 12.56 24.24 Carnegie type Research university 86 15.56 1.29 11.72 19.71 Doctoral university 29 14.86 1.01 11.83 16.44 Master’s large 154 14.74 1.55 8.75 18.62 Master’s medium and small 92 15.25 1.85 9.71 21.75 Baccalaureate arts and science 94 17.20 2.38 10.31 24.24 Baccalaureate diverse 88 15.09 2.13 11.23 21.82 Control Private 307 15.67 2.35 8.75 24.24 Public 236 15.15 1.37 11.54 21.25
Analyses
Given the nested structure of the data (students within institutions), we used the hierarchical
linear modeling approach of Raudenbush and Bryk (2002). Analyses were conducted in three phases
using HLM7 (Raudenbush, Bryk, & Congdon, 2010). First, a fully unconditional model was estimated with
no predictors at either level. The purpose of this model was to decompose the variance in time spent
preparing for class into variance due to differences between institutions and variance due to differences
among students.
Running head: TIME SPENT PREPARING FOR CLASS 11
Next, the unconditional model was expanded to include the student‐level variables. In this
model, individual students’ time spent preparing for class was considered a function of their major plus
the student‐level controls (gender, age, race‐ethnicity, self‐reported grades, and nondiscretionary time).
Given that we were mainly interested in whether the relationship between academic major and time
spent preparing for class significantly varies across institutions, the slopes of the majors were specified
as random in the level‐2 model (i.e., they were allowed to vary across institutions), while the slopes of
the other student‐level variables were fixed across institutions. In this model, student’s major was
centered on their institutional mean in order to examine cross‐level interactions while all other control
variables were centered on their grand mean (Enders & Tofighi, 2007; Hofmann & Gavin, 1998).
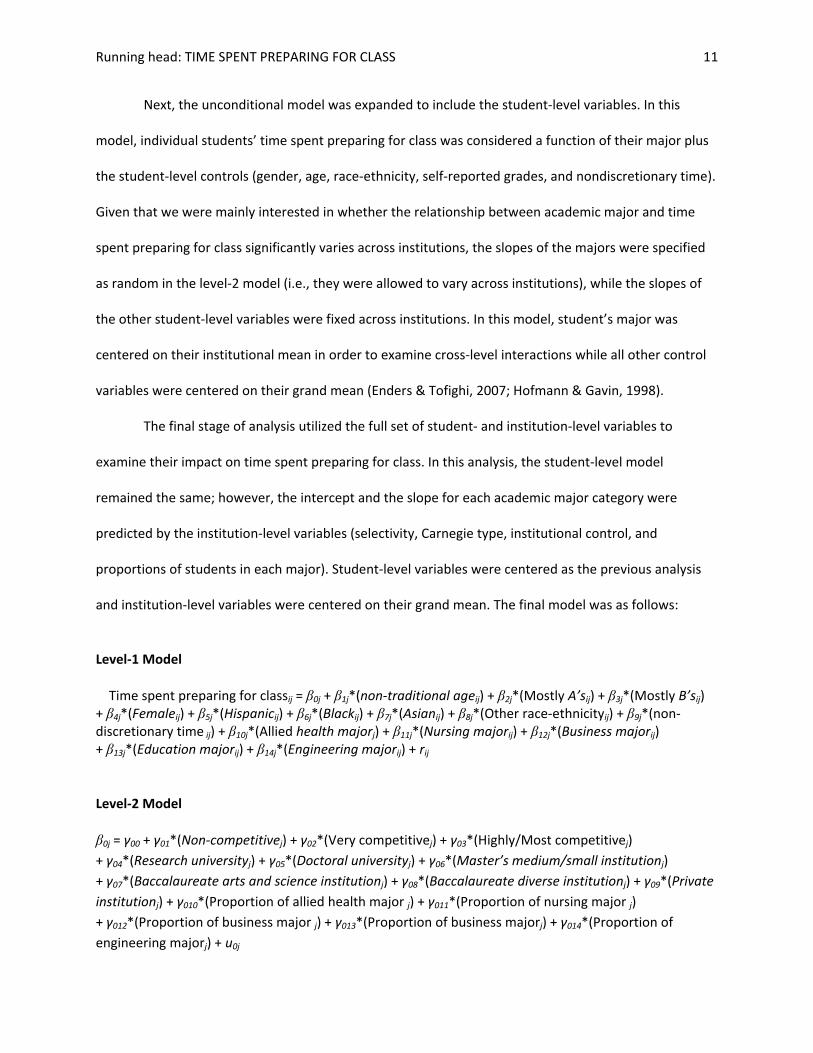
The final stage of analysis utilized the full set of student‐ and institution‐level variables to
examine their impact on time spent preparing for class. In this analysis, the student‐level model
remained the same; however, the intercept and the slope for each academic major category were
predicted by the institution‐level variables (selectivity, Carnegie type, institutional control, and
proportions of students in each major). Student‐level variables were centered as the previous analysis
and institution‐level variables were centered on their grand mean. The final model was as follows:
Level‐1 Model
Time spent preparing for classij = β0j + β1j*(non‐traditional ageij) + β2j*(Mostly A’sij) + β3j*(Mostly B’sij) + β4j*(Femaleij) + β5j*(Hispanicij) + β6j*(Blackij) + β7j*(Asianij) + β8j*(Other race‐ethnicityij) + β9j*(non‐discretionary time ij) + β10j*(Allied health majorj) + β11j*(Nursing majorij) + β12j*(Business majorij) + β13j*(Education majorij) + β14j*(Engineering majorij) + rij
Level‐2 Model
β0j = γ00 + γ01*(Non‐competitivej) + γ02*(Very competitivej) + γ03*(Highly/Most competitivej)
+ γ04*(Research universityj) + γ05*(Doctoral universityj) + γ06*(Master’s medium/small institutionj)
+ γ07*(Baccalaureate arts and science institutionj) + γ08*(Baccalaureate diverse institutionj) + γ09*(Private
institutionj) + γ010*(Proportion of allied health major j) + γ011*(Proportion of nursing major j)
+ γ012*(Proportion of business major j) + γ013*(Proportion of business majorj) + γ014*(Proportion of
engineering majorj) + u0j

Running head: TIME SPENT PREPARING FOR CLASS 12
β1j = γ10
:
β9j = γ90
βSj, where S=10,…,14 = γS0 + γS1*(Non‐competitivej) + γS2*(Very competitivej) + γS3*(Highly/Most competitivej)
+ γS4*(Research universityj) + γS5*(Doctoral universityj) + γS6*(Master’s medium/small
institutionj) + γS7*(Baccalaureate arts and science institutionj) + γS8*(Baccalaureate diverse
institutionj) + γS9*(Private institutionj) + γS10*(Proportion of allied health major j)
+ γS11*(Proportion of nursing major j) + γS12*(Proportion of business major j) + γS13*(Proportion
of business majorj) + γS14*(Proportion of engineering majorj) + uSj
Results
The first phase of the analysis allowed us to partition the variability in students’ time spent
preparing for the class into variability due to differences among students and variability due to
differences between institutions (Table 5). Results indicate that 4.0% of the variability in time spent
preparing for class is due to between‐institution differences. The unconditional model also
demonstrated that the predicted grand mean time spent preparing for class is about 15.5 hours. That is,
full‐time seniors in our sample, across all institutions, tend to spend about 15.5 hours on average
preparing for class. Additionally, students’ average time spent preparing for class was found to
significantly vary across institutions.
Table 5 Estimation of base model of time spent preparing for class
Fixed Effects Coefficient S.E. t‐ratio
Institutional mean time spent preparing for class 15.5 0.08 182***
Random Effects Variance D.F. Chi‐square
Between Institutions 3.125 542 4711*** Within Institutions 75.379
Intra‐class correlation 0.040 ***p<.001
The second phase of the analysis allowed us to answer our first research question: What are the
effects of academic major on time spent preparing for class? Results from the student‐level model
(Table 6) indicated that the addition of the student‐level variables explained 6% of the variance in

Running head: TIME SPENT PREPARING FOR CLASS 13
Table 6 Estimation of time spent preparing for class as a function of student‐characteristics
Fixed Effects Coefficient S.E. t‐ratio
Mean Time Spent Preparing for Class 15.42 0.089 173.72*** Non‐traditional age 1.66 0.083 20.04*** Mostly A’s 3.02 0.123 24.57*** Mostly B’s 1.19 0.113 10.54*** Female 1.16 0.059 19.62*** Hispanic 0.06 0.099 0.66 African‐American/Black ‐0.15 0.108 ‐1.44 Asian 1.28 0.097 13.21*** Other race‐ethnicity 0.56 0.162 3.45*** Non‐discretionary time 0.01 0.002 2.60** Allied Health 0.06 0.153 0.37 Nursing 2.83 0.221 12.82*** Business ‐1.68 0.091 ‐18.43*** Education ‐0.62 0.114 ‐5.44*** Engineering 3.64 0.180 20.21***
Random Effects Variance D.F.1
Chi‐square
Between Institutions 3.75 138 1276*** Allied Health slope 1.99 138 215*** Nursing slope 8.43 138 577*** Business slope 1.34 138 286*** Education slope 1.81 138 226*** Engineering slope 3.28 138 281*** Within Institutions 71.05 **p<.01; ***p<.001 1Chi‐square statistics are based on 138 of 543 institutions that had sufficient data for computation (i.e., institutions that had students in all of the academic major categories).
students’ time spent preparing for class. While this is not a large proportion of explained variance, this
result is not surprising given that other studies (Brint et al, 2012) have also demonstrated that student
background and academic discipline explain relatively little variation in students’ study time. Results
from this model demonstrated that nursing majors spend nearly three more hours per week preparing
for class than arts and sciences majors, and engineering majors spend 3.6 more hours per week
preparing for class than otherwise similar arts and science majors. Education majors spend nearly a half
an hour fewer hours per week preparing for class than arts and sciences majors while business majors
spend about 1.5 fewer hours preparing for class than arts and science majors. No differences were

Running head: TIME SPENT PREPARING FOR CLASS 14
found between arts and sciences majors and allied health majors. Additionally, the slope effects for the
academic major categories were found to vary significantly across institutions, indicating that the “gap”
in study time between professional majors and arts and sciences majors varies across institutions.
The third phase of the analysis (the full model) allowed us to answer our remaining research
questions. Significant parameter estimates from the full model are presented in Table 7. (Full results are
presented in the Appendix.) The addition of the institution‐level variables explained 54.5% of the
variability between institutions in the average time spent preparing for class.
Examining the impact of institutional characteristics on average time spent studying, results
indicate that the mean time spent preparing for class was greater at very competitive and highly or most
competitive institutions than at competitive institutions, differing on average by two‐thirds of an hour
and one and a half hours per week, respectively. In addition, the average time spent preparing for class
was more than one and a half hours higher at baccalaureate arts and sciences institutions and about half
an hour higher at master’s medium/small institutions and baccalaureate diverse institutions compared
to master’s large institutions; no differences in average study time were found between the other types
and master’s large institutions, nor between public and private institutions. Average study time was
lower at institutions with larger proportions of business and education major and higher at institutions
with larger proportions of engineering majors.
In order to examine the third research question, whether institutional characteristics moderate
the effect of discipline on study time, we allowed institutional characteristics to predict differences in
study time between each group of professional majors and arts and sciences. Compared to otherwise
similar arts and sciences majors, those studying nursing averaged nearly three more hours per week
preparing for class. However, this gap narrowed considerably at highly selective institutions—reflecting
increased study time by arts & sciences majors at those institutions and slight decrease for nursing

Running head: TIME SPENT PREPARING FOR CLASS 15
Table 7 Significant Fixed Effects from the Full Model of Time Spent Preparing for Class
Fixed Effects Coefficient S.E. t‐ratio
Intercept (Mean Time Spent Preparing for Class) 15.43 0.065 236.72*** Student‐level Model for Time Spent Preparing for Class Non‐traditional age 1.70 0.082 20.80*** Mostly A’s 3.05 0.122 25.02*** Mostly B’s 1.21 0.112 10.77*** Female 1.18 0.059 19.83*** Asian 1.26 0.098 12.89*** Other race‐ethnicity 0.55 0.163 3.36*** Non‐discretionary time 0.01 0.002 3.31*** Model for Institutional Mean Time Spent Preparing for Class Very Competitive 0.67 0.166 4.03*** Highly or Most competitive 1.60 0.280 5.72*** Master’s Medium and Small 0.40 0.204 1.97* Baccalaureate Arts and Sciences 1.62 0.288 5.64*** Baccalaureate Diverse 0.59 0.228 2.60* Average: Business ‐0.05 0.008 ‐6.80*** Average: Education ‐0.02 0.008 ‐2.15* Average: Engineering 0.03 0.008 3.27** Model for Allied Health Slope Intercept (Mean Allied Health Slope) 0.03 0.240 0.14 Doctoral Universities 1.22 0.608 2.01* Average: Allied Health 0.07 0.027 2.45* Model for Nursing Slope Intercept (Mean Nursing Slope) 2.78 0.332 8.39*** Highly or Most competitive ‐2.53 0.989 ‐2.56* Research Universities ‐1.80 0.703 ‐2.56* Model for Business Slope Intercept (Mean Business Slope) ‐1.83 0.101 ‐18.10*** Baccalaureate Arts and Sciences ‐0.72 0.353 ‐2.05* Baccalaureate Diverse ‐0.93 0.358 ‐2.60* Private ‐0.45 0.226 ‐1.99* Model for Education Slope Intercept (Mean Education Slope) ‐0.71 0.133 ‐5.37*** Private ‐0.69 0.286 ‐2.42* Average: Engineering ‐0.04 0.018 ‐2.07* Model for Engineering Slope Intercept (Mean Engineering Slope) 3.27 0.332 9.85*** Baccalaureate Arts and Sciences ‐2.29 1.095 ‐2.09* Private ‐0.93 0.442 ‐2.12* Average: Engineering ‐0.03 0.014 ‐2.02* *p<.05; **p<.01; ***p<.001

Running head: TIME SPENT PREPARING FOR CLASS 16
majors (Figure 1). The gap in study time between nursing and arts and science majors was also reduced
at research universities compared with master’s large institutions. Those studying engineering averaged
3.6 more hours per week preparing for class than arts and science majors, but this gap narrowed
considerably at baccalaureate arts and science institutions compared with master’s large institutions
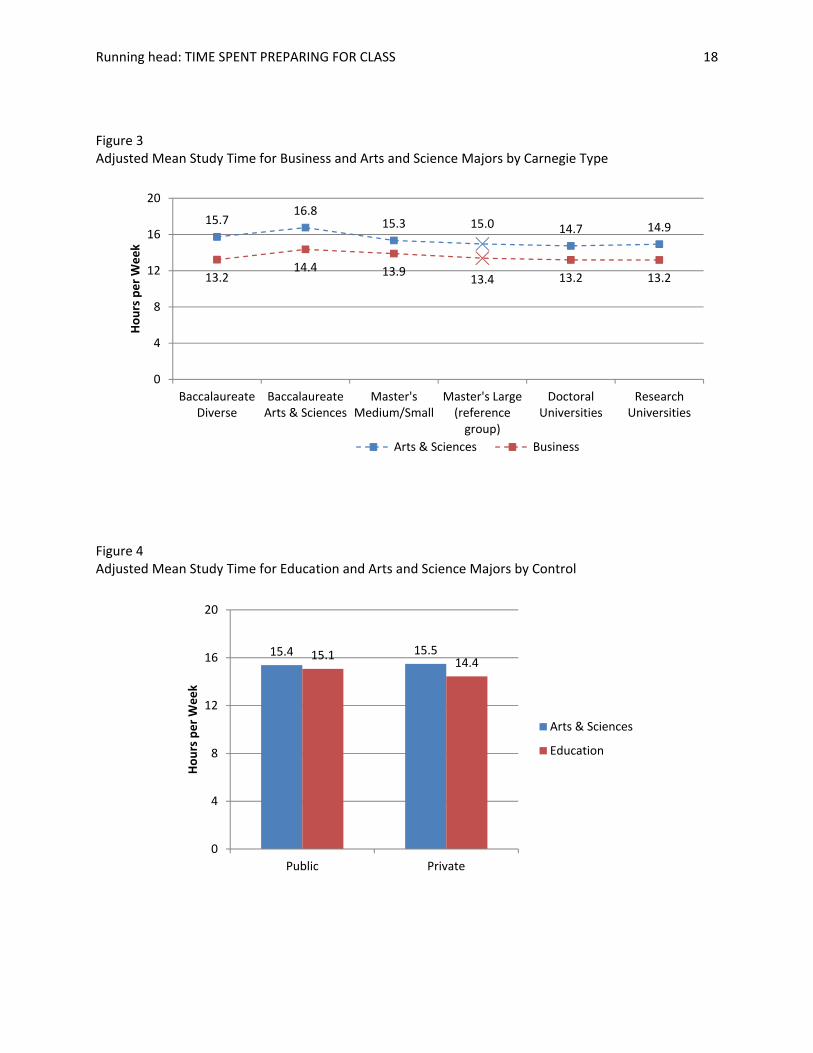
(Figure 2), and narrowed by nearly an hour at private institutions. Business majors and education
majors, by contrast, studied less than their arts and science major counterparts. Business students
averaged nearly two hours less study time per week and education majors averaged nearly an hour less
than similar arts and sciences majors. For business majors, this gap increased at both types of
baccalaureate institutions compared with master’s large institutions (Figure 3) and also at private
institutions. For education majors, the gap in study time increased at private institutions (Figure 4) and
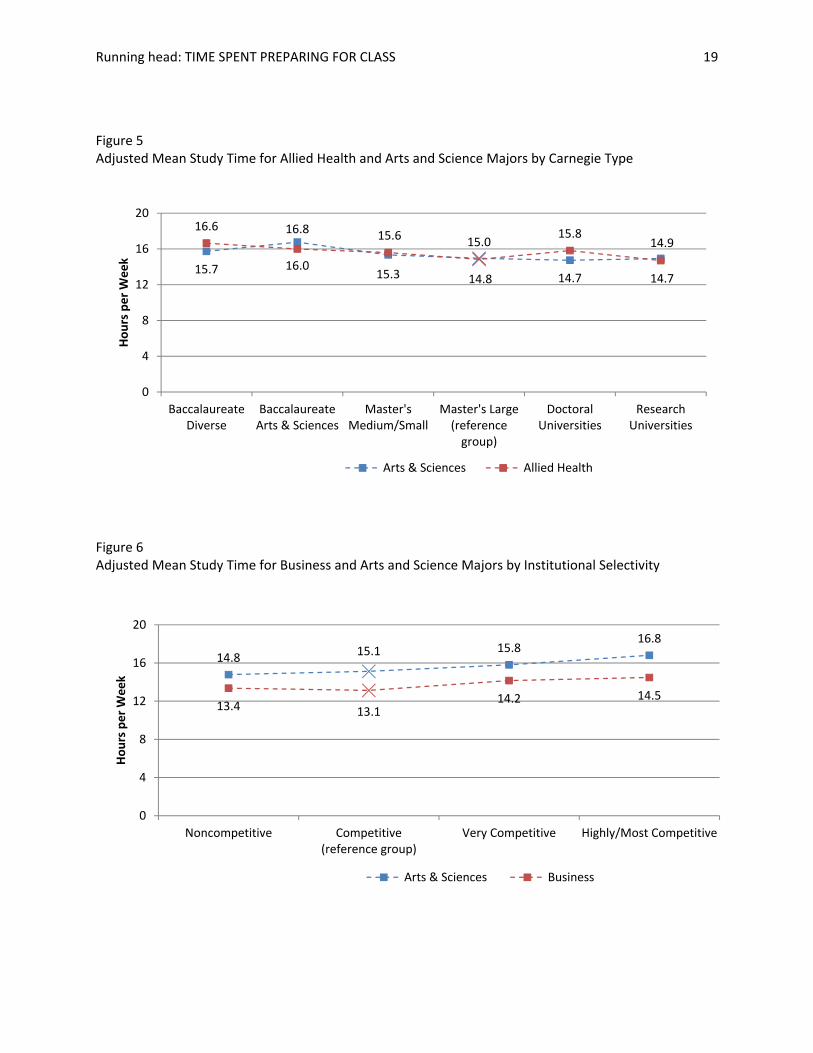
at institutions with higher proportions of engineering students. Using master’s large universities as a
baseline, study time was comparable between allied health and arts and science majors at other
Carnegie types, with one exception. At doctoral universities, allied health majors studied just over an
hour more than arts & science majors (Figure 5).
With regard to the student‐level variables, nontraditional age students spend about 1.7 more
hours per week preparing for class and women spend over an hour more per week preparing for class
than men, net of the other variables in the model. Student who report grades of mostly A’s and mostly
B’s spend significantly more time preparing for class student students who report grades of C’s or lower.
In fact, those who report grades of mostly A’s study about three hours more than otherwise‐similar
students who report grades of C’s or lower. Asian students spend more time than otherwise‐similar
White students preparing for class.

Running head: TIME SPENT PREPARING FOR CLASS 17
Figure 1 Adjusted Mean Study Time for Nursing and Arts and Science Majors by Institutional Selectivity
Figure 2 Adjusted Mean Study Time for Engineering and Arts and Science Majors by Carnegie Type
14.8 15.115.8
16.8
18.1 18.5 18.417.3
0
4
8
12
16
20
Noncompetitive Competitive(reference group)
Very Competitive Highly/MostCompetitive
Hours per week
Arts & Sciences Nursing
15.716.8
15.315.0 14.7 14.9
18.8 18.3 19.3 19.0 18.0 19.2
0
4
8
12
16
20
BaccalaureateDiverse
BaccalaureateArts & Sciences
Master'sMedium/Small
Master's Large(referencegroup)
DoctoralUniversities
ResearchUniversities
Hours per Wekk
Arts & Sciences Engineering
Running head: TIME SPENT PREPARING FOR CLASS 18
Figure 3 Adjusted Mean Study Time for Business and Arts and Science Majors by Carnegie Type
Figure 4 Adjusted Mean Study Time for Education and Arts and Science Majors by Control
15.716.8
15.3 15.0 14.7 14.9
13.214.4 13.9
13.4 13.2 13.2
0
4
8
12
16
20
BaccalaureateDiverse
BaccalaureateArts & Sciences
Master'sMedium/Small
Master's Large(referencegroup)
DoctoralUniversities
ResearchUniversities
Hours per Week
Arts & Sciences Business
15.4 15.515.114.4
0
4
8
12
16
20
Public Private
Hours per Week
Arts & Sciences
Education
Running head: TIME SPENT PREPARING FOR CLASS 19
Figure 5 Adjusted Mean Study Time for Allied Health and Arts and Science Majors by Carnegie Type
Figure 6 Adjusted Mean Study Time for Business and Arts and Science Majors by Institutional Selectivity
15.7
16.8
15.3
15.0
14.7
14.9
16.6
16.0
15.6
14.8
15.8
14.7
0
4
8
12
16
20
BaccalaureateDiverse
BaccalaureateArts & Sciences
Master'sMedium/Small
Master's Large(referencegroup)
DoctoralUniversities
ResearchUniversities
Hours per Week
Arts & Sciences Allied Health
14.8 15.1 15.816.8
13.4 13.114.2 14.5
0
4
8
12
16
20
Noncompetitive Competitive(reference group)
Very Competitive Highly/Most Competitive
Hours per Week
Arts & Sciences Business

Running head: TIME SPENT PREPARING FOR CLASS 20
Discussion
Similar to other studies on academic effort, we found the amount of time students spend
preparing for class is related to characteristics of students, their major fields, and institutions. Although
our findings show significant relationships with study time and individual characteristics, field of study,
and institutional context, the model explained only a small portion of the variance. The model did not
capture variation in faculty teaching practices or expectations of learning within the aggregated major‐
field groups, both of which may play an important role in how students spend their time in‐ and outside
of the class (Astin, 1993; Kuh, Nelson Laird, & Umbach, 2004; Umbach & Wawrzynski, 2005). The model
also does not capture the varying assessment methods or grading strategies that exist between majors
nor does it capture students’ selection into their major. Some professional majors, such as nursing,
require students to pass an entrance exam before admittance while others, such as engineering, require
extensive prerequisite preparation in science and mathematics courses both of which may influence
students’ propensity to allocate time to their academic work. Future research may focus on the impact
of faculty uses of technology in the classroom, pedagogical choices, and assessment methods on study
time as well as students’ motivation to pursue a certain major. Future studies may also wish to
investigate more fine‐grained differences between specific majors within the groups treated in this
study (e.g., between specialties within business or engineering).
Despite these limitations, we found evidence of institutional differences in how much students
study as well as the field of study they majored in. The difference in study time between arts and
science majors and students in the various professional fields were moderated by certain institutional
characteristics. In examining cross‐level interaction effects, the most notable differences between arts
and sciences and the host of professional majors were related to Carnegie type, though the specific
nature of this effect varied among the professional major groups. Net of other factors, allied health
students at doctoral universities studied over an hour more per week than their counterparts at

Running head: TIME SPENT PREPARING FOR CLASS 21
master’s large universities (Figure 5). While business students at baccalaureate arts and sciences
colleges studied about an hour more than their peers at master’s large universities (14.4 and 13.4 hours,
respectively), they studied almost two hours less than arts and sciences majors at baccalaureate arts
and sciences institutions contributing to a widening gap between business and arts and science majors
at baccalaureate arts and science colleges relative to the gap at master’s large institutions (Figure 3).
The gap in study time between engineering majors and arts and science majors was reduced at
baccalaureate arts and sciences colleges compared with master’s large institutions (see Figure 2). While
engineering majors studied about the same amount of time across Carnegie type (between 18 and 19
hours), arts and science students almost two more hours at baccalaureate arts and science institutions
(about 17 hours) than at the other Carnegie types (about 15 hours). A similar pattern was found for
nursing majors across selectivity tiers (see Figure 1). While nursing majors studied about the same
across selectivity tiers, about 18 hours (with about an hour dip at most selective institutions), average
study time for arts and science majors tended to steadily across selectivity tiers culminating in arts and
sciences and nursing majors spending about the same amount of time preparing for class at highly and
most selective institutions.
To explain the differences in study time in the same field at different types of institutions, a
future study could examine the variation in admission standards for these fields. For example, admission
in an allied health field at a large doctoral university may be more competitive, thus requiring more
study time, compared to a similar program at a smaller regional campus.
According to Smart (2010), examining distinctive academic environments within institutions
may lead to a better understanding of students’ learning behaviors and engagement patterns than the
impact of “remote and distal nature of institutional‐level measures” (p. 469) like selectivity and Carnegie
classification. He also encourages researchers to employ a theoretical approach to organizing academic
majors so to “discern those environments’ potential influences on student learning” (Smart, Feldman, &
Running head: TIME SPENT PREPARING FOR CLASS 22
Ethington, 2000, p. 240). This approach may be useful to better understanding the difference in class
preparation among students studying the professional fields.
Conclusion
Despite the importance of study time to student learning and recent findings documenting
declines in how much college students study, surprisingly little is known about what drives study time.
This research shows that students allocate their time differently based on a number of factors including
field of study, type of institution attended, and individual background characteristics. Consequently, the
focus on aggregate average study time masks important individual and structural sources of variation,
most importantly field of study. Although field of study shows a clear relationship to study time,
features of the institution moderate these effects in interesting ways.
Many scholars would agree that the quality of time and effort students invest in their academic
activities is necessary for student learning and development (Astin, 1993; Arum & Roksa, 2011; Michaels
& Miethe, 1989; Pace, 1982). While this study uncovered both disciplinary and institutional differences
in the amount of time students spend preparing for class, the next step is to better understand how that
time is being spent, and specifically whether it is being spent on educationally effective and productive
activities. This has particular relevance for undergraduate professional education, given Arum and
Roksa’s (2011) findings of a learning advantage for arts and science majors. For example, although
engineering students may spend more time preparing for class than arts and science majors, are they
less likely to engage in collaborative or peer‐mediated learning associated with positive social and
cognitive gains (Cabrera et al., 2002; Cruce, Wolniak, Seifert, & Pascarella, 2006; O’Neil, 2012; Umbach &
Wawrzynski, 2005)? Further research needs to inquire into the features of undergraduate professional
education and how they can serve to diffuse learning objectives where the arts and sciences seem to
currently confer differential educational benefits.
Running head: TIME SPENT PREPARING FOR CLASS 23
References
Altbach, P.G. (2011). Patterns of higher education development. In P.G. Altbach, P.J. Gumport, & R.O.
Astin, A. W. (1993). What matters in college: Four critical years revisited. San Francisco: Jossey‐Bass.
Berdahl (Eds.), American Higher Education in the Twenty‐First Century: Social, Political, and Economic
Challenges, 3rd Edition (pp‐15‐36). Baltimore, MD: The Johns Hopkins University Press.
Arum, R. & Roksa, J. (2011). Academically adrift: Limited learning on college campuses. Chicago:
University of Chicago Press.
Astin, A.W. (1993). What matters in college? Four critical years revisited. San Francisco: Jossey‐Bass.
Babcock, P. & Marks, M. (2011). The falling time cost of college. Review of Economics and Statistics 93,
468‐478.
Brint, S., Cantwell, A. M., & Saxena, P. (2012). Disciplinary categories, majors, and undergraduate
academic experiences: Rethinking Bok’s “Underachieving Colleges” thesis. Research in Higher Education,
53(1), 1‐25.
Brint, S., Riddle, M., Turk‐Bicakci, L., & Levy, C.S. (2005). From the liberal to the practical arts in American
colleges and universities: Organizational analysis and curricular change. Journal of Higher Education, 76,
151‐180.
Cabrera, A. F., Crissman, J. L., Bernal, E. M., Nora, A., Terenzini, P. T., & Pascarella, E. T.
(2002).Collaborative learning: Its impact on college students’ development and diversity. Journal of
College Student Development, 43(1), 20‐34.
Crosby, O., & Moncarz, R. (2006). The 2004‐14 job outlook for college graduates. Occupational Outlook
Quarterly. Washington, DC: US Department of Labor.
Cruce, T. M., Wolniak, G. C., Seifert, T. A., & Pascarella, E. T. (2006). Impacts of good practices on
cognitive development, learning orientations, and graduate degree plans during the first year of college.
Journal of College Student Development, 47(4), 365‐383.
de Vise, D. (2012, May 21). Is college too easy? As study time falls, debate rises. The Washington Post.
Retrieved from http://www.washingtonpost.com
Ellis, R. (Reporter). (2012, May 28). College students are studying less: The number of hours per week is
down from 50 years ago. NBC Nightly News. Retrieved from http://video.msnbc.msn.com/nightly‐news
Enders, C.K., & Tofighi, D. (2007). Centering predictor variables in cross‐sectional multilevel models: A
new look at an old issue. Psychological Methods, 12, 121‐138.
Running head: TIME SPENT PREPARING FOR CLASS 24
Hersch, R.H., & Merrow, J. (2005). Declining by Degrees: Higher Education at Risk. New York, NY:
Palgrave MacMillen.
Hofmann, D. A. & Gavin, M. B. (1998). Centering decisions in hierarchical liner models: Implications for research in organizations. Journal of Management, 14, 623‐641. Kuh, G.D., Nelson Laird, T.F., & Umbach, P. D. (2004). Aligning faculty activities and student behavior: Realizing the promise of Greater Expectations. Liberal Education, 90, 24‐31. Lucas, C.J. (1994). American Higher Education: A History, Second Edition. New York: Palgrave Macmillan.
McCormick, A.C. (2011). It’s about time: What to make of reported declines in how much college
students study. Liberal Education, 97(1), 30‐39.
McCormick, A. C., Pike, G. R., Kuh, G. D., & Chen, P. D. (2009). Comparing the utility of the 2000 and
2005 Carnegie Classification systems in research on students’ college experiences and outcomes.
Research in Higher Education, 50, 144‐167.
Merwin, J. C. (1969). Historical review of changing concepts of evaluation. In R. L. Tyler (Ed.), Educational
evaluation: New roles, new methods. The sixty‐eighth yearbook of the National Society for the Study of
Education, Part II. Chicago: University of Chicago Press.
Michaels, J.W., & Miethe, T.D. (1989). Academic effort and college grades. Social Forces, 68(1), 309‐319.
National Center for Educational Statistics (2012). Digest of Educational Statistics. Washington, DC: U.S.
Department of Education.
National Survey of Student Engagement (2011). Fostering student engagement campuswide‐annual
results 2011. Bloomington, IN: Indiana University Center for Postsecondary Research.
National Survey of Student Engagement. (2012). Promoting student learning and institutional
improvement: NSSE at 13. Annual Results 2012. Bloomington, IN: Indiana University Center for
Postsecondary Research.
O’Neill, N. (2012). Promising practices for personal and social responsibility: Findings from a National
Research Collaborative. Washington, DC: Association of American Colleges and Universities.
Pace, C.R. (1982). Achievement and the quality of student effort. Paper presented at a Meeting of
National Commission on Excellence in Education: Washington, DC.
Raudenbush, S. W. & Bryk, A. S. (2002). Hierarchical linear models: Applications and data analysis
methods (second edition). Thousand Oaks, CA: Sage Publications.
Raudencush, S. W., Bryk, A. S., & Congdon, R. (2010). HLM 7: Hierarchical linear and nonlinear modeling
[computer software]. Lincolnwood, IL: Scientific Software International.

Running head: TIME SPENT PREPARING FOR CLASS 25
Rojstaczer, S., & Healy, C. (2012). Where A is ordinary: The evolution of American college and university
grading, 1940‐2009. Teachers College Record, 114, 1‐23.
Smart, J.C. (2010). Differential patterns of change and stability in student learning outcomes in Holland’s
academic environments: The role of environmental consistency. Research in Higher Education, 51, 468‐
482
Umbach, P. D., & Wawrzynski, M. R. (2005). Faculty do matter: The role of college faculty in student
learning and engagement. Research in Higher Education, 46, 153‐184.

Running head: TIME SPENT PREPARING FOR CLASS 26
Appendix A NSSE Academic Major Categories by Broad Disciplinary Fields
Allied Health Arts and Sciences
Allied health/other medical Anthropology
Dentistry Art, fine and applied
Medicine Astronomy
Pharmacy Atmospheric science (including meteorology)
Therapy (occupational, physical, speech) Biochemistry or biophysics
Veterinarian Biology (general)
Botany
Business Chemistry
Accounting Communications
Business administration (general) Computer science
Finance Earth science (including geology)
International business Economics
Marketing English (language and literature)
Management Environmental science
Other business Ethnic studies
Gender studies
Education Geography
Business education History
Elementary/middle school education Language and literature (except English)
Music or art education Marine (life) science
Physical education or recreation Mathematics
Secondary education Microbiology or bacteriology
Special education Music
Other education Other arts & humanities
Other biological science
Engineering Other physical science
Aero‐/astronautical engineering Other social science
Civil engineering Philosophy
Chemical engineering Physics
Electrical or electronic engineering Political science
Industrial engineering Psychology
Materials engineering Social work
Mechanical engineering Sociology
General/other engineering Speech
Statistics
Nursing Theater or drama
Nursing Theology or religion
Zoology

Running head: TIME SPENT PREPARING FOR CLASS 27
Appendix B
Estimation of time spent preparing for class as a function of student and institutional‐characteristics (final model)
Fixed Effects Coefficient S.E. t‐ratio
Model for Institutional Mean Time Spent Preparing for Class Intercept (Mean Time Spent Preparing for Class) 15.43 0.065 236.72*** Noncompetitive ‐0.23 0.193 ‐1.22 Very Competitive 0.67 0.166 4.03*** Highly or Most competitive 1.60 0.280 5.72*** Research Universities ‐0.02 0.198 ‐0.10 Doctoral Universities ‐0.04 0.227 ‐0.20 Master’s Medium and Small 0.40 0.204 1.97* Baccalaureate Arts and Sciences 1.62 0.288 5.64*** Baccalaureate Diverse 0.59 0.228 2.60* Private ‐0.04 0.163 ‐0.25 Average: Allied Health 0.00 0.011 0.21 Average: Nursing 0.01 0.009 1.35 Average: Business ‐0.05 0.008 ‐6.80*** Average: Education ‐0.02 0.008 ‐2.15* Average: Engineering 0.03 0.008 3.27** Non‐traditional age 1.70 0.082 20.80*** Mostly A’s 3.05 0.122 25.02*** Mostly B’s 1.21 0.112 10.77*** Female 1.18 0.059 19.83*** Hispanic 0.08 0.099 0.79 African‐American/Black ‐0.15 0.106 ‐1.40 Asian 1.26 0.098 12.89*** Other race‐ethnicity 0.55 0.163 3.36*** Non‐discretionary time 0.01 0.002 3.31*** Model for Allied Health Slope Intercept (Mean Allied Health Slope) 0.03 0.240 0.14 Noncompetitive ‐0.33 0.450 ‐0.73 Very Competitive ‐0.46 0.369 ‐1.23 Highly or Most competitive ‐0.15 0.527 ‐0.28 Research Universities ‐0.16 0.375 ‐0.42 Doctoral Universities 1.22 0.608 2.01* Master’s Medium and Small 0.37 0.476 0.77 Baccalaureate Arts and Sciences ‐0.66 0.789 ‐0.84 Baccalaureate Diverse 0.97 0.856 1.13 Private 0.83 0.436 1.91 Average: Allied Health 0.07 0.027 2.45* Average: Nursing 0.02 0.025 0.78 Average: Business 0.03 0.019 1.32 Average: Education 0.02 0.017 1.20 Average: Engineering 0.04 0.022 1.73 Model for Nursing Slope Intercept (Mean Nursing Slope) 2.78 0.332 8.39***

Running head: TIME SPENT PREPARING FOR CLASS 28
Noncompetitive ‐0.28 0.604 ‐0.46 Very Competitive ‐0.77 0.553 ‐1.39 Highly or Most competitive ‐2.53 0.989 ‐2.56* Research Universities ‐1.80 0.703 ‐2.56* Doctoral Universities ‐0.09 0.672 ‐0.13 Master’s Medium and Small ‐0.04 0.650 ‐0.07 Baccalaureate Arts and Sciences ‐0.14 1.159 ‐0.12 Baccalaureate Diverse 0.37 0.734 0.50 Private ‐0.08 0.518 ‐0.15 Average: Allied Health 0.01 0.039 0.14 Average: Nursing 0.01 0.029 0.21 Average: Business ‐0.01 0.030 ‐0.40 Average: Education 0.05 0.027 1.68 Average: Engineering ‐0.01 0.042 ‐0.15 Model for Business Slope Intercept (Mean Business Slope) ‐1.83 0.101 ‐18.10*** Noncompetitive 0.51 0.272 1.87 Very Competitive 0.35 0.213 1.62 Highly or Most competitive ‐0.21 0.323 ‐0.65 Research Universities ‐0.19 0.224 ‐0.87 Doctoral Universities 0.04 0.385 0.09 Master’s Medium and Small 0.14 0.334 0.43 Baccalaureate Arts and Sciences ‐0.72 0.353 ‐2.05* Baccalaureate Diverse ‐0.93 0.358 ‐2.60* Private ‐0.45 0.226 ‐1.99* Average: Allied Health 0.00 0.019 ‐0.15 Average: Nursing ‐0.02 0.015 ‐1.21 Average: Business 0.00 0.013 0.05 Average: Education 0.02 0.013 1.50 Average: Engineering 0.00 0.009 ‐0.33 Model for Education Slope Intercept (Mean Education Slope) ‐0.71 0.133 ‐5.37*** Noncompetitive ‐0.12 0.321 ‐0.38 Very Competitive ‐0.02 0.321 ‐0.06 Highly or Most competitive ‐0.08 0.438 ‐0.18 Research Universities ‐0.12 0.328 ‐0.35 Doctoral Universities 1.05 0.557 1.88 Master’s Medium and Small ‐0.09 0.361 ‐0.25 Baccalaureate Arts and Sciences ‐0.46 0.531 ‐0.86 Baccalaureate Diverse 0.04 0.402 0.10 Private ‐0.69 0.286 ‐2.42* Average: Allied Health 0.00 0.023 0.06 Average: Nursing 0.01 0.016 0.69 Average: Business ‐0.01 0.015 ‐0.81 Average: Education 0.00 0.013 ‐0.16 Average: Engineering ‐0.04 0.018 ‐2.07* Model for Engineering Slope Intercept (Mean Engineering Slope) 3.27 0.332 9.85***

Running head: TIME SPENT PREPARING FOR CLASS 29
Noncompetitive 0.39 0.527 0.73 Very Competitive 0.07 0.466 0.16 Highly or Most competitive ‐0.56 0.631 ‐0.89 Research Universities 0.13 0.461 0.28 Doctoral Universities ‐0.69 0.714 ‐0.97 Master’s Medium and Small 0.02 0.999 0.02 Baccalaureate Arts and Sciences ‐2.29 1.095 ‐2.09* Baccalaureate Diverse ‐0.80 0.836 ‐0.96 Private ‐0.93 0.442 ‐2.12* Average: Allied Health ‐0.06 0.048 ‐1.16 Average: Nursing 0.00 0.038 ‐0.11 Average: Business ‐0.02 0.027 ‐0.88 Average: Education ‐0.01 0.030 ‐0.28 Average: Engineering ‐0.03 0.014 ‐2.02*
Random Effects
Variance
D.F.1
Chi‐square
Between Institutions 1.709 124 849*** Allied Health slope 1.314 124 184*** Nursing slope 6.806 124 462*** Business slope 1.133 124 262*** Education slope 1.663 124 217*** Engineering slope 2.778 124 262*** Within Institutions 71.063
*p<.05; **p<.01; ***p<.001 1Chi‐square statistics are based on 138 of 543 institutions that had sufficient data for computation (i.e., institutions that had students in all of the academic major categories).