running head: the tomato fruit cuticle, water relations … fruit softening include the possibility...
TRANSCRIPT
Running Head: The tomato fruit cuticle, water relations and softening
* Corresponding Author: Jocelyn Rose
Address: Department of Plant Biology, 228 Plant Science Building, Cornell University,
Ithaca, NY 14853
Fax: +1-607-255 5407
E-mail: [email protected]
Journal research area: Development and Hormone Action
1
Plant Physiology Preview. Published on April 20, 2007, as DOI:10.1104/pp.107.097477
Copyright 2007 by the American Society of Plant Biologists
www.plantphysiol.orgon June 29, 2018 - Published by Downloaded from Copyright © 2007 American Society of Plant Biologists. All rights reserved.
A re-evaluation of the key factors that influence tomato fruit softening and integrity
Montserrat Saladié1, Antonio J. Matas1, Tal Isaacson1, Matthew A. Jenks2, S. Mark
Goodwin2, Karl J. Niklas1, Ren Xiaolin3, X., John M. Labavitch4, Kenneth A.
Shackel4, Alisdair R. Fernie5, Anna Lytovchenko5, Malcolm A. O'Neill6, Chris B.
Watkins7 and Jocelyn K.C. Rose1*
1Department of Plant Biology, Cornell University, Ithaca, NY 14853, 2Department of
Horticulture and Landscape Architecture, Purdue University, West Lafayette, Indiana
47907, 3College of Horticulture, Northwest Agricultural & Forestry University, Yangling,
Shaanxi 712100, P.R. China, 4Department of Plant Sciences, University of California
Davis, CA 95616, 5Max-Planck-Institut für Molekulare Pflanzenphysiologie 14476
Potsdam-Golm, Germany, 6Complex Carbohydrate Research Center and Department of
Biochemistry and Molecular Biology, The University of Georgia, Athens, Georgia 30602, 7Department of Horticulture, Cornell University, Ithaca, NY 14853
*Corresponding author
Keywords: cell walls, cuticle, fruit softening, ripening, tomato, turgor
2 www.plantphysiol.orgon June 29, 2018 - Published by Downloaded from
Copyright © 2007 American Society of Plant Biologists. All rights reserved.

Footnotes
The project was supported by the National Research Initiative of the USDA Cooperative
State Research, Education and Extension Service, grant number # 2006-35304-17323; by
the CUAES Hatch Project, NYC-184485; and by the United States-Israel Binational
Science Foundation Award #2005168. In addition, AJM was supported by an
MEC/Fulbright (Spain) postdoctoral fellowship award and TI was supported by Vaadia-
BARD Postdoctoral Fellowship Award (FI-375-05) from the United States-Israel
Binational Agricultural Research and Development Fund.
Corresponding Author: Jocelyn Rose
Address: Department of Plant Biology, 228 Plant Science Building, Cornell University,
Ithaca, NY 14853
Fax: +1-607-255 5407
E-mail: [email protected]
3 www.plantphysiol.orgon June 29, 2018 - Published by Downloaded from
Copyright © 2007 American Society of Plant Biologists. All rights reserved.

ABSTRACT
The softening of fleshy fruits, such as tomato, during ripening is generally reported
to result principally from disassembly of the primary cell wall and middle lamella.
However, unsuccessful attempts to prolong fruit firmness by suppressing the expression of
a range of wall-modifying proteins in transgenic tomato fruits do not support such a simple
model. Delayed Fruit Deterioration (DFD) is a previously unreported tomato cultivar that
provides a unique opportunity to assess the contribution of wall metabolism to fruit
firmness, since DFD fruits exhibit minimal softening but undergo otherwise normal
ripening, unlike all known non-softening tomato mutants reported to date. Wall
disassembly, reduced intercellular adhesion and the expression of genes associated with
wall degradation were similar in DFD fruit and those of the normally softening cultivar
Ailsa Craig. However, ripening DFD fruit showed minimal transpirational water loss and
substantially elevated cellular turgor. This allowed an evaluation of the relative
contribution and timing of wall disassembly and water loss to fruit softening, which
suggested that both processes have a critical influence. Biochemical and biomechanical
analyses identified several unusual features of DFD cuticles and the data indicate that, as
with wall metabolism, changes in cuticle composition and architecture are an integral and
regulated part of the ripening program. A model is proposed in which the cuticle affects the
softening of intact tomato fruit both directly, by providing a physical support and
indirectly, by regulating water status.
4 www.plantphysiol.orgon June 29, 2018 - Published by Downloaded from
Copyright © 2007 American Society of Plant Biologists. All rights reserved.

INTRODUCTION
The ripening of fleshy fruits involves many physiological processes, including the
production of aromatic compounds and nutrients, changes in color and softening of the
flesh to an edible texture, which have evolved to attract animals and promote seed
dispersal (Giovannoni, 2004). The molecular pathways that underlie many of these
ripening-related phenomena have been sufficiently characterized to allow the modification
of fruit nutritional status or organoleptic characteristics through targeted genetic
engineering (Romer et al., 2000; Lewinsohn et al., 2001; Muir et al., 2001; Dharmapuri, et
al., 2002; Fraser and Bramley, 2004; Davuluri et al., 2005;). However, much less is known
about the critical molecular determinants of fruit firmness and softening. In part, this
reflects the difficulties in evaluating the many physical and sensory attributes that
determine texture (Harker et al., 1997; Waldron et al., 2003); a characteristic that, unlike
color or aroma, cannot be defined by a quantitative measurement of specific metabolites or
by monitoring a particular biosynthetic pathway.
Research spanning more than 40 years has targeted the causal mechanisms of fruit
softening, much of it using tomato (Solanum lycopersicum) ripening as a model system. A
decline in fruit firmness typically coincides with dissolution of the middle lamella,
resulting in a reduction in intercellular adhesion, depolymerization and solubilization of
hemicellulosic and pectic cell wall polysaccharides and, in some cases, wall swelling
(Brummell and Harpster, 2001). These events are accompanied by the increased expression
of numerous cell wall degrading enzymes, including polysaccharide hydrolases,
transglycosylases, lyases and other wall loosening proteins, such as expansin (Harker et al.,
1997; Rose et al., 2003; Brummell, 2006). Accordingly, while factors such as cellular
turgor and morphology (Lin and Pitt, 1986; Shackel et al., 1991) have been suggested to
contribute to aspects of texture, mechanistic models almost invariably attribute fruit
softening to disassembly of polysaccharide networks in the primary wall and middle
lamella (Rose et al., 2003; Brummell, 2006). For example, polygalacturonase (PG)-
catalyzed depolymerization of pectin in the wall and middle lamella was long believed to
be the principal process underlying fruit softening, although this was refuted through
5 www.plantphysiol.orgon June 29, 2018 - Published by Downloaded from
Copyright © 2007 American Society of Plant Biologists. All rights reserved.

reverse genetics studies in tomato (reviewed in Brummell and Harpster, 2001). Similarly,
suppressing the expression of several other ripening-related wall modifying proteins in
transgenic tomato fruits has generally resulted in minimal effects on fruit softening or
texture (Brummell and Harpster, 2001; Rose et al., 2003).
Explanations for the lack of progress in identifying the key individual determinants
of fruit softening include the possibility that important textural changes associated with
wall disassembly are a consequence of numerous enzymes acting in concert on multiple
wall structural components, or that the critical enzymatic activity or activities have not yet
been identified. However, an alternative explanation is that polysaccharide degradation is
not the sole determinant of fruit softening and that other ripening-related physiological
processes also play critical roles.
We have addressed this latter hypothesis by evaluating a previously
uncharacterized tomato cultivar, referred to here as Delayed Fruit Deterioration (DFD),
whose fruits undergo normal ripening, but remain firm and show no loss of integrity for
remarkably extended periods after reaching the fully ripe stage. We report that ripening-
related disassembly of the cell wall and middle lamella have similar characteristics in fruits
from DFD and the normally softening cultivar Ailsa Craig (AC), even though DFD fruits
typically remain firm for at least 6 months after achieving a fully ripe stage. However, in
contrast to AC fruits, those from DFD exhibit minimal water loss and consequent tissue
collapse, and it is suggested that this is likely due to specific compositional or
ultrastructural characteristics of the fruit cuticle. Evidence is also presented that fruit
cuticles from DFD and AC tomatoes undergo distinctly different changes in their
biomechanical properties during ripening. Moreover, ripe DFD fruits are highly resistant to
infection by opportunistic pathogens, unless the integrity of the cuticle is compromised.
Our results suggest that while changes in the polysaccharide components of the cell
wall are undoubtedly important for fruit texture, equivalent alterations in cuticle
architecture are also an integral element of the ripening program. The data also highlight
the mechanistic distinction between a reduction in firmness, or resistance to compression,
of intact fruit, and ripening-related textural changes in the pericarp tissue. Both of these
6 www.plantphysiol.orgon June 29, 2018 - Published by Downloaded from
Copyright © 2007 American Society of Plant Biologists. All rights reserved.

phenomena could be referred to as ‘softening’, although in most reported analyses,
transgenic lines with altered expression of wall modifying proteins have been evaluated,
for obvious commercial reasons, by measuring resistance of the intact fruits to
compression. This study indicates that the cuticle has a previously under-appreciated
influence on intact tomato fruit firmness and ripening physiology, and suggests another
biotechnological target to prolong fruit quality, in addition to altering polysaccharide
metabolism.
RESULTS
Physiological Characterization of DFD Fruit Development and Softening
DFD is a regionalized cultivar that is grown in specific areas of southern Europe
and around the Mediterranean, where it is known to exhibit dramatically delayed softening.
As far as we are aware, DFD has not been described in the literature and its genetic
background is unknown. Therefore, in the absence of isogenic lines containing the
introgressed DFD phenotype, the Ailsa Craig (AC) tomato cultivar was used for
comparative purposes because it exhibits relatively rapid fruit softening and has similar
fruit size, shape and overall fruit morphology to DFD (Fig. 1). DFD and AC fruit
development and ripening (from approximately 10-50 days after anthesis, as shown in
Figs. 1A and 1B) were comparable, with both genotypes taking a similar time to reach a
fully expanded mature green (MG) stage, although the time taken from the breaker (Br)
stage, at the onset of ripening, to the red ripe (RR) stage was approximately 7 days longer
for DFD than AC fruits. The peak in ethylene production showed a similar temporal delay,
but the DFD fruits exhibited a characteristic climacteric respiratory burst and increase in
ethylene synthesis at the Br stage (Figs. 2A and 2B) that was more pronounced than that of
AC fruit. This was not surprising, given the substantial variation that has been observed
among tomato cultivars (Guillén et al., 2006) and was quite distinct from the suppressed
climacteric in the ripening impaired mutants rin, nor (Giovannoni, 2004). Other hallmarks
of normal ripening, including the accumulation of carotenoid pigments that contribute to
7 www.plantphysiol.orgon June 29, 2018 - Published by Downloaded from
Copyright © 2007 American Society of Plant Biologists. All rights reserved.

the fruit color change (data not shown), were similar in DFD and AC, as were levels of
soluble solids in the fruit, reflecting carbohydrate status (Figs. 2C and 2D, respectively).
After reaching a fully ripe stage, DFD fruits remained visually unchanged for
several months, as seen in photographs taken at RR plus 4 months (Fig. 1C) and a time-
lapse video spanning 4 months after the RR stage (Supplemental Video). This was in direct
contrast to AC fruits, which exhibited over-ripening (tissue degradation and collapse after
reaching the fully ripe stage), as is typically seen in most fleshy fruits. Even 7 months after
full ripening, the DFD fruits showed little change in external appearance, with no signs of
internal desiccation, tissue breakdown or other morphological changes (Fig. 1D). Storage
of the fruits in the light eventually resulted in pigment photobleaching (Fig. 1D), but this
did not occur in dark-stored fruits.
Compression analysis of intact AC fruits showed a typical loss of fruit firmness
from MG to RR, and complete tissue collapse by 2 months after RR (Fig. 3A). In contrast,
MG DFD fruits were statistically firmer than those of AC at the same stage, exhibited
minimal softening during ripening, and at the RR stage were statistically firmer than AC
Br fruits. Even 8 months after reaching the RR stage, the firmness of DFD fruits was
similar to that of AC RR fruits. However, when the firmness of excised pericarp segments
with the endocarp facing upwards was measured, no differences were seen between fruits
of each cultivar at any ripening stage (Fig. 3B), although the DFD fruits were somewhat
firmer at the MG stage. In contrast, the force needed to penetrate the cuticle of intact MG
fruits was greater for AC than DFD (Fig. 3C), and while the AC cuticles showed
progressive weakening during ripening, those of DFD showed a minimal change, such that
the penetration mass for DFD fruits at the RR stage was approximately twice that of AC.
Cell Wall Analysis, Wall Disassembly and Dissolution of the Middle Lamella
Changes in the amounts of total wall material, based on dry weight (Fig. 4A),
uronic acids (Fig. 4B), cellulose (Fig. 4C) and cell wall neutral sugar composition (Fig.
4D), showed typical ripening-related trends in both AC and DFD fruits. Similarly, size
exclusion chromatographic (SEC) separation of water-soluble pectins from MG and RR
8 www.plantphysiol.orgon June 29, 2018 - Published by Downloaded from
Copyright © 2007 American Society of Plant Biologists. All rights reserved.
fruits of both cultivars showed evidence of characteristic ripening-related pectin
depolymerization (Figs. 4B and 4E). A fractionation of chelator-soluble pectins suggested
similar patterns of pectin modification in DFD and AC ripe fruits (data not shown). To
further contrast ripening-related wall metabolism in the DFD and AC fruits, the expression
of a range of genes encoding proteins involved in cell wall modification and disassembly,
including PG, two expansins and a xyloglucan endotransglucosylase/hydrolase (XTH), was
examined by Northern blot analysis (Fig. 4F). All the genes showed similar qualitative
patterns of transcript accumulation and while some quantitative differences were apparent,
they were within the range of typical inter-cultivar variation that we have previously
observed (data not shown). Importantly, the expression of these genes was not dramatically
repressed, as is the case for ripening impaired mutants such as rin and nor, where
expression is generally undetectable (Maclachlan and Brady, 1994; Rose et al., 1997,
2003; Brummell and Harpster, 2001; Eriksson et al., 2004).
An examination of the fruit pericarp tissues by light microscopy (Supplemental
Figs. 1A and 1B) and transmission electron microscopy (TEM) (Supplemental Figs. 1C
and 1D) showed that both AC (Supplemental Figs. 1A and 1C) and DFD (Supplemental
Figs. 1B and 1D) ripe fruits exhibited characteristic cell-cell separation, indicating
degradation of the primary wall and middle lamella and resulting in the formation of
enlarged cell junction zones and cells that are interconnected only through plasmodesmata
(Supplemental Figs. 1C and 1D).
Pericarp Cell Swelling and Fruit Water Status
Even though fruit cell wall breakdown and cell separation showed similar trends in
DFD and AC, the pericarp of DFD, but not AC, exhibited substantial swelling during
ripening (Fig. 5A). Microscopic analysis of three zones of the pericarp, (1-3,
corresponding to outer, middle and inner, respectively; Fig. 5B) showed that cell size
throughout the pericarp was similar in AC and DFD fruits at the MG stage (Figs. 5B and
5C), but that by the RR stage, cells in the DFD pericarp had undergone a substantial
increase in cell size. For example, cells in the DFD inner pericarp (zone 3, Fig. 5C)
9 www.plantphysiol.orgon June 29, 2018 - Published by Downloaded from
Copyright © 2007 American Society of Plant Biologists. All rights reserved.

showed, on average, at least four-fold greater increases in mean cell cross-sectional area
during ripening. In contrast, while cell size in RR AC fruits was on average somewhat
greater than in MG fruits, this was only statistically significant in zone 3 and the extent of
the increase was far less than that seen with DFD (Figs. 5B and 5C).
An increase in cell size is indicative of a positive hydrostatic (turgor) pressure that
would be required to drive cell expansion. To determine whether this was the case, cellular
turgor in the outer pericarp cells of AC and DFD fruits at different ripening stages was
measured using a pressure microprobe (inset Fig. 6A). Cellular turgor in AC fruits declined
prior to the onset of ripening at the MG stage and decreased linearly throughout ripening,
reaching minimal values at the over ripe (OR) stage (Fig. 6A). The turgor values are
comparable to those previously reported for other tomato cultivars (Shackel et al., 1991).
The initial cellular turgor pressure and rate of linear decrease were similar in DFD fruits at
the MG stage and the onset of ripening. However, in DFD, the rate of decrease slowed
early in ripening and showed little further decrease after a mid-ripe stage. An analysis of
covariance indicated a significant (P=0.016) difference in turgor of OR fruit between AC
(0.09 MPa) and DFD (0.03 MPa) fruit, after adjustment to the same mean color level. A
decline in cellular turgor may be associated with water loss from the fruits, which in turn
may be an important factor that contributes to the extremely delayed softening of DFD
fruits. Transpirational water loss from AC and DFD fruit was assessed by measuring
weight reduction over a 3 month period in fruits starting at the RR stage (Fig. 6B). AC
fruits showed a high rate of water loss, while the loss was minimal in DFD fruits. After 3
months the AC fruits typically exhibited extensive desiccation and splitting, while the DFD
fruits showed no apparent change, similar to the fruits shown in Fig. 1C.
Microscopic Analysis of Cuticles
The cuticle provides the principal barrier to water loss in plant tissues (Jeffree,
2006) and since AC and DFD fruits exhibited substantial differences in water status, the
anatomical features of their cuticles were examined by light microscopy. AC and DFD
fruits have similar cuticle anatomies (Figs. 7A-D), with substantial epidermal cell
10 www.plantphysiol.orgon June 29, 2018 - Published by Downloaded from
Copyright © 2007 American Society of Plant Biologists. All rights reserved.

encasement, where several outer epidermal cell layers show cuticularization of the
anticlinal and periclinal cell walls, as has been described in several tomato cultivars
(Bargel and Neinhuis, 2004; Matas et al., 2004). Fruits of both cultivars also showed
similar patterns of cellulosic cell wall ramification within the cuticular layer, as revealed
by staining with toluidine blue (Figs. 7C and 7D). The mean cuticle thickness of AC fruits
was slightly greater (P<0.001) at both the MG (12 μm ± 1.7) and RR (11 μm ± 1.9) stages
than that of DFD cuticles (7.8 μm ± 1.6 and 8.9 μm ± 1.9, respectively). These values are
similar to those reported for various tomato cultivars, including AC (Bargel and Neinhuis,
2004; 2005). However, one notable difference was that the cuticles of AC RR fruit had a
characteristic yellow-orange color, due to the presence of the flavonoid precursor
naringenin chalcone (Baker et al., 1982), but no such coloration was seen in the DFD
cuticles (Figs. 7B and 7D).
TEM analysis of the AC and DFD cuticles indicated no differences in ultrastructure
in either the cuticular layer or periclinal and anticlinal cell walls of the outer epidermal
cells (Figs. 7E and 7F) and SEM imaging revealed no patterns of external wax
accumulation, such as wax crystals, in either cultivar. However, during SEM analysis,
focusing of the electron beam on the fruit surface consistently induced rapid peeling of a
thin, outer membranous layer in the DFD samples (highlighted with an arrow in Fig. 7H),
but not in AC fruits (Fig. 7G).
Analysis of Cuticle Biomechanical Properties
Enzymatically isolated cuticles from AC and DFD fruits at the MG and RR stages
were evaluated with an Instron analyzer to determine their extensibility (strain to failure),
work of fracture (energy required to induce failure) and viscoelasticity (creep rates under
constant applied forces) under uniaxial loading. These tests revealed significant differences
between the mechanical behaviors of the cuticles from the two cultivars, and changes in
cuticle mechanical properties attending the ripening of each cultivar (Fig. 8). At the MG
stage, the yield stress (i.e., the force required to induce material failure) was 33% higher in
DFD than AC cuticles. Although the mean yield stress value increased during ripening in
11 www.plantphysiol.orgon June 29, 2018 - Published by Downloaded from
Copyright © 2007 American Society of Plant Biologists. All rights reserved.
AC, there was no statistically significant change in DFD cuticles (Fig. 8A). In contrast, the
AC cuticles had greater yield strains than those of DFD at the MG stage, indicating greater
extensibility, and while the yield strain of AC cuticles decreased during ripening, those of
DFD became markedly larger, indicating an increase in their extensibility, with a mean
value approximately 30% greater than AC at the RR stage (Fig. 8B). Thus, the tensile
elastic modulus Et (i.e., the ability to resist tensile forces) of isolated cuticles differed
between the two cultivars and changed during the maturation of each cultivar. At the MG
stage, the Et of DFD cuticles was significantly larger than that of AC, while at the RR
stage, the Et of AC was larger than that of DFD. Moreover, during the MG to RR
transition, the Et of AC cuticles increased, whereas that of DFD cuticles decreased.
Preliminary tests to determine viscoelastic behavior (e.g., creep tests and cyclical loading-
unloading tests) indicated that DFD cuticles at the RR stage deform plastically more
rapidly and require smaller forces than do those of AC at the same developmental stage
(data not shown).
Cuticle Composition
To determine if the cuticle chemical composition was different in AC and DFD
fruits, the levels of component cuticular waxes and cutin monomers at the MG and RR
stages were assayed. The total wax amount increased during ripening in both cultivars
(Table I), but was higher in DFD than AC fruits at both the MG and RR stages (33% and
36%, respectively). In RR fruits, the most significant proportional differences were
apparent in the alkadienes, which showed a more than 4-fold increase in the mean
percentage levels in DFD than AC, and n-alkanes, with lower levels in DFD (bold in Table
I). Interestingly, the total and proportional amount of alkadienes increased between the MG
and RR stages more than any other constituent class (Table I): in DFD fruits, the total
amount of alkadienes increased nearly 50 fold from MG to RR, corresponding to a 28 fold
proportional increase, while the equivalent increase in AC fruit was only 8 fold, which
represents a 5 fold proportional increase. Individual wax constituents showed relatively
12 www.plantphysiol.orgon June 29, 2018 - Published by Downloaded from
Copyright © 2007 American Society of Plant Biologists. All rights reserved.

little variation, other than substantially greater levels of tritriacontadiene in the DFD RR
cuticles (bold in Table II).
Unlike the waxes, the total amounts of cutin monomers per unit fruit surface area
were similar in MG and RR stages of AC fruits, but increased substantially (84%) during
ripening in the DFD fruits (bold in Table III). Accordingly, while the amounts of cutin
monomers were similar in AC and DFD MG fruits, the amount of cutin in DFD RR
cuticles was approximately double that of AC at the same stage. The relative proportions
of the monomeric constituents generally showed no significant change during ripening and
no qualitative differences between AC and DFD at either ripening stage were detected. A
notable exception was an increase in the proportion of 9,10,18-triOH octadecanoic acid in
AC cuticles and a concomitant decrease in 9,10,18-triOH octadecenoic acid (bold in Table
III. This change was not detected in DFD cuticles, which also contained higher levels of p-
coumaric acid (Table III).
In a separate experiment, the levels of flavonoids and the flavonoid precursor
naringenin chalcone were measured in total pericarp tissue minus the cuticle and outer
epidermal cell layers, and in enzymatically isolated cuticles, of MG and RR fruit from both
cultivars. Naringenin chalcone was barely detectable in AC total pericarp extracts at the
RR stage and not at all in DFD pericarp and while levels were approximately 300 fold
higher in isolated RR AC cuticles, it was not detected in DFD cuticles. The flavonoids
kaempferol and quercetin were detected in MG cuticles from both cultivars and the amount
of kaempferol was 2 to 3 fold greater in DFD than AC.
Infection of Fruits by Cultured and Opportunistic Fungal Pathogens
During storage and over-ripening it was often observed that the AC fruits became
infected by opportunistic fungal pathogens, while intact DFD fruits never succumbed to
infection, even following prolonged storage in high humidity conditions (Fig. 9A). To test
the resistance of the DFD fruits to fungal infection in a more controlled environment,
spores of the fungus Botrytis cinerea were applied at various titers to RR fruits from AC
(Figs. 9B and 9E), a commercial tomato cultivar (Figs. 9C and 9F) and DFD (Figs. 9D and
13 www.plantphysiol.orgon June 29, 2018 - Published by Downloaded from
Copyright © 2007 American Society of Plant Biologists. All rights reserved.
9G), either with a syringe through a small puncture in the fruit cuticle (Figs. 9B-D), or
ectopically (Figs. 9E-G). Fruit from AC and the commercial tomato cultivar were
consistently infected by both ectopic application and through the wound, whereas DFD
fruits were only infected when the cuticle was damaged, upon which infection occurred at
the same rate and to the same extent as in the other cultivars.
DISCUSSION
DFD Provides a Unique Source of Genetic Material to Dissect Fruit Softening
One of the advantages of tomato as an experimental model to study fleshy fruit
softening is the availability of pleiotropic non-ripening mutants, such as rin (ripening
inhibitor), nor (non-ripening), alcobaça and Cnr (colorless non-ripening), which are
impaired in many ripening-related processes and exhibit delayed or impaired softening
(Kopeliovitch et al., 1980; Thompson et al., 1999; Orfila et al., 2002; Ericksson et al.,
2004; Giovannoni, 2004). These mutants have provided insight into several specific
aspects of ripening-related wall metabolism (Rose et al., 2003; Ericksson et al., 2004), but
their pleiotropic nature limits characterization of more complex physiological processes.
To date, no tomato mutants have been characterized that exhibit minimal fruit softening,
but otherwise normal ripening: such a tomato would provide an invaluable system to
identify the structural and regulatory determinants of fruit firmness. We note that
transgenic tomato lines with suppressed expression of the small GTPase LeRab11a were
reported to have prolonged firmness, by approximately 20 days, and normal color
development (Lu et al. 2001); however, no cell wall analyses were described and so direct
comparisons cannot be made with the results here.
DFD fruits exhibit a substantial climacteric burst of ethylene and carbon dioxide
production at the onset of ripening and undergo normal ripening, as determined by
assessing color, soluble sugars (Fig. 2), metabolite content and aroma (data not shown), in
contrast to all previously reported pleiotropic tomato mutants. However, DFD fruits show
remarkably small changes in their firmness when compared with the well studied
experimental cultivar AC and indeed, as far as we are aware, with all previously reported
14 www.plantphysiol.orgon June 29, 2018 - Published by Downloaded from
Copyright © 2007 American Society of Plant Biologists. All rights reserved.

tomato cultivars. While some tomato mutants show delayed softening for up to several
weeks (Mutschler, 1984; Schuelter et al., 2002), DFD fruits typically remain firm for at
least 6 months after reaching the RR stage, exhibiting negligible tissue collapse (Figs. 1C,
1D and 3A).
The notion common assumption that fruit softening (applying the most commonly
used definition, of resistance of intact fruits to compression) is primarily, or even
exclusively, the result of wall disassembly (Brownleader et al., 1999; Brummell and
Harpster, 2001; Seymour et al., 2002; Rose et al., 2003; Brummell, 2006) is challenged by
the data presented here. DFD fruits remained firm at the RR stage and were significantly
firmer than AC fruits at the Br and RR stages, although patterns of wall polysaccharide
modification and related gene expression, and the subsequent reduction in intercellular
adhesion, were comparable in DFD and AC (Fig. 3). It is noted that while the levels of
LePG1 and LeExp1 transcript accumulation were somewhat lower in DFD than AC, this
was within the range of variation that we have previously observed among different tomato
cultivars (data not shown). Moreover, other studies have reported substantial variation
among normally softening tomato cultivars of cell wall polysaccharide depolymerization,
the abundance of cell wall degrading proteins and the corresponding enzyme activities
(Wallner and Boom, 1977; Carey et al., 1995; Blumer et al., 2000; Banik et al., 2001).
These results indicate that the prolonged firmness of DFD fruit is not solely a consequence
of impaired metabolism of the wall and middle lamella, although we cannot exclude the
possibility that minor differences in wall metabolism, that were not detected in our
analyses, contribute to some extent to the differences between DFD and AC softening
rates. Nevertheless, it is clear that ripening-related wall metabolism in DFD is substantial,
unlike previously described non-softening pleiotropic tomato mutants (Maclachlan and
Brady, 1994; Rose et al., 1997, 2003; Brummell and Harpster, 2001; Eriksson et al., 2004).
DFD Fruits Show Abnormal Water Relations and Cellular Turgor
It has been suggested that fruit firmness, in common with the biomechanical
properties of most plant tissues, is influenced by cellular turgor pressure (Schackel et al.,
15 www.plantphysiol.orgon June 29, 2018 - Published by Downloaded from
Copyright © 2007 American Society of Plant Biologists. All rights reserved.
1991; Jackman et al., 1992; Jackman and Stanley, 1995; Mignani et al., 1995; Harker et al.,
1997; Barrett et al., 1998). This idea has yet to be proven experimentally, but is supported
by our data and other studies that have shown that ectopic application of wax to avocado
fruits can prolong their firmness (Jeong et al., 2003). Importantly, maintenance of DFD
fruit firmness coincided with an absence of water loss and tissue collapse that is typical of
most ripening fruits. Atypical water status in DFD fruits was also suggested by the
observation that during ripening, the pericarp underwent a substantial increase in thickness
(Fig. 5A), which reflected cell expansion throughout the pericarp (Figs. 5B and 5C). Cell
expansion requires wall loosening and a positive cellular turgor pressure (Cosgrove, 1993)
and since wall degradation, which presumably resulted in a major loss in wall tensile
strength, was evident in both DFD and AC RR fruits, we hypothesized that cellular turgor
might be substantially different between the two cultivars. This proved to be the case (Fig.
6A) and while turgor declined during ripening in AC fruits, as has been previously
reported in other normally softening tomato cultivars (Shackel et al., 1991), it remained
high in DFD, after an initial decrease in early ripening. The transpiration rate from ripening
tomato fruits would undoubtedly have a profound effect on tissue water status, and hence
turgor pressure, but another important consideration is the relative partitioning of
osmotically active solutes between the symplast and apoplast. The concentration of such
solutes, comprising mostly hexoses and inorganic ions (Ruan et al., 1996), increases two-
fold in the tomato fruit apoplast during ripening (Almeida and Huber, 1999), which would
cause an increase in the apoplastic water potential and presumably lower cellular turgor.
Such a process might explain the observation that the turgor pressure in tomato fruit
pericarp cells is substantially less than would be expected, based on the osmotic potential
of the entire tissue (Shackel et al., 1991). Thus, while the unusually elevated cellular turgor
in ripe DFD fruits is likely to be profoundly affected by the absence of transpiration, an
atypical partitioning of osmotically active solutes between the apoplast and symplast may
also be a contributing factor.
16 www.plantphysiol.orgon June 29, 2018 - Published by Downloaded from
Copyright © 2007 American Society of Plant Biologists. All rights reserved.

DFD Cuticles Show Unusual Biomechanical and Biochemical Characteristics
The notable difference in DFD fruit water status and puncture analysis of the fruit
skin (Fig. 3C) suggested an association with the cuticle, which acts as the primary barrier
to transpirational water loss from aerial tissues (Riederer and Schreiber, 2001; Burghardt
and Riederer, 2006) and provides a biomechanically important structure, since tensile
stresses are presumably highest in the outer layer of plant tissues (Niklas, 1992). It has
been reported that most gas exchange in detached tomato fruits occurs through the stem
scar (Cameron and Yang, 1982; Klee, 1993) rather than the fruit cuticle. However, it was
apparent that the DFD phenotype did not reflect reduced water loss through this route since
sealing the stem scars of DFD or AC fruits with a layer of vaseline did not alter the relative
rates of water loss (data not shown). Detached fruits also exhibited the same rate of
reduction in firmness whether or not the calyx was left attached. Similarly, microscopic
analysis revealed no anatomical differences in the stem scars of the two genotypes and our
studies suggest that approximately equal amounts of transpirational water loss occur
through the stem scar and cuticle (data not shown).
No gross differences in DFD and AC cuticle ultrastructure (Fig. 7) were seen and
cuticle thickness was not statistically different between the two cultivars. This was not
unexpected, since there is no correlation between cuticle thickness and water permeability
in leaves (Riederer and Schreiber, 2001), or between cuticle structural appearance and
water loss from blueberry fruit (Vega et al., 1991). Light microscopy suggested no
difference in the ramification of polysaccharides within the DFD and AC cuticle, which
was of interest since it has been suggested that polysaccharide tracks might provide a path
for water diffusion (Burghardt and Riederer, 2006).
Our data suggest that the DFD cuticle is stiffer and stronger than that of AC at the
MG stage (Fig. 8). Since breaking stresses are calculated by normalizing applied
mechanical forces with respect to the cross-sectional areas on which they act, the
differences in breaking stresses between cultivars and developmental stages must reflect
differences in the cuticle (ultra)structure or biochemical composition (Niklas, 1992). A
difference in the DFD cuticle architecture was also suggested by the electron beam-
17 www.plantphysiol.orgon June 29, 2018 - Published by Downloaded from
Copyright © 2007 American Society of Plant Biologists. All rights reserved.
induced peeling of an outer cuticular layer during SEM analysis (Fig. 7H). Cuticles are
composites of a solvent-soluble wax component that is associated with a complex
insoluble matrix of hydroxy- and epoxy-fatty acid esters, termed cutin (Jeffree, 2006). The
waxes can be divided into two spatially distinct layers: the epicuticular waxes that coat the
surface and the intracuticular waxes that are embedded in the cutin matrix. The pathways
by which water diffuses through the cuticle are still poorly defined (Schreiber, 2005;
Burghardt and Riederer, 2006; Schreiber, 2006) and the cuticle components that determine
water permeance have not yet been identified. However, it has been suggested that long-
chain saturated aliphatic hydrocarbons of the intracuticular waxes, which can exhibit close
molecular packing within the cutin matrix and form highly water-impermeable crystalline
regions within the cuticle (Casado and Heredia, 2001), provide the principal barrier to
water loss (Burghardt and Riederer, 2006; Riederer and Schreiber, 2001).
MG and RR DFD fruit have approximately 30% more wax than AC and a
substantially increased level of n-alkadienes at the RR stage, which are inferred to be n-
tritricontadiene (n-C33-6,9-diene) from previous analyses (Bauer et al., 2004a; 2004b). The
overall wax components and cutin monomer ratios were similar, although overall cutin
levels almost doubled in DFD fruits during ripening and were almost twice those of AC at
the RR stage. No direct conclusions can be drawn from these results because the
biochemical composition of tomato fruit cuticles varies among cultivars (Baker et al.,
1982; Bauer et al., 2004a; 2004b) and the DFD trait is not available in an isogenic
background for comparison with a ‘wild type’. Nevertheless, levels of cutin monomers are
relatively constant among tomato cultivars with a range of morphological phenotypes and
at different ripening stages (Baker et al., 1982; our unpublished data) and we are not aware
of any previous report that has described such high cutin levels, or the upregulation of the
cutin synthesis pathway during ripening. Moreover, the absence of a statistically
significant increase in DFD cuticle thickness during ripening suggests that packing of the
cutin matrix is much denser during ripening in DFD. The tomato fruit cutin matrix also
becomes more cross-linked during ripening (Benítez et al., 2004) and so these two
phenomena likely result in a stronger and less permeable cuticle membrane. Another
important role of the cuticle is to provide a structural barrier against microbial pathogens
18 www.plantphysiol.orgon June 29, 2018 - Published by Downloaded from
Copyright © 2007 American Society of Plant Biologists. All rights reserved.
(Mendgen et al., 1996) and many fungi secret cutinases to aid infection. The altered cutin
profile of DFD, possibly associated with increased cutin crosslinking, might be connected
to the observation that the fruits are highly resistant to microbial pathogens, unless the
cuticle is damaged (Fig. 9).
CONCLUSIONS
DFD is unlike previously reported tomato mutants in that loss of fruit firmness is
largely uncoupled from other aspects of ripening, thus providing a unique opportunity to
examine the factors that contribute to fruit softening. Our results suggest that multiple
coordinated processes are involved, including disassembly of polysaccharide networks in
the primary wall and middle lamella and transpirational water/turgor loss. The minimal
water loss and maintenance of cellular turgor in DFD fruit further allow an assessment of
the relative contribution and timing of these two processes. In this regard, the turgor and
fruit firmness data indicate that softening of intact fruits results from an early decline in
cellular turgor coincident with early changes in wall architecture, presumably as a result of
wall relaxation. A second component is then provided by substantial water transpiration,
which occurs in parallel with continued wall degradation and a reduction in intercellular
adhesion.
The cuticle itself is also thought to have an important influence on the
biomechanical properties of ripening fruit (Bukovac, 1995; Bargel and Neinhuis, 2004;
Petracek and Matas et al., 2004; Bargel and Neinhuis, 2005; Edelmann et al., 2005) and
studies with isolated tomato fruit cuticles (Bargel and Neinhuis, 2005) suggest that their
relative contribution to tissue strength increases markedly during ripening; an idea that was
previously suggested by analyses of intact tomato fruits (Jackman and Stanley, 1994).
Taken together, a growing body of evidence suggests that, as with cell wall metabolism,
dynamic changes in the structure and composition of the fruit cuticle that lead to a
reduction in fruit firmness are likely to be an integral and regulated part of ripening. The
influence of the cuticle on fruit firmness would be both direct, acting as a load bearing
matrix under tension, and indirect by regulating fruit water status. We note that our
19 www.plantphysiol.orgon June 29, 2018 - Published by Downloaded from
Copyright © 2007 American Society of Plant Biologists. All rights reserved.

conclusions are based exclusively on studies with tomato and do not necessarily apply to
all fruits.
While the goal of this current study was not to identify the components of the
cuticle that are responsible for water permeance of the cuticle, DFD provides a valuable
experimental system to address this question. Two features of DFD cuticle composition are
particularly noteworthy and may provide some indication as the basis for the drastically
reduced water permeance. Firstly, the cutin matrix appears to be substantially denser and
the consequent change in cuticle architecture and macromolecular packing may influence
water permeability. Secondly, while the cuticles of most ripe tomatoes contain high levels
of the flavonoid precursor naringenin chalcone (Bauer et al., 2004b), this compound was
undetectable in DFD cuticles, which were therefore colorless. It has been suggested that
this molecule can influence water permeability through the cuticle (Luque et al., 1995),
although this has yet to be confirmed. Interestingly, it was recently reported that the cuticle
of the non-ripening nor mutant has a similar colorless phenotype (Bargel and Neinhuis,
2004), which we have confirmed, although cuticles of another pleiotropic non-ripening
mutant, rin, accumulated normal levels of naringenin chalcone (data not shown).
DFD is of obvious interest for agricultural biotechnology; a field that has to date
focused almost exclusively on cell wall metabolism in an attempt to alter fruit softening
and prolong shelf life. Our study reveals the clear distinction between complex textural
changes in the pericarp flesh (sometimes called ‘softening’), which would be directly
affected by wall metabolism, and the reduction in firmness of intact fruits, which is
influenced by multiple factors, including the cuticle. The lack of progress in extending
intact fruit firmness and quality by primarily targeting wall metabolism may partly reflect
an under-appreciation of this difference. Future research will be directed towards
identifying the molecular elements that underlie the drastic reduction in water loss and
apparently provide resistance to postharvest pathogens. Preliminary genetic analysis using
a Solanum pimpinellifolium mapping population has revealed the existence of a single
genetic locus that makes a major contribution to the DFD trait (data not shown) and the
functional characterization of a candidate gene that cosegregates with that locus is
20 www.plantphysiol.orgon June 29, 2018 - Published by Downloaded from
Copyright © 2007 American Society of Plant Biologists. All rights reserved.
currently in progress. In addition, as a control, the DFD trait is being introgressed into the
Ailsa Craig cultivar for further detailed phenotypic characterization.
MATERIALS AND METHODS
Plant Materials
Tomato fruit (Solanum lycopersicum cv. Ailsa Craig [AC] and Delayed Fruit
Deterioration [DFD]) plants were greenhouse grown at Cornell under 16 h light, 8 h dark
conditions, using standard practices. Fruits were harvested at the following stages: mature
green (MG), breaker (Br), turning (Tu), pink (Pi), light red (LR) and red ripe (RR) based
on external color, as described in Lashbrook et al. (1994). Fruits were designated as over-
ripe (OR) 1 week after reaching the RR stage. Flowers were tagged on the day of anthesis
to monitor the developmental time course for each tomato cultivar. For the cellular turgor
analyses plants were similarly grown and staged in the greenhouse in Davis, California.
Fruits at the RR stage were stored at room temperature and ambient humidity or at high
humidity in a sealed container for the microbial infection experiments. For the
physiological and microbial infection studies, fruits were harvested at the appropriate stage
immediately prior to analysis. For gene expression analysis, pericarp tissue was isolated at
different stages and frozen immediately in liquid nitrogen and then stored at –80ºC.
Respiration Rate and Ethylene Production Measurements
Six AC and DFD fruit were harvested at the MG stage and kept at 20ºC. CO2 and
ethylene production of each fruit was measured by sealing individual fruit of known
weight for 2 h in 475 mL glass jars fitted with sampling septa, on a daily basis for 9 or 21
days for AC or DFD, respectively. CO2 concentrations in 1 mL samples of the headspace
of each jar were measured using a Fisher Gas Partitioner (Model 1200) gas chromatograph
(Fisher Scientific, Springfield, NJ) equipped with a thermal conductivity detector. Ethylene
concentrations were measured using a Hewlett Packard 5710A gas chromatograph
(Hewlett Packard, Palo Alto, CA) equipped with a flame ionization detector. Fruit color
21 www.plantphysiol.orgon June 29, 2018 - Published by Downloaded from
Copyright © 2007 American Society of Plant Biologists. All rights reserved.

was measured using a Minolta CR300 color meter (Konica Minolta, Mahwah, NJ),
expressing color change using the “a*” chromaticity coordinate (CIE, 1978).
Textural Analysis
Firmness measurements were made, based on compression of AC and DFD intact
fruits (minimum of 5 replicate fruits), at MG, Br, Pi, RR and RR plus 2 or 8 months. Each
fruit was tested four times at equidistant points along the equatorial plane of the fruit with
a 50 mm wide P50 DIA compression plate controlled by a Stable Microsystems Texture
Analyser (TA-XT2i – Stable Micro Systems, Godalming, Surrey, UK), loading at 1 mm s–1
and compressed to a vertical displacement of 1 mm. Firmness was defined as the response
force to a 0.05 N applied force. Fruits at the RR stage were detached, stored at room
temperature and analyzed after 60, 90 and 120 days for DFD and after 60 days for AC. To
compare flesh firmness with compression of whole fruits, pericarp disks (1.5 cm diameter)
were excised from the same fruit set with a cork borer and placed cuticle face-up and tested
as above. To determine the maximum force required to perforate the cuticle, segments of
tomato pericarp were placed cuticle face-down on a base plate with a vertical groove (3
mm wide) and the 1mm probe applied until the cuticle was penetrated (40 replicates for
each fruit stage). Statistical analysis was performed using SAS software (SAS Institute,
Cary, NC) and the Tukey–Kramer multiple comparison test.
The time-lapse video (Supplemental Video 1) was generated by taking a digital
photograph (0.25 s exposure) of two AC fruits and one DFD fruit harvested at the MG
stage and left to ripen at room temperature, every 10 mins for approximately 4 months.
Images were edited and compressed using Avid Xpress video editing software (Avid
Technology, Inc. Tewksbury, MA).
Cell Wall Analysis
Cell walls were prepared from 50 g of diced outer pericarp of AC and DFD fruit
(MG and RR stages) by boiling the pericarp pieces in 95% ethanol for 30 min. to prevent
autolytic activity, as described in Huysamer et al. (1997). Subsequent steps in preparing
22 www.plantphysiol.orgon June 29, 2018 - Published by Downloaded from
Copyright © 2007 American Society of Plant Biologists. All rights reserved.
crude cell wall samples (alcohol-insoluble solids, AIS) were also as in Huysamer et al.
(1997), ending with 2 washes of the wall pellets with acetone and drying in a vacuum
oven. Starch was removed by incubating 200 mg of AIS with 40 units each of α-amylase
(from porcine pancreas, Sigma-Aldrich Corp. St. Louis, MO) and pullulanase (from
Bacillus acidopullulyticus, Novozymes Biologicals Inc., Salem VA) in 20 mL of Tris-HCl
pH 7.0, 0.1% NaN3, for 24 h. Neutral sugar composition of the AIS was determined b GLC
as in Campbell et al. (1990). Duplicate 2-3 mg samples of AIS were hydrolyzed in TFA
and the TFA-soluble faction converted to alditol acetates and analyzed by GLC (as in Rose
et al., 1998). To measure the cellulose content of the AIS, the TFA-insoluble residues were
dissolved in 67% H2SO4 and assayed using the anthrone reagent (Dische, 1962) with
cellulose powder as a standard. Total uronic acids were determined using duplicate
samples of the AIS with the Blumenkrantz and Asboe-Hansen (1973) assay, as modified
by Ahmed and Labavitch (1977).
For the size exclusion chromatography analysis the AIS was treated with water-
and 50 mM CDTA (Rose et al., 1998). The water and CDTA-soluble materials (3-4mg)
were dissolved in 50 mM ammonium formate, pH 5 (500 µL), centrifuged to remove
insoluble material and the soluble material analyzed by size-exclusion chromatography
using a Superose-12 HR10/30 column (GE Healthcare, Piscataway, NJ). The column was
eluted at 0.6 mL min-1 with 50 mM ammonium formate, pH 5, using a Dionex BioLc
(Dionex, Sunnyvale, CA). The eluant was monitored with a Knauer (Knauer, Berlin,
Germany) differential refractometer.
RNA Isolation and Analysis
Total RNA was isolated from pericarp fruit tissues as described in Wan and
Wilkins (1994). 15 μg per samples were subjected to electrophoresis on 1.2% agarose,
10% formaldehyde gels and transferred to Hybond-N membranes (GE Healthcare) as
described in Rose et al. (1997). Blots were hybridized at 42°C in 50% formamide, 6X
SSPE, 0.5% (w/v) SDS, 5X Denhardt’s solution and 100 mg mL-1 sheared salmon sperm
DNA, with radiolabeled cDNA probes ([α-32P]-labeled cDNA) corresponding to the
23 www.plantphysiol.orgon June 29, 2018 - Published by Downloaded from
Copyright © 2007 American Society of Plant Biologists. All rights reserved.

ripening-related genes LeExp1 and SlXTH5 (see Saladié et al., 2006), LeExp3 (probe as
described in Brummell et al., 1999) and LePG1 (corresponding to the full length of
Genbank accession CAA32235). cDNAs were generated with the Ready-To-Go DNA
Labelling Beads ([α-32P]-dCTP) Kit and ProbeQuant G-50 Micro Columns (GE
Healthcare). Following hybridization, the membranes were washed three times in 5X SSC,
1% (w/v) SDS at 42°C for 15 min, followed by three washes in 0.2X SSC; 0.5% SDS at
65°C for 20 min.
Microscopy
Prior to microscopy pericarp thickness of AC and DFD fruits (15 replicates) was
measured with calipers. To evaluate the pericarp cell size differences, pericarp from MG
and RR stages were hand sectioned and viewed with a light microscope. Cell areas in the
outer, middle and inner pericarp zones (see Fig. 5) were calculated and statistical analyses
performed using Image-Pro Plus software (Media Cybernetics, Silver Spring, Maryland).
For light microscopy visualization of cuticles, cuticular membranes were peeled
from the fruits and fixed in formaldehyde:acetic acid 1:1 (v/v) in 18 volumes of 70%
alcohol (FAA) for 48 h, followed by dehydration in an alcohol series (50-10%) and a water
wash. Cuticle samples were frozen at -35ºC and 10 µm sections were cut with a microtome
and stained with 0.05% of Toluidine Blue. For transmission electron microscopy analysis
of cuticles and cell separation, pericarp from AC and DFD RR fruits was excised from
three replicate fruits at the equator at the red ripe stage and fixed for 1 h at room
temperature in primary fixative, containing 2.5% (v/v) glutaraldehyde and 2% (v/v)
formaldehyde in 0.05 M phosphate buffer, pH 6.8 (PB) (Karnovsky, 1965). Sections were
washed with PB and post-fixed for 1 h in 2% (v/v) osmium tetroxide in 0.05 M PB. After
washing with PB, the tissue slices were dehydrated through a gradient series of ethanol,
infiltrated with Spurr’s embedding medium (Electron Microscopy Science, Fort
Washington, PA) and polymerized for 48 h at 60ºC. Ultrathin (80-100 nm) sections were
prepared from Spurr’s resin-embedded samples and mounted on carbon-coated Formvar
100-mesh copper grids (Electron Microscopy Science). Sections were air-dried, stained at
24 www.plantphysiol.orgon June 29, 2018 - Published by Downloaded from
Copyright © 2007 American Society of Plant Biologists. All rights reserved.

room temperature with 2% (v/v) uranyl acetate for 5 min and then with lead citrate for 3
min prior to viewing with a Philips EM 400 electron microscope (FEI company, Hillsboro,
Oregon). Thick sections were also viewed using light microscopy.
For scanning electron microscopy analysis, pericarp from AC and DFD RR fruits
was freeze-dried in a VirTis Freeze-mobile (VirTis Company, Inc., Gardiner, NY) at -
40ºC, mounted on aluminum stubs and sputter coated with gold/palladium using a BalTec
SCD 050 coater (Balzers Union; Lichtenstein). Microscopic observations were made with
a Hitachi S4500 scanning electron microscope (Hitachi High Technologies, Inc.
Pleasanton, CA). Images were acquired using Princeton Gamma Tech Imix software
(Princeton Gamma-Tech Instruments Inc., Rocky Hill, NJ).
Turgor Analysis
Measurements of the turgor pressure of outer pericarp cells from detached intact
AC and DFD fruits during ripening were performed as described in Shackel et al. (1991)
by inserting a glass microcapillary into the pericarp cells located approximately 200μm
below the epidermal surface of intact fruits (Fig. 6a inset), monitoring the probe location
through a vertically illuminated microscope. Fruit ripening stage was evaluated by
measuring external color at the equator point using a using a Minolta CR300 reflectance
colorimeter to determine the a*, or red-green, component of the CIE L*a*b* uniform color
space. Values for the MG, Br, RR and over-ripe (OR) stages corresponded to a* values of
approximately –7 to -3, 5 to 6, 14 to 16 and ≥20, respectively.
Water Loss Measurements
Ten fruits from AC and DFD were detached at the RR stage and kept at room
temperature for 3 months. Water loss per unit fruit surface area was calculated after
measuring the weight decrease over time and measuring fruit dimensions.
Biomechanical Analysis of Cuticles
Rectangular strips of cuticle were removed from mature green (MG) and red ripe
(RR) AC and DFD fruits using two parallel razor blades bonded to a metal block to give
25 www.plantphysiol.orgon June 29, 2018 - Published by Downloaded from
Copyright © 2007 American Society of Plant Biologists. All rights reserved.

uniform segments with a width of 6.25 mm and incubated in a mixture of cellulase and
pectinase (0.2% m/v and 20% m/v, respectively; Sigma) in sodium citrate buffer (50 mM,
pH 4.0), 1 mM NaN3 for 7-10 days at 37ºC followed by washes in sodium citrate buffer
and dried at room temperature. A minimum of 8 samples from each ripening stage was
tested in unaxial tension using a model 4502 Instron Testing Machine (Instron, Norwood,
MA) and a 2.0 mm s-1 strain rate (see Matas et al., 2004). Data were rejected from samples
that broke near or at their clamped ends; visual inspection of specimens during testing and
of the shape of force-deformation graphs was used to assess clamp failure. From the tensile
test, the breaking stress and the breaking strain were derived from stress-strain curves.
Tensile stresses were calculated after the cross sectional areas of mechanically tested
samples were assessed using light microscope images and ImageJ image analysis software
(http://rsb.info.nih.gov/ij) to determine the thickness of each sample. The exposed length
of each sample was measured before extension with a hand-held microcaliper to determine
tensile strains. All biomechanical analyses were performed in an air-conditioned laboratory
and thus at constant temperature (24ºC) and humidity since these factors can influence the
cuticle biomechanical properties.
Cutin Monomer Analysis
Cuticles were enzymatically isolated (Schönherr and Riederer, 1986) from tomato
fruit pericarp disks of known area incubated at 30ºC in 20 mM citric acid, pH 3.7
containing 0.001% (w/v) phenylmercuric nitrate to prevent microbial growth. After 72 h
cuticles were washed in an acetone series and refluxed for 24 h in a Soxhlet apparatus with
chloroform:methanol (1:1) and 50 mg L-1 butylated hydroxytoluene. After washing with
methanol to remove chloroform, the cuticles were depolymerized in 8 mL anhydrous
methanol containing 7.5% (v/v) methyl acetate and 4.5% (w/v) sodium methoxide at 60ºC
(Bonaventure et al., 2004). Methyl heptadecanoate and ω-pentadecalactone were added as
internal standards. After 16 h the reaction was cooled, adjusted to pH 4-5 with acetic acid,
followed by two dichloromethane extractions (10 mL) to remove methyl ester monomers
(Bonaventure et al., 2004). The organic phase was washed three times with 0.9% NaCl
(w/v), dried with 2,2-dimethoxypropane and dried under nitrogen gas. Monomers were
26 www.plantphysiol.orgon June 29, 2018 - Published by Downloaded from
Copyright © 2007 American Society of Plant Biologists. All rights reserved.
derivatized by reaction for 15 min at 100ºC with pyridine:BSTFA [N,O,-
bis(trimethylsilyl)-trifluoroacetamide] (1:1). The excess pyridine:BSTFA was removed
with nitrogen gas, and the sample dissolved in heptane:toluene (1:1) prior to analysis with
a Hewlett-Packard 5890 series II gas chromatograph (GC) equipped with a flame
ionization detector and 12 m, 0.2 mm id HP-1 capillary column with helium as the carrier
gas. The GC was programmed with an initial temperature of 80ºC and increased at 15ºC
min-1 to 200ºC, then increased at 2ºC min-1 to 280ºC. Quantification was based on flame
ionization detector peak areas and internal standard methyl heptadecanoate. Specific
correction factors were developed from multi-level calibration curves (as for wax analysis,
Jenks et al., 1995) developed from external standards hexadecanoic acid, hexadecane-1,16-
dioic acid, 16-hydroxy hexadecanoic acid and octadecanoic acid (Aldrich). All values
shown in tables represent the average of three replicate samples. Selected sub-samples
were analyzed in a gas chromatograph-mass spectrometer (FinniganMAT/Thermospray
Corporation, San Jose, CA) to confirm the identities of some derivatives.
All cutin monomers were identified from electron impact mass spectrometry of the
methyl ester TMS derivatives on the basis of the published spectra (Eglinton and
Hunneman, 1968; Holloway, 1982), retention indexes (Holloway, 1984), and retention
times of the authentic standards hexadecanoic acid, hexadecane-1,16-dioic acid, 16-
hydroxy hexadecanoic acid, and octadecanoic acid.
Cuticular Wax Analysis
Based on Jenks et al. (1995), the chloroform-soluble cuticular wax extracts from
tomato pericarp samples of known area were evaporated to dryness under a stream of
nitrogen gas and the dried residue prepared for gas chromatography by derivatization using
BSTFA (N,O-bis(trimethylsilyl)-trifluoroacetamide). Extracts were derivatized for 15 min
at 100ºC. After evaporation of excess BSTFA under nitrogen, the samples were
redissolved in hexane for GC analysis with a Hewlett-Packard 5890 series II gas
chromatograph (GC), equipped with a flame ionization detector and a 12 m, 0.2 mm HP-1
capillary column with helium as the carrier gas. The GC was programmed with an initial
temperature of 80ºC and increased at 15ºC min-1 to 260ºC, where the temperature remained
27 www.plantphysiol.orgon June 29, 2018 - Published by Downloaded from
Copyright © 2007 American Society of Plant Biologists. All rights reserved.

unchanged for 10 min. The temperature was then increased at 5ºC min-1 to 320ºC, then
held for 15 min. Quantification was based on flame ionization detector peak areas and the
internal standard hexadecane. Specific correction factors were developed from external
standards and applied to the peak areas of the free fatty acids, saturated primary alcohols
and odd chain-length n-alkanes. For all other peaks, a factor of 1.03 was assigned (the
average correction for external standards at comparable concentrations). The total amount
of cuticular wax was expressed per pericarp area as determined by measuring scanned
pericarp areas using Image J 1.32j (NIH). All values represent the average of three
replicate plant samples. Selected sub-samples were analyzed by GC-MS. Because
tritriacontane and delta amyrin co-eluted during the above GC analysis, an additional GC
analysis was performed for each sample using a temperature program to separate these
constituents. The GC was programmed with an initial temperature of 80ºC and increased at
15ºC min-1 to 220ºC, held for 65 min, then increased 15ºC min-1 to 320ºC, then for held 10
min. A ratio was calculated for tritriacontane and delta amyrin to determine the amount of
tritriacontane and delta amyrin.
GC-MS Analysis of Flavonoids
Lipophillic components were determined following minor modification to the
method described by Fiehn et al. (2000). For metabolite analysis mass-spectral peaks were
compared to mass spectral libraries in the Golm Metabolome Database (Kopka et al., 2005;
Schauer et al., 2005).
Microbial Inoculation and Infection
Fruits from AC and DFD at the RR stage were stored at room temperature in a
moist container to assess opportunistic microbial infection. RR fruits from DFD, AC and a
commercially purchased cultivar were inoculated with three concentrations of Botrytis
cinerea (strain Del 11) spores (103, 106 and 108) by ectopic application onto the fruit
surface or by injecting immediately underneath the cuticle surface. Fruits were stored in
moist sealed boxes at room temperature.
28 www.plantphysiol.orgon June 29, 2018 - Published by Downloaded from
Copyright © 2007 American Society of Plant Biologists. All rights reserved.

Statistical Analyses
All statistical analyses were performed using the JMP software package (SAS
Institute, Cary, NC). All comparisons among means (t-test; α = 0.05) were used to
determine differences between the cultivars (see figure legends for each n value). Data are
presented as means and the SE with a level of significance of 5% (P= 0.05), unless
otherwise other noted.
ACKNOWLEDGMENTS
We thank Yonghua He and Carl Greve (fruit staging and analysis), Randy Wayne
and Dominick Paolillo (light microscopy), Hamid Ahmadi (turgor pressure), Kent Loeffler
(photography), Stefan Einarson (time lapse photography), Christopher Hogan (Instron
evaluation), David Kidd (textural analysis) and Jackie Nock (ethylene and carbon dioxide
measurements). We also thank Josep Saladié and Ann Powell for providing seeds and
Botrytis cinerea cultures, respectively, and we are grateful to Antonio Heredia, Jim
Giovannoni and Steve Tanksley for helpful advice and discussion.
29 www.plantphysiol.orgon June 29, 2018 - Published by Downloaded from
Copyright © 2007 American Society of Plant Biologists. All rights reserved.

LITERATURE CITED
Ahmed AER, Labavitch JM (1977) A simplified method for accurate determination of
cell wall uronic acid content. J Food Biochem 1: 361-365
Almeida DPF, Huber DJ (1999) Apoplastic pH and inorganic ion levels in tomato fruit:
A potential means for regulation of cell wall metabolism during ripening. Physiol Plant
105: 506-512
Baker EA, Bukovac MJ, Hunt GM (1982) Composition of tomato fruit cuticle as related
to fruit growth and development. In DF Cutler, KL Alvin, CE Price, eds, The Plant Cuticle.
Academic Press, London, pp 33-44
Banik M, Bourgault R, Bewley JD (2001) Endo-β-mannanase is present in an inactive
form in ripening tomato fruits of the cultivar Walter. J. Exp. Bot. 52: 105-111
Bargel H, Neinhuis C (2004) Altered tomato (Lycopersicon esculentum Mill.) fruit cuticle
biomechanics of a pleiotropic non ripening mutant. J Plant Growth Regul 23: 61-75
Bargel H, Neinhuis C (2005) Tomato (Lycopersicon esculentum Mill.) fruit growth and
ripening as related to the biomechanical properties of fruit skin and isolated cuticle. J Exp
Bot 56: 1049-1060
Barrett DM, Garcia E, Wayne JE (1998) Textural modification of processing tomatoes.
Crit Rev Food Sci Nutr 38: 173-258
Bauer S, Schulte E, Thier HP (2004) Composition of the surface wax from tomatoes - I.
Identification of the components by GC/MS. Eur Food Res Technol 219: 223-228
Bauer S, Schulte E, Thier HP (2004) Composition of the surface wax from tomatoes - II.
Quantification of the components at the ripe red stage and during ripening. Eur Food Res
Technol 219: 487-491
Benitez JJ, Matas AJ, Heredia A (2004) Molecular characterization of the plant
biopolyester cutin by AFM and spectroscopic techniques. J Struct Biol 147: 179-184
30 www.plantphysiol.orgon June 29, 2018 - Published by Downloaded from
Copyright © 2007 American Society of Plant Biologists. All rights reserved.

Blumenkrantz N, Asboe-Hansen G (1973) New method for quantitative-determination of
uronic acids. Anal Biochem 54: 484-489
Blumer JM, Clay RP, Bergmann CW, Albersheim P and Darvill, A. (2000)
Characterization of changes in pectin methylesterase expression and pectin esterification
during tomato fruit ripening. Can. J. Bot. 78: 607-618
Bonaventure G, Beisson F, Ohlrogge J, Pollard M (2004) Analysis of the aliphatic
monomer composition of polyesters associated with Arabidopsis epidermis: occurrence of
octadeca-cis-6, cis-9-diene-1,18-dioate as the major component. Plant J 40: 920-930
Brownleader MD, Jackson P, Mobasheri A, Pantelides AT, Sumar S, Trevan M, Dey
PM (1999) Molecular aspects of cell wall modifications during fruit ripening. Crit Rev
Food Sci Nutr 39: 149-164
Brummell DA (2006) Cell wall disassembly in ripening fruit. Funct Plant Biol 33: 103-
119
Brummell DA, Harpster MH (2001) Cell wall metabolism in fruit softening and quality
and its manipulation in transgenic plants. Plant Mol Biol 47: 311-340
Brummell DA, Harpster MH, Dunsmuir P (1999) Differential expression of expansin
gene family members during growth and ripening of tomato fruit. Plant Mol Biol 39: 161-
169
Burghardt M, Riederer M (2006) Cuticular transpiration. In M Riederer, C Müller, eds,
Biology of the Plant Cuticle: Annual Plant Reviews Series, Vol 23. Blackwell Publishing
Ltd., Oxford, pp 292-311
Cameron AC, Yang SF (1982) A simple method for the determination of resistance to
gas-diffusion in plant organs. Plant Physiol 70: 21-23
Campbell AD, Huysamer M, Stotz HU, Greve LC, Labavitch JM (1990) Comparison
of ripening processes in intact tomato fruit and excised pericarp Disks. Plant Physiol 94:
1582-1589
31 www.plantphysiol.orgon June 29, 2018 - Published by Downloaded from
Copyright © 2007 American Society of Plant Biologists. All rights reserved.

Carey AT, Holt K, Picard S, Wilde R, Tucker GA, Bird CR, Schuch W, Seymour GB
(1995) Tomato exo-(1→4)-β-D-galactanase. Isolation, changes during ripening in normal
and mutant tomato fruit, and characterization of a related cDNA clone. Plant Physiol. 108:
1099-1107
Casado CG, Heredia A (2001) Self-association of plant wax components: A
thermodynamic analysis. Biomacromol 2: 407-409
Cosgrove DJ (1993) Wall extensibility - Its nature, measurement and relationship to plant-
cell growth. New Phytol 124: 1-23
Davuluri GR, van Tuinen A, Fraser PD, Manfredonia A, Newman R, Burgess D,
Brummell DA, King SR, Palys J, Uhlig J, Bramley PM, Pennings HMJ, Bowler C
(2005) Fruit-specific RNAi-mediated suppression of DET1 enhances carotenoid and
flavonoid content in tomatoes. Nat Biotechnol 23: 890-895
Dharmapuri S, Rosati C, Pallara P, Aquilani R, Bouvier F, Camara B, Giuliano G
(2002) Metabolic engineering of xanthophyll content in tomato fruits. FEBS Lett 519: 30-
34
Dische Z (1962) Color reactions of carbohydrates. In RL Whistler, ML Wolfrom, eds,
Methods in Carbohydrate Chemistry, Vol 1. Academic Press, New York, pp 477-512
Edelmann HG, Neinhuis C, Bargel H (2005) Influence of hydration and temperature on
the rheological properties of plant cuticles and their impact on plant organ integrity. J Plant
Growth Regul 24: 116-126
Eglinton G, Hunneman DH (1968) Gas Chromatographic-Mass Spectrometric studies of
long chain hydroxy acids .I. Constituent cutin acids of apple cuticle. Phytochem 7: 313-
322
Eriksson EM, Bovy A, Manning K, Harrison L, Andrews J, De Silva J, Tucker GA,
Seymour GB (2004) Effect of the Colorless non-ripening mutation on cell wall
biochemistry and gene expression during tomato fruit development and ripening. Plant
Physiology 136: 4184-4197
32 www.plantphysiol.orgon June 29, 2018 - Published by Downloaded from
Copyright © 2007 American Society of Plant Biologists. All rights reserved.

Fiehn O, Kopka J, Trethewey RN, Willmitzer L (2000) Identification of uncommon
plant metabolites based on calculation of elemental compositions using gas
chromatography and quadrupole mass spectrometry. Anal Chem 72: 3573-3580
Fraser PD, Bramley PM (2004) The biosynthesis and nutritional uses of carotenoids.
Prog Lipid Res 43: 228-265
Giovannoni JJ (2004) Genetic regulation of fruit development and ripening. Plant Cell
16: S170-S180
Guillén F, Castillo S, Zapata PJ, Martínez-Romero D, Valero D, Serrano M (2006)
Efficacy of 1-MCP treatment in tomato fruit 2. Effect of cultivar and ripening stage at
harvest. Postharvest Biol Technol 42: 235-242
Harker FR, Redgwell RJ, Hallett IC, Murray SH, Carter G (1997) Texture of fresh
fruit. Hort. Rev. 20: 121-124
Holloway PJ (1982) The chemical constitution of plant cutins. In DF Cutler, KL Alvin,
CE Price, eds, The Plant Cuticle. Academic Press, London, pp 45-85
Holloway PJ (1984) Cutins and suberins, the polymeric plant lipids. In HK Mangold, G
Zweig, J Sherma, eds, CRC Handbook of Chromatography: Lipids, Vol 1. CRC Press,
Boca Raton, Florida, pp 321-345
Holt CB (1970) Measurement of tomato firmness with a universal testing machine. J Text.
Stud. 1: 491-501
Huysamer M, Greve LC, Labavitch JM (1997) Cell wall metabolism in ripening fruit.
IX. Synthesis of pectic and hemicellulosic cell wall polymers in the outer pericarp of
mature green tomatoes (cv XMT-22). Plant Physiol 114: 1523-1531
Jackman RL, Marangoni AG, Stanley DW (1992) The effects of turgor pressure on
puncture and viscoelastic properties of tomato tissue. J Text Stud 23: 491-505
Jackman RL, Stanley DW (1994) Influence of the skin on puncture properties of chilled
and nonchilled tomato fruit. J Text Stud 25: 221-230
33 www.plantphysiol.orgon June 29, 2018 - Published by Downloaded from
Copyright © 2007 American Society of Plant Biologists. All rights reserved.

Jackman RL, Stanley DW (1995) Creep behaviour of tomato pericarp tissue as
influenced by ambient temperature ripening and chilled storage. J Text Stud 26: 537-552
Jeffree CE (2006) The fine structure of the plant cuticle. In M Riederer, C Müller, eds,
Biology of the Plant Cuticle Annual Plant Reviews Series, Vol 23. Blackwell Publishing
Ltd., Oxford, pp 11-125
Jenks MA, Tuttle HA, Eigenbrode SD, Feldmann KA (1995) Leaf epicuticular waxes of
the Eceriferum mutants in Arabidopsis. Plant Physiol 108: 369-377
Jeong H, Huber DJ, Sargent SA (2003) Delay of avocado (Persea americana) fruit
ripening by 1-methylcyclopropene and wax treatments. Postharvest Biol Technol 28: 247-
257
Karnovsky MJ (1965) A formaldehyde-glutaraldehyde fixative of high osmolality for use
in electron microscopy. J Cell Biol 27: A137-&
Klee HJ (1993) Ripening physiology of fruit from transgenic tomato (Lycopersicon
esculentum) plants with reduced ethylene synthesis. Plant Physiol 102: 911-916
Kopeliovitch E, Mizrahi Y, Rabinowitch HD, Kedar N (1980) Physiology of the tomato
mutant Alcobaca. Physiol Plant 48: 307-311
Kopka J, Schauer N, Krueger S, Birkemeyer C, Usadel B, Bergmuller E, Dormann P,
Weckwerth W, Gibon Y, Stitt M, Willmitzer L, Fernie AR, Steinhauser D (2005)
[email protected]: the Golm Metabolome Database. Bioinform 21: 1635-1638
Lashbrook CC, Gonzalez-Bosch C, Bennett AB (1994) Two divergent endo-beta-1,4-
glucanase genes exhibit overlapping expression in ripening fruit and abscising flowers.
Plant Cell 6: 1485-1493
Lewinsohn E, Schalechet F, Wilkinson J, Matsui K, Tadmor Y, Nam KH, Amar O,
Lastochkin E, Larkov O, Ravid U, Hiatt W, Gepstein S, Pichersky E (2001) Enhanced
levels of the aroma and flavor compound S-linalool by metabolic engineering of the
terpenoid pathway in tomato fruits. Plant Physiol 127: 1256-1265
34 www.plantphysiol.orgon June 29, 2018 - Published by Downloaded from
Copyright © 2007 American Society of Plant Biologists. All rights reserved.

Lin TT, Pitt RE (1986) Rheology of apple and potato tissue as affected by cell turgor
pressure. J Text Stud 17: 291-313
Lu C, Zainal Z, Tucker GA, Lycett GW (2001) Developmental abnormalities and
reduced fruit softening in tomato plants expressing an antisense Rab11 GTPase gene. Plant
Cell 13: 1819-1833
Luque P, Bruque S, Heredia A (1995) Water permeability of isolated cuticular
membranes - a structural-analysis. Arch Biochem Biophys 317: 417-422
Maclachlan G, Brady C (1994) Endo-1,4-β-glucanase, xyloglucanase, and xyloglucan
endo-transglycosylase activities versus potential substrates in ripening tomatoes. Plant
Physiol 105: 965-974
Matas AJ, Cobb ED, Bartsch JA, Paolillo DJ, Niklas KJ (2004) Biomechanics and
anatomy of Lycopersicon esculentum fruit peels and enzyme-treated samples. Amer J Bot
91: 352-360
Mendgen K, Hahn M, Deising H (1996) Morphogenesis and mechanisms of penetration
by plant pathogenic fungi. Ann Rev Phytopathol 34: 367-386
Mignani I, Greve LC, Benarie R, Stotz HU, Li CY, Shackel KA, Labavitch JM (1995)
The effects of GA(3) and divalent-cations on aspects of pectin metabolism and tissue
softening in ripening tomato pericarp. Physiol Plant 93: 108-115
Muir SR, Collins GJ, Robinson S, Hughes S, Bovy A, De Vos CHR, van Tunen AJ,
Verhoeyen ME (2001) Overexpression of petunia chalcone isomerase in tomato results in
fruit containing increased levels of flavonols. Nat Biotechnol 19: 470-474
Mutschler MA (1984) Ripening and storage characteristics of the Alcobaca ripening
mutant in tomato. J Amer Soc Hort Sci 109: 504-507
Niklas KJ (1992) Plant biomechanics: an engineering approach to plant form and function.
University of Chicago Press, Chicago
35 www.plantphysiol.orgon June 29, 2018 - Published by Downloaded from
Copyright © 2007 American Society of Plant Biologists. All rights reserved.

Orfila C, Huisman MMH, Willats WGT, van Alebeek G, Schols HA, Seymour GB,
Knox JP (2002) Altered cell wall disassembly during ripening of Cnr tomato fruit:
implications for cell adhesion and fruit softening. Planta 215: 440-447
Petracek PD, Bukovac MJ (1995) Rheological properties of enzymatically isolated
tomato fruit cuticle. Plant Physiol 109: 675-679
Riederer M, Schreiber L (2001) Protecting against water loss: analysis of the barrier
properties of plant cuticles. J Exp Bot 52: 2023-2032
Romer S, Fraser PD, Kiano JW, Shipton CA, Misawa N, Schuch W, Bramley PM
(2000) Elevation of the provitamin A content of transgenic tomato plants. Nat Biotechnol
18: 666-669
Rose JKC, Hadfield KA, Labavitch JM, Bennett AB (1998) Temporal sequence of cell
wall disassembly in rapidly ripening melon fruit. Plant Physiol 117: 345-361
Rose JKC, Lee HH, Bennett AB (1997) Expression of a divergent expansin gene is fruit-
specific and ripening-regulated. Proc Natl Acad Sci USA 94: 5955-5960
Rose JKC, Catalá C, Gonzalez-Carranza CZH, Roberts JA (2003) Plant cell wall
disassembly. In JKC Rose, ed, The plant cell wall, Vol 8. Blackwell Publishing Ltd,
Oxford, UK, pp 264-324
Ruan YL, Patrick JW, Brady CJ (1996) The composition of apoplast fluid recovered
from intact developing tomato fruit. Aust J Plant Physiol 23: 9-13
Saladié M, Rose JKC, Cosgrove DJ, Catalá C (2006) Characterization of a new
xyloglucan endotransglucosylase/hydrolase (XTH) from ripening tomato fruit and
implications for the diverse modes of enzymic action. Plant J 47: 282-295
Schauer N, Semel Y, Roessner U, Gur A, Balbo I, Carrari F, Pleban T, Perez-Melis A,
Bruedigam C, Kopka J, Willmitzer L, Zamir D, Fernie AR (2006) Comprehensive
metabolic profiling and phenotyping of interspecific introgression lines for tomato
improvement. Nat Biotechnol 24: 447-454
36 www.plantphysiol.orgon June 29, 2018 - Published by Downloaded from
Copyright © 2007 American Society of Plant Biologists. All rights reserved.
Schauer N, Steinhauser D, Strelkov S, Schomburg D, Allison G, Moritz T, Lundgren
K, Roessner-Tunali U, Forbes MG, Willmitzer L, Fernie AR, Kopka J (2005) GC-MS
libraries for the rapid identification of metabolites in complex biological samples. FEBS
Lett 579: 1332-1337
Schonherr J, Riederer M (1986) Plant cuticles sorb lipophilic compounds during
enzymatic isolation. Plant Cell Environ 9: 459-466
Schreiber L (2005) Polar paths of diffusion across plant cuticles: New evidence for an old
hypothesis. Annal Bot 95: 1069-1073
Schreiber L (2006) Characterization of polar paths of transport in plant cuticles. In M
Riederer, C Müller, eds, Biology of the Plant Cuticle: Annual Plant Reviews Series, Vol
23. Blackwell Publishing Ltd., Oxford, pp 280-291
Schuelter AR, Finger FL, Casali VWD, Brommonschenkel SH, Otoni WC (2002)
Inheritance and genetic linkage analysis of a firm-ripening tomato mutant. Plant Breed
121: 338-342
Seymour GB, Manning K, Eriksson EM, Popovich AH, King GJ (2002) Genetic
identification and genomic organization of factors affecting fruit texture. J Exp Bot 53:
2065-2071
Shackel KA, Greve C, Labavitch JM, Ahmadi H (1991) Cell turgor changes associated
with ripening in tomato pericarp tissue. Plant Physiol 97: 814-816
Thompson AJ, Tor M, Barry CS, Vrebalov J, Orfila C, Jarvis MC, Giovannoni JJ,
Grierson D, Seymour GB (1999) Molecular and genetic characterization of a novel
pleiotropic tomato-ripening mutant. Plant Physiol 120: 383-389
Vega A, Luza J, Espina S, Lizana LA (1991) Characterization of the epidermis of three
blueberry (Vaccinium corymbosum L.) cultivars and water loss at different storage
temperatures. Proc Interam Soc Tropic Hort 35: 263-274
Waldron KW, Parker ML, Smith AC (2003) Plant cell walls and food quality. Comp
Rev Food Sci Food Safety 2: 101-119
37 www.plantphysiol.orgon June 29, 2018 - Published by Downloaded from
Copyright © 2007 American Society of Plant Biologists. All rights reserved.

Wallner SJ, Bloom HL (1977) Characteristics of tomato cell wall degradation in vitro.
Implications for the study of fruit-softening enzymes. Plant Physiol. 60: 207-210
Wan CY, Wilkins TA (1994) A modified hot borate method significantly enhances the
yield of high-quality RNA from cotton (Gossypium hirsutum L). Anal Biochem 223: 7-12
38 www.plantphysiol.orgon June 29, 2018 - Published by Downloaded from
Copyright © 2007 American Society of Plant Biologists. All rights reserved.

FIGURE LEGENDS
Figure 1. Comparison of Ailsa Craig (AC) and Delayed Fruit Deterioration (DFD) fruit
phenotypes. Developmental series of (A) AC fruits and (B) DFD fruits. C, DFD (left
group) and AC (right group) fruits after 4 months of storage at room temperature. Scale
bar= 2 cm. D, DFD tomatoes bisected after 3 (left), 6 (middle) and 7 (right) months of
storage at room temperature. Scale bar= 1 cm.
Figure 2. Ripening-related traits in Ailsa Craig (AC) and DFD fruits. Ethylene (A) and
carbon dioxide (B) production by ripening AC and DFD fruits detached at the mature
green (MG) stage. C, Evaluation of external ripening-related color change of AC and DFD
fruits. (for C and D, mean +/- SE, n= 20). D, Total soluble solids in the pericarp of AC
(black bars) and DFD (white bars) fruits at the MG, breaker (Br), pink (Pi) and red ripe
(RR) stages, measured using a refractometer.
Figure 3. Textural analysis of tomato fruits. Compression test of (A) intact tomato fruit
and (B) excised pericarp segments. C, Penetration analysis of combined pericarp and
cuticle. Fruits and pericarp segments from AC and DFD were tested at mature green (MG),
breaker (Br), pink (Pi) and red ripe (RR) stages and at RR plus 2 or 8 months (RR+2 or
RR+8, respectively). Asterisks indicate statistically significance differences (mean +/- SE,
n=20, p<0.001).
Figure 4. Cell wall analysis and wall metabolism-related gene expression. Relative
amounts of cell wall pellet (A), uronic acid (UA; wall dry weight basis) content (B),
cellulose content (C) and neutral sugar composition ([D] mole % of total wall non-
cellulosic neutral sugars) of isolated pericarp from AC and DFD fruits at the MG (white
bars) and RR (gray bars) stages. For D, individual sugars comprised rhamnose (Rha),
arabinose (Ara), xylose (Xyl), mannose (Man), galactose (Gal) and glucose (Glc). E, Size
exclusion chromatography of water-soluble pectins from AC and DFD fruits at the MG
and RR stages. Molecular mass calibration markers (kDa) are shown at the top. F, RNA
39 www.plantphysiol.orgon June 29, 2018 - Published by Downloaded from
Copyright © 2007 American Society of Plant Biologists. All rights reserved.

gel blot analysis of polygalacturonase (LePG1), expansins (LeExp1, LeExp3) and
xyloglucan endotransglucosylase/hydrolase (SlXTH5) expression in DFD and AC pericarp.
Lanes 1 to 5 correspond to the ripening stages mature green (MG), breaker (Br), pink (Pi),
red ripe (RR) and over ripe (OR), respectively. Ethidium bromide-stained rRNA in the
same gel is shown as a loading control.
Figure 5. Pericarp and cell size measurements. A, Pericarp width of Ailsa Craig (AC) and
DFD fruits at the mature green (MG), breaker (Br), pink (Pi) and red ripe (RR) stages.
Asterisks indicate statistically significance differences (mean +/- SE, n= 20). B, Bisected
RR tomato illustrating the three pericarp zones in which cell size was measured. The
adjacent light microscopy photographs show cells in zone 1 and the cuticular layer (CL)
from DFD and AC fruits at the MG and RR stages. C, Cell cross-sectional area in the three
pericarp zones.
Figure 6. Pericarp cellular turgor pressure evaluation and fruit water loss. A, Turgor
pressure of outer pericarp cells from Ailsa Craig (AC) and DFD fruits at different ripening
stages, as determined by external color (a* index value). The color ranges of mature green
(MG), breaker (Br), red ripe (RR) and over ripe (OR) fruit are shown. A smoothing spline
regression curve and the mean and SE (n³ 5) is shown for each cultivar. A photograph of
the microprobe (white arrow) penetrating the cuticular layer (CL) and an outer pericarp
cell is shown inset. B, Percentage water loss from detached AC and DFD fruits over a 3
month period after reaching the RR stage (mean +/- SE, n= 10).
Figure 7. Microscopy analyses of Ailsa Craig and DFD fruit cuticles. Light microscopy
images without (A, B) or with (C, D) Toluidine Blue O staining and TEM (E, F) and SEM
(G, H) images of AC (A, C, E, G) and DFD (B, D, F, H) red ripe stage cuticles and outer
pericarp. CL, cuticular layer; CW, cell wall; cytosol, Cyt. The arrow in F indicates a thin
membranous layer on the DFD fruit cuticle surface. Scale bars for A-D = 5 µm, E and F =
0.5µm, G = 10 µm and H = 50 µm.
40 www.plantphysiol.orgon June 29, 2018 - Published by Downloaded from
Copyright © 2007 American Society of Plant Biologists. All rights reserved.

Figure 8. Instron analysis of isolated tomato fruit cuticles. The yield stress (A) and yield
strain (B) of cuticles from Ailsa Craig (AC) and DFD fruit at the mature green (MG) and
red ripe (RR) stages, evaluated with an Instron Testing Machine (asterisks indicate
statistically significance differences within a ripening stage; mean +/- SE, n= 20).
Figure 9. Microbial infection of Ailsa Craig (AC) and DFD fruits. A, Red ripe fruits from
AC (left side) and DFD (right side) stored for 5 months in high humidity and temperature
conditions. Ripe fruits from a commercial cultivar (B, E), AC (C, F) and DFD (D, G)
following inoculation with three concentrations of Botrytis cinerea spores through surface
penetrations (B, C, D) or applied ectopically (E, F, G).
Supplemental Data
Supplemental Figure 1. Microscopy analysis of tomato fruit pericarp cell separation.
Light microscopy images of AC (A) and DFD (B) red ripe (RR) fruit pericarp. TEM
analysis of AC (C) and DFD (D) RR fruit, highlighting intercellular separation, the cell
junction (CJ) and the cuticular layer (CL). Scale bars for A and B = 20 µm and for C and D
= 0.7µm.
Supplemental Material (Video) Legend. A time lapse video spanning 4 months showing
2 AC fruits (left and right) and 1 DFD fruit (middle) during storage at ambient temperature
and humidity.
41 www.plantphysiol.orgon June 29, 2018 - Published by Downloaded from
Copyright © 2007 American Society of Plant Biologists. All rights reserved.

Tables
Table I. Wax classes in Ailsa Craig and DFD fruit cuticles.
Class amount (μg dm-2 ± SD) and class percent (% ± SD) for tomato pericarp at the mature green (MG) and red ripe (RR) stages.
MG RR Wax Class Ailsa Craig DFD Ailsa Craig DFD acids 40.7 ± 7.4 64.1 ± 13.1 36.5 ± 10.7 43.0 ± 5.8% acids 6.7 ± 1.3 7.8 ± 0.2 4.0 ± 0.9 3.6 ± 0.4 aldehydes 8.7 ± 2.3 11.4 ± 5.6 32.5 ± 9.5 37.5 ± 7.6% aldehydes 1.4 ± 0.4 1.5 ± 0.9 3.5 ± 0.8 3.1 ± 0.4 n-alkan-1-ols 37.7 ± 17.5 76.9 ± 18.8 35.1 ± 5.5 53.8 ± 4.7% n-alkan-1-ols 6.3 ± 3.0 9.3 ± 0.8 3.8 ± 0.3 4.5 ± 0.5 n-alkadi(tri)en-1-olsa 4.4 ± 3.6 5.6 ± 1.2 31.8 ± 11.8 26.5 ± 3.1% n-alkadi(tri)en-1-ols 0.7 ± 0.6 0.7 ± 0.1 3.5 ± 1.1 2.2 ± 0.1 n-alkanes 336.8 ± 38.7 452.9 ± 87.4 534.2 ± 55.0 615.5 ± 63.3% n-alkanes 55.7 ± 4.8 55.1 ± 1.4 58.6 ± 1.6 51.1 ± 4.0 n-alkadienesb 2.2 ± 0.6 2.1 ± 0.3 17.9 ± 6.0 103.9 ± 35.7% n-alkadienes 0.4 ± 0.1 0.3 ± 0.1 2.0 ± 0.8 8.5 ± 2.1 iso-alkanes 34.7 ± 8.9 60.4 ± 10.0 31.9 ± 2.4 41.1 ± 9.1% iso-alkanes 5.7 ± 1.3 7.5 ± 1.5 3.5 ± 0.4 3.4 ± 0.8 anteiso-alkanes 3.4 ± 1.4 3.3 ± 0.6 3.4 ± 0.5 2.2 ± 0.4% iso-alkanes 0.6 ± 0.2 0.4 ± 0.1 0.4 ± 0.1 0.2 ± 0.0 amyrins 104.9 ± 10.5 102.2 ± 12.3 159.6 ± 11.6 242.3 ± 79.7% amyrins 17.4 ± 2.1 12.5 ± 0.8 17.6 ± 2.3 19.8 ± 4.7 unknowns 30.6 ± 8.5 41.5 ± 14.3 27.5 ± 2.2 46.5 ± 16.6% unknowns 5.1 ± 1.5 5.0 ± 0.9 3.0 ± 0.0 3.8 ± 0.9 Total 604.2 ± 21.1 820.5 ± 143. 910.5 ± 77.4 1212.1 ± 158.0aDouble bond position not determined. Position reported at ∆6,9cis/∆3,6,9cis (Bauer et al., 2004a, b). bDouble bond position not determined. Position reported at ∆6,9cis (Bauer et al., 2004a, b).
42 www.plantphysiol.orgon June 29, 2018 - Published by Downloaded from
Copyright © 2007 American Society of Plant Biologists. All rights reserved.

Table II. Wax composition of Ailsa Craig and DFD fruit cuticles. Individual wax constituent percentage (% ± SD) for tomato pericarp at the mature green (MG) and red ripe (RR) stages.
MG RR Wax Constituent Ailsa Craig DFD Ailsa Craig DFD acids hexadecanoic acid (C16) 3.6 ± 1.1 4.5 ± 0.2 0.6 ± 0.3 1.3 ± 0.3heptadecanoic acid (C17) 0.1 ± 0.0 0.2 ± 0.2 0.1 ± 0.0 0.0 ± 0.0octadecanoic acid (C18) 0.5 ± 0.2 0.7 ± 0.1 0.2 ± 0.1 0.3 ± 0.2eicosanoic acid (C20) 0.1 ± 0.1 0.4 ± 0.1 0.1 ± 0.0 0.2 ± 0.1docosanoic acid (C22) 0.3 ± 0.1 0.3 ± 0.2 0.2 ± 0.2 0.0 ± 0.0tetracosanoic acid (C24) 0.2 ± 0.1 0.2 ± 0.2 1.3 ± 0.5 0.6 ± 0.4hexacosanic acid (C26) 0.2 ± 0.3 0.1 ± 0.0 0.6 ± 0.2 0.2 ± 0.1octacosanic acid (C28) 1.3 ± 0.2 0.8 ± 0.2 0.3 ± 0.1 0.5 ± 0.1triacontanoic acid (C30) 0.5 ± 0.1 0.5 ± 0.1 0.5 ± 0.1 0.4 ± 0.1aldehydes tetracosanal (C24) 0.2 ± 0.2 0.2 ± 0.2 1.5 ± 0.7 0.6 ± 0.6hexacosanal (C26) 0.0 ± 0.0 0.0 ± 0.0 0.5 ± 0.1 0.1 ± 0.1octacosanal (C28) 0.0 ± 0.0 0.0 ± 0.0 0.1 ± 0.0 0.1 ± 0.0triacontanal (C30) 0.2 ± 0.2 0.4 ± 0.6 0.6 ± 0.3 1.0 ± 0.6dotriacontanal (C32) 1.0 ± 0.1 0.8 ± 0.1 0.8 ± 0.2 1.3 ± 0.3n-alkan-1-ols octadecan-1-ol (C18) 0.2 ± 0.2 0.1 ± 0.1 0.1 ± 0.0 0.1 ± 0.2eicosan-1-ol (C20) 0.1 ± 0.0 0.1 ± 0.1 0.2 ± 0.0 0.1 ± 0.0heneicosan-1-ol (C21) 0.0 ± 0.0 0.1 ± 0.0 0.1 ± 0.1 0.1 ± 0.0docosan-1-ol (C22) 0.2 ± 0.1 0.4 ± 0.0 0.2 ± 0.0 0.2 ± 0.1tricosan-1-ol (C23) 0.1 ± 0.1 0.1 ± 0.1 0.1 ± 0.1 0.2 ± 0.1tetracosan-1-ol (C24) 0.1 ± 0.1 0.1 ± 0.1 0.1 ± 0.1 0.1 ± 0.0pentacosan-1-ol (C25) 0.1 ± 0.1 0.1 ± 0.0 0.1 ± 0.0 0.0 ± 0.0hexacosan-1-ol (C26) 0.1 ± 0.0 0.1 ± 0.0 0.2 ± 0.0 0.1 ± 0.1octacosan-1-ol (C28) 0.2 ± 0.0 0.5 ± 0.0 0.4 ± 0.1 0.5 ± 0.2nonacosan-1-ol (C29) 0.9 ± 0.2 1.6 ± 0.1 1.3 ± 0.4 1.3 ± 0.3dotriacontan-1-ol (C32) 4.2 ± 2.9 6.1 ± 0.7 1.2 ± 0.5 1.6 ± 0.3n-alkadi(tri)en-1-ols docosadi(tri)en-1-ol (C22) 0.5 ± 0.4 0.5 ± 0.1 0.8 ± 0.4 0.6 ± 0.3tetracosadi(tri)en-1-ol (C24) 0.2 ± 0.2 0.2 ± 0.1 1.9 ± 0.8 0.8 ± 0.1hexacosadi(tri)en-1-ol (C26) 0.1 ± 0.0 0.0 ± 0.0 0.8 ± 0.0 0.8 ± 0.2n-alkanes tricosane (C23) 0.1 ± 0.0 0.4 ± 0.4 0.2 ± 0.1 0.1 ± 0.1tetracosane (C24) 0.0 ± 0.0 0.0 ± 0.0 0.1 ± 0.0 0.1 ± 0.0pentacosane (C25) 0.0 ± 0.0 0.0 ± 0.0 0.1 ± 0.0 0.0 ± 0.0hexacosane (C26) 0.3 ± 0.2 0.2 ± 0.1 0.3 ± 0.2 0.4 ± 0.2
43 www.plantphysiol.orgon June 29, 2018 - Published by Downloaded from
Copyright © 2007 American Society of Plant Biologists. All rights reserved.
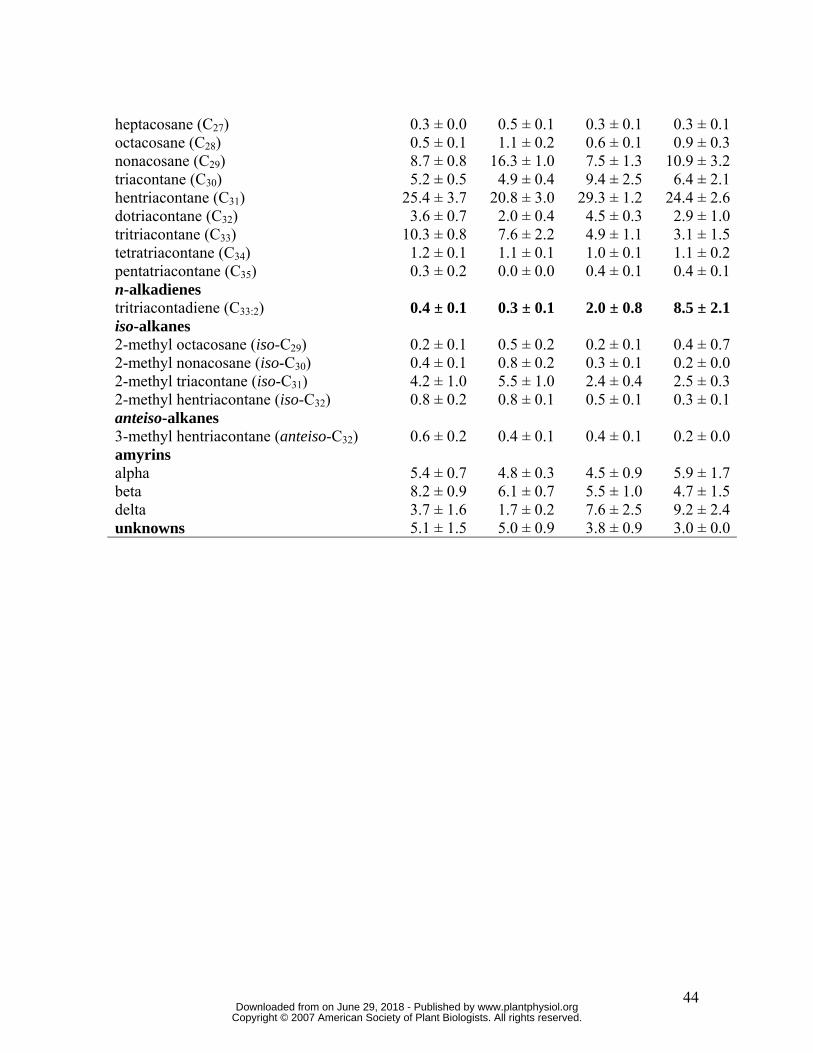
heptacosane (C27) 0.3 ± 0.0 0.5 ± 0.1 0.3 ± 0.1 0.3 ± 0.1octacosane (C28) 0.5 ± 0.1 1.1 ± 0.2 0.6 ± 0.1 0.9 ± 0.3nonacosane (C29) 8.7 ± 0.8 16.3 ± 1.0 7.5 ± 1.3 10.9 ± 3.2triacontane (C30) 5.2 ± 0.5 4.9 ± 0.4 9.4 ± 2.5 6.4 ± 2.1hentriacontane (C31) 25.4 ± 3.7 20.8 ± 3.0 29.3 ± 1.2 24.4 ± 2.6dotriacontane (C32) 3.6 ± 0.7 2.0 ± 0.4 4.5 ± 0.3 2.9 ± 1.0tritriacontane (C33) 10.3 ± 0.8 7.6 ± 2.2 4.9 ± 1.1 3.1 ± 1.5tetratriacontane (C34) 1.2 ± 0.1 1.1 ± 0.1 1.0 ± 0.1 1.1 ± 0.2pentatriacontane (C35) 0.3 ± 0.2 0.0 ± 0.0 0.4 ± 0.1 0.4 ± 0.1n-alkadienes tritriacontadiene (C33:2) 0.4 ± 0.1 0.3 ± 0.1 2.0 ± 0.8 8.5 ± 2.1iso-alkanes 2-methyl octacosane (iso-C29) 0.2 ± 0.1 0.5 ± 0.2 0.2 ± 0.1 0.4 ± 0.72-methyl nonacosane (iso-C30) 0.4 ± 0.1 0.8 ± 0.2 0.3 ± 0.1 0.2 ± 0.02-methyl triacontane (iso-C31) 4.2 ± 1.0 5.5 ± 1.0 2.4 ± 0.4 2.5 ± 0.32-methyl hentriacontane (iso-C32) 0.8 ± 0.2 0.8 ± 0.1 0.5 ± 0.1 0.3 ± 0.1anteiso-alkanes 3-methyl hentriacontane (anteiso-C32) 0.6 ± 0.2 0.4 ± 0.1 0.4 ± 0.1 0.2 ± 0.0amyrins alpha 5.4 ± 0.7 4.8 ± 0.3 4.5 ± 0.9 5.9 ± 1.7beta 8.2 ± 0.9 6.1 ± 0.7 5.5 ± 1.0 4.7 ± 1.5delta 3.7 ± 1.6 1.7 ± 0.2 7.6 ± 2.5 9.2 ± 2.4unknowns 5.1 ± 1.5 5.0 ± 0.9 3.8 ± 0.9 3.0 ± 0.0
44 www.plantphysiol.orgon June 29, 2018 - Published by Downloaded from
Copyright © 2007 American Society of Plant Biologists. All rights reserved.

Table III. Cutin composition of Ailsa Craig and DFD fruit cuticles. Cutin monomer acid percentages (% ± SD) for tomato pericarp at the mature green (MG) and red ripe (RR) stages.
MG RR Cutin Monomer Ailsa Craig DFD Ailsa Craig DFD hexadecanoic 0.1 ± 0.0 0.1 ± 0.0 0.1 ± 0.0 0.1 ± 0.016-OH hexadecanoic 3.8 ± 0.3 3.8 ± 0.7 3.2 ± 0.5 2.5 ± 0.210,16-diOH hexadecanoica 73.0 ± 6.3 72.0± 3.6 74.4 ± 2.4 74.7 ± 2.3Hexadecane-1,16-dioic 1.3 ± 0.3 1.4 ± 0.7 1.4 ± 0.4 1.4 ± 0.618-OH octadecanoic 3.0± 1.7 2.8 ± 1.7 4.7 ± 0.8 3.1 ± 0.99,18-diOH octadecanoic 1.5 ± 0.3 1.6 ± 0.5 1.4 ± 0.2 1.7 ± 0.29,10,18-triOH octadecanoic 0.4 ± 0.1 0.7 ± 0.3 0.7 ± 0.1 0.6 ± 0.19,10,18-triOH octadecenoicb 1.4 ± 0.3 1.5 ± 0.6 0.6 ± 0.3 1.2 ± 0.4p-coumaric 0.9 ± 0.3 1.0 ± 0.1 0.6 ± 0.3 1.1 ± 0.1m-coumaric 1.4 ± 0.6 1.5 ± 0.3 1.4 ± 0.7 1.5 ± 0.3Unknowns 13.1 ± 5.0 13.5 ± 3.4 11.5 ± 1.5 11.9 ± 2.7Total (µg cm-2 ± s.d.) 1050.4 ± 100.5 1025.8 ± 196.3 1102.7 ± 233.5 1887.3 ± 103.6a Isomer composition: 10,16, 76%; 9,16, 10%; 8,16, 13%; 7,16, 1%. Isomer composition varied little between Ailsa Craig and DFD (data not shown). b Double bond position not determined. Position reported at ∆12 carbon (Baker et al., 1982).
45 www.plantphysiol.orgon June 29, 2018 - Published by Downloaded from
Copyright © 2007 American Society of Plant Biologists. All rights reserved.
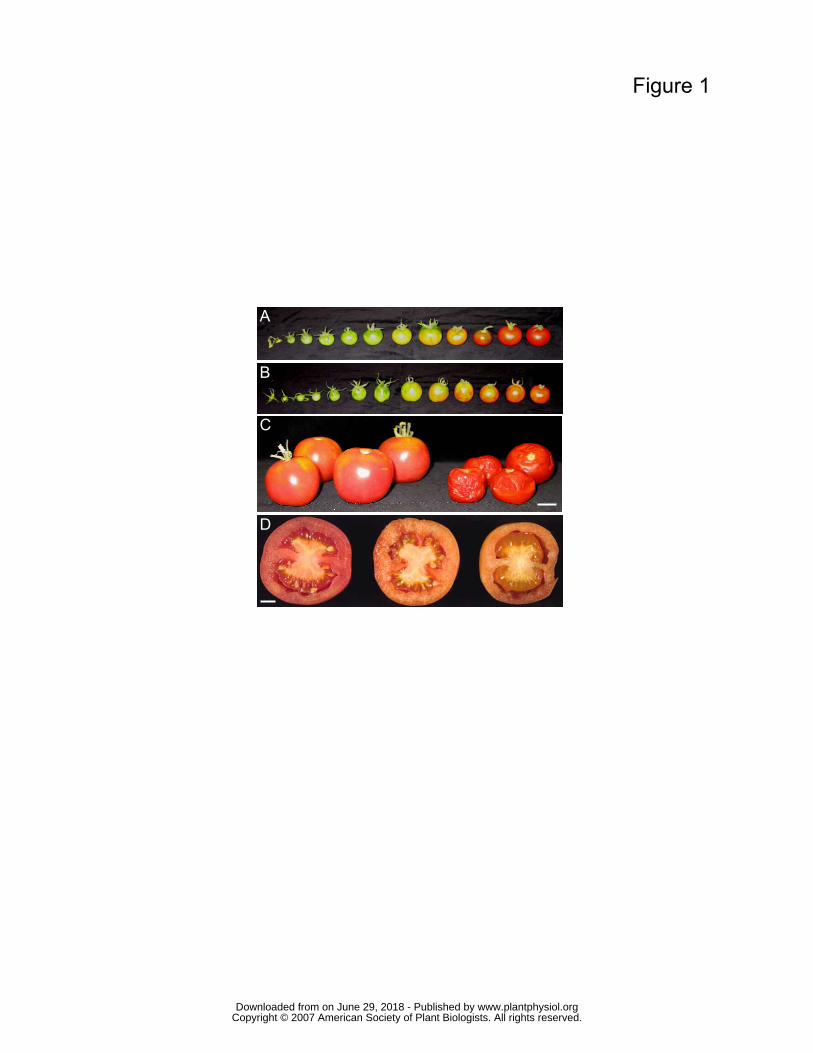
Figure 1
A
B
D
C
www.plantphysiol.orgon June 29, 2018 - Published by Downloaded from Copyright © 2007 American Society of Plant Biologists. All rights reserved.
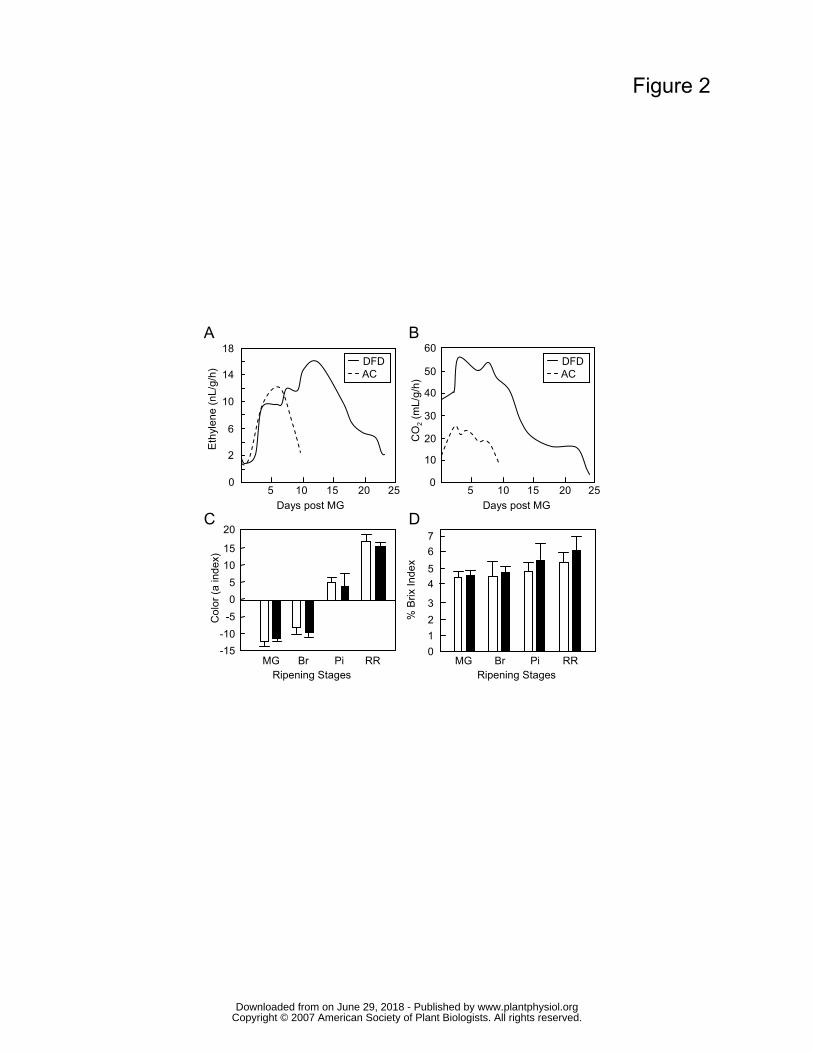
Days post MG
Ethy
lene
(nL/
g/h)
0
14
18
10
6
2
5 10 15 20 25
A
C D
B
% B
rix In
dex
MG Br Pi RR
3
4567
012
Ripening Stages
DFDAC
Days post MG
CO
2(m
L/g/
h)30
40
0
50
60
10
20
5 10 15 20 25
DFDAC
20
-15-10
-505
1015
Br Pi RRMGRipening Stages
Col
or (a
inde
x)
Figure 2
www.plantphysiol.orgon June 29, 2018 - Published by Downloaded from Copyright © 2007 American Society of Plant Biologists. All rights reserved.

Figure 3
C
Pene
tratio
n M
ass
(g)
0
2
4
8
6
10
MG Br Pi RRRipening Stages
Com
pres
sion
Mas
s (g
)
RR+8MG Br Pi RR
A
Ripening StagesRR+2
0
2
4
6
8
0
10
12
MG Br Pi RR
Com
pres
sion
Mas
s (g
)
B
Ripening Stages
2
4
8
6
ACDFD
*
* * **
*
*
**
*
www.plantphysiol.orgon June 29, 2018 - Published by Downloaded from Copyright © 2007 American Society of Plant Biologists. All rights reserved.
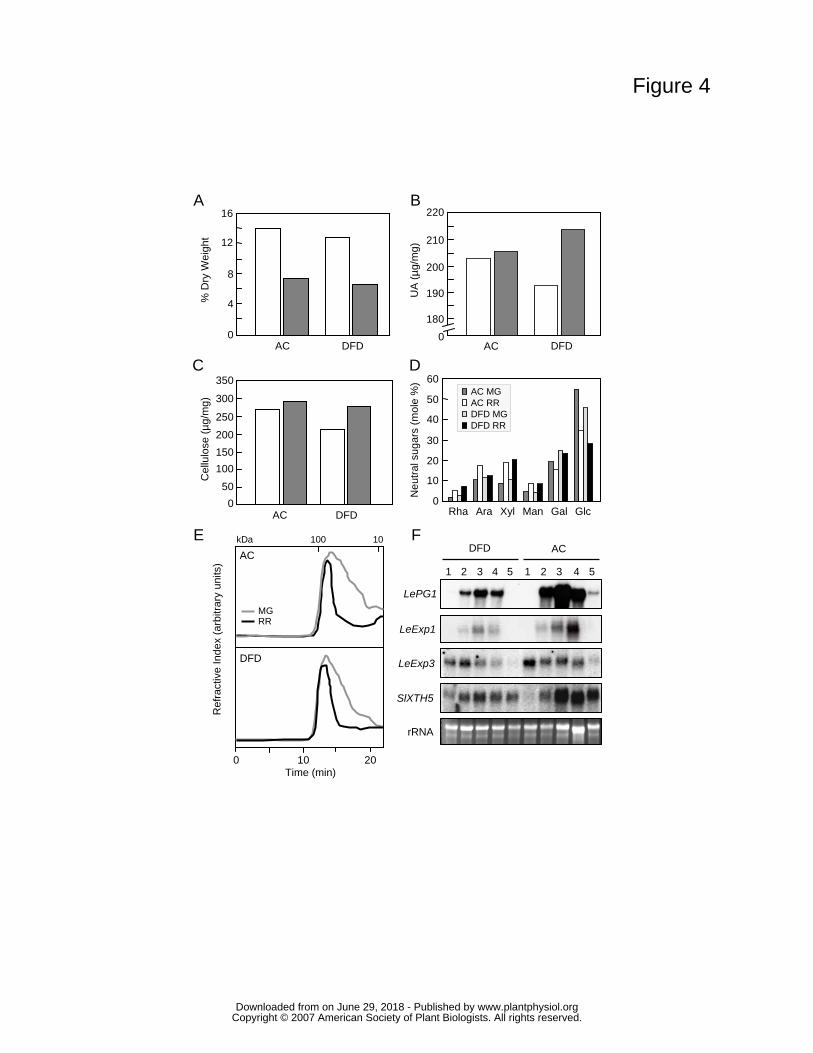
Figure 4
AC DFD
UA
(µg/
mg)
Cel
lulo
se (µ
g/m
g)
050
100150200250
300
350
Neu
tral s
ugar
s (m
ole
%)
Rha Ara Xyl Man Gal Glc0
10
20
30
40
50
60AC MGAC RRDFD MGDFD RR
B
C D
% D
ry W
eigh
t
0
4
8
12
16
AC DFD
A
E FDFD
SlXTH5
LePG1
1 2 5 4 3 2 1 4 3 5
AC
rRNA
LeExp1
LeExp3
Ref
ract
ive
Inde
x (a
rbitr
ary
units
)
Time (min)
DFD
0 10 20
AC
MGRR
100 10
180
190
200
210
220
AC DFD0
kDa
www.plantphysiol.orgon June 29, 2018 - Published by Downloaded from Copyright © 2007 American Society of Plant Biologists. All rights reserved.

Figure 5
B
2 31
MG
RR
AC DFD
CL CL
CL CL
C
Pericarp Zone
Cel
l cro
ss-s
ectio
nal a
rea
(µm
2 x10⁻⁵
)
1 2 30
100
200
300
400
500AC-MGDFD-MG
DFD-RRAC-RR
A
Ripening Stages
Per
icar
p w
idth
(cm
)
0
0.2
0.4
0.8
0.6
1.0
1.2
MG Br Pi RR
ACDFD
CL
* * **
www.plantphysiol.orgon June 29, 2018 - Published by Downloaded from Copyright © 2007 American Society of Plant Biologists. All rights reserved.

Figure 6
0
0.3
1 2
0.6
0.9
1.2
Months after RR
% w
eigh
t los
s/cm
2
3
B
0.22
0.20
0.18
0.16
0.14
0.12
0.10
0.08
0.06
0.04
0.02
0-10 0 10 20
External color (a* index)
Turg
or (M
Pa)
A
CL
MG Br RR OR
ACDFD
ACDFD
www.plantphysiol.orgon June 29, 2018 - Published by Downloaded from Copyright © 2007 American Society of Plant Biologists. All rights reserved.

Figure 7
E
CW
CL
Cyt
BACL
CL
DC
HG
CL
F
CWCyt
0.5 µm0.5 µm
5 µm
5 µm 5 µm
5 µm
www.plantphysiol.orgon June 29, 2018 - Published by Downloaded from Copyright © 2007 American Society of Plant Biologists. All rights reserved.

Figure 8
A
B
Yie
ld S
tress
(MP
a)
0
5
10
15
20
25
30
35
40
MG RR
Yie
ld S
train
0
0.05
0.10
0.15
0.20
MG RR
Ripening Stages
Ripening Stages
ACDFD
*
* *
www.plantphysiol.orgon June 29, 2018 - Published by Downloaded from Copyright © 2007 American Society of Plant Biologists. All rights reserved.
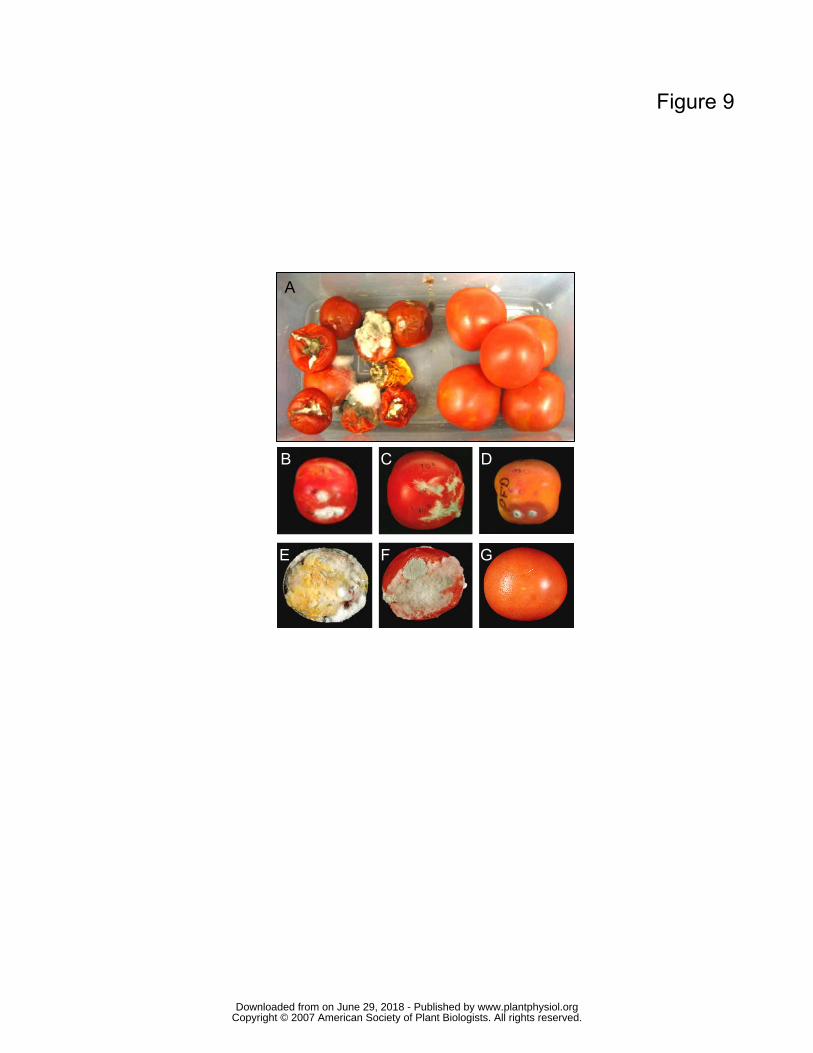
FE
DCB
G
A
Figure 9
www.plantphysiol.orgon June 29, 2018 - Published by Downloaded from Copyright © 2007 American Society of Plant Biologists. All rights reserved.