rttt district performance metrics goals and data … · web viewrace to the top phase 3 district...
TRANSCRIPT
Race to the Top Phase 3District Performance Metrics
RttT District Performance MetricsGoals and Data
Spring 2013
Page 1 of 29 5/6/2023

Race to the TopDistrict Goals and Performance Data
DISTRICT PEFORMANCE MEASURES AND STUDENT OUTCOME GOALS
Basic Information
Indicator 2012-2013 2013-2014 2014-2015
Number of High School Students We will provide data
Number of 8th Grade Students
Number of Teachers (Headcount)
Number of Principals (Headcount)
Number of Underrepresented High School Students1
Number of teachers evaluated this year
Number of 1st Year Teachers (ever)
Number of 2nd Year Teachers
Number of 1st Year Principals (ever)
1) "Underrepresented high school students" for purposes of this performance measure include low-income, English language-learners (ELLs), students with disabilities (SWDs), minorities, and female students.
2#11064943_v1

Race to the TopDistrict Goals and Performance Data
Rising Star Indicators
A(2): Building Strong Statewide Capacity to Implement, Scale-Up, and Sustain Proposed PlansGoals
i. Build strong leadership & dedicated teams to implement statewide reform.ii. Build the Capacity of LEAs for Successful Implementation of Reforms.
Rising Star Indicators: CII2 and CII3
Performance Measures
End of SY
2012-
2013
End of SY
2013-
2014
End of SY
2014-2015
What percent of mandatory Rising Star indicators has your district assessed, prioritized, and established plans for full implementation?(See attachment below for mandatory Rising Star Indicators)
Goal 100% 100% 100%
Actual
Mandatory Rising Star IndicatorsIndicator Category Indicator NumberSmart Start IA07
IA11 IB01
IB02 IC05 ID01
Smart Plan IA06 IA08 IA09 IA10 IA12
IA14 IA13 IC01 IC02
IC06 IC07 IC08 ID10 D7
All Remaining RttT Indicators (See Abe Lincoln Document)
IA01 IA02 IA03 D9
D11 D13 CII1 CII2
CII3 RT3-1 RT3-2
3#11064943_v1

Race to the TopDistrict Goals and Performance Data
Curriculum and Common Core Measures
Performance Measures (B)(3)
Rising Star: IC05End of SY 2012-2013
End of SY 2013-2014
End of SY 2014-2015
Aligning curriculum to CCSS
Is your district implementing Common Core State Standards throughout all grade levels and applicable subject areas? Yes/No
Goal N/A Yes Yes
Actual
Implementing assessment systems
Are teachers:…providing ELA instruction…using non-summative assessments that measure student learning over the course of the school year….through administration of the assessments multiple times per year….that are aligned to the CCSS in ELA?
Yes/No
Goal N/A Yes
Actual
Are teachers:….providing Math instruction….using non-summative assessments that measure student learning over the course of the school year….through administration of the assessments multiple times per year….that are aligned to the CCSS in MathYes/No
Goal N/A Yes
Actual
Number of teachers participating in workgroups that are contributing to the development of assessment frameworks and items for Type II
Goal N/A
Actual
4#11064943_v1

Race to the TopDistrict Goals and Performance Data
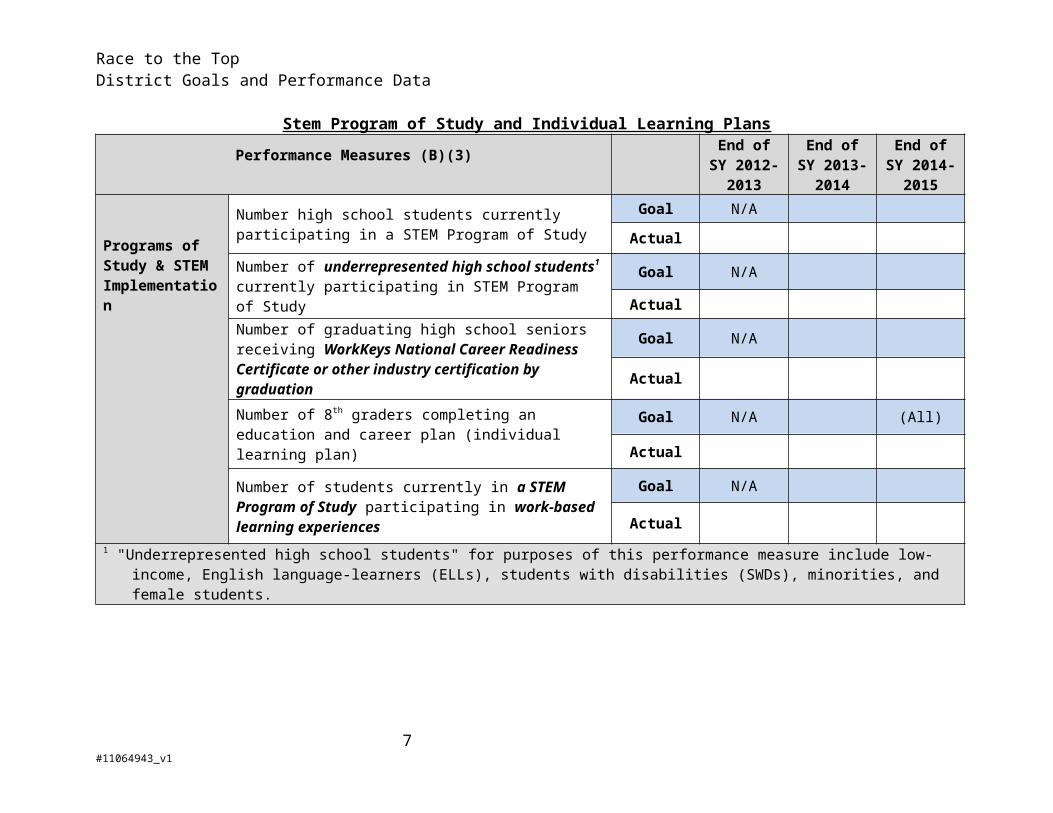
Stem Program of Study and Individual Learning PlansPerformance Measures (B)(3) End of SY
2012-2013End of SY 2013-2014
End of SY 2014-2015
Programs of Study & STEM Implementation
Number high school students currently participating in a STEM Program of Study
Goal N/A
Actual
Number of underrepresented high school students1 currently participating in STEM Program of Study
Goal N/A
Actual
Number of graduating high school seniors receiving WorkKeys National Career Readiness Certificate or other industry certification by graduation
Goal N/A
Actual
Number of 8th graders completing an education and career plan (individual learning plan)
Goal N/A (All)
Actual
Number of students currently in a STEM Program of Study participating in work-based learning experiences
Goal N/A
Actual1 "Underrepresented high school students" for purposes of this performance measure include low-income, English language-
learners (ELLs), students with disabilities (SWDs), minorities, and female students.
5#11064943_v1

Race to the TopDistrict Goals and Performance Data
ISLEC(3): Using Data to Improve Instruction
Goalsi. Ensure that all Participating LEAs can implement local instructional improvement systems that provide teachers,
principals, and administrators with the information and resources they need to inform and improve their instructional practices, decision-making, and overall effectiveness.
Performance Measures (C)(3) End of SY 2012-2013
End of SY 2013-2014
End of SY 2014-2015
IL Shared Learning Environment (ISLE)
Has your district integrated local data with ISLE?Goal Yes Yes Yes
Actual We will collect and enter data.
Number of teachers accessing instructional applications hosted on ISLE at least once per week during the school year
Goal N/A
Actual N/AWe will collect and enter data.
We will collect and enter data.
Number of principals accessing performance dashboard applications hosted on ISLE at least once per week during the school year
Goal N/A
Actual N/AWe will collect and enter data.
We will collect and enter data.
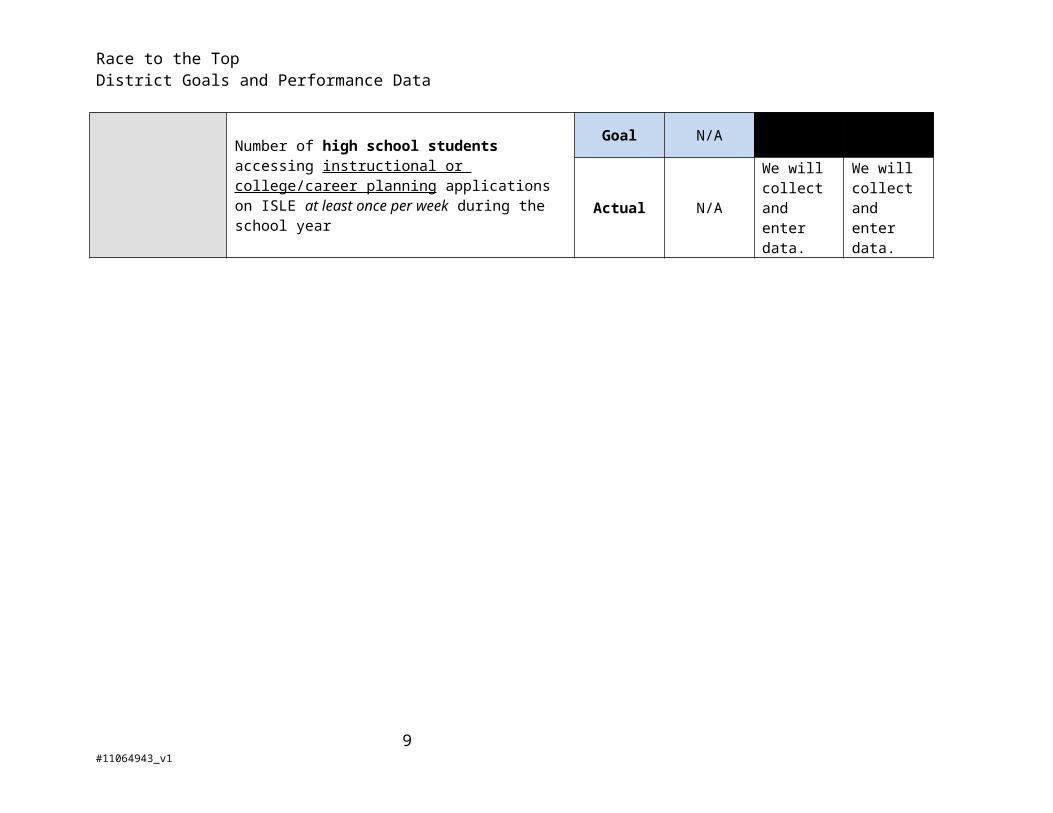
Number of high school students accessing instructional or college/career planning applications on ISLE at least once per week during the school year
Goal N/A
Actual N/AWe will collect and enter data.
We will collect and enter data.
6#11064943_v1
Race to the TopDistrict Goals and Performance Data
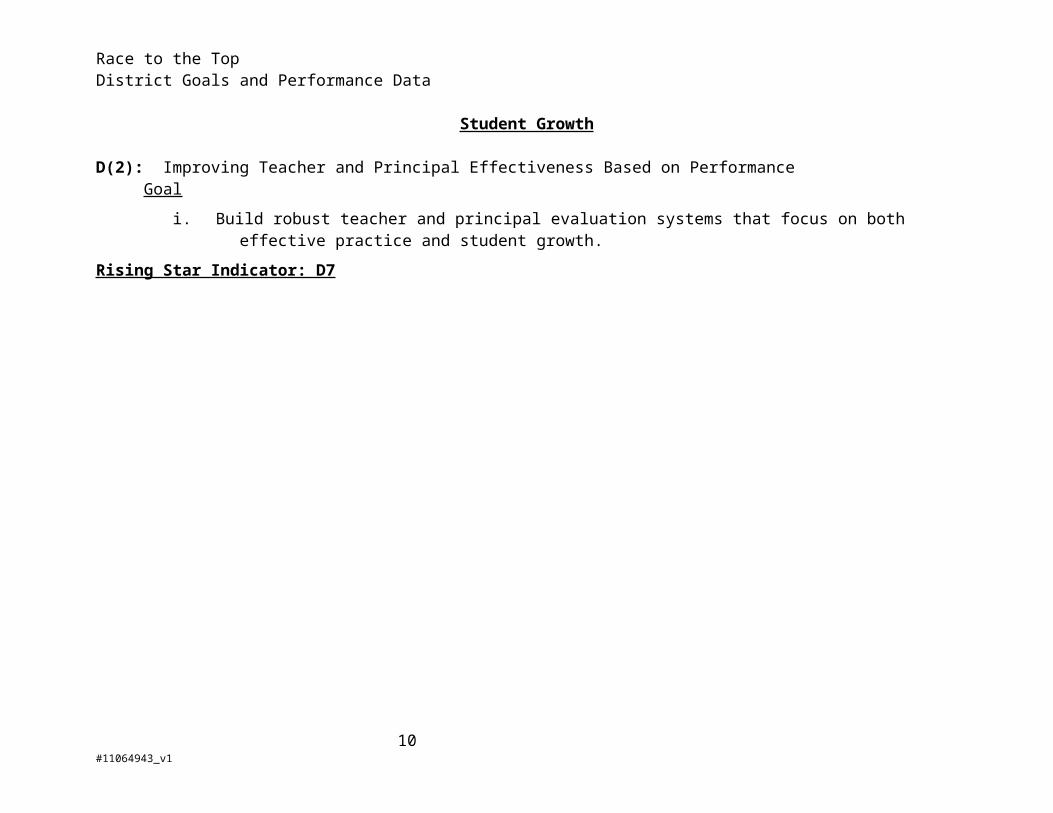
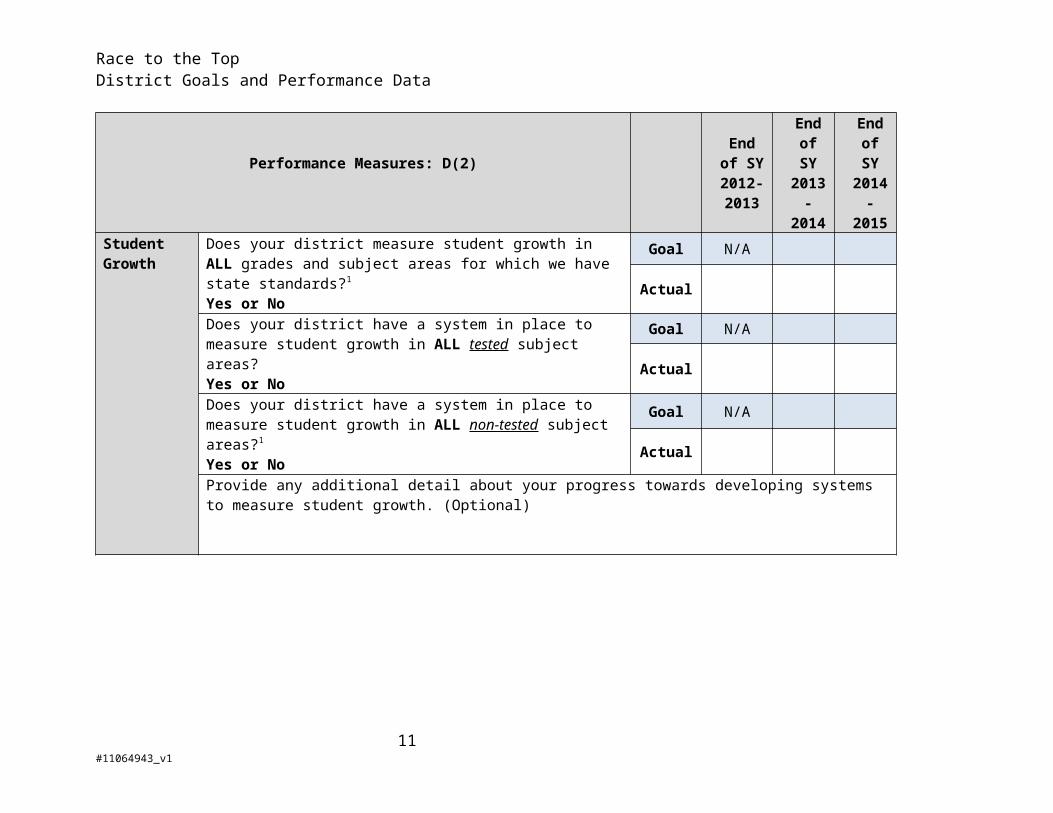
Student Growth
D(2): Improving Teacher and Principal Effectiveness Based on PerformanceGoal
i. Build robust teacher and principal evaluation systems that focus on both effective practice and student growth.
Rising Star Indicator: D7
Performance Measures: D(2)End of
SY 2012-2013
End of SY 2013-2014
End of SY 2014-2015
Student Growth
Does your district measure student growth in ALL grades and subject areas for which we have state standards?1
Yes or No
Goal N/A
ActualDoes your district have a system in place to measure student growth in ALL tested subject areas?Yes or No
Goal N/A
Actual
Does your district have a system in place to measure student growth in ALL non-tested subject areas?1
Yes or NoGoal N/A
Actual
Provide any additional detail about your progress towards developing systems to measure student growth. (Optional)
7#11064943_v1

Race to the TopDistrict Goals and Performance Data
1. Note, goals for growth measures should be aligned with the timeline for which the district is required to fully implement the teacher evaluation system.
Educator Evaluations
Some, but not all, of the below are required with the full implementation of PERA.
Rising Star Indicator: RT3-1
Performance Measures D(2)End of
SY 2012-2013
End of SY
2013-2014
End of SY
2014-2015
Use of Teacher and Is your district’s performance evaluation system used for: (Y/N)
8#11064943_v1
Race to the TopDistrict Goals and Performance Data
Performance Measures D(2)End of
SY 2012-2013
End of SY
2013-2014
End of SY
2014-2015
Principal Evaluations
DevelopingTeachers1 Goal N/A
Actual
Principals2 Goal Yes Yes YesActual
CompensatingTeachers
Goal N/AActual
PrincipalsGoal N/A
Actual
PromotingTeachers3 Goal N/A
Actual
PrincipalsGoal N/A
Actual
Retaining
Teachers rated as proficient or excellent4
Goal N/A
Actual
Principals rated as proficient or excellent
Goal N/A
Actual
Granting tenure and/or full certification (where applicable)
Teachers5 Goal N/AActual
Principals Goal N/AActual
Removing ineffective tenured and untenured
Teachers6 Goal N.AActual
Principals7 Goal N/AActual
9#11064943_v1
Race to the TopDistrict Goals and Performance Data
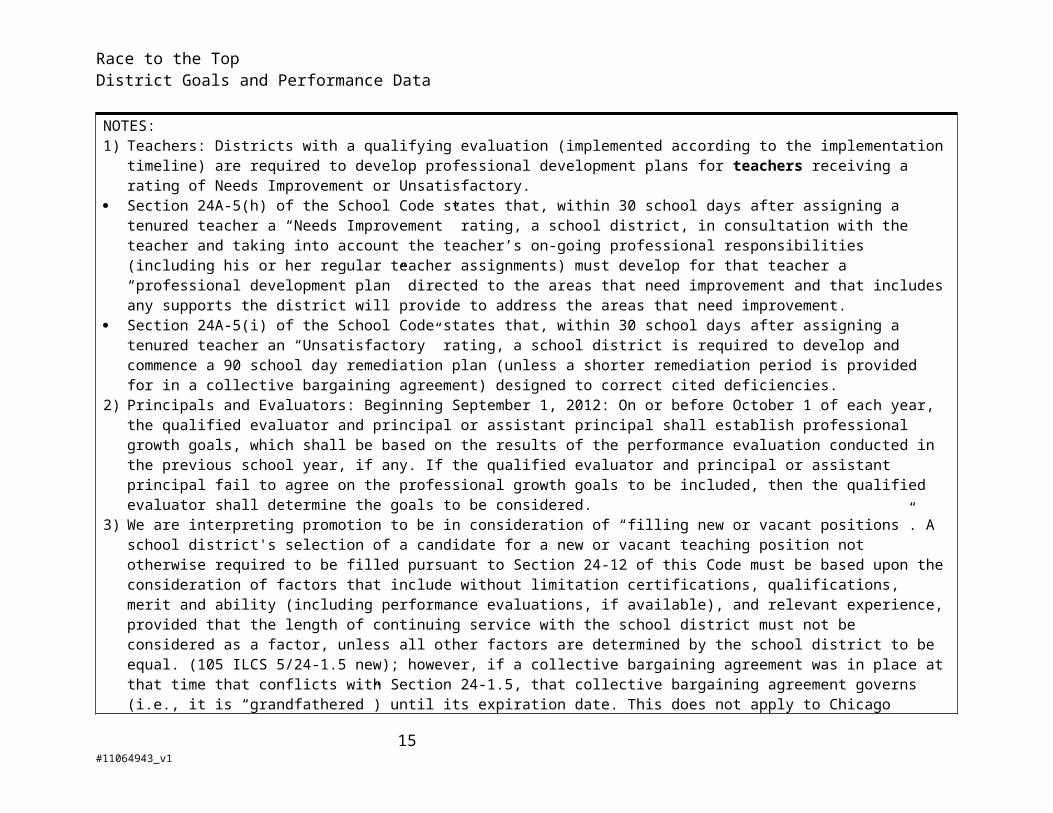
NOTES:1) Teachers: Districts with a qualifying evaluation (implemented according to the implementation timeline) are required to develop
professional development plans for teachers receiving a rating of Needs Improvement or Unsatisfactory. Section 24A-5(h) of the School Code states that, within 30 school days after assigning a tenured teacher a “Needs Improvement” rating, a
school district, in consultation with the teacher and taking into account the teacher’s on-going professional responsibilities (including his or her regular teacher assignments) must develop for that teacher a “professional development plan” directed to the areas that need improvement and that includes any supports the district will provide to address the areas that need improvement.
Section 24A-5(i) of the School Code states that, within 30 school days after assigning a tenured teacher an “Unsatisfactory” rating, a school district is required to develop and commence a 90 school day remediation plan (unless a shorter remediation period is provided for in a collective bargaining agreement) designed to correct cited deficiencies.
2) Principals and Evaluators: Beginning September 1, 2012: On or before October 1 of each year, the qualified evaluator and principal or assistant principal shall establish professional growth goals, which shall be based on the results of the performance evaluation conducted in the previous school year, if any. If the qualified evaluator and principal or assistant principal fail to agree on the professional growth goals to be included, then the qualified evaluator shall determine the goals to be considered.
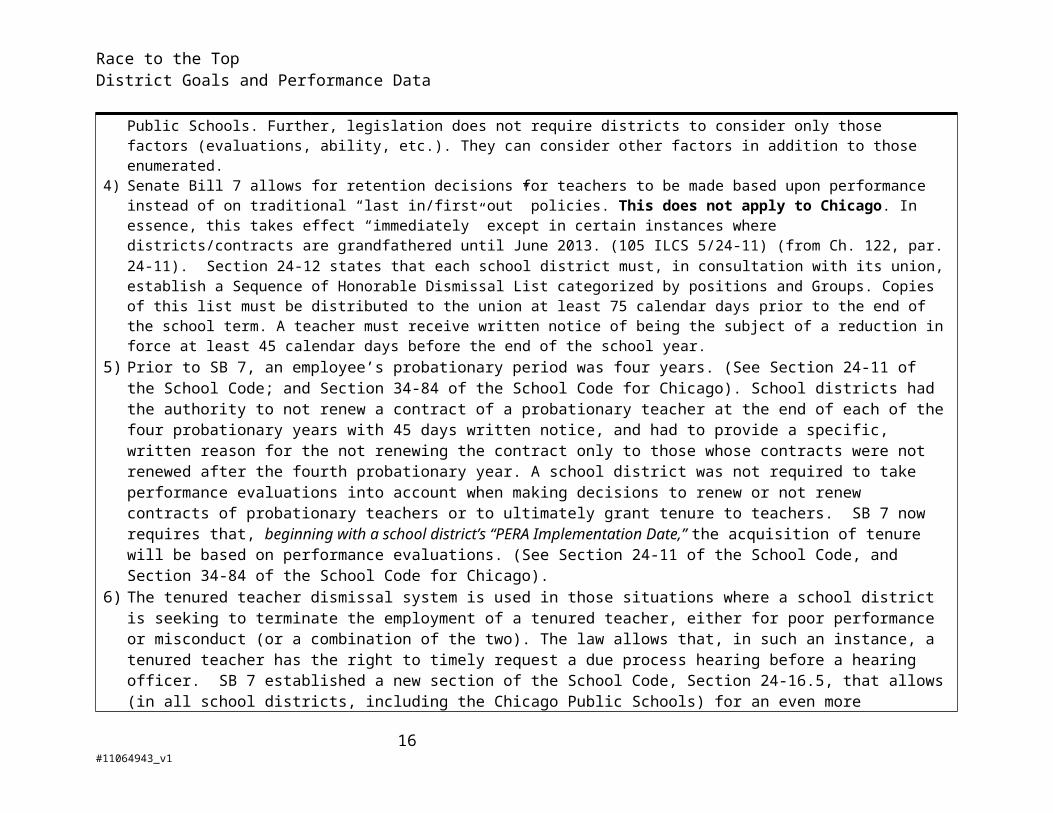
3) We are interpreting promotion to be in consideration of “filling new or vacant positions”. A school district's selection of a candidate for a new or vacant teaching position not otherwise required to be filled pursuant to Section 24-12 of this Code must be based upon the consideration of factors that include without limitation certifications, qualifications, merit and ability (including performance evaluations, if available), and relevant experience, provided that the length of continuing service with the school district must not be considered as a factor, unless all other factors are determined by the school district to be equal. (105 ILCS 5/24-1.5 new); however, if a collective bargaining agreement was in place at that time that conflicts with Section 24-1.5, that collective bargaining agreement governs (i.e., it is “grandfathered”) until its expiration date. This does not apply to Chicago Public Schools. Further, legislation does not require districts to consider only those factors (evaluations, ability, etc.). They can consider other factors in addition to those enumerated.
4) Senate Bill 7 allows for retention decisions for teachers to be made based upon performance instead of on traditional “last in/first out” policies. This does not apply to Chicago. In essence, this takes effect “immediately” except in certain instances where districts/contracts are grandfathered until June 2013. (105 ILCS 5/24-11) (from Ch. 122, par. 24-11). Section 24-12 states that each school district must, in consultation with its union, establish a Sequence of Honorable Dismissal List categorized by positions and Groups. Copies of this list must be distributed to the union at least 75 calendar days prior to the end of the school term. A teacher must receive written notice of being the subject of a reduction in force at least 45 calendar days before the end of the school year.
5) Prior to SB 7, an employee’s probationary period was four years. (See Section 24-11 of the School Code; and Section 34-84 of the School Code for Chicago). School districts had the authority to not renew a contract of a probationary teacher at the end of each of the four probationary years with 45 days written notice, and had to provide a specific, written reason for the not renewing the contract only to those whose contracts were not renewed after the fourth probationary year. A school district was not required to take performance evaluations into account when making decisions to renew or not renew contracts of probationary teachers or to ultimately grant tenure to teachers. SB 7 now requires that, beginning with a school district’s “PERA Implementation Date,” the
10#11064943_v1
Race to the TopDistrict Goals and Performance Data
acquisition of tenure will be based on performance evaluations. (See Section 24-11 of the School Code, and Section 34-84 of the School Code for Chicago).
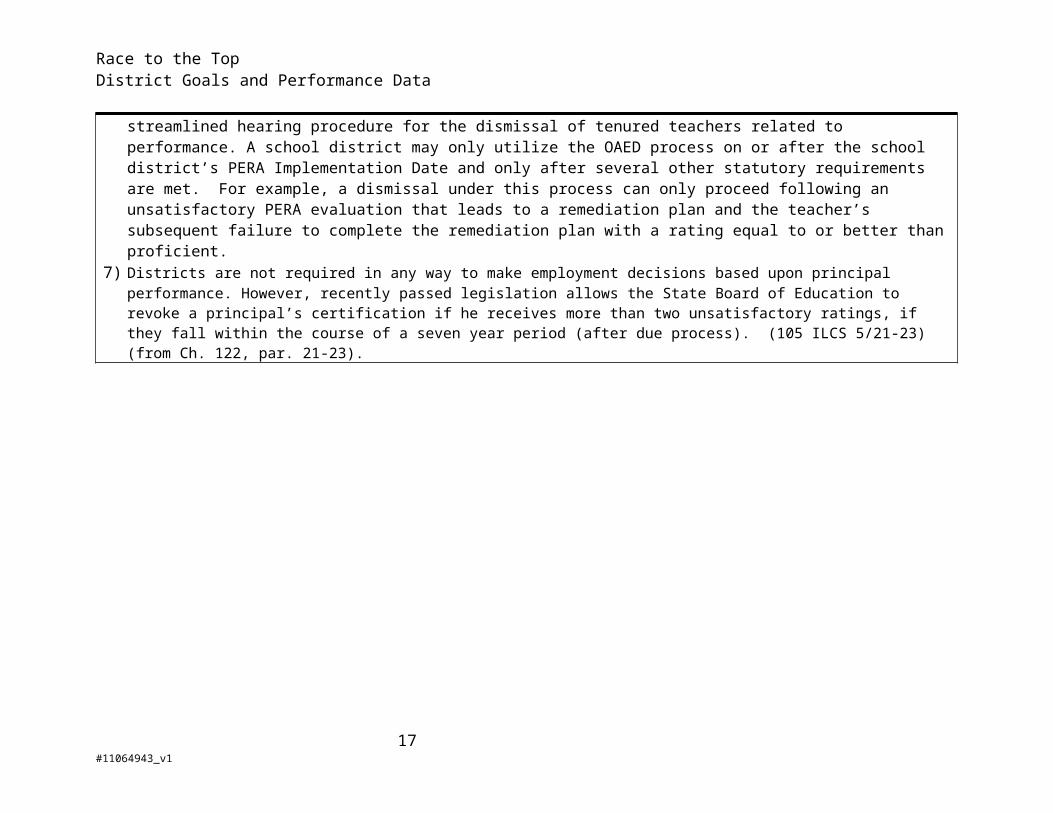
6) The tenured teacher dismissal system is used in those situations where a school district is seeking to terminate the employment of a tenured teacher, either for poor performance or misconduct (or a combination of the two). The law allows that, in such an instance, a tenured teacher has the right to timely request a due process hearing before a hearing officer. SB 7 established a new section of the School Code, Section 24-16.5, that allows (in all school districts, including the Chicago Public Schools) for an even more streamlined hearing procedure for the dismissal of tenured teachers related to performance. A school district may only utilize the OAED process on or after the school district’s PERA Implementation Date and only after several other statutory requirements are met. For example, a dismissal under this process can only proceed following an unsatisfactory PERA evaluation that leads to a remediation plan and the teacher’s subsequent failure to complete the remediation plan with a rating equal to or better than proficient.
7) Districts are not required in any way to make employment decisions based upon principal performance. However, recently passed legislation allows the State Board of Education to revoke a principal’s certification if he receives more than two unsatisfactory ratings, if they fall within the course of a seven year period (after due process). (105 ILCS 5/21-23) (from Ch. 122, par. 21-23).
11#11064943_v1
Race to the TopDistrict Goals and Performance Data
Educator Evaluations
Rising Star Indicator: RT3-1For this section, you are not required to enter goals. Please enter the actual number of teachers and principals.
Performance Measures D(2)
End of SY 2012-2013
End of SY 2013-2014
End of SY 2014-2015
Number of teachers who were evaluated as Proficient or better.
Number of principals who were evaluated as Proficient or better.
Number of teachers who were evaluated as Unsatisfactory.
Number of principals who were evaluated as Unsatisfactory.
Number of teachers whose evaluations were used to inform compensation decisions.Number of principals whose evaluations were used to inform compensation decisions.
Number of teachers who were evaluated as Proficient or better and were retained.
Number of principals who were evaluated as effective or better and were retained.
Number of teachers who were eligible for tenure.
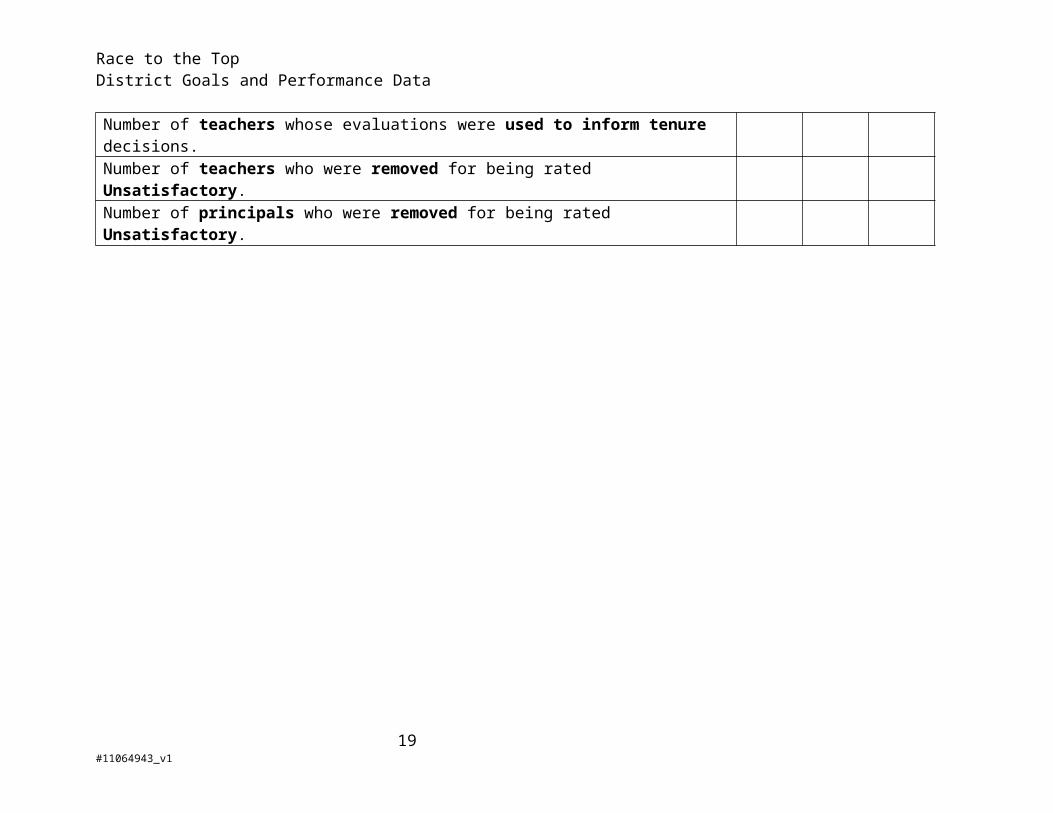
Number of teachers whose evaluations were used to inform tenure decisions.
Number of teachers who were removed for being rated Unsatisfactory.
Number of principals who were removed for being rated Unsatisfactory.
12#11064943_v1

Race to the TopDistrict Goals and Performance Data
High/Low Poverty and High/Low Minority
D(3): Ensuring Equitable Distribution of Effective Teachers and PrincipalsGoal
i. Create a pipeline of highly effective principals and teachers to serve the State's neediest schools.
Rising Star Indicator: IA14
We will provide information on which of your schools were high-poverty and high-minority last fiscal year to assist with goal setting.
Performance Measures for (D)(3)(i)* End of SY 2012-2013
End of SY 2013-2014
End of SY 2014-2015
TEACHERS
Number of teachers in schools that are high-poverty and/or high-minority who are rated as excellent.
Goal N/A
Actual
Number of teachers in schools that are low-poverty and/or low-minority who are rated as excellent.
Goal N/A
Actual
Number of teachers in schools that are high-poverty and/or high-minority who are rated as unsatisfactory.
Goal N/A
Actual
Number of teachers in schools that are low-poverty and/or low-minority who are rated as unsatisfactory.
Goal N/A
Actual
13#11064943_v1

Race to the TopDistrict Goals and Performance Data
Performance Measures for (D)(3)(i)* End of SY 2012-2013
End of SY 2013-2014
End of SY 2014-2015
PRINCIPALS
Number of principals leading schools that are high-poverty and/or high-minority who are rated as excellent.
Goal N/A
ActualNumber of principals leading schools that are low-poverty and/or low-minority who are rated as excellent.
Goal N/AActual
Number of principals leading schools that are high-poverty and/or high-minority who are rated as unsatisfactory.
Goal N/AActual
Number of principals leading schools that are low-poverty and/or low-minority who are rated as unsatisfactory.
Goal N/AActual
14#11064943_v1
Race to the TopDistrict Goals and Performance Data
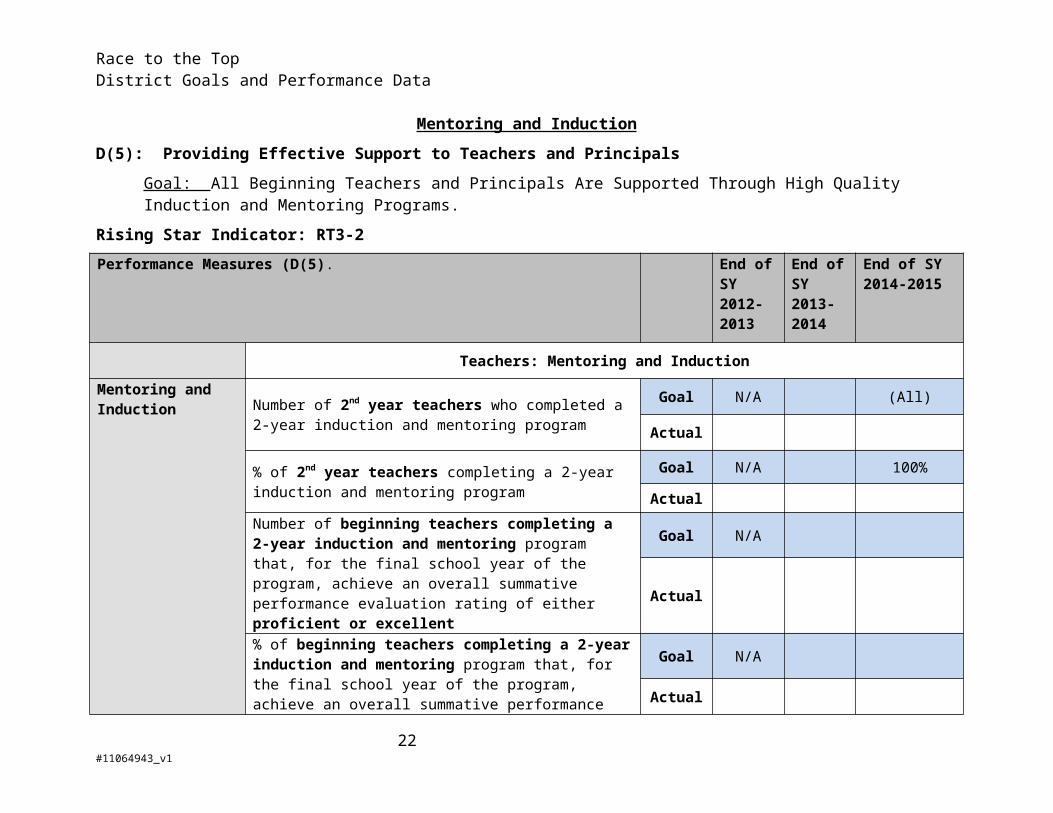
Mentoring and Induction
D(5): Providing Effective Support to Teachers and Principals
Goal: All Beginning Teachers and Principals Are Supported Through High Quality Induction and Mentoring Programs.
Rising Star Indicator: RT3-2Performance Measures (D(5). End of
SY 2012-2013
End of SY 2013-2014
End of SY 2014-2015
Teachers: Mentoring and Induction
Mentoring and Induction Number of 2nd year teachers who completed a 2-year
induction and mentoring program
Goal N/A (All)
Actual
% of 2nd year teachers completing a 2-year induction and mentoring program
Goal N/A 100%
ActualNumber of beginning teachers completing a 2-year induction and mentoring program that, for the final school year of the program, achieve an overall summative performance evaluation rating of either proficient or excellent
Goal N/A
Actual
% of beginning teachers completing a 2-year induction and mentoring program that, for the final school year of the program, achieve an overall summative performance evaluation rating of either proficient or excellent
Goal N/A
Actual
Number of first year teachers rated "needs improvement" in their first year of teaching who, after Goal N/A
15#11064943_v1
Race to the TopDistrict Goals and Performance Data
Performance Measures (D(5). End of SY 2012-2013
End of SY 2013-2014
End of SY 2014-2015
completing a 2-year induction and mentoring program, achieve an overall summative performance evaluation rating of proficient or excellent
Actual
% of first year teachers rated "needs improvement" in their first year of teaching who, after completing a 2-year induction and mentoring program, achieve an overall summative performance evaluation rating of proficient or excellent
Goal N/A
Actual
Principals: Mentoring and Induction
Number of 1st year principals completing a mentoring and induction program
Goal N/A
Actual
% of 1st year principals completing a mentoring and induction program
Goal N/A
Actual
Number of 1st year principals participating in a one-year mentoring program that achieve an overall summative performance evaluation rating of either proficient or excellent for the school year in which they participated in the program
Goal N/A
Actual
% of 1st year principals participating in a one-year mentoring program that achieve an overall summative performance evaluation rating of either proficient or
Goal N/A
16#11064943_v1
Race to the TopDistrict Goals and Performance Data
Performance Measures (D(5). End of SY 2012-2013
End of SY 2013-2014
End of SY 2014-2015
excellent for the school year in which they participated in the program Actual
1 Districts are not required to establish a new teacher induction and mentoring program until the end of the 2012-13 school year.
17#11064943_v1

Race to the Top Phase 3District Performance Metrics
STUDENT OUTCOME GOALS
For the following student outcomes, please set goals for: Percent meets or exceeds for ISAT Percent meets or exceeds for PSAE
NOTE: FOR ALL STUDENT OUTCOME DATA, ISBE WILL PROVIDE THE DATA
ENTIRE DISTRICT
MEASURE SY12-13 SY13-14 SY14-15 SY15-16
Percent at meets and exceeds:ISAT: Grades 3-8 Math Goal N/A
Percent at meets and exceeds:ISAT: Grades 3-8 Reading Actual We will collect and enter data.
Percent at meets and exceeds:PSAE: Math
Goal N/A
Actual We will collect and enter data.
Percent at meets and exceeds:PSAE: Reading
Goal N/A
Actual We will collect and enter data.
High School Graduation RateGoal N/A
Actual We will collect and enter data.
Page 18 of 29 5/6/2023
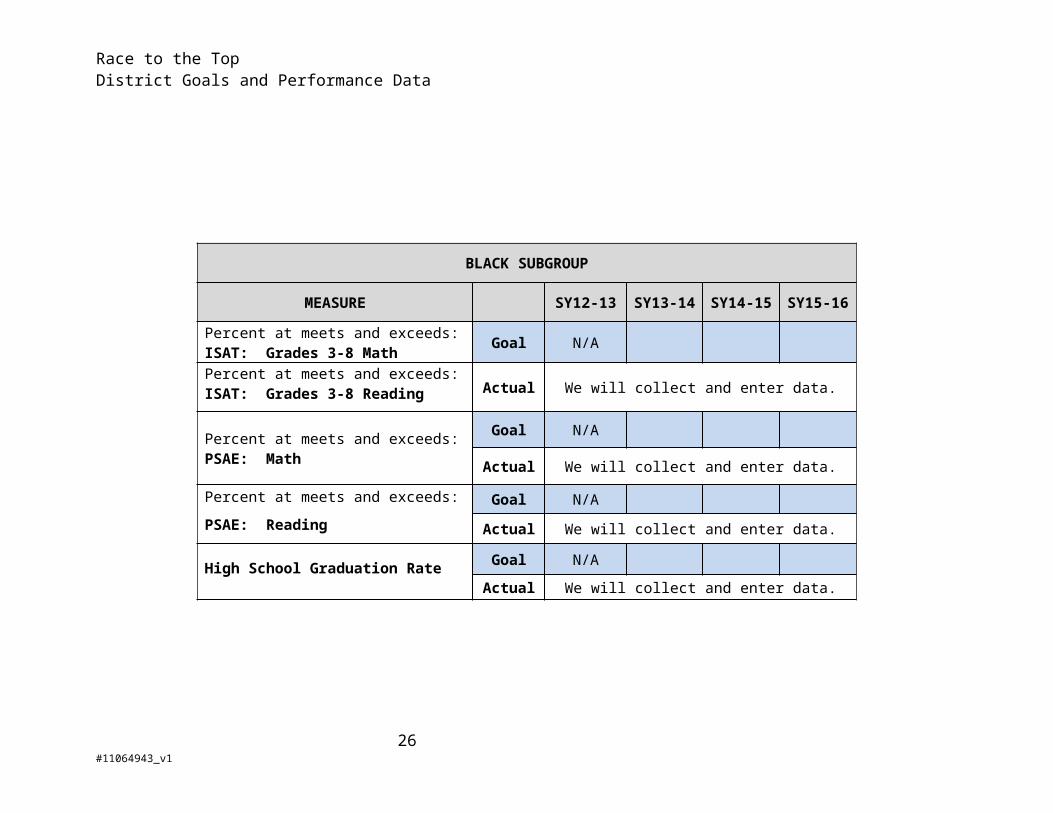
Race to the TopDistrict Goals and Performance Data
BLACK SUBGROUP
MEASURE SY12-13 SY13-14 SY14-15 SY15-16
Percent at meets and exceeds:ISAT: Grades 3-8 Math Goal N/A
Percent at meets and exceeds:ISAT: Grades 3-8 Reading Actual We will collect and enter data.
Percent at meets and exceeds:PSAE: Math
Goal N/A
Actual We will collect and enter data.
Percent at meets and exceeds:
PSAE: ReadingGoal N/A
Actual We will collect and enter data.
High School Graduation Rate Goal N/A
Actual We will collect and enter data.
19#11064943_v1

Race to the TopDistrict Goals and Performance Data
HISPANIC SUBGROUP
MEASURE SY12-13 SY13-14 SY14-15 SY15-16
Percent at meets and exceeds:ISAT: Grades 3-8 Math
Goal N/A
Actual We will collect and enter data.
Percent at meets and exceeds:ISAT: Grades 3-8 Reading
Goal N/A
Actual We will collect and enter data.
Percent at meets and exceeds:PSAE: Math
Goal N/A
Actual We will collect and enter data.
Percent at meets and exceeds:
PSAE: ReadingGoal N/A
Actual We will collect and enter data.
High School Graduation RateGoal N/A
Actual We will collect and enter data.
20#11064943_v1

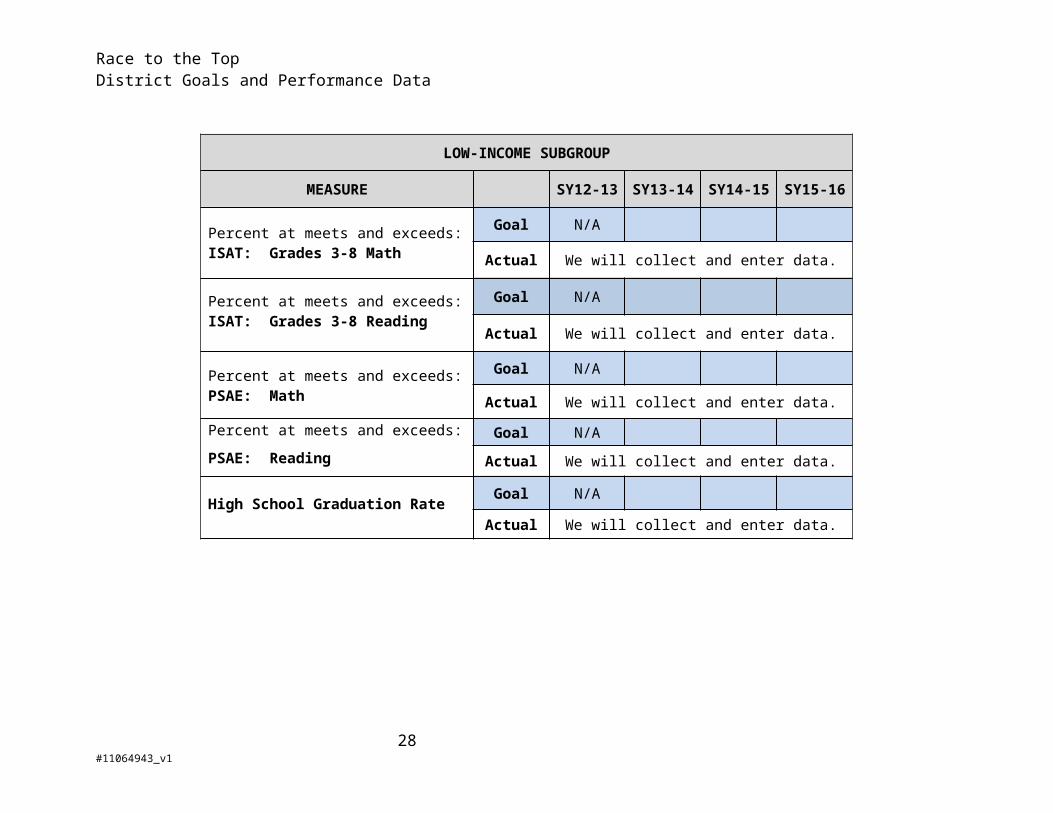
Race to the TopDistrict Goals and Performance Data
LOW-INCOME SUBGROUP
MEASURE SY12-13 SY13-14 SY14-15 SY15-16
Percent at meets and exceeds:ISAT: Grades 3-8 Math
Goal N/A
Actual We will collect and enter data.
Percent at meets and exceeds:ISAT: Grades 3-8 Reading
Goal N/A
Actual We will collect and enter data.
Percent at meets and exceeds:PSAE: Math
Goal N/A
Actual We will collect and enter data.
Percent at meets and exceeds:
PSAE: ReadingGoal N/A
Actual We will collect and enter data.
High School Graduation RateGoal N/A
Actual We will collect and enter data.
21#11064943_v1
Race to the TopDistrict Goals and Performance Data
LEP SUBGROUP (ELL)
MEASURE SY12-13 SY13-14 SY14-15 SY15-16
Percent at meets and exceeds:ISAT: Grades 3-8 Math
Goal N/A
Actual We will collect and enter data.
Percent at meets and exceeds:ISAT: Grades 3-8 Reading
Goal N/A
Actual We will collect and enter data.
Percent at meets and exceeds:PSAE: Math
Goal N/A
Actual We will collect and enter data.
Percent at meets and exceeds:
PSAE: Reading
Goal N/A
Actual We will collect and enter data.
High School Graduation RateGoal N/A
Actual We will collect and enter data.
22#11064943_v1

Race to the TopDistrict Goals and Performance Data
IEP SUBGROUP
MEASURE SY12-13 SY13-14 SY14-15 SY15-16
Percent at meets and exceeds:ISAT: Grades 3-8 Math
Goal N/A
Actual We will collect and enter data.
Percent at meets and exceeds:ISAT: Grades 3-8 Reading
Goal N/A
Actual We will collect and enter data.
Percent at meets and exceeds:PSAE: Math
Goal N/A
Actual We will collect and enter data.
Percent at meets and exceeds:
PSAE: ReadingGoal N/A
Actual We will collect and enter data.
High School Graduation RateGoal N/A
Actual
23#11064943_v1

Race to the TopDistrict Goals and Performance Data
College Attendance and Credits
We have to report to USED on the following performance metric, but to date ISBE has no baseline data on this indicator. So, this will be a measure upon which we will ask for goal setting in the future. (For the entire district and by subgroup.)
MEASURE SY12-13 SY13-14 SY14-15 SY15-16
Total College Enrollment (% of students who entered 9th grade)
Goal
Actual We will provide data
Students Completing at Least One Year of College Credit Applicable to a Degree (% of students who entered 9th grade)
Goal
Actual We will provide data
24#11064943_v1

Race to the TopDistrict Goals and Performance Data
ACHIEVEMENT GAP GOALS
For the section below, please set goals for closing the achievement gap.
Please take into consideration the following definition. High performing subgroup: Includes White, Asian, multi-racial, and Hawaiian/Pacific Islander
ReadingGrades 3-8
School YearGrade Span
Black/ High Performing Subgroup
Hispanic/ High
Performing Subgroup
LEP/ non-LEP
IEP/ non-IEP
Low/ not Low
IncomeSY 2012-
2013 Grade 3-8 Goal N/AActual We will collect and enter data.
SY 2013-2014 Grade 3-8 Goal N/A
Actual We will collect and enter data.SY 2014-
2015 Grade 3-8 GoalActual We will collect and enter data.
SY 2015-2016 Grade 3-8 Goal
Actual We will collect and enter data.SY 2016-
2017 Grade 3-8 GoalActual We will collect and enter data.
25#11064943_v1
Race to the TopDistrict Goals and Performance Data
MathGrades 3-8
School Year Grade Span
Black/ High Performing Subgroup
Hispanic/ High
Performing Subgroup LEP/ non-LEP IEP/ non-IEP
Low/ not Low Income
SY 2012-2013 Grade 3-8 GoalActual
SY 2013-2014 Grade 3-8 GoalActual
SY 2014-2015 Grade 3-8 GoalActual
SY 2015-2016 Grade 3-8 GoalActual
SY 2016-2017 Grade 3-8 GoalActual
26#11064943_v1

Race to the TopDistrict Goals and Performance Data
ReadingGrade 11
School Year Grade Span
Black/ High Performing Subgroup
Hispanic/ High
Performing Subgroup LEP/ non-LEP IEP/ non-IEP
Low/ not Low Income
SY 2012-2013 Grade 11 GoalActual
SY 2013-2014 Grade 11 GoalActual
SY 2014-2015 Grade 11 GoalActual
SY 2015-2016 Grade 11 GoalActual
SY 2016-2017 Grade 11 GoalActual
27#11064943_v1
Race to the TopDistrict Goals and Performance Data
MathGrade 11
School Year Grade Span
Black/ High Performing Subgroup
Hispanic/ High
Performing Subgroup LEP/ non-LEP IEP/ non-IEP
Low/ not Low Income
SY 2012-2013 Grade 11 GoalActual
SY 2013-2014 Grade 11 GoalActual
SY 2014-2015 Grade 11 GoalActual
SY 2015-2016 Grade 11 GoalActual
SY 2016-2017 Grade 11 GoalActual
28#11064943_v1

Race to the TopDistrict Goals and Performance Data
Supplemental Indicators
We know that your district may have set supplemental performance metrics and goals for measuring the effectiveness of your work. We would like to provide you the opportunity to provide those metrics. By providing metrics, we can better understand how you are tracking your work, meeting your goals, and around which indicators you may wish to have support from ISBE.
EXAMPLE TABLE
MEASURE SY12-13 SY13-14 SY14-15 SY15-16
Goal N/A
Actual
Goal N/A
Actual
Goal N/A
Actual
Goal N/AActual
29#11064943_v1