rstudio vs rcmdr
TRANSCRIPT

Advanced Data Analytics: R-Studio vs. Rcmdr
Jeffrey Stanton
School of Information Studies
Syracuse University
R-Studio Overview
• R-Studio is an integrated development environment to support the development of R code
• R-Studio runs in two ways:– Desktop versions for Linux, Mac, and Windows: Single user, perfect for a
laptop or desktop machine– Server version for Linux: Allows any number of remote users to run R-
Studio within a web-browser; facilitates sharing of code and data among team members
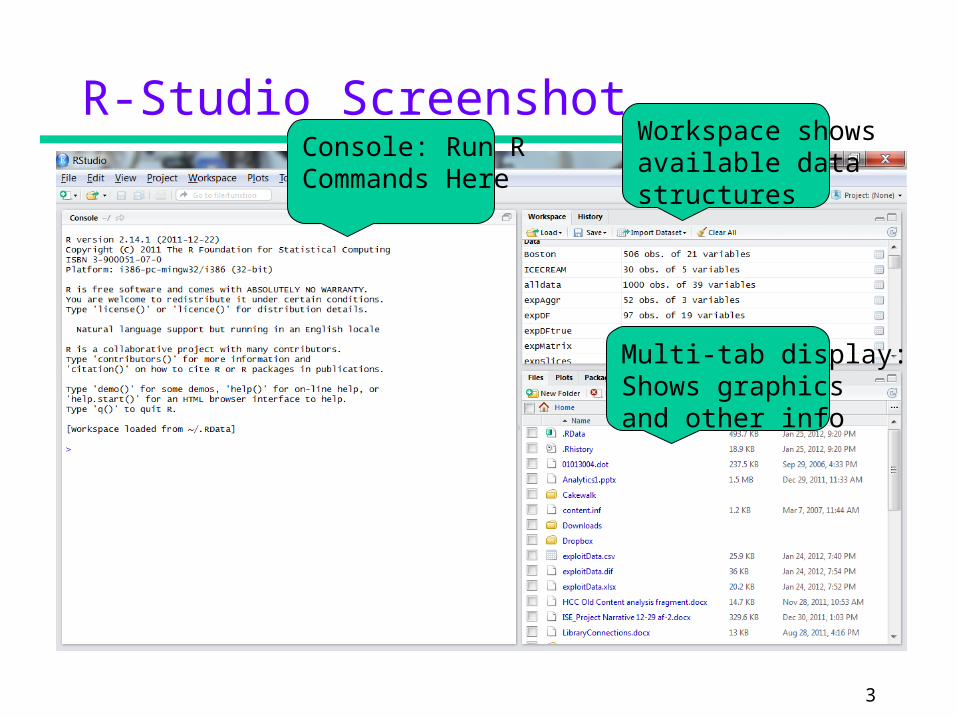
• R-Studio uses the graphical environment of the computer to facilitate interactions with R:– Console window for typing code– Data window for reviewing data frame and other data structures– Workspace for viewing all of the data loaded into R– Plot area for showing visualizations– Tabbed window controls to show other displays
2
R-Studio Screenshot
3
Console: Run R Commands Here
Workspace showsavailable datastructures
Multi-tab display:Shows graphicsand other info

R-Studio Data File Import Dialog
4
Name of data frame to be created with imported data
Options for parsing the textdata into fieldsand values
How the data frame will lookonce the dataare imported

R-Studio Data Display
5
Familiar spread-sheet-like displayformat
Does not support editing of the dataor variable names
Rmcdr Overview
• Rcmdr – “R Commander” – is a graphical user interface for statistical analysis laid on top of R; R runs in another window and can be used directly at any time; uses buttons and menus extensively and supports picking variable names from lists
• Rcmdr was purpose built to simplify access to the most essential statistical analysis methods; more convenient for users who have used SPSS, SAS or Stata
• Does not provide direct access to the R command line, but does show the code that is running
• Not richly graphical, but does show three panes:– Script Window: Shows the most recently run commands/code– Output Window: Displays statistical output and results from commands– Messages Window: Shows errors, warnings, and notes
6
Rcmdr Screen Shot
7
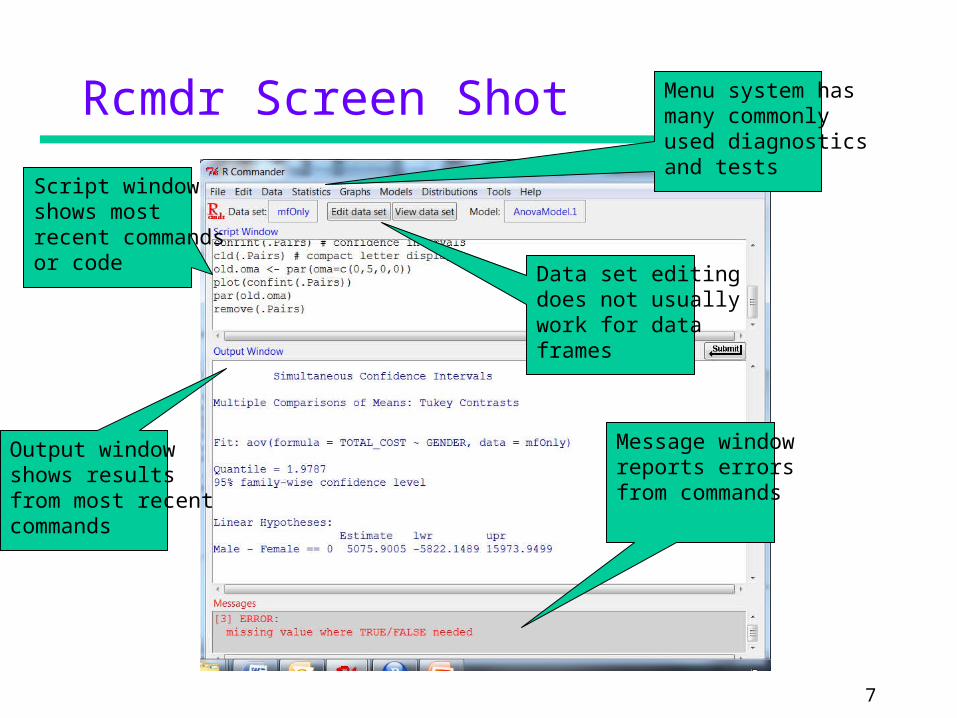
Script windowshows most recent commandsor code
Output window shows results from most recentcommands
Message windowreports errors from commands
Menu system hasmany commonlyused diagnosticsand tests
Data set editingdoes not usuallywork for dataframes
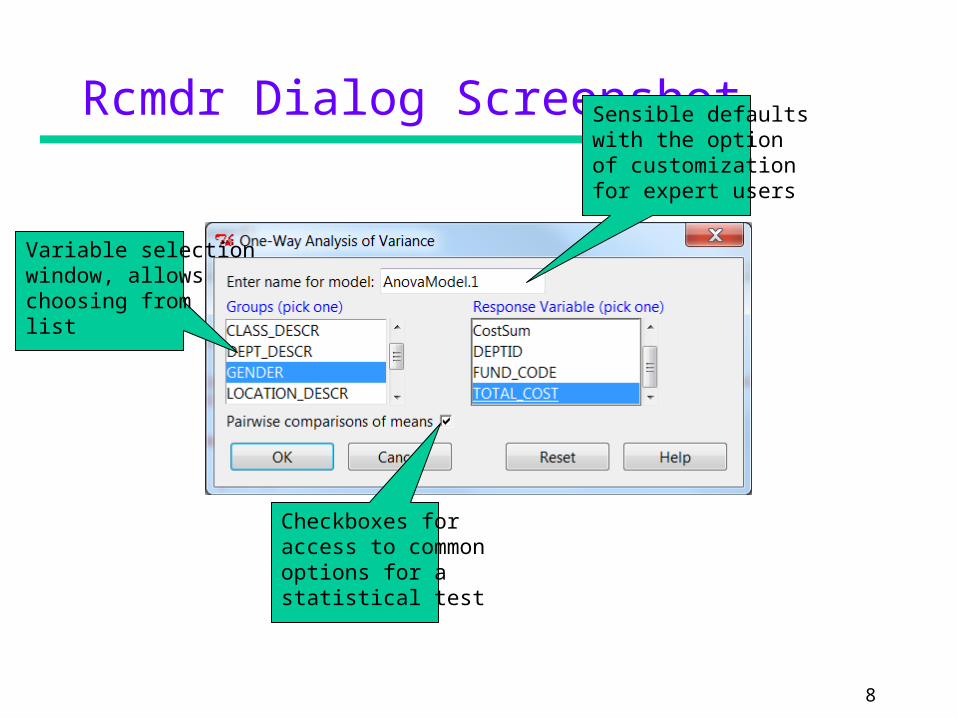
Rcmdr Dialog Screenshot
8
Variable selectionwindow, allows choosing from list
Checkboxes foraccess to commonoptions for astatistical test
Sensible defaultswith the optionof customizationfor expert users
Comparison and Guidelines
• R-Studio is more flexible and powerful, and provides direct access to R code
• Rcmdr is simpler and more user friendly, particularly when focusing on statistical diagnostics and analysis
• Both are good for viewing data, neither is good for editing it• Use Rcmdr with structured, conventional data (rectangular, with
variables in columns and cases in rows), whenever the task involves running statistical tests
• Use R-studio for any project that requires direct interaction with code and/or manipulation of complex data
• Note that you can invoke Rcmdr from within R-Studio and it will work fine on a single user installation; also note that when the user requests a plot in Rcmdr, it will NOT immediately appear in the plot window of R-Studio – this is a known bug that may be fixed in future versions
9
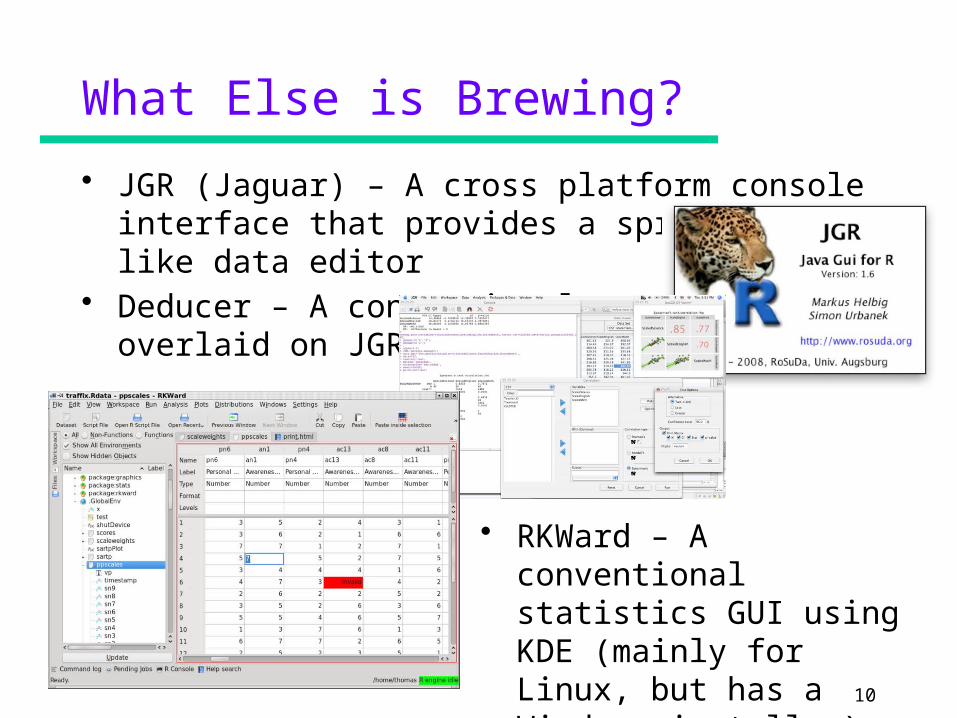
What Else is Brewing?
• JGR (Jaguar) – A cross platform console interface that provides a spreadsheet-like data editor
• Deducer – A conventional statistics GUIoverlaid on JGR
10
• RKWard – A conventional statistics GUI using KDE (mainly for Linux, but has a Windows installer)
Demonstrating Mastery
• If you have not already done so, install and run R-Studio• Import a data set into R-Studio using the “Import Dataset”
dialog (usually a button on the Workspace tab in the upper right pane)
• In addition, install the Rcmdr package and “library(Rcmdr)” to start the graphical interface (for assistance, see Chapter 2 of Thomas Hogan’s “Bare Bones R”
• In Rcmdr, make your imported data the “active” data set and use the menus to run any statistical diagnostic or test
11