rs 17-1576, june 2017 - hawaii doe · maggie cox . nolan kawano . hubert minn . col. peter p. santa...
TRANSCRIPT

RS 17-1576, June 2017
ii
The Honorable David Y. Ige Governor, State of Hawaii
BOARD OF EDUCATION
Lance A. Mizumoto, Chairperson Brian J. De Lima, Esq., Vice Chairperson
Patricia Bergin Grant Y.M. Chun
Maggie Cox Nolan Kawano
Hubert Minn Col. Peter P. Santa Ana (Military Liaison) Kenneth Uemura
Bruce Voss Andrea Lyn Mateo (Student Representative)
DEPARTMENT OF EDUCATION
Kathryn S. Matayoshi, Superintendent of Education Keith Hayashi, Interim Deputy Superintendent
Donna Lum Kagawa Farrington-Kaiser-Kalani Complex Area Superintendent
Ruth Silberstein Kaimuki-McKinley-Roosevelt Complex Area Superintendent
John Erickson Aiea-Moanalua-Radford Complex Area Superintendent
Robert Davis Leilehua-Mililani-Waialua Complex Area Superintendent
Heidi W. Armstrong Campbell-Kapolei Complex Area Superintendent
Ann A. Mahi Nanakuli-Waianae Complex Area Superintendent
Rodney T.O. Luke Pearl City-Waipahu Complex Area Superintendent
Matthew Ho Castle-Kahuku Complex Area Superintendent
Lanelle Hibbs Acting Kailua-Kalaheo Complex Area Superintendent
Brad Bennett Hilo-Waiakea Complex Area Superintendent
Chad Keone Farias Kau-Keeau-Pahoa Complex Area Superintendent
Arthur Souza Honokaa-Kealakehe-Kohala-Konawaena Complex Area Superintendent
Leila Hayashida Baldwin-Kekaulike-Maui Complex Area Superintendent
Lindsay Ball Hana-Lahainaluna-Lanai-Molokai Complex Area Superintendent
William N. Arakaki Kapaa-Kauai-Waimea Complex Area Superintendent
Suzanne Mulcahy, Assistant Superintendent Office of Curriculum, Instruction and Student Support
Amy Kunz, Senior Assistant Superintendent & Chief Financial Officer Office of Fiscal Services
Barbara Krieg, Assistant Superintendent Office of Human Resources
Clyde Sonobe, Assistant Superintendent & Chief Information Officer Office of Information Technology Services
Col. (Ret.) Dann S. Carlson, Assistant Superintendent Office of School Facilities and Support Services
Tammi Chun, Assistant SuperintendentOffice of Strategy, Innovation and Performance

iii
ContentsAt-A-Glance ......................................................................................................................................................................... 1
Table 1. Official Fall Enrollment for Grades K to 12, Public and Private Schools .............................. 1
Figure 1. Percent of Public School Students with Special Needs, Unduplicated Count ............................................................................................................................................. 1
Table 2. Teacher Credentials ..................................................................................................................... 1
Table 3. Funding by Source and Year (in millions) ................................................................................. 2
Table 4. Safety and Well-Being of Students ............................................................................................ 2
Table 5. Hawaii Statewide Assessment Program, 2013-2016 .............................................................. 2
Table 6. English Language Arts/Literacy, Math, and Science by Grade and Achievement Levels .................................................................................................................... 3
Figure 2. Percent Meeting Standard, 2007-2016 ESEA* English Language Arts, State Summary ............................................................................................................................ 4
Figure 3. Percent Meeting Standard, 2007-2016 ESEA* Mathematics, State Summary ....................................................................................................................................... 4
Figure 4. Percent Proficient, 2013-2015 ESEA* Science**, State Summary ...................................... 4
Table 7. Four-Year Graduation & Dropout Rates .................................................................................... 5
Table 8. High School Diplomas .................................................................................................................. 5
Table 9. Honors Recognition Certificates, Class of 2016 ...................................................................... 5
Table 10. Advanced Placement (AP) Program ........................................................................................ 5
Profiles and Trends ........................................................................................................................................................... 6
Table 11. Number of Public Schools (and percentage of total) ............................................................ 6
Table 12. Student Enrollment ..................................................................................................................... 6
Table 13. Progress and Completion .......................................................................................................... 6
Table 14. Staff, Full-Time Equivalent Positions ....................................................................................... 7
Table 15. State Demographics ................................................................................................................... 7
School Finance .................................................................................................................................................................. 8
Table 16. State School Budget................................................................................................................... 8
Table 17. Key Finance Indicators .............................................................................................................. 8

iv
Figure 5. Percentage of State & Local Expenditures per Capita Supporting Public Schools .......................................................................................................................................... 9
Educational Assessments ................................................................................................................................................ 9
Table 18. National Assessment of Educational Progress (NAEP) ....................................................... 9
Figure 6. National Assessment of Educational Progress (NAEP), Percent Proficient in Grade 4 Reading and Math, 2005-2015 .......................................................... 10
Figure 7. National Assessment of Educational Progress (NAEP), Percent Proficient in Grade 8 Reading and Math, 2005-2015 .......................................................... 10
Table 19. Hawaii Statewide Assessment Program, Percent Meeting Standard ............................... 11
Table 20. Students by Complex in SY 2015-16 ..................................................................................... 12
Table 21. Teachers by Complex in SY 2015-16 .................................................................................... 13
Table 22. SY 2015-16 Wellness Indicators by Complex (results for participating schools) ....................................................................................................................................... 14
Table 23. Percent Meeting Standard on the Hawaii Statewide Assessment Program English Language Arts/Literacy Assessments by Grade and Complex for SY 2015-16 .......................................................................................................... 15
Table 24. Percent Meeting Standard on the Hawaii Statewide Assessment Program Mathematics Assessments by Grade and Complex for SY 2015-16 ....................................................................................................................................... 16
Table 25. Percent Meets and Exceeds Proficiency on the Hawaii Statewide Assessment Program Science Assessments by Grade and Complex for SY 2015-16 ................................................................................................................................. 17
Appendices ........................................................................................................................................................................ 18
Appendix A. Glossary .............................................................................................................................. 18
Appendix B. References and Resources ............................................................................................ 22
Appendix C. Supplemental Data Tables ............................................................................................. 25

1
At-A-Glance Note: Unless otherwise noted, data are about "public schools” and represents both department and charter schools.
Table 1. Official Fall Enrollment for Grades K to 12, Public and Private Schools
Sources: Hawaii State Department of Education: Office of Strategy, Innovation and Performance: Assessment and Accountability Branch: Accountability Section; Hawaii Association of Independent Schools.
*Change in Kindergarten Age
Figure 1. Percent of Public School Students with Special Needs, Unduplicated Count
Note: Total may not be exactly 100% due to rounding. * General education students with a disability which allows them to receive accommodations/modifications. Source: Hawaii State Department of Education: Office of Strategy, Innovation and Performance: Assessment and Accountability Branch:
Accountability Section.
Table 2. DOE Teacher Credentials
2013-14 2014-15 2015-16
Fully Licensed 97% 96% 96%
Advanced Degree 36% 37% 37%
5+ Years at the Same School 60% 60% 59% Note: These figures are based on headcount for DOE schools and do not include teachers at charter schools.
Source: Hawaii State Department of Education: Office of Human Resources.
Only Economically
Disadvantaged40%
Only Special Education
3%Only English
Language Learner2%
Only Section 504*1%
Multiple Special Needs12%
No Special Needs42%
2013-14 2014-15* 2015-16
Public schools 185,273 180,895 180,409 % of total enrollment 84.8% 84.5% 84.6% Department schools 175,476 170,482 169,987 [% of public schools enrollment] [94.7%] [94.2%] [94.2%]
Charter schools 9,797 10,413 10,422 [% of public schools enrollment] [5.3%] [5.8%] [5.8%]
Private Schools 33,109 33,230 32,794 % of total enrollment 15.2% 15.5% 15.4%
Total 218,382 214,125 213,203
2
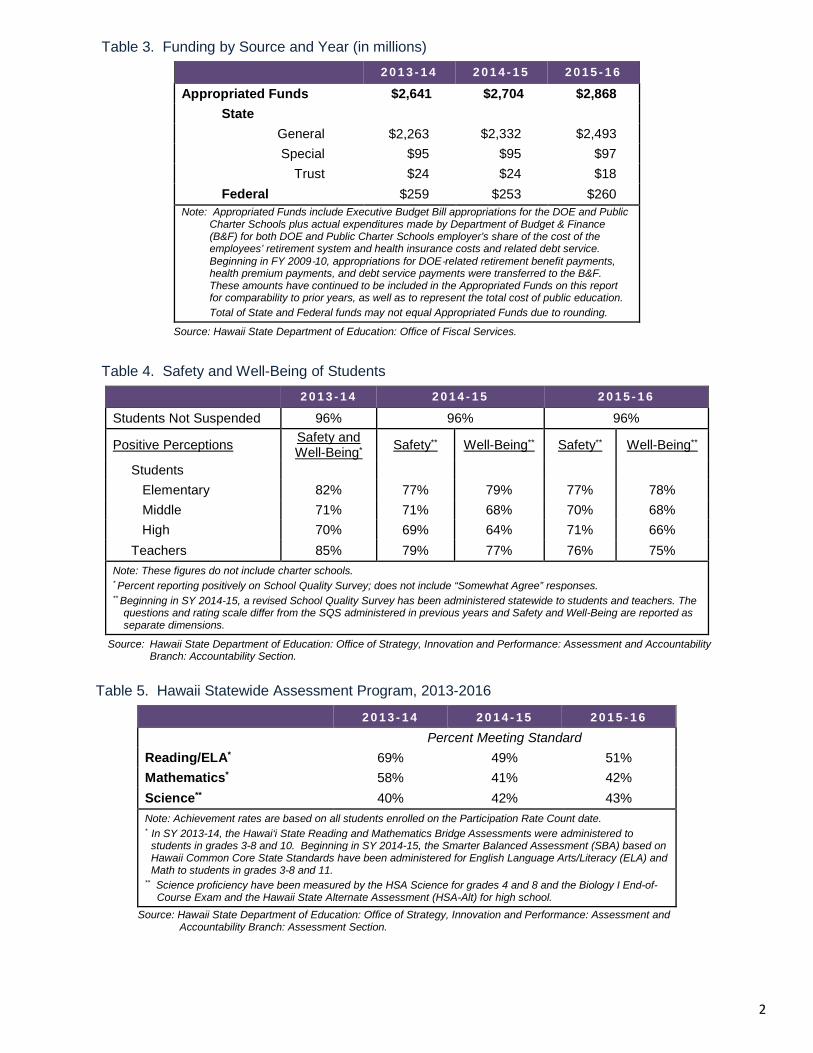
Table 3. Funding by Source and Year (in millions)
2013-14 2014-15 2015-16
Appropriated Funds $2,641 $2,704 $2,868 State
General $2,263 $2,332 $2,493 Special $95 $95 $97
Trust $24 $24 $18 Federal $259 $253 $260
Note: Appropriated Funds include Executive Budget Bill appropriations for the DOE and Public Charter Schools plus actual expenditures made by Department of Budget & Finance (B&F) for both DOE and Public Charter Schools employer’s share of the cost of the employees’ retirement system and health insurance costs and related debt service. Beginning in FY 2009‐10, appropriations for DOE‐related retirement benefit payments, health premium payments, and debt service payments were transferred to the B&F. These amounts have continued to be included in the Appropriated Funds on this report for comparability to prior years, as well as to represent the total cost of public education. Total of State and Federal funds may not equal Appropriated Funds due to rounding.
Source: Hawaii State Department of Education: Office of Fiscal Services.
Table 4. Safety and Well-Being of Students
2013-14 2014-15 2015-16
Students Not Suspended 96% 96% 96%
Positive Perceptions Safety and Well-Being* Safety** Well-Being** Safety** Well-Being**
Students Elementary 82% 77% 79% 77% 78% Middle 71% 71% 68% 70% 68% High 70% 69% 64% 71% 66% Teachers 85% 79% 77% 76% 75% Note: These figures do not include charter schools. * Percent reporting positively on School Quality Survey; does not include “Somewhat Agree” responses. ** Beginning in SY 2014-15, a revised School Quality Survey has been administered statewide to students and teachers. The
questions and rating scale differ from the SQS administered in previous years and Safety and Well-Being are reported as separate dimensions.
Source: Hawaii State Department of Education: Office of Strategy, Innovation and Performance: Assessment and Accountability Branch: Accountability Section.
Table 5. Hawaii Statewide Assessment Program, 2013-2016
Source: Hawaii State Department of Education: Office of Strategy, Innovation and Performance: Assessment and Accountability Branch: Assessment Section.
2013-14 2014-15 2015-16
Percent Meeting Standard Reading/ELA* 69% 49% 51% Mathematics* 58% 41% 42% Science** 40% 42% 43% Note: Achievement rates are based on all students enrolled on the Participation Rate Count date. * In SY 2013-14, the Hawai‘i State Reading and Mathematics Bridge Assessments were administered to
students in grades 3-8 and 10. Beginning in SY 2014-15, the Smarter Balanced Assessment (SBA) based on Hawaii Common Core State Standards have been administered for English Language Arts/Literacy (ELA) and Math to students in grades 3-8 and 11.
** Science proficiency have been measured by the HSA Science for grades 4 and 8 and the Biology I End-of-Course Exam and the Hawaii State Alternate Assessment (HSA-Alt) for high school.

3
Table 6. English Language Arts/Literacy, Math, and Science by Grade and Achievement Levels
ELA/Literacy % *
Grade 2014-15 2015-16
Not met Nearly Met Met Exceeded Not met Nearly Met Met Exceeded
3 27% 26% 23% 24% 27% 24% 23% 26% 4 31% 20% 24% 24% 30% 20% 24% 26% 5 26% 20% 32% 22% 25% 19% 31% 25% 6 25% 28% 32% 15% 22% 26% 34% 17% 7 31% 25% 32% 12% 28% 25% 33% 14% 8 25% 28% 35% 13% 25% 26% 36% 13%
11 22% 25% 33% 20% 20% 24% 34% 21% Math % *
Grade 2014-15 2015-16
Not met Nearly Met Met Exceeded Not met Nearly Met Met Exceeded
3 24% 26% 30% 19% 23% 24% 32% 21% 4 21% 33% 29% 17% 21% 32% 28% 18% 5 29% 29% 21% 21% 29% 29% 21% 21% 6 30% 32% 20% 18% 30% 31% 21% 19% 7 33% 29% 22% 15% 32% 31% 22% 15% 8 34% 26% 21% 18% 36% 26% 20% 18%
11 43% 27% 20% 9% 42% 28% 21% 10%
Science %**
Grade 2014-15 2015-16
Well-Below Approaches Meets Exceeds Well-Below Approaches Meets Exceeds
4 9% 37% 44% 10% 9% 35% 44% 11% 8 24% 40% 30% 6% 25% 38% 30% 8%
HS* 30% 40% 25% 5% 27% 40% 27% 6% Note: Total may not be exactly 100% due to rounding. Achievement rates are based on all students enrolled on the Participation Rate Count date. ** HS (High School) Science proficiency includes results of the Biology I End of Course exam and HSA-Alternate
Source: Hawaii State Department of Education: Office of Strategy, Innovation and Performance: Assessment and Accountability Branch: Assessment Section.
* Based on the Smarter Balanced Assessment

4
Figure 2. Percent Meeting Standard, 2007-2016 ESEA* English Language Arts, State Summary
* Currently known as the Strive HI Performance System; prior to 2013, it was NCLB/AYP. ** Prior to 2013, the achievement rate was based on Full Academic Year which overlapped two school years. Beginning 2013, achievement is based
on students enrolled for Full School Year. *** Hawaii State Reading Bridge Assessment was administered to grades 3-8 and 10. **** Smarter Balanced English Language Arts/Literacy (ELA) Assessment was administered to grades 3-8 and 11. Source: Hawaii State Department of Education: Office of Strategy, Innovation and Performance: Assessment and Accountability Branch:
Assessment Section.
Figure 3. Percent Meeting Standard, 2007-2016 ESEA* Mathematics, State Summary
* Currently known as the Strive HI Performance System; prior to 2013, it was NCLB/AYP. ** Prior to 2013, the achievement rate was based on Full Academic Year which overlapped two school years. Beginning 2013, achievement is
based on students enrolled for Full School Year. *** Hawaii State Mathematics Bridge Assessment was administered to grades 3-8 and 10. **** Smarter Balanced Mathematics Assessment was administered to grades 3-8 and 11. Source: Hawaii State Department of Education: Office of Strategy, Innovation and Performance: Assessment and Accountability Branch:
Assessment Section.
Figure 4. Percent Proficient, 2013-2016 ESEA* Science**, State Summary
* Currently known as Strive HI Performance System. Achievement is based on students enrolled for the Full School Year. ** The percent proficient is based on the results of the HSA Science administered to grades 4 and 8 and the Biology I EOC exam and HSA-Alt for
students in high school. Source: Hawaii State Department of Education: Office of Strategy, Innovation and Performance: Assessment and Accountability Branch:
Assessment Section.
0%
20%
40%
60%
80%
100%
60% 62% 65% 67% 67% 72% 72% 69%
48% 51%
0%
20%
40%
60%
80%
100%
39% 43% 45% 49% 55% 60% 60% 59%41% 42%
0%20%40%60%80%
100%
2012-13 2013-14 2014-15 2015-16
34% 40% 42% 43%

5
Table 7. Four-Year Graduation & Dropout Rates
2013-14 2014-15 2015-16 Graduation 82.1% 81.5% 82.2% Dropouts 14.5% 14.7% 14.2% Others* 3.4% 3.8% 3.6% Note: Percentages based on preliminary Adjusted Cohort Graduation Rate data. * “Others” include high school completers who received a special education certificate of
completion in lieu of a diploma and students who are still attending school and did not graduate within the four-year time frame.
Source: Hawaii State Department of Education: Office of Strategy, Innovation and Performance: Assessment and Accountability Branch: Accountability Section.
Table 8. High School Diplomas
2013-14 2014-15 2015-16 BOE Recognition Diploma 15.4% 13.5% -- * Regular Diploma 80.6% 80.8% 94.3% Note: Totals do not sum to 100% because non-diploma (certificate) recipients and non-completers make up the
remainder of school completion statistics. These figures do not include the charter schools.
*Beginning with the Class of 2016, the BOE Recognition Diploma will no longer be awarded, instead Honors Certificates are awarded.
Source: Hawaii State Department of Education: Office of Strategy, Innovation and Performance: Assessment and Accountability Branch: Accountability Section.
Table 9. Honors Recognition Certificates, Class of 2016
2015-16 Academic Honors Recognition Certificate 16.4% CTE Honors Recognition Certificate 4.5% STEM Honors Recognition Certificate 2.7% Note: Beginning with the Class of 2016, Honors Recognition Certificates are awarded to
students who earned a high school diploma and completed the requirements for the Academic, CTE, or STEM Honors. Students are able to earn a certificate for each honors distinction. The percent is based on the number of students in the Class of 2016.
Source: Hawaii State Department of Education: Office of Strategy, Innovation and Performance: Assessment and Accountability Branch: Accountability Section.
Table 10. Advanced Placement (AP) Program
2013-14 2014-15 2015-16
Number of students enrolled in at least one AP course 5,470 5,677 6,481
Number of students who took at least one AP exam 5,081 5,631 5,958
Number of exams taken 7,402 8,270 8,972
Number of AP exam results with a score of 3 or higher 3,013 3,383 3,634
Percent of exams passed 41% 42% 41% Source: Hawaii State Department of Education: Office of Curriculum, Instruction and Student Support.

6
Profiles and Trends Table 11. Number of Public Schools (and percentage of total schools by type)
2013-14 2014-15 2015-16 Total 288 100% 289 100% 290 100% DOE Elementary 167 58% 167 58% 168 58% DOE Middle/Intermediate 38 13% 38 13% 38 13% DOE High 33 11% 33 11% 33 11% DOE Multi-Level 16 6% 16 6% 16 6% Charter 33 11% 34 12% 34 12% Special (HSDB) 1 <1% 1 <1% 1 <1% Complex Areas 15 15 15 Note: Totals may not be exactly 100% due to rounding.
Source: Hawaii State Department of Education: Office of Strategy, Innovation and Performance: Assessment and Accountability Branch: Accountability Section.
Table 12. Student Enrollment 2013-14 2014-15 2015-16
Official Enrollment Count 185,273 100% 180,895 100% 180,409 100% K-6 107,920 58% 103,287 57% 102,874 57% 7-8 26,324 14% 26,349 15% 26,910 15% 9-12 51,029 28% 51,259 28% 50,625 28%
Note: Totals may not be exactly 100% due to rounding. Special Education (SPED) 17,741 10% 17,350 10% 17,415 10% English Language Learner (ELL) 13,501 7% 12,144 7% 11,083 6% Economically Disadvantaged* 94,315 51% 91,388 51% 91,177 51% * Students whose family income qualifies them for assistance through the National School Lunch Program are included in the “economically disadvantaged” count. For SY 2015-16, all students enrolled in schools participating in the Community Eligibility Provision (CEP) were included in the “economically disadvantaged” count. CEP schools for SY 2015-16 were all schools in the Molokai Complex, Linapuni Elementary, and Mountain View Elementary. All students enrolled in a CEP school receive free meals regardless of their family's income.
Source: Hawaii State Department of Education: Office of Strategy, Innovation and Performance: Assessment and Accountability Branch: Accountability Section.
Table 13. Progress and Completion 2013-14 2014-15 2015-16 Daily Average Attendance Rates
Elementary 94.5% 94.9% 94.8% Middle/Intermediate 94.6% 94.5% 94.6% High 92.4% 92.8% 93.1% Multi-level 92.5% 91.7% 91.7% Charter 93.5% 93.3% 94.3%
Retention Rates Elementary <0.5% <0.5% <0.5% Middle/Intermediate 1.0% 0.9% 0.9%
Graduation Rate* (on time) Grades 9 through 12 82.1% 81.5% 82.2% Drop Out Rate Grades 9 through 12 14.5% 14.7% 14.2% Others** Grades 9 through 12 3.4% 3.8% 3.6% * Percentages based on preliminary Adjusted Cohort Graduation Rate data. ** “Others” include high school completers who received a special education certificate of completion in lieu of a diploma and
students who are still attending school and did not graduate within the four-year time frame.
Source: Hawaii State Department of Education: Office of Strategy, Innovation and Performance: Assessment and Accountability Branch: Accountability Section.

7
Table 14. Staff, Full-Time Equivalent Positions
2013-14 2014-15 2015-16 Classroom Teachers 11,106.0 10,941.5 10,984.4 Librarians 181.0 170.5 157.0 Counselors 606.0 602.5 611.8 Administrators School 541.0 593.0 600.0 State & Complex Area 231.0 251.0 275.0 Other Support Staff 8,638.5 8,674.6 8,697.8 Total 21,303.5 21,233.1 21,326.0
Source: Hawaii State Department of Education: Office of Strategy, Innovation and Performance: Assessment and Accountability Branch: Accountability Section.
Table 15. State Demographics
2010 Census 2014 Est. 2015 Est.
Population 1,360,301 1,419,561 1,431,603 Youth age under 5 years 87,407 91,480 92,093 Youth age 5-9 83,361 86,283 85,708 Youth age 10-14 81,539 82,802 85,501 Youth age 15-19 85,994 80,091 77,902 Median Age, in years 38.6 38.1 37.7
Households
Total 455,338 450,769 445,936 Families 313,907 314,151 309,386 Avg. Family Size 3.4 3.6 3.7
Income
Median Family Income $76,134* $79,187** $83,823*** Per Capita Income $28,882* $29,736** $31,052*** Poverty, Families in 6.7% 7.8% 6.9%
Educational Attainment
Percent high school or higher 89.9% 91.7% 90.9% Percent 4-yr degree or higher 29.5% 31.0% 31.4%
* 2010 inflation-adjusted dollars. ** 2014 inflation-adjusted dollars. *** 2015 inflation-adjusted dollars.
Source: U.S. Census Bureau, American Community Survey.

8
School Finance
Table 16. State School Budget
2013-14 2014-15 2015-16 APPROPRIATED FUNDS (millions) State General $2,263 $2,332 $2,493 Special $95 $95 $97 Trust $24 $24 $18 Federal $259 $253 $260 Total $2,641 $2,704 $2,868 EXPENDITURES (millions) State General $2,225 $2,286 $2,446 Special $40 $49 $47 Trust $8 $20 $7 Federal $289 $231 $217 Total $2,562 $2,586 $2,717 Note: Appropriated Funds include Executive Budget Bill appropriations for the DOE and Public Charter
Schools plus actual expenditures made by Department of Budget & Finance (B&F) for both DOE and Public Charter Schools employer’s share of the cost of the employees’ retirement system and health insurance costs and related debt service. Beginning in FY 2009‐10, appropriations for DOE‐related retirement benefit payments, health premium payments, and debt service payments were transferred to the B&F. These amounts have continued to be included in the Appropriated Funds on this report for comparability to prior years, as well as to represent the total cost of public education. Expenditures include both expenditures and encumbrances for the DOE and Public Charter Schools. Total of State and Federal funds may not equal Appropriated Funds due to rounding.
Source: Hawaii State Department of Education: Office of Fiscal Services.
Table 17. Key Finance Indicators
2010-11 2011-12 2012-13 Key Finance Indicators
Per pupil expenditure* $11,924 $11,973 $11,743
Percent state & local expenditures for public education (per capita) 15.9% 15.4% 15.3%
Rank** 50th 50th 50th * Figures are as reported in the 2015 Digest of Education Statistics and may have been updated from previous reports. Data for SY 2012-
13 were the most current available at the time of publication. ** Rank is determined by comparing the “Percent state and local expenditures for public education (per capita)” of Hawaii to that of the
other 49 states. Sources: U.S. Census Bureau; National Center for Education Statistics.

9
Figure 5. Percentage of State & Local Expenditures per Capita Supporting Public Schools
* No data available Note: Comparisons are made with states most similar to Hawaii on measures directly related to school finance. Measures
include K-12 enrollment, population, per capita income, per capita state and local revenue, and per capita state and local expenditures. Data for SY 2012-13 were the most current available at the time of publication.
Source: National Center for Education Statistics
Educational Assessments Table 18. National Assessment of Educational Progress (NAEP)
2011 2013 2015 (Percent Proficient & Advanced) Hawaii Nation Hawaii Nation Hawaii Nation Reading Grade 4 27% 32% 30% 34% 29% 35% Grade 8 26% 32% 28% 34% 26% 33% Mathematics Grade 4 40% 40% 46% 41% 38% 39% Grade 8 30% 34% 32% 34% 30% 32% Science Grade 4 -- -- -- -- 30% 37% Grade 8 22% 31% -- -- 23% 33%
Source: Hawaii State Department of Education: Office of Strategy, Innovation and Performance: Assessment and Accountability Branch: Accountability Section.
10%
15%
20%
25%
30%
Hawaii
Delaware
Nebraska
Rhode Island
Wyoming
U. S. Average

10
Figure 6. National Assessment of Educational Progress (NAEP), Percent Proficient in Grade 4 Reading and Math, 2005-2015
Source: Hawaii State Department of Education: Office of Strategy, Innovation and Performance:
Assessment and Accountability Branch: Accountability Section.
Figure 7. National Assessment of Educational Progress (NAEP), Percent Proficient in Grade 8 Reading and Math, 2005-2015
Source: Hawaii State Department of Education: Office of Strategy, Innovation and Performance:
Assessment and Accountability Branch: Accountability Section.
23%26% 26% 27%
30% 29%
18%20%
22%
40%
46%
38%
10%
15%
20%
25%
30%
35%
40%
45%
50%
2005 2007 2009 2011 2013 2015
Reading
Math
27%
33%
37%
26%
28%26%
18%21%
25%
30%32%
30%
10%
15%
20%
25%
30%
35%
40%
45%
50%
2005 2007 2009 2011 2013 2015
Reading
Math

11
Table 19. Hawaii Statewide Assessment Program, Percent Meeting Standard 2012-13 2013-14 All Schools Department
Schools Only Charter
Schools Only All Schools Department Schools Only
Charter Schools Only
Reading Reading* Grade 3 71.9% 72.4% 63.4% 65.1% 65.1% 64.0% Grade 4 74.2% 74.6% 66.4% 70.3% 70.8% 62.3% Grade 5 73.1% 73.4% 69.0% 68.8% 68.9% 66.1% Grade 6 74.6% 74.6% 74.6% 70.1% 70.1% 70.0% Grade 7 72.5% 72.2% 77.7% 70.0% 69.8% 73.0% Grade 8 73.7% 73.5% 77.7% 71.7% 71.3% 77.1% Grade 10 70.5% 70.3% 76.2% 67.7% 67.3% 77.0%
Mathematics Mathematics* Grade 3 68.4% 69.0% 58.6% 63.1% 63.1% 62.7% Grade 4 66.8% 67.5% 55.1% 62.4% 62.9% 54.2% Grade 5 62.6% 63.2% 52.8% 64.7% 65.2% 55.3% Grade 6 60.6% 60.9% 56.5% 54.9% 55.4% 48.1% Grade 7 56.5% 57.2% 45.4% 55.2% 55.4% 52.1% Grade 8 60.3% 61.0% 49.7% 59.1% 60.0% 45.8% Grade 10 46.9% 47.1% 42.6% 42.4% 42.5% 38.5%
Science Science Grade 4 44.6% 45.1% 34.5% 52.9% 53.5% 41.9% Grade 8 29.4% 29.2% 33.2% 34.8% 34.8% 35.2% HS*** 24.0% 24.0% 27.8% 30.2% 29.9% 37.3%
2014-15 2015-16 All Schools Department
Schools Only Charter
Schools Only All Schools Department Schools Only
Charter Schools Only
English Language Arts/Literacy** English Language Arts/Literacy** Grade 3 46.6% 46.9% 40.6% 49.4% 49.7% 44.7% Grade 4 48.2% 48.6% 42.2% 50.1% 50.7% 39.1% Grade 5 53.9% 54.4% 46.1% 56.0% 56.6% 48.1% Grade 6 46.8% 47.0% 43.0% 51.5% 51.7% 48.4% Grade 7 43.9% 43.6% 48.8% 47.2% 47.2% 47.7% Grade 8 46.8% 46.7% 48.9% 48.9% 48.7% 51.7% Grade 11 52.8% 52.8% 54.7% 55.5% 55.4% 58.1%
Mathematics** Mathematics** Grade 3 49.7% 49.9% 44.5% 53.4% 53.7% 46.6% Grade 4 46.2% 46.3% 44.0% 47.1% 47.6% 38.1% Grade 5 42.3% 42.7% 35.0% 42.4% 42.7% 38.3% Grade 6 38.2% 38.7% 30.8% 39.5% 39.9% 33.8% Grade 7 37.6% 37.8% 35.3% 37.0% 37.1% 35.7% Grade 8 39.1% 39.7% 31.6% 37.7% 37.9% 34.3% Grade 11 29.5% 29.7% 23.4% 30.3% 30.4% 28.3%
Science Science Grade 4 53.9% 54.4% 45.1% 55.1% 56.0% 40.0% Grade 8 36.7% 36.9% 33.5% 37.2% 37.4% 34.6% HS*** 30.6% 30.7% 27.6% 33.2% 33.3% 29.3%
Note: Achievement rates are based on all students tested. * Hawai‘i State Reading and Mathematics Bridge Assessments were administered in SY 2013-14. ** Smarter Balanced English Language Arts/Literacy (ELA) and Mathematics Assessments is administered beginning
SY 2014-15. The Smarter Balanced Assessments are administered to grades 3-8 and 11. *** HS (High School) Science proficiency includes results for the Biology I End of Course exam and HSA-Alt. Source: Hawaii State Department of Education: Office of Strategy, Innovation and Performance: Data
Governance and Analysis Branch.

12
Table 20. Students by Complex in SY 2015-16
Enrollment* Economically Disadvantaged
Special Education ELL Graduated
on-time ALL SCHOOLS 180,409 91,177 17,415 11,083 82%
Department Schools 169,987 85,281 16,585 10,826 83% HONOLULU: 2 Complex Areas / 6 Complexes
Farrington 7,578 70% 8% 18% 75% Kaiser 3,818 15% 8% 2% 87% Kalani 4,259 22% 8% 6% 90% Kaimuki 4,190 59% 11% 17% 64% McKinley 4,390 69% 8% 19% 78% Roosevelt 5,881 41% 8% 5% 86% CENTRAL: 2 Complex Areas / 6 Complexes
Aiea 4,025 49% 10% 6% 87% Moanalua 5,066 30% 8% 4% 93% Radford 6,074 32% 10% 2% 94% Leilehua 7,674 55% 11% 5% 80% Mililani 7,962 21% 9% 1% 93% Waialua 1,436 48% 10% 3% 82% LEEWARD: 3 Complex Areas / 6 Complexes
Campbell 10,826 44% 8% 3% 87% Kapolei 6,431 40% 10% 2% 85% Nanakuli 2,340 83% 16% 5% 75% Waianae 5,888 77% 13% 4% 72% Pearl City 6,255 36% 9% 3% 83% Waipahu 8,377 59% 8% 14% 80% WINDWARD: 2 Complex Areas / 4 Complexes
Castle 4,722 49% 13% 2% 84% Kahuku 3,370 50% 10% 3% 83% Kailua 2,645 54% 14% 2% 67% Kalaheo 3,758 29% 10% 2% 87% HAWAII: 3 Complex Areas / 9 Complexes
Hilo 4,009 67% 13% 5% 78% Waiakea 3,560 54% 10% 2% 88% Kau 844 89% 10% 19% 67% Keaau 2,963 83% 13% 6% 85% Pahoa 1,546 88% 14% 5% 74% Honokaa 1,783 65% 12% 6% 81% Kealakehe 4,866 59% 8% 12% 76% Kohala 787 69% 14% 4% 79% Konawaena 2,367 68% 9% 7% 72% MAUI: 2 Complex Areas / 7 Complexes
Baldwin 4,454 49% 9% 5% 80% Kekaulike 4,130 55% 11% 3% 82% Maui 7,354 50% 8% 11% 82% Hana 337 79% 12% 0% 94% Lahainaluna 3,148 49% 9% 13% 74% Lanai 557 46% 15% 10% 81% Molokai 957 100% 12% 1% 89% KAUAI: 1 Complex Area / 3 Complexes
Kapaa 3,169 51% 10% 4% 91% Kauai 3,868 46% 8% 5% 89% Waimea 2,273 51% 10% 5% 85% SPECIAL
Hawaii School for the Deaf and the Blind 50 68% 100% 34% 43%
Charter Schools 10,422 5,896 830 257 71% * Based on the Fall 2015 Official Enrollment Count.
Source: Hawaii State Department of Education: Office of Strategy, Innovation and Performance: Assessment and Accountability Branch: Accountability Section.

13
Table 21. Teachers by Complex in SY 2015-16 Classroom
Teachers (headcount)
Fully Licensed 5+ Years at same School
Advanced Degree
Average Years Teaching
Experience
ALL SCHOOLS 11,272 10,818 6,630 4,143 12.3 Department Schools 10,942 10,493 6,459 4,000 12.4 96% 59% 37% HONOLULU Farrington 507 97% 63% 37% 12.9 Kaiser 218 97% 63% 39% 12.7 Kalani 255 100% 63% 47% 13.2
Kaimuki 283 98% 69% 40% 15.4 McKinley 281 99% 60% 41% 13.3 Roosevelt 360 98% 64% 36% 13.5 CENTRAL Aiea 255 96% 57% 38% 12.1 Moanalua 308 99% 66% 45% 13.3 Radford 385 99% 69% 33% 13.7
Leilehua 520 96% 63% 42% 12.9 Mililani 459 97% 69% 39% 13.6 Waialua 88 98% 64% 41% 13.0 LEEWARD Campbell 668 95% 51% 34% 10.5 Kapolei 392 97% 55% 35% 11.8
Pearl City 400 98% 68% 32% 14.3 Waipahu 534 96% 67% 33% 13.1
Nanakuli 166 90% 40% 38% 8.6 Waianae 401 88% 47% 26% 9.4 WINDWARD Castle 329 97% 56% 36% 13.7 Kahuku 226 95% 65% 29% 12.6
Kailua 226 96% 58% 39% 11.9 Kalaheo 241 99% 51% 41% 11.9 HAWAII Hilo 274 98% 58% 32% 14.0 Waiakea 235 99% 60% 32% 13.7
Kau 64 80% 33% 34% 7.3 Keaau 190 98% 62% 35% 13.5 Pahoa 109 98% 49% 41% 12.2
Honokaa 115 96% 50% 45% 12.3 Kealakehe 307 90% 56% 33% 10.9 Kohala 59 93% 54% 44% 12.6 Konawaena 154 88% 48% 30% 10.8 MAUI Baldwin 261 95% 52% 39% 12.0 Kekaulike 267 93% 57% 36% 12.3 Maui 456 96% 57% 38% 11.3
Hana 29 93% 59% 38% 11.3 Lahainaluna 198 96% 56% 41% 10.2 Lanai 37 86% 51% 30% 9.7 Molokai 74 97% 70% 34% 13.8 KAUAI Kapaa 196 95% 55% 31% 12.1 Kauai 248 95% 56% 38% 11.6 Waimea 152 94% 57% 41% 12.0 SPECIAL
Hawaii School for the Deaf and the Blind 15 80% 13% 80% 5.1
Charter Schools 330 98% 52% 43% 9.8 Source: Hawaii State Department of Education: Office of Strategy, Innovation and Performance: Assessment and
Accountability Branch: Accountability Section.

14
Table 22. SY 2015-16 Wellness Indicators by Complex (results for participating schools)
Number of
Participating Schools
Participation Rate
(of total public school count)
Schools with a
Wellness Committee
All Food & Beverages Sold Met
Compliance
Required Health Ed
Classes Met Recommended
Minutes
Required PE Classes Met
Recommended Minutes
≥20 Minutes
Recess Per Day
Average % of
Wellness Guidelines
Met STATE OVERALL 239 93% 83% 35% 77% 84% 83% 84%
Aiea-Moanalua-Radford 21 95% 90% 48% 67% 81% 81% 83% Aiea Complex 7 100% 71% 71% 71% 71% 86% 85% Moanalua Complex 5 83% 100% 40% 60% 80% 80% 81% Radford Complex 9 100% 100% 33% 67% 89% 78% 83%
Baldwin-Kekaulike-Maui 18 90% 67% 44% 89% 78% 83% 83% Baldwin Complex 5 100% 60% 0% 100% 60% 80% 82% Kekaulike Complex 7 100% 57% 43% 86% 71% 86% 79% Maui Complex 6 75% 83% 83% 83% 100% 83% 89%
Campbell-Kapolei 15 88% 87% 20% 80% 87% 80% 83% Campbell Complex 8 80% 75% 25% 75% 88% 75% 83% Kapolei Complex 7 100% 100% 14% 86% 86% 86% 84%
Castle-Kahuku 16 100% 94% 44% 75% 94% 69% 87% Castle Complex 10 100% 100% 30% 70% 90% 80% 86% Kahuku Complex 6 100% 83% 67% 83% 100% 50% 89%
Farrington-Kaiser-Kalani 25 100% 84% 36% 84% 92% 88% 84% Farrington Complex 12 100% 75% 33% 83% 100% 83% 81% Kaiser Complex 6 100% 100% 0% 67% 83% 83% 84% Kalani Complex 7 100% 86% 71% 100% 86% 100% 92%
Hana-Lahainaluna-Lanai-Molokai 8 73% 75% 50% 100% 75% 100% 83% Hana Complex 1 100% 100% 100% 100% 100% 100% 91% Lahainaluna Complex 3 75% 67% 67% 100% 67% 100% 85% Lanai Complex 0 0% -- -- -- -- -- -- Molokai Complex 4 80% 75% 25% 100% 75% 100% 80%
Hilo-Laupahoehoe-Waiakea 13 100% 69% 46% 69% 85% 77% 84% Hilo Complex 9 100% 56% 44% 67% 89% 78% 84% Waiakea Complex 4 100% 100% 50% 75% 75% 75% 83%
Honokaa-Kealakehe-Kohala- Konawaena 19 100% 74% 16% 79% 79% 95% 82%
Honokaa Complex 4 100% 100% 0% 100% 75% 100% 87% Kealakehe Complex 6 100% 83% 33% 83% 83% 100% 86% Kohala Complex 3 100% 33% 0% 100% 67% 100% 78% Konawaena Complex 6 100% 67% 17% 50% 83% 83% 79%
Kailua-Kalaheo 11 79% 91% 36% 73% 82% 73% 81% Kailua Complex 5 63% 80% 40% 60% 80% 80% 80% Kalaheo Complex 6 100% 100% 33% 83% 83% 67% 82%
Kaimuki-McKinley-Roosevelt 26 93% 81% 27% 77% 85% 92% 85% Kaimuki Complex 10 100% 80% 20% 90% 90% 100% 88% McKinley Complex 7 88% 71% 57% 86% 86% 100% 87% Roosevelt Complex 9 90% 89% 11% 56% 78% 78% 80%
Kapaa-Kauai-Waimea 16 100% 81% 6% 63% 81% 88% 79% Kapaa Complex 5 100% 80% 0% 60% 80% 60% 73% Kauai Complex 5 100% 80% 0% 60% 80% 100% 83% Waimea Complex 6 100% 83% 17% 67% 83% 100% 81%
Kau-Keaau-Pahoa 8 89% 100% 0% 88% 88% 75% 79% Kau Complex 2 100% 100% 0% 100% 100% 50% 82% Keaau Complex 3 75% 100% 0% 100% 100% 100% 76% Pahoa Complex 3 100% 100% 0% 67% 67% 67% 79%
Leilehua-Mililani-Waialua 19 95% 95% 42% 74% 84% 89% 87% Leilehua Complex 10 100% 90% 40% 70% 90% 90% 86% Mililani Complex 6 86% 100% 67% 83% 83% 100% 92% Waialua Complex 3 100% 100% 0% 67% 67% 67% 78%
Nanakuli-Waianae 9 100% 67% 33% 67% 78% 67% 81% Nanakuli Complex 3 100% 100% 33% 100% 100% 100% 90% Waianae Complex 6 100% 50% 33% 50% 67% 50% 77%
Pearl City-Waipahu 15 88% 93% 67% 80% 80% 73% 89% Pearl City Complex 10 100% 100% 80% 90% 90% 90% 93% Waipahu Complex 5 71% 80% 40% 60% 60% 40% 80%
Source: Hawaii State Department of Health.

15
Table 23. Percent Meeting Standard on the Hawaii Statewide Assessment Program English Language Arts/Literacy Assessments by Grade and Complex for SY 2015-16
District Complex Area Complex 3 4 5 6 7 8 11 All
Tested Grades
ALL SCHOOLS 49% 50% 56% 51% 47% 49% 56% 51% Department Schools 50% 51% 57% 52% 47% 49% 55% 51% Honolulu Farrington-Kaiser-Kalani Farrington 35% 45% 44% 36% 33% 40% 53% 41% Kaiser 70% 70% 76% 76% 72% 63% 73% 72% Kalani 78% 74% 81% 65% 68% 63% 69% 71% Kaimuki-McKinley-Roosevelt Kaimuki 50% 51% 55% 40% 42% 50% 54% 48% McKinley 36% 41% 48% 21% 32% 30% 63% 42% Roosevelt 70% 72% 72% 61% 55% 55% 72% 65% Central Aiea-Moanalua-Radford Aiea 54% 52% 53% 53% 55% 62% 65% 55% Moanalua 54% 60% 67% 64% 77% 73% 69% 67% Radford 59% 59% 69% 65% 53% 40% 54% 58% Leilehua-Mililani-Waialua Leilehua 53% 53% 64% 53% 51% 55% 61% 55% Mililani 71% 72% 79% 70% 68% 71% 61% 70% Waialua 57% 64% 56% 61% 51% 38% 46% 53% Leeward Campbell-Kapolei Campbell 46% 48% 53% 53% 49% 55% 56% 51% Kapolei 45% 44% 51% 52% 52% 48% 52% 49% Nanakuli-Waianae Nanakuli 24% 17% 31% 28% 18% 17% 23% 23% Waianae 21% 31% 34% 24% 22% 14% 41% 26% Pearl City-Waipahu Pearl City 65% 68% 69% 70% 58% 63% 71% 66% Waipahu 38% 37% 46% 43% 33% 35% 49% 40% Windward Castle-Kahuku Castle 52% 57% 60% 63% 47% 53% 60% 56% Kahuku 58% 47% 53% 57% 49% 48% 62% 53% Kailua-Kalaheo Kailua 54% 59% 70% 66% 25% 40% 48% 57% Kalaheo 60% 60% 69% 61% 70% 73% 67% 66% Hawaii Hilo-Waiakea Hilo 43% 46% 62% 56% 42% 51% 49% 50% Waiakea 45% 50% 53% 56% 58% 52% 60% 53% Honokaa-Kealakehe-Kohala-
Konaweana Honokaa 42% 32% 36% 60% 31% 34% 49% 40%
Kealakehe 35% 39% 47% 35% 36% 33% 56% 40% Kohala 42% 36% 40% 52% 42% 55% 44% 44% Konawaena 47% 56% 56% 49% 52% 38% 45% 50% Kau-Keaau-Pahoa Kau 18% 20% 26% 22% 23% 26% 38% 24% Keaau 47% 40% 43% 31% 36% 44% 32% 39% Pahoa 32% 32% 48% 42% 36% 49% 48% 40% Maui Baldwin-Kekaulike-Maui Baldwin 44% 34% 50% 33% 31% 41% 44% 40% Kekaulike 49% 51% 57% 40% 39% 44% 60% 48% Maui 57% 51% 64% 49% 41% 46% 53% 51% Hana-Lahainaluna-Lanai-Molokai Hana 21% 45% 46% 40% 48% 55% 58% 44% Lahainaluna 43% 58% 57% 46% 40% 33% 31% 45% Lanai 7% 21% 38% 19% 32% 23% 30% 25% Molokai 34% 30% 38% 51% 42% 28% 47% 37% Kauai Kapaa-Kauai-Waimea Kapaa 43% 43% 47% 55% 41% 50% 57% 48% Kauai 53% 53% 45% 57% 37% 47% 57% 50% Waimea 45% 42% 49% 42% 34% 35% 44% 42%
Special Hawaii School for the Deaf and the Blind Kalani na na na na na na na na
Charter Schools
45% 39% 48% 48% 48% 52% 58% 48% Note: Achievement rates are based on all students who were administered either the Smarter Balanced ELA/Literacy Assessment, the HSA-Alt, or the
Kaiapuni Assessment of Educational Outcomes.
na = Data not reported to maintain student confidentiality (see FERPA). Source: Hawaii State Department of Education: Office of Strategy, Innovation and Performance: Data Governance and Analysis Branch.

16
Table 24. Percent Meeting Standard on the Hawaii Statewide Assessment Program Mathematics Assessments by Grade and Complex for SY 2015-16
District Complex Area Complex 3 4 5 6 7 8 11 All
Tested Grades
ALL SCHOOLS 53% 47% 42% 39% 37% 38% 30% 42%
Department Schools 54% 48% 43% 40% 37% 38% 30% 42% Honolulu Farrington-Kaiser-Kalani Farrington 38% 43% 34% 26% 26% 25% 25% 31% Kaiser 71% 70% 63% 73% 72% 61% 42% 65% Kalani 79% 77% 68% 54% 62% 69% 48% 66% Kaimuki-McKinley-Roosevelt Kaimuki 56% 49% 42% 28% 35% 48% 13% 41% McKinley 45% 46% 39% 10% 15% 13% 49% 38% Roosevelt 70% 68% 62% 47% 50% 45% 55% 56% Central Aiea-Moanalua-Radford Aiea 59% 51% 36% 38% 49% 66% 25% 47% Moanalua 54% 53% 51% 54% 57% 56% 43% 52% Radford 61% 51% 49% 57% 37% 30% 35% 48% Leilehua-Mililani-Waialua Leilehua 58% 46% 44% 36% 43% 49% 30% 45% Mililani 73% 68% 66% 52% 55% 48% 44% 58% Waialua 66% 54% 46% 48% 43% 30% 23% 45% Leeward Campbell-Kapolei Campbell 50% 41% 40% 40% 31% 32% 29% 38% Kapolei 54% 42% 40% 42% 51% 41% 21% 42% Nanakuli-Waianae Nanakuli 33% 19% 20% 25% 12% 7% 3% 18% Waianae 29% 32% 26% 20% 17% 17% 14% 23% Pearl City-Waipahu Pearl City 67% 69% 58% 66% 54% 53% 42% 60% Waipahu 48% 41% 36% 42% 32% 29% 31% 37% Windward Castle-Kahuku Castle 50% 49% 39% 48% 33% 35% 25% 41% Kahuku 65% 48% 47% 45% 47% 38% 23% 46% Kailua-Kalaheo Kailua 58% 48% 43% 65% 13% 22% 18% 45% Kalaheo 68% 51% 44% 52% 47% 61% 35% 52% Hawaii Hilo-Laupahoehoe-Waiakea Hilo 47% 40% 41% 41% 34% 44% 21% 39% Waiakea 49% 48% 42% 37% 43% 41% 33% 42% Honokaa-Kealakehe-Kohala-
Konaweana Honokaa 42% 37% 27% 48% 29% 25% 25% 34%
Kealakehe 35% 33% 31% 20% 18% 30% 37% 29% Kohala 33% 20% 23% 29% 22% 19% 22% 24% Konawaena 55% 50% 43% 32% 35% 28% 30% 40% Kau-Keaau-Pahoa Kau 25% 16% 16% 14% 11% 6% 8% 14% Keaau 55% 41% 33% 14% 20% 26% 17% 30% Pahoa 34% 29% 32% 22% 23% 41% 26% 30% Maui Baldwin-Kekaulike-Maui Baldwin 39% 35% 38% 24% 27% 26% 26% 31% Kekaulike 56% 48% 44% 19% 21% 34% 27% 36% Maui 59% 46% 48% 30% 25% 35% 28% 40% Hana-Lahainaluna-Lanai-Molokai Hana 26% 36% 36% 26% 22% 36% 16% 29% Lahainaluna 50% 46% 38% 26% 30% 19% 18% 33% Lanai 22% 31% 13% 6% 18% 12% 15% 17% Molokai 44% 33% 28% 46% 38% 29% 24% 34% Kauai Kapaa-Kauai-Waimea Kapaa 42% 44% 34% 35% 24% 20% 26% 32% Kauai 59% 48% 35% 45% 40% 46% 24% 43% Waimea 57% 42% 38% 28% 26% 20% 19% 36%
Special Hawaii School for the Deaf and the Blind Kalani na na na na na na na na
Charter Schools 47% 38% 38% 34% 36% 34% 28% 37% Note: Achievement rates are based on all students who were administered either the Smarter Balanced Math Assessment, the HSA-Alt, or the Kaiapuni
Assessment of Educational Outcomes.
na = Data not reported to maintain student confidentiality (see FERPA). Source: Hawaii State Department of Education: Office of Strategy, Innovation and Performance: Data Governance and Analysis Branch.

17
Table 25. Percent Meets and Exceeds Proficiency on the Hawaii Statewide Assessment Program Science Assessments by Grade and Complex for SY 2015-16
District Complex Area Complex 4 8 HS* All Tested Grades
ALL SCHOOLS 55% 37% 33% 43% Department Schools 56% 37% 33% 43% Honolulu Farrington-Kaiser-Kalani Farrington 54% 23% 26% 35% Kaiser 82% 61% 46% 63% Kalani 86% 57% 47% 64% Kaimuki-McKinley-Roosevelt Kaimuki 58% 36% na 48% McKinley 40% 10% 21% 28% Roosevelt 71% 36% 43% 51% Central Aiea-Moanalua-Radford Aiea 55% 59% 38% 52% Moanalua 66% 54% 44% 54% Radford 65% 37% 39% 51% Leilehua-Mililani-Waialua Leilehua 57% 53% 23% 47% Mililani 80% 55% 51% 62% Waialua 81% 57% 31% 56% Leeward Campbell-Kapolei Campbell 52% 33% 45% 44% Kapolei 49% 29% 27% 35% Nanakuli-Waianae Nanakuli 20% 27% 12% 20% Waianae 40% 13% 16% 23% Pearl City-Waipahu Pearl City 77% 43% 38% 55% Waipahu 41% 35% 30% 35% Windward Castle-Kahuku Castle 59% 49% 37% 50% Kahuku 53% 26% 31% 38% Kailua-Kalaheo Kailua 70% 50% 36% 53% Kalaheo 74% 57% 52% 61% Hawaii Hilo-Laupahoehoe-Waiakea Hilo 47% 32% 21% 34% Waiakea 55% 38% 42% 44% Honokaa-Kealakehe-Kohala-
Konaweana Honokaa 49% 10% 26% 33%
Kealakehe 47% 30% 39% 39% Kohala 45% 29% 40% 38% Konawaena 54% 26% 28% 38% Kau-Keaau-Pahoa Kau 24% 12% 26% 21% Keaau 43% 27% 23% 31% Pahoa 33% 27% 13% 27% Maui Baldwin-Kekaulike-Maui Baldwin 46% 30% 30% 36% Kekaulike 54% 47% 41% 48% Maui 54% 41% 19% 40% Hana-Lahainaluna-Lanai-Molokai Hana 45% 32% 28% 37% Lahainaluna 49% 24% 23% 32% Lanai 19% 14% 7% 14% Molokai 44% 15% 15% 22% Kauai Kapaa-Kauai-Waimea Kapaa 45% 33% 41% 40% Kauai 54% 27% 31% 37% Waimea 46% 23% 15% 30%
Special Hawaii School for the Deaf and the Blind Kalani na na na na
Charter Schools 40% 35% 29% 35% Note: Achievement rates are based on all students tested. *HS (High School) Science proficiency is measured by the Biology I End of Course exam and the HSA-Alt. na = Data not reported to maintain student confidentiality (see FERPA). Source: Hawaii State Department of Education: Office of Strategy, Innovation and Performance: Data Governance and
Analysis Branch.

18
Appendices
Appendix A. Glossary This glossary explains the educational and fiscal terms and measures contained in the Superintendent’s Annual Report. An “na” indicates data are “not appropriate” or “not reportable.” A “--” indicates data are missing or unavailable. Due to rounding of percentages, there may be slight differences among published reports (for example, 9.6% may be reported as 10% for the same measure in different reports).
Administrators, School: This is a Full-Time Equivalent (FTE) count of all principals and vice-principals.
Administrators, State and Complex Area: This is an FTE count of the positions responsible for the administrative support of programs, curriculum, and state or federal legal requirements at the complex area and state levels. Examples of FTE positions include complex areas superintendents, evaluation specialists, facilities planners, personnel specialists, test development specialists, budget specialists, information (data) specialists, state and district curriculum/educational specialists, and safety/security program specialists.
Appropriated Funds: Funds determined by the state legislature and enacted by the governor to provide basic support for the Hawaii State Department of Education to operate a statewide school district.
Attendance Rate: The percentage of the official student enrollment attending school every day during the school year. For example, 95% means that on any given day during the given school year, an average of 95% of the students are present in school.
Average Years Teaching Experience: This is a simple average of the number of years of approved teaching experience within the Hawaii Department of Education.
Charter Schools: Charter schools are public schools operated and managed by independent governing boards. They operate under a performance contract with the State Public Charter School Commission, the statewide charter school authorizer. The Commission approves quality applications for new charter schools, monitors the performance and legal compliance of existing charter schools, and is responsible to the Board of Education.
Classroom Teachers, FTE or Headcount: An FTE Classroom Teacher count is a position count of all teachers who are directly teaching students. Unlike FTE, “Headcount” is a simple count of the number of teachers who are directly teaching students. Thus, 1.5 FTE teachers may have a headcount of two (one 1.0 FTE and one 0.5 FTE) or three (three teachers in 0.5 FTE positions).
Complex: This is a smaller division within a Complex Area consisting of a high school and the middle/ intermediate and elementary schools within its attendance boundary.
Complex Area: This is an administrative unit made up of two or more complexes.
Demographics, State: Figures reported by the U.S. Census Bureau for years other than decennial 10-year censuses are estimates and are updated periodically. Such estimates in this report are from the American Community Survey. For an explanation of terms, definitions, and criteria used for classification, please visit the U.S. government website for the census: www.census.gov.
Dropout Rate: This four-year dropout rate is the percentage of high school students who have not returned to school and have either officially exited as “drop-outs”, have school enrollment statuses that are undetermined, or have not graduated within four years.

19
Economically Disadvantaged: These are students whose families meet the income qualifications for the federal free/reduced-cost lunch program. This is an indicator of school-community poverty.
English Language Learners (ELL): Students certified as receiving English-as-a-second-language services.
Enrollment Count, Official: The official enrollment count of each school is reported to the state upon the yearly opening of school. A school’s enrollment may fluctuate over the course of the school year; thus, a school’s enrollment count taken mid-year may be different from its official enrollment count.
Federal Funds: Funds provided by the federal government for use by the state public school system through grants from various federal agencies, such as the U.S. Department of Education, U.S. Department of Defense, and U.S. Department of Agriculture.
Five or More Years at Same School: Percentage of teachers who have taught at one school for five or more years. It is an indicator of school staffing stability. Schools with higher levels of stability are considered most successful in implementing and sustaining school improvement efforts.
Fully Licensed: Teachers who meet the requirements (e.g., earned at least a bachelor’s degree and completed an approved teacher training program) to be fully licensed by the Hawaii State Teachers Standards Board.
Full-Time Equivalent (FTE): These are position counts and are the sum of full- and part-time positions. Note that partial counts are possible. For example, one full-time (1.0 FTE) and one half-time (0.5 FTE) would count as 1.5 FTEs.
General Funds: The primary source of funding for the state public school system provided by the state through taxpayer revenues.
Graduation, Graduation Rate, Graduate On Time, Four-Year Graduation: Count or percentage of all high school students, including public charter school students, who had completed high school within four years of their 9th-grade entry date. Special Education students receiving certificates of completion and students taking more than four years to complete high school are not included. For more information on the Adjusted Cohort Graduation Rate methodology, visit the U.S. DOE website: http://www2.ed.gov/policy/elsec/guid/hsgrguidance.pdf
Honors Recognition Certificates: Beginning with the Class of 2016, Honors Recognition Certificates will be awarded to students who meet the requirements for the Hawaii High School Diploma, attain a cumulative grade point average of 3.0 or above, and earn the required credits for Academic, CTE, or STEM Honors. Students are able to earn a certificate for each honors distinction. For more information on the graduation requirements and the Honors Recognition Certificate requirements visit the HIDOE website: http://www.hawaiipublicschools.org/TeachingAndLearning/StudentLearning/GraduationRequirements/Pages/Graduation-Requirements-2016-and-beyond.aspx
National Assessment of Educational Progress (NAEP): These are norm-referenced tests in reading, mathematics, and science developed and administered by the U.S. Department of Education to sampled groups of students in grades 4 and 8 in all states. The data from the NAEP include state results for demographic groups of students, but not for Complex Areas, schools, or individual students. The metrics that NAEP uses include average scale scores and the percentages of students achieving NAEP Advanced, NAEP Proficient, NAEP Basic, and NAEP Below Basic. Advanced and Proficient denote mastery of challenging subject matter, including success on some items that are above the grade level of the students being tested. NAEP defines Basic as denoting partial mastery of prerequisite knowledge and skills that are fundamental for proficient work at each grade assessed. Below Basic means performance below the grade level being tested. These achievement levels overlap with, but are not identical to, the proficiency levels of the Hawaii state assessments.

20
Not Suspended, Students: The number of students who are not suspended by the school and an indicator of appropriate student behavior at school. Others: Percentage of high school completers who received a special education certificate of completion in lieu of a diploma and students who are still attending school and did not graduate in the four-year time frame. These students are not included in the “Dropout” count or in the “Graduation On-time” count.
Perceptions of Safety and Well-Being, Student and Teacher: Positive responses (“Completely Agree”, “Strongly Agree” and “Agree”) to a set of items on the Hawaii State Department of Education’s annual School Quality Survey (SQS) regarding school safety and well-being. The percentage of responses that are positive is reported.
Per-Pupil Expenditure: The numbers reported by the National Center of Education Statistics (NCES) may be used for state-to-state comparisons. Numbers are based on membership and can be expected to be smaller than per-pupil expenditures based on average daily attendance. Current expenditure for public elementary and secondary education in a state is divided by the student membership. Current expenditures are funds spent for the operation of local public schools and local education agencies, including such operating expenses as salaries for school personnel, student transportation, school books and materials, and energy costs, but excluding capital outlay and interest on school debt.
Private Schools: Privately-operated schools not under the direction of the Hawaii State Department of Education.
Retention Rates for Elementary: Percentage of students, excluding kindergartners, who are not promoted to the next grade level. A low retention rate is desired.
Retention Rates for Middle & Intermediate: Percentage of 8th grade students who are not promoted to 9th grade the following year. A low retention rate is desired.
Schools, Total: The total number is the sum of all public schools. All regular public schools, public charter schools, and special schools are in this count. The Community Schools for Adults are not included.
Section 504: Regulation requiring schools to provide a “free appropriate public education” (FAPE) to each qualified student with a disability who is in the school district’s jurisdiction regardless of the nature or severity of that disability.
Special Education (SPED): This count and percentage contain all special education students listed on the official enrollment report as receiving special education services.
Special Funds: Funds generated through revenue sources other than state taxpayer revenues, such as cafeteria collections from students, adult education tuition/fees, summer school tuition, driver education fees, facility rental fees, and lost textbook penalty fees.
Special Needs, Multiple: Students identified and/or qualified as special needs under more than one of the following categories: economically disadvantaged as determined by receiving free/reduced-cost lunch, Section 504 classification, and certified as receiving special education or English Language Learner services.
Standards-Based Assessment: These tests of the Hawaii Statewide Assessment Program (HSAP) measure student achievement in English Language Arts, Mathematics, and Science based on Hawaii Department of Education content standards. The percentages shown are assessment results. “Percent Meeting Standard” is derived from test results that meet or exceed the achievement standard (i.e., achievement cut-score).
State and Local Expenditures Supporting Public Education, Percent: This percentage is published in the annual U.S. Department of Education National Center of Education Statistics (NCES) Digest of

21
Educational Statistics publication. The percentage is calculated by dividing the states’ "Total, all general expenditures per capita" by the states’ "Elementary and secondary education expenditures per capita.” The “Total, all general expenditures per capita” includes state and local government expenditures for education services, social services, and income maintenance, transportation, public safety, environment and housing, governmental administration, interest on general debt, and other general expenditures, including intergovernmental expenditure to the federal government, as reported by the state’s NCES Common Core of Data Financial Survey.
Support Staff, Other: This is an FTE count that encompasses a wide range of positions that support schools. This category may include, but is not limited to, school assessment liaisons, athletic directors, registrars, state and district resource teachers, school psychologists, custodians, cafeteria workers, school secretaries, school security guards, educational assistants, occupational therapists, mental health assistants, behavioral specialists, and student service coordinators. Note that the assignment of positions to categories is based on U.S. Department of Education National Center for Education Statistics Common Core of Data Non-Fiscal Survey requirements.
Trust Funds: Funds segregated for specific purposes, such as foundation grants and athletic gate receipts.
Wellness: Student wellness is affected by nutrition education, the food served in schools, and the amount of physical activity students engage in. The Department of Education also recognizes that when students’ wellness needs are met, they attain higher achievement levels.

22
Appendix B. References and Resources Educational and Accountability Reports Accountability Data Center
This is a web portal for educational accountability information. It complements the many federally- and state-required accountability reports at the school, complex, Complex Area, and state levels that are available as static documents on the Hawaii State Department of Education’s ARCH (Accountability Resource Center-Hawaii) website. http://arch.k12.hi.us
Enrollment
These reports have student enrollment figures by districts, state, and grade-level groups. http://www.hawaiipublicschools.org/VisionForSuccess/SchoolDataAndReports/SchoolReports/Pages/home.aspx
National Assessment of Educational Progress (NAEP)
The NAEP website has three sets of information of special interest to educators and the general public. A visitor to the website can access them by viewing the key words along the top margin. SAMPLE QUESTIONS provides the visitor with all of the released items since "state NAEP" began in 1990. ANALYZE DATA provides a tool by which an educator or a researcher can retrieve NAEP results by subjects, grades, and demographics. STATE PROFILES provides general results for all states. Anyone seeking help with accessing and using these data tools is welcome to contact NAEP state coordinator Dr. Robert Hillier at [email protected] or (808) 733-4100. The NAEP website contains a large amount of additional information and links to other assessment-related web sites. http://nces.ed.gov/nationsreportcard/naepdata/
School Quality Survey (SQS)
The survey gathers school staff, student, and parent perceptions that are useful for school improvement and planning efforts. The SQS also provides information about parent involvement and parent and student satisfaction with their schools. http://arch.k12.hi.us
School Status and Improvement Report (SSIR)
Each SSIR has a description of the school and its setting, a summary of progress in implementing Hawaii Department of Education standards, and information on school resources and educational outcomes. http://arch.k12.hi.us
Strive HI
The current school accountability and improvement system is designed to meet the needs of Hawaii’s students, educators, and schools. It aligns and connects our key state education policies and initiatives to position students and educators for success. http://www.hawaiipublicschools.org/VisionForSuccess/AdvancingEducation/StriveHIPerformanceSystem/Pages/home.aspx http://arch.k12.hi.us

23
Trend Report: Educational & Fiscal Accountability This annual report contains three years of trend data on schools, school complexes, and the Hawaii State Department of Education at selected benchmark grade levels with performance indicators in areas relating to student achievement, safety and well-being, and civic responsibility. These reports are designed to present trend data information to the public in a concise format for each complex and school as well as for the state. http://arch.k12.hi.us
Financial Reports
Allocations by School Program These annual reports contain dollar amounts allocated by Allocation Number, Program, or Organization. http://www.hawaiipublicschools.org/ConnectWithUs/Organization/Budget/Pages/home.aspx
Annual Financial Reports
This Annual Financial Report is prepared each year to inform interested persons of the total cost of public education in the State of Hawaii. The reports provide both Operating and Capital Improvement Project fund information that is useful in presenting our educational system’s financing, expenditures, and per-pupil information. http://www.hawaiipublicschools.org/VisionForSuccess/SchoolDataAndReports/StateReports/Pages/home.aspx
Audit
The annual report on the financial audit of the Hawaii State Department of Education forms an opinion on the fairness of the presentation of its financial statements to comply with requirements for state and local governments that receive federal financial assistance. http://www.hawaiipublicschools.org/VisionForSuccess/SchoolDataAndReports/StateReports/Pages/home.aspx
Budget These reports have fiscal information on budget restrictions, operating budget allocations (initial and supplemental), emergency appropriations, and biennium budgets.
http://www.hawaiipublicschools.org/ConnectWithUs/Organization/Budget/Pages/home.aspx
Special Education Reports Annual Performance Report & State Performance Plan
These documents are the state’s plans and reports in accordance with the Individuals with Disabilities Education Improvement Act of 2004. Included are evaluations of the state’s efforts and plans for improving implementation. http://www.hawaiipublicschools.org/VisionForSuccess/SchoolDataAndReports/StateReports/Pages/Special-Education-Performance-Report.aspx
Due Process Hearings Findings
The findings of due process hearings are provided for public information. http://www.hawaiipublicschools.org/VisionForSuccess/SchoolDataAndReports/StateReports/Pages/Special-Education-Performance-Report.aspx
Other Resources

24
Center on the Family This resource provides access to research reports, informational articles, videos, brochures, and other materials designed to support and strengthen families in Hawaii. The Center on the Family at the University of Hawaii-Manoa also issues an annual report on a core set of indicators reflecting overall well-being of Hawaii families. http://uhfamily.hawaii.edu
Hawaii P-3
An initiative by Hawaii P-20 to increase children’s social-emotional and cognitive development toward the end goal of reading at grade level by third grade. http://p3hawaii.org/
Hawaii P-20 Partnerships for Education
A statewide partnership led by the Good Beginnings Alliance, the Hawaii State Department of Education, and the University of Hawaii System to strengthen early childhood through post-secondary education so that all students achieve career and college success. Annual College and Career Readiness reports are available on its website. http://www.p20hawaii.org/
State Public Charter School Commission
The State Public Charter School Commission (SPCSC or Commission) is the statewide charter school authorizer whose mission is to authorize high-quality public charter schools throughout Hawaii. The Commission approves quality applications for new charter schools and monitors the performance and legal compliance of existing charter schools. Charter schools are public schools operated and managed by independent governing boards that are responsible for the schools' financial, organizational, and academic viability. Although they are funded on a "per-pupil" basis separately from Department of Education-operated schools, charter schools are open-enrollment public schools that serve all students and do not charge tuition. Annual reports are available on its website. http://www.chartercommission.hawaii.gov

25
Appendix C. Supplemental Data Tables Note: Data tables are available online at
http://arch.k12.hi.us/state/superintendent_report/annual_report.html
Table 1. Enrollment in Hawaii Public and Private Schools
Table 2. Enrollment by Complex Area
Table 3. Enrollment of Students with Special Needs
Table 4. Special Needs Affecting Public School Students in Hawaii
Table 5. Average Daily Attendance Rates by School Type
Table 6. Four-year Graduation and Dropout Rates
Table 7. Ethnicity of Students and Teachers
Table 8. Hawaii Statewide Assessment Program Results
Table 9. Chapter 19 Suspensions Categorized by Type of Incident
Table 10. Administrative Staff as a Proportion of Total Staff: Hawaii and Comparison States
Table 11. Expenditures Per Pupil: Hawaii and Comparison States
Table 12. Hawaii and States with Similar Financial Resources
Table 13. Percent of State and Local Expenditures Supporting Public Education (K-12): Hawaii and Comparison States
Table 14. Percent of State and Local Expenditures Supporting Public Education (K-12) and Per-Pupil Expenditures: All States