(rpf – iii) (proforma for submission of final · pdf file(proforma for submission of...
TRANSCRIPT
1 | P a g e Export Performance and Potential of Fruits and Vegetables
(RPF – III) (PROFORMA FOR SUBMISSION OF FINAL REPORT OF RESEARCH PROJECTS) Part - I : General Information 800 Project Code :
8001 Institute Project Code No. :70
8002 ICAR Project Code No. :
801 Name of the Institute and Division :
8011 Name & Address of the Institute : NAARM
8012 Name of the Division/Section :Research System Management
8013 Location of the Project : NAARM, Hyderabad
802 Project Title : Export Performance and Potential of Fruits and Vegetables of India in Asian Countries: Issues, Priorities and Policy concerns. 803 Priority Area : 2031 Research Approach: AppliedRes./ BasicRes./ Process Dev/ Tech. transfer 01 02 03 04 804 Specific Area :Exports
805 Duration of the Project :
8051 Date of Start of the Project : July 2012
8052 Date of Completion :September 2014
806 Total Cost/Expenditure Incurred (Give reasons for variation, if any, from the original estimated cost) 807 Executive Summary : The export of fruits and vegetables from India is slowly gaining pace. This has been possible because of improvement in overall production, diversified crop portfolio,

2 | P a g e Export Performance and Potential of Fruits and Vegetables
improvement in infrastructure and year round supply. As a result, large volumes of fruits and vegetables move from one continent to another, reducing seasonality of produce markets. Also multiple, regional and bilateral trade agreements and reduction of tariff barriers as a result of WTO negotiations in Asian regions, have further boosted the trade and access to markets, thus providing consumers in emerging markets of Asia with an expanding array of fruits and vegetables from India. 208 Key Words: Export Potential, Fruits and Vegetables, Asian Countries
Part - II Investigator Profile
810 Principal Investigator : 8101 Name :Late Dr. D Babu (till October 2013) 8102 Designation : Scientist 8103 Division/Section :RSM 8104 Location : NAARM 8105 Institute Address : NAARM, Hyderabad 811 Co-investigator : 8111 Name : Dr. K. Srinivas 8112 Designation :Principal Scientist 8113 Division/Section :RSM 8114 Location : NAARM 8115 Institute Address : NAARM, Hyderabad 812 Co-investigator : 8121 Name : Dr. Ranjit Kumar (On Deputation) 8122 Designation : Senior Scientist 8123 Division/Section : ABM 8124 Location : NAARM 8125 Institute Address : NAARM, Hyderabad 813 Co-investigator : 8131 Name : Dr. P.C. Meena 8132 Designation : Senior Scientist 8133 Division/Section : ABM 8134 Location : NAARM 8135 Institute Address : NAARM, Hyderabad
3 | P a g e Export Performance and Potential of Fruits and Vegetables
Part - III : Technical Details 820 Introduction and objectives :
India is the second largest producer of the fruits and vegetables in the World after China. She produces nearly 15 percent and 11 percent of the world’s fruits and vegetables and its production costs are less than half when compared with other parts of the world. Despite all these advantages, its share in global trade in fruits and vegetables are only 0.5 percent and 1.7 percent respectively (World Bank, 2007). The direction of India's exports is oriented towards Asian region. Asian region accounted for about 75% of India's total fruits and vegetables exports in 2003-04. Export Import Bank of India’s (EXIM Bank) latest study observed that export potential of fresh fruits and vegetables in India is not fully tapped considering the size and diversity of these sectors (EXIM Bank, 2003). 8201 Project Objectives :
1. To examine the trends in export of fruits and vegetables of India to Asian countries
2. To estimate the import demand elasticity and relative price elasticity of Indian fruits and vegetables exports to major Asian destinations
3. To assess the export competitiveness of Indian fruits and vegetables in a global
framework
4. To forecast the export potential of fruits and vegetables of India in Asian countries
5. To suggest policy measures to enhance the export of fruits and vegetables from India to Asian countries
8202 Background Information and Importance of the Project :
Atteri et al. (1994) studied the scope of exports of horticultural commodities namely fruits, vegetables and flowers in the light of economic liberalization. The share of horticultural exports in total agricultural exports rose steadily from 2.33 per cent in 1976-77 to 4 per cent in 1990-91.The pace of its rise was remarkable after liberalization when its share increased to 11 per cent in 1992-93. Negi et al. (1994) analysed the status and potential for India’s horticultural exports with special references to fruits and vegetables. Compound growth rates were worked out from data collected for the period 1976-77 to 1990-91.Horticultural exports increased at a compound growth rate of 14.80 per cent per annum during the period.Growth analysis of export earnings of different fruit and vegetable crops revealed a prominent place for grapes, banana, mango and apples.

4 | P a g e Export Performance and Potential of Fruits and Vegetables
821 Project Technical Profile :
8211 Technical Programme :
(Indicate briefly plan of procedure, techniques, instruments and special materials, organisms, special environments, etc.)
The data will be collected for the period between 1995-2010 from various secondary sources like UNCOMTRADE (Commodity Trade Statistics Database) of United Nations, World Trade Atlas, DGFT (Directorate General of Foreign Trade), DGCIS (Directorate General of Commercial Intelligence and service), CMIE(Centre for Monitoring Indian Economy) etc. Various analyses like export trends, Coefficient of variation, Instability Index, import demand elasticity, relative price elasticity, Nominal Protection Co-efficient (NPC),Relative Comparative Advantage (RCA) and Net barter terms of trade will be carried out to fulfil the objectives. Export potential of fruits and vegetables for the year 2020 will be forecasted. 8212 Total Man-months Involvement of Component Project Workers :
Scientific: 8 man months per year 822 Final Report on the Project : Detailed report containing all relevant data with a summary of results Objective 1: To examine the trends in export of fruits and vegetables of India to Asian countries It is observed that there is a almost one and half time increase in aera under fruits in India during 2001-02 due to impetus by the Union Government though National Horticulture Mission. The compound growth observed during this period for area was 5.27 (Table 1). Similarly the production has also increase from 43000 thousand MT to 81285 thousand MT during this period with a growth rate of 5.91 per cent per annum during this period. This signifies the importance given by the government to this sector. However, the low level technology infusion the productivity grew slowly at the rate of only 0.64 per cent fro 10.8 MT/Ha to only 11.6 MT/ha). Table 1: All India Area, Production and Productivity of total fruits Year Area
(000’HA) Production (000’MT)
Productivity (MT/HA)
2001-02 4010 43001 10.7 2002-03 3788 45203 11.9 2003-04 4661 45942 9.9 2004-05 5049 50867 10.1

5 | P a g e Export Performance and Potential of Fruits and Vegetables
2005-06 5324 55356 10.4 2006-07 5554 59563 10.7 2007-08 5857 65587 11.2 2008-09 6101 68466 11.2 2009-10 6329 71516 11.3 2010-11 6383 74878 11.7 2011-12 6704 76424 11.4 2012-13 6982 81285 11.6 CAGR, % 5.27 5.92 0.64
In vegetables also increase in area, production and productivity has shown and growth rate of 3.86, 5.84 and 1.91 respectively (Table 2) It is the largest producer of Okra (75%) and 2nd largest producer of Cauliflower & Brocli (34%), Binjal (27%), Cabbage (12%), Potato (11%), Onion (20%), Tomato (12%).
Table 2: All India Area, Production and Productivity of total vegetables Year Area
(000’HA) Production (000’MT)
Productivity (MT/HA)
2001-02 6156 88622 14.4 2002-03 6092 84815 13.9 2003-04 6082 88334 14.5 2004-05 6744 101246 15.0 2005-06 7213 111399 15.4 2006-07 7581 114993 15.2 2007-08 7848 128449 16.4 2008-09 7981 129077 16.2 2009-10 7985 133738 16.7 2010-11 8495 146555 17.3 2011-12 8990 156325 17.4 2012-13 9205 162187 17.6 CAGR, % 3.86 5.84 1.91
India is the 2nd largest producer of the Fruits and fresh vegetables in the world, producing about 10% of global production. Figure 1 and 2 presents top 10 fruit and vegetable producing countries in world. Despite this the exports of F&V have not picked up as expected due to the huge local demand for F& V in India.

6 | P a g e Export Performance and Potential of Fruits and Vegetables
Figure 1 : Top 10 fruit producing countries
Figure 2 : Top 10 vegetable producing countries

7 | P a g e Export Performance and Potential of Fruits and Vegetables
Growth rate as mentioned earlier is not uniform in different periods in fruits and vegetables in India. During 2003-2007 i.e. first phase of NHM the growth was impressive (Fig 3) in both fruits and vegetables and during second phase i.e. 2008-2012 there was a slack observed in both frits and vegetable area. However the production and productivity growth were fairly well during this period
Figure 2: Growth rates of F&V in different periods
The export scenario of fruits and vegetables are presented in table 3. Both are exported as fresh and processed. The growth rate was observed during three periods i.e. pre NHM 1997-98 to 2001-02, NHM-I 2002-03 to 2006-07 and NHM 3 2007-08 to 2012-13. The rate of growth were comparatively less in period I, which gradually increased in period II and period II Table 3: Commodity composition of India’s Fruit and Vegetable Exports
(In USD million) Year Fresh
Fruits
Fresh Vegetables
Processed fruits and
juices
Processed vegetables
Total fruits and
vegetables 1997-98 74.58 84.31 73.51 31.39 263.79 1998-99 63.29 65.12 69.12 39.75 237.28 1999-00 71.03 77.51 86.23 42.68 277.45 2000-01 84.71 100.18 122.09 50.04 357.02 2001-02 87.73 120.97 107.79 41.81 358.3
8 | P a g e Export Performance and Potential of Fruits and Vegetables
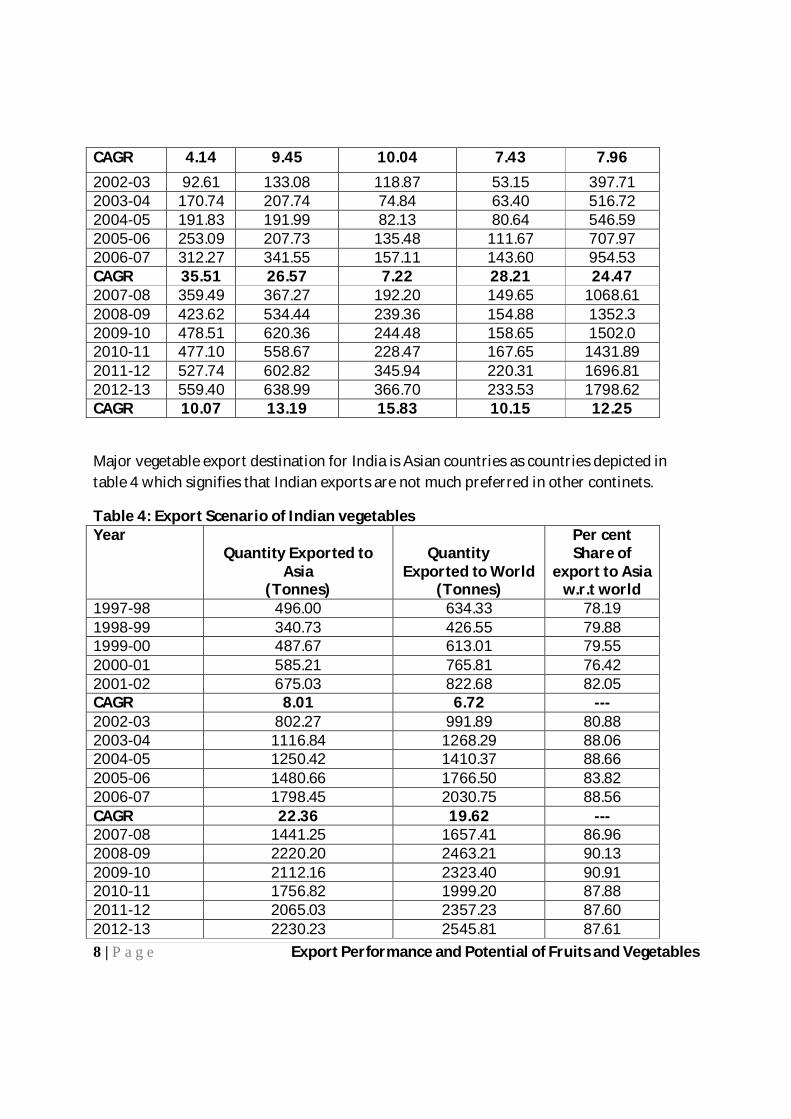
CAGR 4.14 9.45 10.04 7.43 7.96
2002-03 92.61 133.08 118.87 53.15 397.71 2003-04 170.74 207.74 74.84 63.40 516.72 2004-05 191.83 191.99 82.13 80.64 546.59 2005-06 253.09 207.73 135.48 111.67 707.97 2006-07 312.27 341.55 157.11 143.60 954.53 CAGR 35.51 26.57 7.22 28.21 24.47 2007-08 359.49 367.27 192.20 149.65 1068.61 2008-09 423.62 534.44 239.36 154.88 1352.3 2009-10 478.51 620.36 244.48 158.65 1502.0 2010-11 477.10 558.67 228.47 167.65 1431.89 2011-12 527.74 602.82 345.94 220.31 1696.81 2012-13 559.40 638.99 366.70 233.53 1798.62 CAGR 10.07 13.19 15.83 10.15 12.25
Major vegetable export destination for India is Asian countries as countries depicted in table 4 which signifies that Indian exports are not much preferred in other continets.
Table 4: Export Scenario of Indian vegetables Year
Quantity Exported to Asia
(Tonnes)
Quantity Exported to World
(Tonnes)
Per cent Share of
export to Asia w.r.t world
1997-98 496.00 634.33 78.19 1998-99 340.73 426.55 79.88 1999-00 487.67 613.01 79.55 2000-01 585.21 765.81 76.42 2001-02 675.03 822.68 82.05 CAGR 8.01 6.72 --- 2002-03 802.27 991.89 80.88 2003-04 1116.84 1268.29 88.06 2004-05 1250.42 1410.37 88.66 2005-06 1480.66 1766.50 83.82 2006-07 1798.45 2030.75 88.56 CAGR 22.36 19.62 --- 2007-08 1441.25 1657.41 86.96 2008-09 2220.20 2463.21 90.13 2009-10 2112.16 2323.40 90.91 2010-11 1756.82 1999.20 87.88 2011-12 2065.03 2357.23 87.60 2012-13 2230.23 2545.81 87.61

9 | P a g e Export Performance and Potential of Fruits and Vegetables
CAGR 9.41 9.21 --- Due to the vegetable export to the Asian countries, the value realized is also less from these countries (Table 5).
Table 5: Export Scenario of Indian vegetables (Value terms) Year Value of vegetables
exported to Asia (USD million)
Value of vegetables exported to World
(USD million)
Per cent Share
1997-98 125.71 215.43 58.35 1998-99 99.47 157.99 62.96 1999-00 136.41 217.38 62.75 2000-01 154.94 264.99 58.47 2001-02 153.75 235.92 65.17 CAGR 5.16 2.30 --- 2002-03 160.41 253.63 63.25 2003-04 246.61 328.61 75.05 2004-05 286.66 383.82 74.69 2005-06 394.54 567.87 69.48 2006-07 452.18 623.96 72.47 CAGR 29.57 25.24 --- 2007-08 446.57 626.71 71.26 2008-09 586.49 767.93 76.37 2009-10 671.02 848.85 79.05 2010-11 679.14 897.56 75.67 2011-12 703.89 1008.38 69.80 2012-13 781.32 1099.13 71.08 CAGR 12.05 12.63 ---
Exports of fruits also has the same explanation as vegetables where the majority of fruits are exported to Asian counties (Table 6) but the value realized from these counties is very less (Table 7)
Table 6: Export Scenario of Indian fruits (Quantity terms) Year Quantity Exported to
Asia (Tonnes)
Quantity Exported to World
(Tonnes)
Per cent Share
1997-98 164.93 278.23 59.28 1998-99 142.56 239.45 59.54 1999-00 184.95 316.76 58.39 2000-01 187.52 309.42 60.60 2001-02 241.91 373.61 64.75

10 | P a g e Export Performance and Potential of Fruits and Vegetables
CAGR 10.05 7.65 --- 2002-03 256.97 426 60.32 2003-04 329.26 475.24 69.28 2004-05 327.30 488.79 66.96 2005-06 403.71 591.1 68.30 2006-07 442.11 664.69 66.51 CAGR 14.53 11.76 --- 2007-08 466.68 681.92 68.44 2008-09 602.67 825.6 73.00 2009-10 615.35 840.47 73.21 2010-11 570.04 773.4 73.71 2011-12 629.80 845.25 74.51 2012-13 680.18 879.06 77.38 CAGR 7.78 5.51 ---
Table 7: Export Scenario of Indian fruits (Value terms) Year Value of fruits
exported to Asia (USD million)
Value of fruits exported to World
(USD million)
Per cent Share
1997-98 141.2 494.89 28.53 1998-99 143.59 491.32 29.23 1999-00 171.4 719.24 23.83 2000-01 173.73 599.27 28.99 2001-02 149.28 521.12 28.65 CAGR 1.40 1.30 --- 2002-03 169.47 588.6 28.79 2003-04 185.69 554.21 33.51 2004-05 227.51 757.6 30.03 2005-06 289.22 850.04 34.02 2006-07 317.3 881.05 36.01 CAGR 16.98 10.61 --- 2007-08 375.07 928.97 40.37 2008-09 482.39 1087.47 44.36 2009-10 536.53 1096.62 48.93 2010-11 540.65 1137.68 47.52 2011-12 739.35 1516.21 48.76 2012-13 857.65 1728.48 49.62 CAGR 18.49 13.03 ---

11 | P a g e Export Performance and Potential of Fruits and Vegetables
The stability of exports in quantitative terms have improved over time, that means the consistency of Indian exports of fruits and vegetables are increasing consistently without much fluctuation (Table 8).
Table 8: Growth and Instability of Indian Fruits and Vegetables Commodities Compound Annual Growth Rate
(Per cent) Coefficient of Variation
1997-02 2002-07 2007-12 1997-02 2002-07 2007-12 Vegetables (Tonnes)
8.01 22.36 9.41 24.08 29.12 16.56
Fruits (Tonnes)
10.05 14.53 7.78 20.01 20.57 11.35
Vegetables (USD million)
5.16 29.57 12.05 17.07 37.81 17.05
Fruits (USD million)
1.40 16.98 18.49 9.99 26.97 24.76
Direction of exports Fresh fruits are mainly exported to Asian countries in which UAE, Bangladesh with export of about 17% each (table 9 and figure 4) tops the list, followed by Saudi Arabia (10%). Other countries where fresh fruits are exported in less than 3% of value are Pakistan, Nepal, Kuwait, Yemen, Thailand, Japan and Oman. Table 9: Direction of India’s exports: Fresh fruits (In USD million) S.No. Countries 2007-08 2008-09 2009-10 2010-11 2011-12 1. UAE 55.92
(15.55) 81.83
(19.31) 92.84
(19.40) 87.86
(18.41) 89.64
(16.98) 2. Bangladesh 32.64
(9.07) 45.26
(10.68) 39.52 (8.25)
44.90 (9.41)
88.77 (16.82)
3. Saudi Arabia 40.03 (11.13)
57.61 (13.59)
66.37 (13.86)
62.12 (13.02)
54.23 (10.27)
4. Pakistan 0.33 (0.09)
0.28 (0.06)
1.45 (0.30)
4.99 (1.04)
17.27 (3.27)
5. Nepal 11.35 (3.15)
11.71 (2.76)
9.83 (2.05)
10.59 (2.21)
15.21 (2.88)
6. Kuwait 8.11 (2.25)
10.46 (2.46)
16.54 (3.45)
13.49 (2.82)
13.52 (2.56)
7. Yemen 11.20 (3.11)
12.17 (2.87)
14.75 (3.08)
13.67 (2.86)
10.76 (2.03)

12 | P a g e Export Performance and Potential of Fruits and Vegetables
8. Thailand 0.29 (0.08)
0.60 (0.14)
2.57 (0.53)
3.67 (0.76)
6.52 (1.23)
9. Japan 9.42 (2.62)
8.68 (2.04)
4.65 (0.97)
6.94 (1.45)
6.37 (1.20)
10. Oman 2.16 (0.60)
4.27 (1.00)
4.57 (0.95)
4.34 (0.90)
4.41 (0.83)
Top ten Asian countries total
171.45 (46.23)
232.87 (56.66)
253.09 (52.84)
252.57 (52.88)
306.7 (59.49)
Other Countries 188.04 (53.77)
190.75 (43.34)
225.42 (47.16)
224.53 (47.12)
221.04 (40.51)
Total world exports 359.49 (100.00)
423.62 (100.00)
478.51 (100.00)
477.10 (100.00)
527.74 (100.00)
Figures within parentheses are the share in total world export
Direction of processed fruits and juices also exported to UAE with 10% share in total export, whereas rest of the Asian countries where processed fruits and juices exported are Iran, Japan, Kuwait, Philippines and Bangladesh (Table 10 and figure 5).
Table 10: Direction of India’s exports: Processed fruits and juices (USD million) S.No. Countries 2007-08 2008-09 2009-10 2010-11 2011-12 1. Saudi Arabia 15.82
(8.22) 15.06 (6.29)
15.65 (6.40)
18.45 (8.07)
36.65 (10.59)
2. UAE 9.07 (4.71)
9.05 (3.78)
7.69 (3.14)
7.81 (3.42)
18.05 (5.21)
3. Iran 2.72 (1.41)
4.07 (1.70)
5.59 (2.28)
9.98 (4.36)
10.35 (2.99)
4. Japan 5.39 (2.80)
4.19 (1.75)
2.64 (1.08)
2.40 (1.05)
6.47 (1.86)
5. Kuwait 1.82 (0.94)
1.74 (0.72)
2.08 (0.84)
1.90 (0.83)
4.25 (1.22)
6. Philippines 0.26 (0.13)
0.17 (0.07)
0.82 (0.33)
2.83 (1.23)
3.37 (0.97)
7. Bangladesh 0.39 (0.20)
1.61 (0.67)
1.66 (0.67)
1.00 (0.43)
2.72 (0.78)
Top seven Asian countries total
35.47 (18.41)
35.89 (14.98)
36.13 (14.74)
44.37 (19.39)
81.86 (23.62)
Other Countries 156.73 (81.59)
203.47 (85.02)
208.35 (85.26)
184.1 (80.61)
264.08 (76.38)
Total world exports 192.2 (100.00)
239.36 (100.00)
244.48 (100.00)
228.47 (100.00)
345.94 (100.00)
Figures within parentheses are the share in total world export

13 | P a g e Export Performance and Potential of Fruits and Vegetables
Figure 4: Exports of Fresh Fruits:
Figure 5: Exports of Processed fruits & juices
US$ 527 million
US$ 346 million

14 | P a g e Export Performance and Potential of Fruits and Vegetables
Main export competitor for some of the major Indian fruits are Thailand, for Mango having advantage of price; quality, and tariffs; Spain and Iran for Pomegranate having advantage of price; Thailand and China in Litchi, Philippines and Thailand for Pineapple and Philippines for Banana (Table11). Most of the countries have the advantage of price that means they have better efficient cost reducing technology (mostly mechanization) in production of fruits.
Table 11: Competitors in Asia for exports of fruits
Products Major competitors Criteria
Mango Thailand Price & Quality, Import duty, Free from Fruit fly (VHT)
Pomegranate Spain, Iran Price
Litchi Thailand, China Time (can be advanced from NE & later from Punjab)
Pineapple Philippines, Thailand Supply chain cost
Banana Philippines Price
Fresh vegetables exports are again were realized in Asian countries. Pakistan on top of list with about 17 per cent of the fresh vegetables being exported, followed by Malaysia, Bangladesh, UAE, Sri Lanka, Nepal, Saudi Arebia, Indonesia, Qatar and Kuwait (Table 12 Fig 6) Table 12: Direction of India’s exports: Fresh vegetables (In USD million) S.No. Countries 2007-08 2008-09 2009-10 2010-11 2011-12 1. Pakistan 32.08
(8.73) 69.60
(13.02) 38.61 (6.22)
12.82 (2.29)
102.55 (17.01)
2. Malaysia 51.41 (13.99)
69.90 (13.07)
87.63 (14.12)
111.32 (19.92)
93.77 (15.55)
3. Bangladesh
105.12 (28.62)
162.52 (30.40)
243.81 (39.30)
130.14 (23.29)
88.13 (14.61)
4. UAE 55.26 (15.04)
69.26 (12.95)
61.57 (9.92)
77.43 (13.85)
75.33 (12.49)
5. Sri Lanka 28.32 (7.71)
41.36 (7.73)
44.38 (7.15)
54.48 (9.75)
47.47 (7.87)
6. Nepal 14.09 13.87 19.88 22.20 25.65

15 | P a g e Export Performance and Potential of Fruits and Vegetables
(3.83) (2.59) (3.20) (3.97) (4.25) 7. Saudi Arabia 9.41
(2.56) 12.91 (2.41)
15.90 (2.56)
17.10 (3.06)
20.65 (3.42)
8. Indonesia 2.41 (0.65)
2.98 (0.55)
2.86 (0.46)
20.77 (3.71)
18.24 (3.02)
9. Qatar 5.57 (1.51)
9.54 (1.78)
11.56 (1.86)
12.28 (2.19)
14.98 (2.48)
10. Kuwait 6.12 (1.66)
9.88 (1.84)
9.32 (1.50)
11.74 (2.10)
11.52 (1.91)
Top ten Asian countries total 309.79
(84.30) 461.82 (86.34)
535.52 (86.29)
470.28 (84.13)
498.29 (82.61)
Other Countries 57.48 (15.70)
72.62 (13.66)
84.84 (13.71)
88.39 (15.87)
104.53 (17.39)
Total world exports 367.27 (100.00)
534.44 (100.00)
620.36 (100.00)
558.67 (100.00)
602.82 (100.00)
Figures within parentheses are the share in total world export
Share of processed potatoes were very less and mostly exported to UAE, Nepal, Bangladesh and Saudi Arabia in Asia (Table 13, Fig 7)
Table 13: Direction of India’s exports: Processed vegetables (USD million) S.No. Countries 2007-08 2008-09 2009-10 2010-11 2011-12 1. UAE 3.46
(2.31) 3.07
(1.97) 3.3
(2.08) 3.91
(2.32) 6.02
(2.73) 2. Nepal 0.44
(0.29) 1.00
(0.64) 0.95
(0.60) 2.44
(1.45) 3.98
(1.80) 3. Bangladesh 11.47
(7.66) 0.71
(0.45) 0.17
(0.10) 0.74
(0.44) 2.68
(1.21) 4. Saudi Arabia 1.63
(1.08) 0.96
(0.62) 2.24
(1.41) 2.74
(1.63) 2.38
(1.07) Top four Asian countries total
17 (11.34)
5.74 (3.68)
6.66 (4.19)
9.83 (7.24)
15.06 (6.81)
Other Countries 132.65 (88.66)
149.14 (96.32)
151.99 (95.81)
157.82 (92.76)
205.25 (93.19)
Total world exports 149.65 (100.00)
154.88 (100.00)
158.65 (100.00)
167.65 (100.00)
220.31 (100.00)
Figures within parentheses are the share in total world export

16 | P a g e Export Performance and Potential of Fruits and Vegetables
Figure 6: Exports of Fresh Vegetables
Figure 7: Exports of Processed vegetables
Jordan and Syria are main competitor for tomato and Jordan for Chillies as the markets are
same, i.e. Gulf Countries (Table 14). China, Eygpt, Turkey are the main competitors for
Onion and China, Ethiopia and Nigeria for Ginger crop due to price advantage.
US$ 603 million
US$ 220

17 | P a g e Export Performance and Potential of Fruits and Vegetables
Table 14: Competitors in Asia for exports of vegetables
Products Major competitors Criteria
Tomato Jordan, Syria Same market (Gulf countries), Trade partners
Green Chillies Jordan Same market (Gulf countries)
Onion China, Egypt, Turkey Price
Ginger China, Ethiopia, Nigeria Price
Objective 2: To estimate the import demand elasticity and relative price elasticity of Indian fruits and vegetables exports to major Asian destinations Due to lack of data as envisaged the exact elasticities for import demand could not be computed. However as the proxy of this demand for fruits and vegetables the income demand has been worked out using standard QUAIDS model for different sections of people. Price elasticity as mentioned was worked out using FCDS model (Kumar et all, 2011). Table 15 provides these estimates.
Table 15: Demand elasticities due to income and price Sr No
Item Income Group
Very poor Moderately poor
Non-Poor Lower
Non Poor Upper
All
Income elasticities 1 Fruits and
vegetables 0.759 0.785 0811 0.839 0.817
Uncompensated own price elasticities 2 Fruits and
vegetables -0.893 -0.901 -0.908 -0.928 -0.917
Based on FCDS model 4 Fruits 0.753 0.599 0.492 0.282 0.362 5 Vegetable 0.693 0.518 0.370 0.174 0.259

18 | P a g e Export Performance and Potential of Fruits and Vegetables
Objective 3: To assess the export competitiveness of Indian fruits and vegetables in a global
frame work Competitiveness of Indian fruits and vegetables were assessed by using the indicator called Revealed Comparative advantage. This indicator basically takes into account both in physical and financial aspects of exports from the country of origin and world trade volumes. Table 16 deals with the Banana exports advantage. Really speaking there is no real advantage of Banana exports from India as the RCA is very less in this case in almost all the years under study the demand for Banana in India is high therefore the domestic prices are also high. Table 16: Estimates of Revealed Comparative Advantage (RCA) in Banana Exports Particulars 2006 2007 2008 2009 2010 2011
India’s export of Banana (US$ billion)
4.6 5.0 10.7 21.7 25.1 17.2
World’s total export of Banana (US$ billion)
6266.0 7093.9 7936.0 8139.2 8326.9 9141.9
India’s export of edible fruits&nuts to the world
(US$ billion)
855.4 873.5 1133.2 1035.4 1088.7 1449.0
World’s total export of edible fruits&nuts (US$ billion)
53038.9 61690.7 70774.4 67295.0 76007.6 86490.6
RCA 0.05 0.05 0.08 0.17 0.21 0.11
Table 17 deals with the Mango export advantage. Indian Mangoes are very famous in world and the advantage of exporting mangoes to world market is distinctly visible. The RCA more than 1 means the country is really taking the advantage of exporting the commodity. In this case it is mango, which showed a consistent revealed comparative advantage more than 1.

19 | P a g e Export Performance and Potential of Fruits and Vegetables
Table 17: Estimates of Revealed Comparative Advantage (RCA) in Mango Exports
Particulars 2006 2007 2008 2009 2010 2011
India’s export of Mango (US$ billion)
31.3 29.4 41.6 40.7 35.5 46.0
World’s total export of Mango (US$ billion)
800.2 994.2 1064.0 1134.5 1269.4 1508.6
India’s export of edible fruits&nuts to the world
(US$ billion)
855.5 873.5 1133.2 1035.4 1088.7 1449.0
World’s total export of edible fruits&nuts
(US$ billion)
53038.9 61690.6 70774.4 67295.0 76007.6 86490.6
RCA 2.43 2.09 2.44 2.33 1.95 1.82
In grapes as given in table 18, the Revealed Comparative Advantage (RCA) is fluctuating. During 2010 the RCA is more than one that means that year the exports of grape was advantageous. For rest of the years it was less than one. The recommendation is that we need to see the Indian grape production situation during 2010 as compared to other years and if possible amend our production strategy to improve export prospects. Table 18: Estimates of Revealed Comparative Advantage (RCA) in Grapes Exports Particulars 2006 2007 2008 2009 2010 2011 India’s export of Grapes (US$ billion)
53.4 60.1 90.6 68.3 102.5 77.7
World’s total export of Grapes (US$ billion)
4436.5 5067.5 6025.6 5664.9 6282.0 7011.1
India’s export of edible fruits&nuts to the world (US$ billion)
855.4 873.4 1133.2 1035.4 1088.7 1449.0

20 | P a g e Export Performance and Potential of Fruits and Vegetables
World’s total export of edible fruits&nuts (US$ billion)
53038.9 61690.6 70774.4 67295.0 76007.6 86490.6
RCA 0.75 0.84 0.94 0.78 1.14 0.66
In vegetables onions are the major exports from India having very high revealed comparative advantage of more than 7 throughout during 2006 to 2011. Highest advantage was during 2009 and 2008. Recently government has taken decision to restrict the export due to increased local demand. However there is definitely the production, price and quality advantage in this crop for India. Table 19: Estimates of Revealed Comparative Advantage (RCA) in Onion Exports Particulars 2006 2007 2008 2009 2010 2011 India’s export of Onion
(US$ billion)
226.4 263.6 330.6 474.9 465.4 370.0
World’s total export of Onion
(US$ billion)
1885.6 2395.7 2364.3 2394.1 3181.6 3144.8
India’s export of edible vegetables& tubers to the world (US$ billion)
609.3 632.9 683.7 797.7 962.3 1009.0
World’s total export of edible vegetables& tubers (US$ billion)
38645.0 44995.6 49270.9 48770.9 56349.0 61796.3
RCA 7.62 7.82 10.08 12.13 8.57 7.21
Tomato exports have been consistently increasing but there is no revealed comparative advantage in doing so. The RCA were 0.09, 0.21, 0.35, 0.27, 0.18, 0.61 respectively during 2006, 2007, 2008, 2009, 2010 and 2011 (Table 20).

21 | P a g e Export Performance and Potential of Fruits and Vegetables
Table 20: Estimates of Revealed Comparative Advantage (RCA) in Tomato Exports
Particulars 2006 2007 2008 2009 2010 2011
India’s export of Tomato (US$ billion)
8.2 20.3 35.9 30.8 25.0 86.1
World’s total export of Tomato (US$ billion)
5699.3 6738.0 7378.4 7041.4 8251.9 8651.2
India’s export of edible vegetables& tubers to the world
(US$ billion)
609.3 632.9 683.7 797.7 962.3 1009.0
World’s total export of edible vegetables& tubers (US$ billion)
38645.0 44995.6 49270.9 48770.9 56349.0 61796.3
RCA 0.09 0.21 0.35 0.27 0.18 0.61
Potato exports were also same as tomato. Despite exports the potato has never shown promise for better export realization. This is due to the fact the quality and price if potato does not match with international requirement. The RCA has always been less than 1 in case of potato (Table 21) Table 21: Estimates of Revealed Comparative Advantage (RCA) in Potato Exports
Particulars 2006 2007 2008 2009 2010 2011
India’s export of Potato (US$ billion)
10.5 12.9 24.4 12.8 26.9 35.3
World’s total export of Potato (US$ billion)
2222.5 2709.0 2416.4 2209.5 2818.0 3459.4
India’s export of edible vegetables& tubers to the world
(US$ billion)
609.3 632.9 683.7 797.7 962.3 1009.0

22 | P a g e Export Performance and Potential of Fruits and Vegetables
World’s total export of edible vegetables& tubers (US$ billion)
38645.0 44995.6 49270.9 48770.9 56349.0 61796.3
RCA 0.30 0.34 0.73 0.35 0.56 0.63
Objective 4: To Forecast the export potential of Fruits and Vegetables In India in Asian Countries The forecast of the exports of fruits and vegetables are presented in Table 22 where based on the past performance the exports seems to be doing very good in next five years. The expected exports may get almost doubled in all categories of fruits and vegetables. Table 22: Forecasting of the export potential of fruits and vegetables to Asian
countries
S.No. Fresh Fruits Processed
Fruits Fresh
Vegetable Processed Vegetable
2007-08 171.45 35.47 309.79 17.00 2008-09 232.87 35.89 461.82 5.74 2009-10 253.09 36.13 535.52 6.66 2010-11 252.57 44.37 470.28 9.83 2011-12 306.70 81.86 498.29 15.06 CAGR 13.3 20.7 10.2 3.0 2012-13 347.3 98.8 549.0 15.5 2013-14 393.4 119.3 604.8 16.0 2014-15 445.5 144.1 666.3 16.5 2015-16 504.5 174.0 734.1 17.0 2017-18 571.4 210.1 808.8 17.5 Half of growth 6.7 10.4 5.1 1.5 2012-13 327.2 90.3 523.7 15.1 2013-14 349.2 99.7 550.4 15.3 2014-15 372.6 110.0 578.5 15.6 2015-16 397.5 121.4 608.0 15.8 2017-18 424.2 133.9 639.0 16.0
23 | P a g e Export Performance and Potential of Fruits and Vegetables
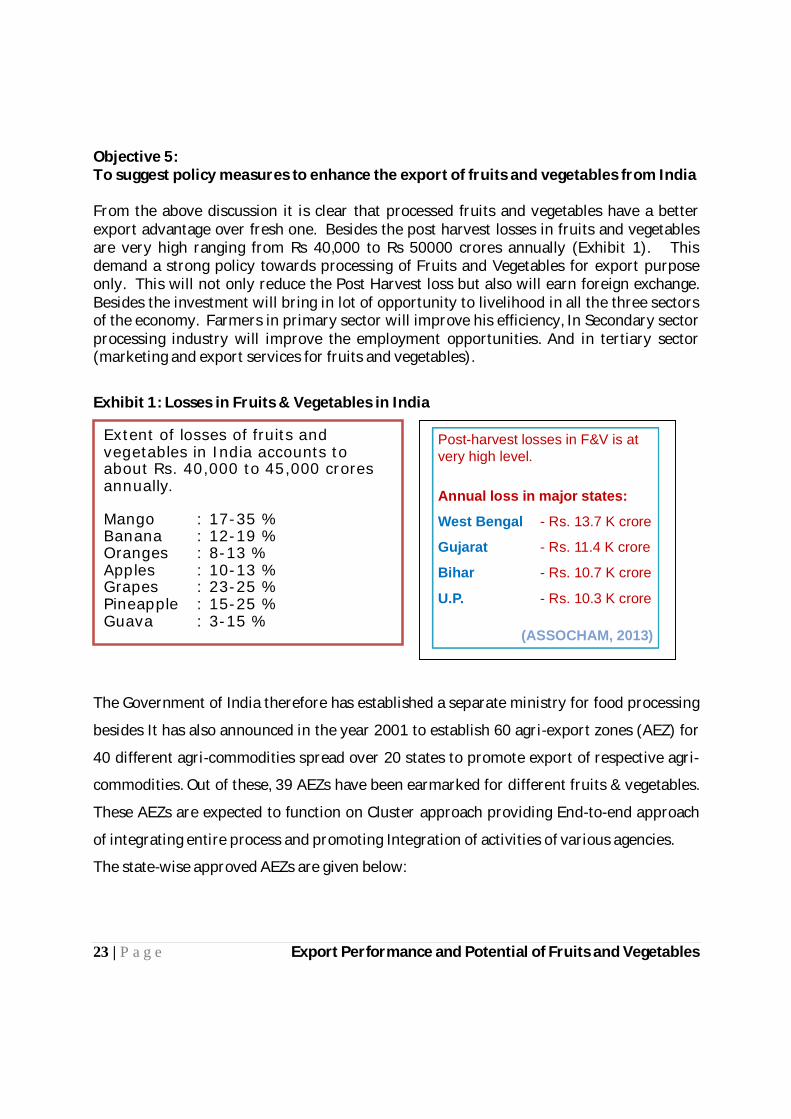
Objective 5: To suggest policy measures to enhance the export of fruits and vegetables from India From the above discussion it is clear that processed fruits and vegetables have a better export advantage over fresh one. Besides the post harvest losses in fruits and vegetables are very high ranging from Rs 40,000 to Rs 50000 crores annually (Exhibit 1). This demand a strong policy towards processing of Fruits and Vegetables for export purpose only. This will not only reduce the Post Harvest loss but also will earn foreign exchange. Besides the investment will bring in lot of opportunity to livelihood in all the three sectors of the economy. Farmers in primary sector will improve his efficiency, In Secondary sector processing industry will improve the employment opportunities. And in tertiary sector (marketing and export services for fruits and vegetables).
Exhibit 1: Losses in Fruits & Vegetables in India
The Government of India therefore has established a separate ministry for food processing
besides It has also announced in the year 2001 to establish 60 agri-export zones (AEZ) for
40 different agri-commodities spread over 20 states to promote export of respective agri-
commodities. Out of these, 39 AEZs have been earmarked for different fruits & vegetables.
These AEZs are expected to function on Cluster approach providing End-to-end approach
of integrating entire process and promoting Integration of activities of various agencies.
The state-wise approved AEZs are given below:
Extent of losses of fruits and vegetables in India accounts to about Rs. 40,000 to 45,000 crores annually. Mango : 17-35 % Banana : 12-19 % Oranges : 8-13 % Apples : 10-13 % Grapes : 23-25 % Pineapple : 15-25 % Guava : 3-15 %
Post-harvest losses in F&V is at very high level. Annual loss in major states:
West Bengal - Rs. 13.7 K crore
Gujarat - Rs. 11.4 K crore
Bihar - Rs. 10.7 K crore
U.P. - Rs. 10.3 K crore
(ASSOCHAM, 2013)

24 | P a g e Export Performance and Potential of Fruits and Vegetables
State No. of
AEZ AEZ project
Assam 1 Fresh & Processed Ginger
Andhra Pradesh 5 Mango Pulp & Fresh Vegetables; Mango & Grapes; Mango; Gherkins; Chilli
Bihar 1 Litchi, Vegetables & Honey
Gujarat 3 Mango & Vegetables; Value added onion; Sesame seeds
H.P. 1 Apples
Karnataka 4 Gherkins; Rose Onion; Flowers; Vanilla
J&K 2 Apple; Walnuts
Jharkhand 1 Vegetables
Kerala 2 Horticulture products; Medicinal plants
M.P. 5 Potatoes, Onion & Garlic; Seed spices; Wheat (Duram); Lentil & Grams; Oranges
Maharashtra 8 Grape & grapewine; Mango (Alphanso); Mango (Kesar); Flowers; Onions; Pomegranate; Banana; Oranges
Odisha 1 Ginger & Turmeric
Punjab 3 Vegetables; Potatoes; Basmati Rice
Rajasthan 2 Coriander; Cumin
Sikkim 2 Flowers (Orchids) & Cherry Pepper; Ginger
Tripura 1 Organic pineapple
Tamil Nadu 4 Flowers (2); Mangoes; Cashewnut
Uttar Pradesh 4 Potatoes; Mangoes & Vegetables; Mangoes; Basmati rice
Uttaranchal 4 Litchi; Flowers; Basmati Rice; Medicinal & Aromatic Plants
West Bengal 6 Litchi; Potatoes; Mango; Vegetables; Darjeeling Tea; Pineapple

25 | P a g e Export Performance and Potential of Fruits and Vegetables
Mega Food Parks
A major step in improving export of fruits and vegetables Government of India has
approved setting up of 12 new Mega Food Park in August 2013. First Mega Food Park was
opened on 12 July 2012 in Chittoor, A.P. These Mega Food parks aim to provide service
from
- Seed to shelf
- World-class facilities for pulping, bottling, tetra packing, modular cold storage,
warehousing & testing lab.
These Mega Food Park is expected to provide service for domestic as well as export
oriented firm.
The conceptual framework of such mega food park is given below:
Distributors/ Retail Chains/ Exporters/ Importers/
End consumers

26 | P a g e Export Performance and Potential of Fruits and Vegetables
8221 Achievements in Terms of Targets Fixed for Each Activity : All the objectives of the project were successfully completed.
8222 Questions - Answered : - What is the export potential of Indian fruits and vegetables in Asian countries? - What is the export competitiveness of fruits and vegetables of India in a global framework? 8223 Process/Product/Technology/Developed:
The project is forecasted the export potential of fruits andvegetables in Asian countries for the
year 2015
8224 Practical Utility : (Not more than 150 words)
a. Immediate Benefits: Enhance the understanding of export potential and
competitiveness of fruits and vegetables of India in Asian region b. Medium-term Benefits : The import demand elasticity and relative price elasticity of
Indian fruits and vegetables exports to major Asian destinations will be estimated c. Long-term Benefits: Will help the policy makers to enhance the export of fruits and
vegetables from India to Asian countries 8225 Constraints, if any : N.A. 823 Publications and Material Development : (One copy each to be supplied with this Proforma)
8231 Research Papers : Under process 8232 Popular Articles : N.A. 8233 Reports : NA
8234 Seminars, Conferences and Workshops (Relevant to the Project) in which the Scientists have Participated : N.A. 824 Infrastructural Facilities Developed : N.A. (Details of field, laboratory, notebooks and final material and their location)

27 | P a g e Export Performance and Potential of Fruits and Vegetables
825 Comments/Suggestions of Project Leader regarding possible future line of work
that may be taken up arising out of this Project :
Survey based study may be conducted to establish the maize utilization pattern, actual value chains and adoption of varieties of maize crop in different regions in India.
Part - IV : Project Expenditure (Summary) Year2011-2014 830 Total Recurring Expenditure : N.A. 8301 Salaries : (Designation with pay scale) EstimatedActual i) Scientific ii) Technical : Nil iii) Supporting : Nil iv) Wages : Nil ------------------------------------ Sub-total ------------------------------------ 8302 Consumables : N.A. 8303 Travel : N.A. 8304 Miscellaneous : (Other costs) ------------------------------------- 8305 Sub-total (Recurring) ------------------------------------- 831 Non-recurring Expenditure : Nil (Equipment and works) 832 Total : Expenditures covered under MAIZE-CRP (CIMMYT) funded project. (830 and 831) ------------------------------------
