royal philips electronics€¦ · across philips, resulted in an eur 1.4 billion impairment...
TRANSCRIPT

July 18th, 2011
1
Royal Philips ElectronicsSecond Quarter 2011 & Mid-term Performance
Trajectory Update

Important informationForward-looking statements This document and the related oral presentation, including responses to questions following the presentation contain certain forward-looking statements with respect to the financial condition, results of operations and business of Philips and certain of the plans and objectives of Philips with respect to these items. Examples of forward-looking statements include statements made about our strategy, estimates of sales growth, future EBITA and future developments in our organic business. By their nature, these statements involve risk and uncertainty because they relate to future events and circumstances and there are many factors that could cause actual results and developments to differ materially from those expressed or implied by these statements.These factors include but are not limited to domestic and global economic and business conditions, the successful implementation of our strategy and our ability to realize the benefits of this strategy, our ability to develop and market new products, changes in legislation, legal claims, changes in exchange and interest rates, changes in tax rates, pension costs and actuarial assumptions, raw materials and employee costs, our ability to identify and complete successful acquisitions and to integrate those acquisitions into our business, our ability to successfully exit certain businesses or restructure our operations, the rate of technological changes, political, economic and other developments in countries where Philips operates, industry consolidation and competition. As a result, Philips‟ actual future results may differ materially from the plans, goals and expectations set forth in such forward-looking statements. For a discussion of factors that could cause future results to differ from such forward-looking statements, see the Risk management chapter included in our Annual Report 2010 and the "Risk and uncertainties” section in our semi-annual financial report for the six months ended July 3, 2011.
Third-party market share dataStatements regarding market share, including those regarding Philips‟ competitive position, contained in this document are based on outside sources such as research institutes, industry and dealer panels in combination with management estimates. Where information is not yet available to Philips, those statements may also be based on estimates and projections prepared by outside sources or management. Rankings are based on sales unless otherwise stated.
Use of non-GAAP InformationIn presenting and discussing the Philips Group‟s financial position, operating results and cash flows, management uses certain non-GAAP financial measures. These non-GAAP financial measures should not be viewed in isolation as alternatives to the equivalent IFRS measures and should be used in conjunction with the most directly comparable IFRS measures. A reconciliation of such measures to the most directly comparable IFRS measures is contained in this document. Further information on non-GAAP measures can be found in our Annual Report 2010.
Use of fair-value measurementsIn presenting the Philips Group‟s financial position, fair values are used for the measurement of various items in accordance with the applicable accounting standards. These fair values are based on market prices, where available, and are obtained from sources that are deemed to be reliable. Readers are cautioned that these values are subject to changes over time and are only valid at the balance sheet date. When quoted prices do not exist, we estimated the fair values using appropriate valuation models, and when observable market data are not available, we used unobservable inputs. They require management to make significant assumptions with respect to future developments, which are inherently uncertain and may therefore deviate from actual developments. Critical assumptions used are disclosed in our 2010 financial statements. Independent valuations may have been obtained to support management‟s determination of fair values.
All amounts in millions of euro‟s unless otherwise stated; data included are unaudited. Financial reporting is in accordance with IFRS, unless otherwise stated. This document comprises regulated information within the meaning of the Dutch Financial Markets Supervision Act „Wet op het Financieel Toezicht‟.
2

1.Management update
2. Group results Q2 2011
3. Accelerate! Change and performance
4. Portfolio strength
5. Path to value
3

4
Introduction

5
Management update
• Results impacted by investments for growth, weaker markets, and impairments
– Healthcare performed strongly on earnings, sales growth and order book development
– Consumer Lifestyle core businesses grew double digit, investments lead to lower margin
– Lighting LED grew strongly, results impacted by markets and performance challenges
– Adjusted business cases and discount rates at annual review, resulted in an EUR 1.4 billion impairment
• A comprehensive change and performance program, “ACCELERATE!” launched
– EUR 500 million cost reduction program is one element
• We are confident in the strength of our portfolio
– Well positioned to take advantage of global trends.
– The majority of our portfolio have the right fundamentals to create value driven by ROIC.
• Accelerating growth and improving profitability is the first step on our PATH TO VALUE
– Launched a EUR 2 billion share buy back program
– Mid-term (2013) goals for the group to achieve Sales growth1 of 4-6%, EBITA 10-12% and ROIC 12-14%
1 Assuming real GDP growth of 3-4%

• Granular performance management in place at 400 BMC1 level
• Strengthen the Executive team
• EUR 500 million cost program launched to improve efficiency
New Philips Business System
• Share buy back program launched to address balance sheet efficiency
• Deliver on inventory reduction programs
• Focused value delivery plan for each past acquisition
• Impairment due to change in discount rate and lower post recession recovery
Disciplined Capital Use
• Risk mitigation efforts in Japan for sales and supplies largely successful
• TV disentanglement progressing along tight time line for Q4 closing
• Stranded cost (EUR 130 million), disentanglement cost and deal result pending finalization
Japan Crisis, and progress on TV disentanglement
• About half of EUR 200 million increase already in annual run rate costs
• Selling and R&D expenses expected to remain stable in relation to sales for this year
Targeted investing in markets and innovation
• Lighting: Turn around plan for Consumer Luminaires , increase prices to compensate for higher input costs, strengthen performance management
• Consumer Lifestyle: turn-around plan Lifestyle Entertainment (AVM and Accessories); TV disentanglement, operational improvement plans
Short term performance
measures
6
Performance improvement update
1 BMC = Business Market Combination
1. Management update
2.Group results Q2 2011
3. Accelerate! Change and performance
4. Portfolio strength
5. Path to value
7

Headlines: Q2 2011
Note - All figures exclude discontinued operations
• Comparable sales increased 4%, led by strong growth at Healthcare
• Growth markets now represent one third of Group sales
• EBITA of EUR 370 million, 7.1% of sales
• Goodwill impairment leads to net loss of EUR 1.3 billion
• Free cash outflow of EUR 210 million
Group
• Comparable sales increased 8%, with solid increases in all businesses
• Equipment Order Intake growth of 4%, led by strong growth of 10% in NA
• EBITA increased by EUR 60 million y-o-y to EUR 276 million, or 13.3% of salesHealthcare
• Comparable sales declined 2%, excluding licenses up 1%
• EBITA was low at EUR 60 million compared to last year‟s EUR 168 million
• Lower license income, investments in Advertising & Promotion, and sales decline at Lifestyle Entertainment led to the decline in earnings
Consumer Lifestyle
• Comparable sales increased 4%, LED-based sales grew 21%
• EBITA, excl. restructuring and acquisition-related charges, amounted to EUR 115 million, compared to EUR 247 million in Q2 2010
• Pressure on margins, weaker consumer markets, specifically in Western Europe, and incremental investments in growth caused decline in EBITA
Lighting
8

Sales by sector – Q2 2011EUR million
Q2 2010 Q2 2011 % nom % comp
Healthcare 2,068 2,080 1 8
Consumer Lifestyle 1,338 1,293 (3) (2)
Lighting 1,859 1,777 (4) 4
GM&S 81 63 (22) 27
Philips Group 5,346 5,213 (2) 4
Note - All figures exclude discontinued operations9

Sales by market cluster – Q2 2011EUR million
Q2 2010 Q2 2011 % nom % comp
Western Europe 1,531 1,446 (6) (4)
North America 1,745 1,627 (7) 4
Other mature markets 365 405 11 12
Growth markets 1,705 1,735 2 9
Philips Group 5,346 5,213 (2) 4
1
1 Growth markets are all markets excluding USA, Canada, Western Europe, and the Pacific countries Australia, New-Zealand, South Korea and Japan
Note - All figures exclude discontinued operations 10

1 2Q11 excludes EUR 1M of restructuring and acquisition-related gains; 2Q10 excluded on balance EUR (46)M charges 2 2Q11 excludes EUR (13)M of restructuring and acquisition-related charges; 2Q10 excluded on balance EUR (7)M charges3 2Q11 excludes EUR (14)M of restructuring and acquisition-related charges; 3Q10 excluded on balance EUR (37)M charges4 2Q11 excludes EUR 2M of gains
Note - All figures exclude discontinued operations
Adjusted EBITA by sector – Q2 2011 EUR million
Q2 2010 Q2 2011
Healthcare 262 275
Consumer Lifestyle 175 73
Lighting 247 115
GM&S (88) (69)
Philips Group 596 394
as % of sales 11.1% 7.6%
1
2
3
4
11

Q2 2010 Q2 2011
Net income from continuing operations 240 (1,248)
Depreciation / amortization 340 362
Impairment of goodwill - 1,355
Changes in Working Capital, of which: 97 (213)
- changes in Net inventories (209) (255)
- changes in Accounts receivable (5) (41)
- changes in Accounts payable 311 83
Other (172) (208)
Cash flow from operations 497 39
Purchase intangible assets/ Exp. on development assets (66) (86)
Capital expenditures on PP&E (158) (184)
Proceeds from PP&E 26 21
Net capital expenditures (198) (249)
Free Cash Flow 299 (210)
Free Cash Flow – Q2 2011 EUR million
1 PP&E stands for Property, Plant and Equipment
Note - All figures exclude discontinued operations
1
12

Our annual impairment review which led to certain adjustments of the
pre-recession businesses cases, and an adjustment of the discount rate
across Philips, resulted in an EUR 1.4 billion impairment
Healthcare: Home Healthcare Solutions - EUR 830 million- Slower growth of US sleep market, lower reimbursement rates for remote cardiac monitoring
- Recovery from recession set-back, in particular in the US
- Impact of adjustments of discount rates
Lighting: Professional and Consumer Luminaires - EUR 530 million- Slower growth of US and European markets
- Recovery from recession set-back, in particular construction and mature consumer markets
- Impact of adjustments of discount rates
Goodwill impairment EUR 1.4 billion
13

ROIC impacted by impairment chargeDevelopment of Return on Invested Capital (ROIC)
Notes:
EBIAT are earnings before interest after tax
Philips calculates ROIC % as: EBIAT/ NOC
Quarterly ROIC % is based on LTM EBIAT and average NOC over the last 5 quarters
Reported tax used to calculate EBIAT
• Reported ROIC declines
strongly because of impairment
in Q2 2011, due to a change in
discount rate and lower post-
recession recovery.
• ROIC excluding impairment
declined mainly due to lower
earnings in Consumer Lifestyle
and Lighting
• Discount rate now at 8.7%, from
8.1% mainly due to an increase
in certain risk free rates and
adjustments in certain peer
groups
ROIC ROIC excl. Impairment Discount rate
14
6.0%
7.6%
9.4%
11.9%11.7%
0.7%
11.2%
0%
2%
4%
6%
8%
10%
12%
14%
Q110 Q210 Q310 Q410 Q111 Q211
1. Management update
2. Group results Q2 2011
3.Accelerate! Change and performance
4. Portfolio strength
5. Path to value
15
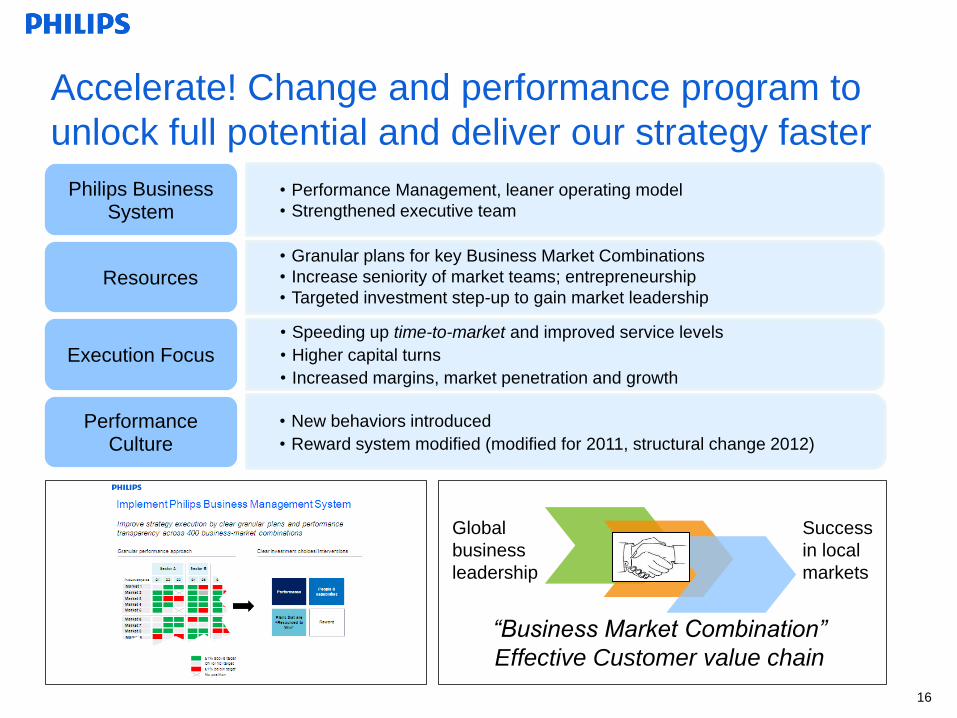
Global
business
leadership
Success
in local
markets
“Business Market Combination”
Effective Customer value chain
• Performance Management, leaner operating model
• Strengthened executive team
Philips Business System
• Granular plans for key Business Market Combinations
• Increase seniority of market teams; entrepreneurship
• Targeted investment step-up to gain market leadershipResources
• Speeding up time-to-market and improved service levels
• Higher capital turns
• Increased margins, market penetration and growth
Execution Focus
• New behaviors introduced
• Reward system modified (modified for 2011, structural change 2012)
Performance Culture
Accelerate! Change and performance program to
unlock full potential and deliver our strategy faster
16

Lighting: Improve profitability on the path to LED and solutions
• Accelerate transformation to LED, applications and solutions
• Strengthen performance management and execution
• Address cost base and margin management
• Deliver on turnaround of Consumer Luminaires
17
Healthcare: Continue to accelerate strategy and performance
• Driving to co-leadership in Imaging Systems and leadership in Patient Care and
Clinical Informatics
• Invest for leadership in growth markets
• International expansion of the home healthcare business
• Executing operational excellence initiatives to increase margin and time-to-market
Consumer Lifestyle: Reshaping the portfolio towards growth
• Right-size the organization post TV exit
• Address Lifestyle Entertainment portfolio and execute turn-around plan
• Continued growth investment in core businesses towards global category leadership
• Regional business creation; leverage fill-in acquisitions in China and India
Sector acceleration trajectories
Reported
EBITA
15-17%
Mid-term targets - 2013
Reported
EBITA
8-10%
Sales Growth
CAGR* : 4-6%
Reported
EBITA
10-12%
Sector Group
Excluding License Income
Reported
EBITA
8-10%
ROIC
12-14%
*Assuming real GDP
growth of 3-4%

18
• Short Term (2011 - 2012) saving plan of EUR 250 million
– Reducing operating complexity with savings in a.o. IT costs, Real Estate Costs and
other functional areas
• Medium Term (2013 - 2014) saving plan of EUR 250 million
– further reduction of overhead costs enabled by systematic process re-engineering
and business model diversity reduction and improved IT solutions
• The cost program will be margin accretive from 2013 onwards
• Baseline for cost reductions is 1st half of 2011
Cost efficient and simplified operating model EUR 500 million cost reduction program launched

19
Strengthen management: New Executive Committee
* Gottfried Dutiné will retire from Philips as of December 31, 2011.
** Carole Wainaina will join Philips as of September 1, 2011.
*** In the course of 2011, Jim Andrew will also take over the innovation portfolio from Gottfried Dutiné.
Gottfried Dutiné *
Chief Innovation Officer
Frans van Houten
Group CEO
Acting CEO Lighting
Ron Wirahadiraksa
Group CFO
Acting CFO Lighting
Steve Rusckowski
CEO Healthcare
Pieter Nota
CEO Consumer Lifestyle
Eric Coutinho
General Counsel
Jim Andrew ***
Group strategyPatrick Kung
CEO Greater China
Carole Wainaina**
Group HR
Ronald de Jong
Chief Market Leader
1. Management update
2. Group results Q2 2011
3. Accelerate! Change and performance
4.Portfolio strength
5. Path to value
20

21
Healthcare Consumer Lifestyle Lighting Semiconductors
Improving our portfolio: Starting point of our journey Portfolio now consists of ~65% B2B businesses
June ‟11last twelve
months
16%22%
30%26%
40%
34%
20082005
17%
43%
45%27%
Healthcare
Lighting
Consumer Lifestyle
Semiconductor
Healthcare
Lighting
Consumer Lifestyle excl. TV
Healthcare
Lighting
Consumer Lifestyle
1 Consumer Lifestyle in 2005 includes the former DAP and Consumer Electronics divisions2 2005 figures are based on US GAAP3 Figures exclude Television as it is treated as discontinued operation
3
2
Large majority of our businesses have the right fundamentals for profitable growth
1
21
22
• World‟s 42nd most valuable brand 2010 compared to the 65th 2004
• Consistently among top-ranked players, top 10% in India, China and
Brazil, top 20% globally in the Corporate brand equity index1
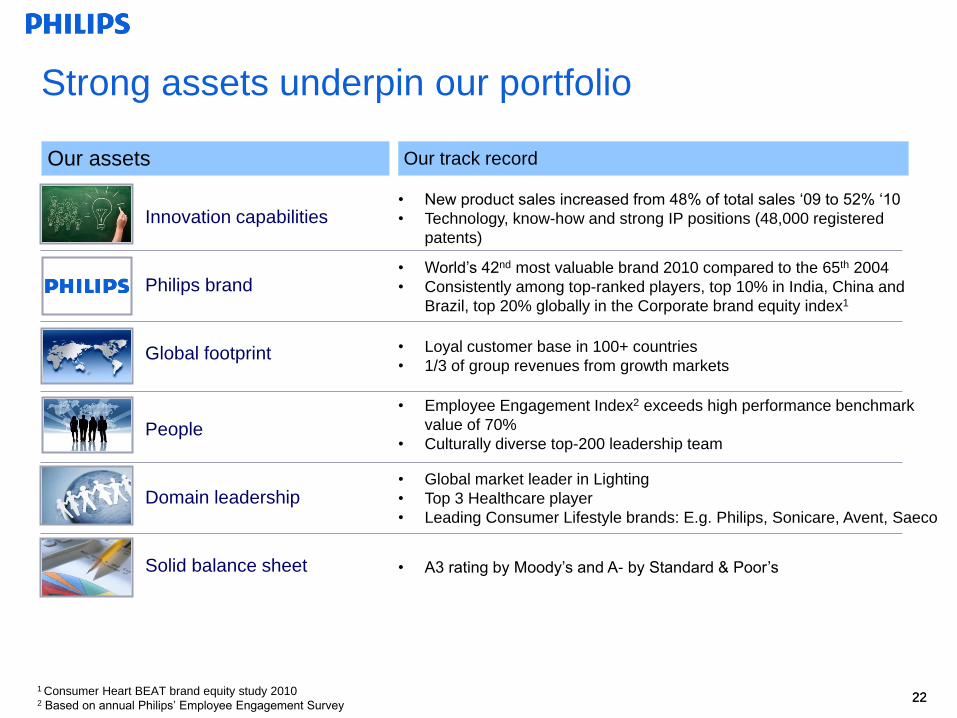
Our assets
Strong assets underpin our portfolio
Our track record
Innovation capabilities
Philips brand
Global footprint
People
Domain leadership
Solid balance sheet
• Loyal customer base in 100+ countries
• 1/3 of group revenues from growth markets
• Employee Engagement Index2 exceeds high performance benchmark
value of 70%
• Culturally diverse top-200 leadership team
• Global market leader in Lighting
• Top 3 Healthcare player
• Leading Consumer Lifestyle brands: E.g. Philips, Sonicare, Avent, Saeco
• A3 rating by Moody‟s and A- by Standard & Poor‟s
• New product sales increased from 48% of total sales „09 to 52% „10
• Technology, know-how and strong IP positions (48,000 registered
patents)
1 Consumer Heart BEAT brand equity study 20102 Based on annual Philips‟ Employee Engagement Survey
22
23
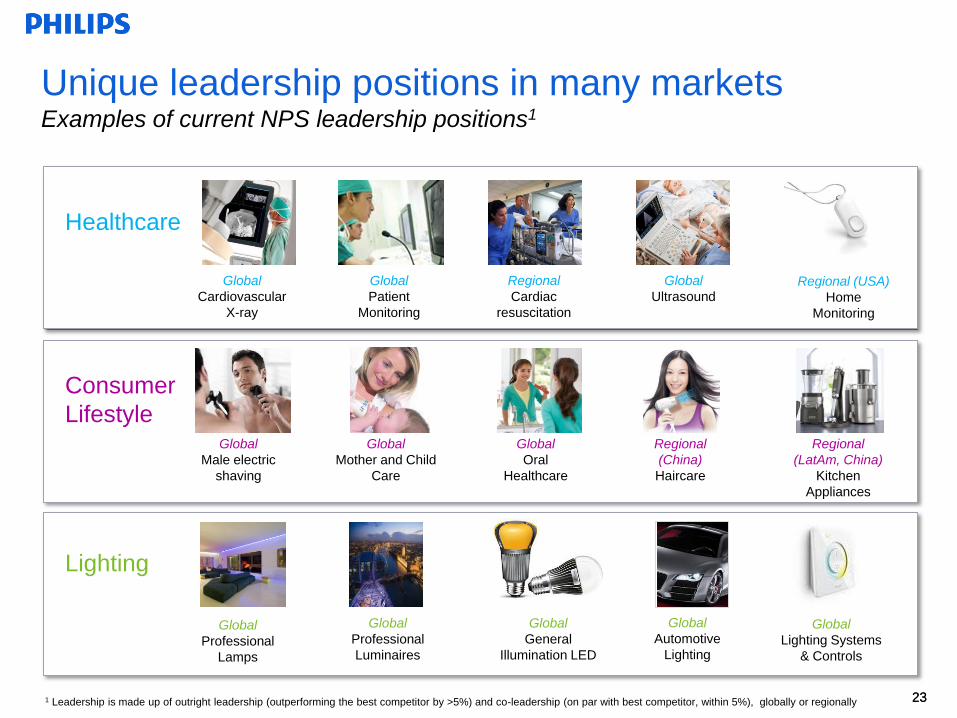
Global
Cardiovascular
X-ray
Unique leadership positions in many marketsExamples of current NPS leadership positions1
Global
Ultrasound
Global
Patient
Monitoring
Regional
Cardiac
resuscitation
Regional (USA)
Home
Monitoring
Global
Male electric
shaving
Global
Mother and Child
Care
Regional
(China)
Haircare
Regional
(LatAm, China)
Kitchen
Appliances
Global
Oral
Healthcare
Global
Professional
Luminaires
Global
General
Illumination LED
Global
Professional
Lamps
Healthcare
Global
Automotive
Lighting
Consumer
Lifestyle
Lighting
1 Leadership is made up of outright leadership (outperforming the best competitor by >5%) and co-leadership (on par with best competitor, within 5%), globally or regionally
Global
Lighting Systems
& Controls
23

1. Management update
2. Group results Q2 2011
3. Accelerate! Change and performance
4. Portfolio strength
5.Path to value
24

Mid-term
Performance
box
Value
Our path to value
2011 2013
Growth
TV exit
Share buy back
Executive team
Growth investments
BMC1 performance management
Acceleration Healthcare
Restoring Lighting profit
Reshaping CL portfolio
Euro 500 million cost program
Accelerate! program
Current
Performance
box
ROIC
Growth
ROIC
251 BMC = Business Market Combination

26
Mid-term Targets: Move into performance box of 12-
14% ROIC and 4-6% comparable sales growth
ROIC (%)
4
6
8
0
8 12 14 18
Com
pa
rable
sa
les g
row
th (
%)
Performance
Box 2013
Current
Performance
Philips Mid-Term Performance Box
Mid-Term financial
objectives (2013)
Sales growth CAGR1 4 - 6%
Group Reported2 EBITA 10 - 12%
- Healthcare 15 - 17%
- Consumer Lifestyle3 8 - 10%
- Lighting 8 - 10%
Group ROIC 12 - 14%
1 Assuming real GDP growth of 3-4%2 Including restructuring and acquisition related charges 3 Excluding licenses
26

Share buy back program of EUR 2 billion
• Given our confidence in our future performance trajectory we have launched a
share buyback program of EUR 2 billion. This is:
– Based on thoroughly assessing the capital structure under various
economic scenarios addressing the financial needs for organic growth,
bolt-on acquisitions and risk mitigation
– Consistent with our Capital Allocation policy, driven by the disciplined use
of capital
– Addressing the efficiency of the balance sheet
• The buy back program of EUR 2 billion shares for cancellation purposes starts
immediately and is to be completed by mid – 2012
Note 1: Subject to approval by the Annual General Meeting of Shareholders, to be held in April 2012, all shares repurchased under this new program will be
cancelled, resulting in a reduction of Philips‟ outstanding share capital.
Note 2: Philips has entered into a discretionary management agreements with a bank to repurchase Philips shares within the limits of relevant laws and
regulations (in particular EC Regulation 2273/2003) and Philips‟ articles of association.27

So, what will be different this time?
• We have a strong portfolio, with good positions in growth and mature markets
and
• Have identified the operational issues which we will deal with decisively
to
• Drive granular execution of our plans and make the necessary investments in
people, systems, and markets to deliver profitable growth and return on invested
capital
by
• Leveraging a new culture of entrepreneurship and accountability
28

29