rowan companies plc annual report and financial...
TRANSCRIPT

Rowan Companies plc
Annual Report and Financial Statements Registered number 07805263
31 December 2014 Rowan Companies plc (“Rowan”) is subject to disclosure regimes in the U.S. and U.K. While some of the disclosure requirements in these jurisdictions overlap or are otherwise similar, some differ and require distinct disclosures. Pursuant to English law requirements, this document sets out our Rowan Annual Report and financial statements. The contents of this document also form part of the statutory Annual Accounts and Reports of Rowan for the year ended December 31, 2014, as required by English law.

THIS PAGE INTENTIONALLY LEFT BLANK

Rowan Companies plc Annual Report and Financial Statements
31 December 2014
1
Contents
Page
STRATEGIC REPORT 2 Business model 2 Strategy and competitive strengths 2 Corporate social responsibility 4 Business review 9
DIRECTORS’ REPORT 19 Political donations 19 Derivative financial instruments and risk exposures 19 Essential contracts 19 Branches 19 Acquisition of company shares 20 Greenhouse gas emissions statement 21 Dividends 22 Qualifying indemnity provisions 22 Going concern basis 22 Directors 22 Disclosure of information to the auditor 23 Re-appointment of the auditor 23
PARENT COMPANY FINANCIAL STATEMENTS 24 APPENDIX A – Proxy Statement for the 2015 Annual General Meeting of Shareholders of Rowan Companies plc
U.K. Statutory Directors’ Remuneration Report (Part II)
APPENDIX B – U.S. Securities and Exchange Commission Form 10-K Consolidated Financial Statements
Rowan Companies plc Annual Report and Financial Statements
31 December 2014
2
STRATEGIC REPORT Rowan Companies plc is a public limited company incorporated in the United Kingdom under the Companies Act and listed on the New York Stock Exchange. The terms “Rowan,” “company,” “we,” “our” and “group” refer to Rowan Companies plc and its consolidated subsidiaries, unless the context otherwise requires. Part I, Item 1, "Business," Item 1A, "Risk Factors," and Part II, Item 7, "Management's Discussion and Analysis of Financial Condition and Results of Operations," of the company’s Annual Report on Form 10-K for the year ended 31 December 2014 (“Form 10-K”) are herein incorporated by reference. BUSINESS MODEL We are a global provider of contract drilling services with a focus on high-specification and premium jack-up rigs and ultra-deepwater drillships, which our customers use for oil and gas exploratory and development drilling. Depending on the particular rig and location, our jack-up rigs are capable of drilling wells to depths of up to 35,000 feet in waters up to 550 feet and our drillships are capable of drilling wells to depths of 40,000 feet in waters of up to 12,000 feet. Each of our jack-ups is designed with a hull that is fully equipped to serve as a drilling platform supported by three independently elevating legs. The rig is towed to the drilling site where the legs are lowered into and penetrate the ocean floor, and the hull is jacked up to the elevation required to drill the well. Our ultra-deepwater drillships are self-propelled vessels equipped with computer-controlled dynamic-positioning thruster systems which allow them to maintain position without anchors through the use of their onboard propulsion and station-keeping systems. Drillships have greater variable deck-loading capacity than semisubmersible rigs, enabling them to carry more supplies on board, making them better suited for drilling in deep water in remote locations. Our drillships are equipped with two drilling stations within a single derrick allowing the drillships to perform off-line and potentially simultaneous drilling tasks during some parts of the well, subject to legal restrictions in various jurisdictions. This can increase efficiency during exploration and development drilling programs which make them very attractive to our customers. We provide our rigs and services on a contract basis. Our drilling contracts generally provide for a fixed amount of compensation per day (day rate), and are either “well-to-well,” “multiple-well” or "fixed-term." Contracts range in duration from a few days to multiple years, and often contain renewal options. For a listing of our principal drilling equipment, see page 21 of our Form 10-K. STRATEGY AND COMPETITIVE STRENGTHS Our competitive strengths and elements of our strategy include: High-Specification Jack-up Fleet Allows for Premium Day Rates and Utilization. We believe our offshore fleet of 30 jack-up rigs, including 19 high-specification rigs, is one of the most capable jack-up rig fleets in our industry. These rigs typically command higher day rates and maintain higher utilization rates compared to lower specification jack-up rigs. Each of our high-specification jack-up rigs has two million pounds or greater hook-load capability, which allows us to drill deeper and more difficult wells than conventional jack-up rigs. Currently, our high-specification rigs constitute approximately 28% of the worldwide fleet of rigs with similar capabilities. We also have eight premium cantilever rigs that can operate in at least 300 feet of water in benign environments. New Ultra-Deepwater Drillships Offer Growth and Diversification of Operating Cash Flows. In 2014 we took delivery of three of four newly constructed ultra-deepwater drillships, the fourth of which is scheduled for delivery in late March 2015. Our drillships are among the most highly capable floating rigs in the world. We believe our long-standing reputation for operational excellence with jack-ups has transferred successfully to our drillship operations, and we have assembled a core team of highly experienced and respected deepwater professionals to manage that business. All four drillships are under contract with customers. Importantly, compared to the jack-up market, the ultra-deepwater market often provides higher revenues and longer-term contractual commitments which we believe will offer greater and more stable operating cash flows.
Rowan Companies plc Annual Report and Financial Statements
31 December 2014
3
Geographic Diversity. We are a global company with offshore operations in the UK and Norwegian sectors of the North Sea, the Middle East, the US GOM, Southeast Asia, West and North Africa and Trinidad. We believe our geographic diversity helps reduce our exposure to regional downturns, enabling us to take advantage of changing market conditions, and provides access to new and emerging markets. For more information, see “Our Drilling Markets” on page 3. Strong Safety and Environmental Culture. We are committed to keeping our employees safe and protecting the environment. All of our employees, contractors and consultants, as well as any third-party personnel working on our facilities and rigs, have the authority and obligation to stop work if either they do not understand the job at hand or if they perceive a risk to the safety of any person or the environment. For more information, see “Safety and Environment” on page 8. Maximize our earnings to provide a strong return to our shareholders. We strive to maximize our earnings and return to shareholders by seeking the highest-margin drilling contracts from customers who require our high-specification capabilities; to keep operational downtime and out-of-service time to a minimum; to control our operating costs both on and off the rig; and to hire the most qualified and experienced personnel to operate the most efficiently and provide the best service to our customers. Robust Contract Backlog. As of February 19, 2015, our contract backlog was approximately $5.1 billion, with $1.7 billion estimated to be realized in both 2015 and 2016, and $1.1 billion in 2017, and $0.6 billion thereafter. Approximately 81% of this backlog was contracted with national oil companies, major international oil companies and large investment-grade exploration and production companies. We believe these customers tend to have a longer-term view on their drilling plans and capital budgets, and are therefore less likely to react to short-term fluctuations in the price of crude oil and natural gas. Conservative Financial Profile. We operate with relatively conservative levels of leverage and strong capitalization ratios. As of December 31, 2014, our ratio of debt to capitalization was 37%, and our debt to EBITDA ratio (earnings before interest, taxes, depreciation and amortization, and asset impairment) was 3.85 for the twelve-month period then ended. We are committed to maintaining an investment grade debt rating, which generally allows better access to capital at a lower cost.
Experienced Management Team. We are led by a management team with substantial experience in the offshore drilling sector as well as with our company. Our top eight members of our senior management team have on average approximately 27 years of experience in the offshore drilling industry, including 10 years with Rowan. For some of the ways we measure our success, see “Key Performance Indicators” on page 4. Our Drilling Markets Our primary drilling markets are currently the U.K. and Norwegian sectors of the North Sea, the Middle East, the US GOM and Southeast Asia. As demand shifts among geographic areas, we may from time to time relocate rigs from one major area to another. The relocation of rigs is a significant undertaking, and often interrupts revenues and cash flows for several months, particularly when equipment upgrades are involved. The North Sea is a mature, harsh-environment offshore drilling market that has long been dominated by major oil and gas companies operating within a highly regulated environment. Project lead times are often lengthy, and drilling assignments, which typically require ultra-premium equipment capable of handling extreme weather conditions and high down-hole pressures and temperatures, can range from several months to several years. We currently have six rigs in the U.K. and Norwegian sectors of the North Sea. In the Middle East, we maintain a long-standing relationship with Saudi Aramco, for whom we are a key provider of drilling services. We believe that Saudi Aramco will continue to have a high demand for jack-up drilling services in the future. We currently have ten rigs in the Persian Gulf, including nine in Saudi Arabia and one in Qatar. Nine of these rigs are contracted to Saudi Aramco. The US GOM jack-up drilling market is highly fragmented among many participants, many of which are independent operators whose drilling activities may be highly dependent on near-term operating cash flows. A typical drilling assignment may call for 60 days of exploration or development work performed under a single-well contract with negotiable renewal options. Long-term contracts for jack-up rigs in the US GOM have been relatively rare, and generally are available only from the major integrated oil companies and a few of the larger independent operators. Demand in the shallower waters of the US GOM has been relatively weak over the last few

Rowan Companies plc Annual Report and Financial Statements
31 December 2014
4
years as a result of the availability of natural gas and relatively low prices. During 2014, we had six actively marketed jack-up rigs in the US GOM, plus two that were inactive (cold-stacked). In February 2015, we cold-stacked a third jack-up. We also operate in the Southeast Asia market with three rigs in Malaysia, including two that are without contract, and one operating in Indonesia. We also have two jack-ups operating in Trinidad and one in Tunisia. In recent years, oil companies have placed increased emphasis on exploring for hydrocarbons in deeper waters. This focus on deepwater is due, in part, to technological developments that have made such exploration more feasible and cost-effective. Water-depth capability has therefore become a key factor in determining a rig’s suitability for a particular drilling project. Our third ultra-deepwater drillship was delivered in mid-November 2014 and commenced operations under a three-year contract in the US GOM in early February 2015. We currently have two ultra-deepwater drillships operating in the US GOM and one operating offshore West Africa. The fourth drillship is scheduled for delivery in late March and expected to commence operations under a two-year contract in the US GOM in the third quarter of 2015. Key Performance Indicators Our principal key performance indicators we use to measure our success are:
Earnings before interest, taxes, depreciation and amortization (EBITDA); Total recordable incident rate (or TRIR, the computation of which is set forth by the International Association of Drilling
Contractors), which is a measure of our safety performance; Operational downtime (the unbillable time a rig is under contract and unable to conduct planned operations due to equipment
breakdowns or procedural failures); and Construction project management success (adherence to budgeted cost).
These four measures form the foundation of our management annual incentive program. Other key performance indicators we use to measure our success include:
Rig utilization rates (i.e., the number of days our rigs are under contract divided by the number of calendar days in the year); Fleet average day rates; and Out-of-service time (the periods during which no revenues are recognized such as, for example, shipyard time and rig transit
periods between contracts).
Our “Business Review,” which includes a review of some of our key performance indicators, begins on page 9 of this annual report. Risks and Uncertainties A number of principal factors affect our ability to obtain contracts at profitable rates and otherwise succeed in meeting our objectives. Such factors include, but are not limited to, the price of oil and gas which can affect our customers' drilling budgets, location and availability of competitive equipment, the suitability of equipment for the project, comparative operating cost of the equipment, availability of competent drilling personnel and other competitive factors. Profitability may also depend on receiving adequate compensation for the cost of moving equipment to drilling locations. For a discussion of the principal risks and uncertainties facing the company, see “Risk Factors” beginning on page 8 of our Form 10-K. CORPORATE SOCIAL RESPONSIBILITY At Rowan, our mission is to be recognized by our customers as the most efficient and capable provider of demanding contract drilling services.
In striving to fulfill our mission, we vigilantly focus on the following values:
We treat each other, our customers and suppliers with respect;
Rowan Companies plc Annual Report and Financial Statements
31 December 2014
5
Commit ourselves to an injury free workplace; Uphold the highest standards of integrity; Protect the environment; and Create a culture of continuous improvement.
We also have made the following shareholder commitment: Our shareholders have entrusted us with significant wealth, and we are committed to managing the company for their benefit. At Rowan, we live our mission, values and commitment to shareholders every day, in every operation around the world. We have also made a strong commitment to our employees. We want each of our employees to be part of a winning team, to know that the company wants to develop them and to provide meaningful careers. We must promote a healthy work-life balance, while maintaining top-level performance. In the following pages of this annual report, we discuss our efforts with respect to our people, our communities and safety and the environment. Best Place to Work We place considerable value on the involvement and engagement of our employees. Our people create our success. They provide the experience and superior service quality that drives our growth. In our industry, the demand for superior talent exceeds the supply, so we want Rowan to be the best company to work for in our industry. Some of our efforts in this area include:
Annual performance appraisals and performance conversations.
A talent management system, which provides employees with access to their talent profiles, training and competence needs, career path development and many other useful tools to help them plan their Rowan careers.
Competitive compensation and benefits in every region in which we operate. We match each job in our company with similar jobs to ensure we are paying our employees a fair and competitive wage. We also provide competitive health, welfare and pension benefits in each of our areas of operation.
Classroom and on-line training programs to ensure our employees are competent for the roles they hold and are able to increase their skills to continue to grow in our organization.
Succession planning, which is the process by which we identify, develop and retain a sustainable bench of skilled leaders.
Promoting work-life balance and wellness of our employees through programs such as condensed work week options and various health initiatives.
Communicating often with all employees through email, newsletters and employee meetings.
We give full and fair consideration to the employment of disabled persons, taking into account the degree of disability, proposed job function and working environment. In the event an employee becomes disabled, we strive to make reasonable accommodations for continuing employment where possible. Rowan’s Human Resources policies and procedures are described in detail and are available online to all employees through the company’s internal management system. Our policies take into account employment laws and regulations and best practice. New policies, procedures and related training are developed as required.
Through the diligent and hard work of our employees, we are able to live our values and achieve our mission as one team.
Organizational Development – Learning, Competence, Performance and Career Rowan’s most important asset is our people, and we are committed to maintaining our highly skilled workforce through sustained investment in training and development. We want to ensure that capable leaders are cultivated, and that our people have the skills to

Rowan Companies plc Annual Report and Financial Statements
31 December 2014
6
deliver on our business strategy both now and in the future. To this end we have policies and procedures that dictate how we will administer training and competence as required by regulation or by us or our customers. Operating drilling rigs in the North Sea, Middle East, Southeast Asia, West and North Africa and the US GOM for dozens of different customers necessitates that we have a well-structured method for the determination and identification of required training. The company’s training requirements are best described as a matrix that includes requirements determined by:
Industry requirements.
Country of operation requirements.
Rig specific requirements.
Position or job level requirements.
Customer-specific requirements.
Rowan requirements.
Our training department maintains oversight of this matrix in close partnership with our operations leadership and with input from all of our areas of operation. This collaborative model of governance ensures that Rowan remains compliant as well as ensuring our people remain at the forefront of learning and development. Because our business demands that our people continually learn and develop, we introduced our talent management system in 2013 to our global population. The management system is an integrated online resource for employee development, performance and career growth. In keeping with our culture of ambition and hard work, this platform was designed to allow employees easier access to training and development resources as well as to increase reporting capabilities which should enable management to help drive employee performance. The management system is organized in four tracks: Learning, Competence, Performance and Career.
The Learning Track makes it simple to see what learning is required to stay compliant with the training requirements for specific positions. It is a resource for developing employee skills needed to advance in the company. It is also the portal through which training is scheduled.
In those regions where it is active, the Competence Track streamlines the administration of competency, allowing employees
to see at a glance how they are progressing against their competency profile. The Competence Track is a resource for tracking employee progression as they build their career. Rowan operates within an OPITO approved competence management system.
The Performance Track affords employees and managers a secure method to complete annual performance appraisals as well
as a place to view current and historical performance appraisals.
The Career Track houses individual employee talent profiles. These profiles display the historical record of each employee’s work and skills as well as allow employees to express interests in the areas of Rowan in which they would most like to work. This information is used by management to aide in succession and replacement planning.
It is our intent to develop our workforce to meet company expectations, customer demands and regulatory requirements as well as to prepare our workforce for increased responsibility and leadership. We wish to continually set standards of excellence, both personally and professionally, which exemplify our dedication to Rowan’s mission and vision. Employees The following information about our directors and employees is presented as of 31 December 2014:
Rowan Companies plc Annual Report and Financial Statements
31 December 2014
7
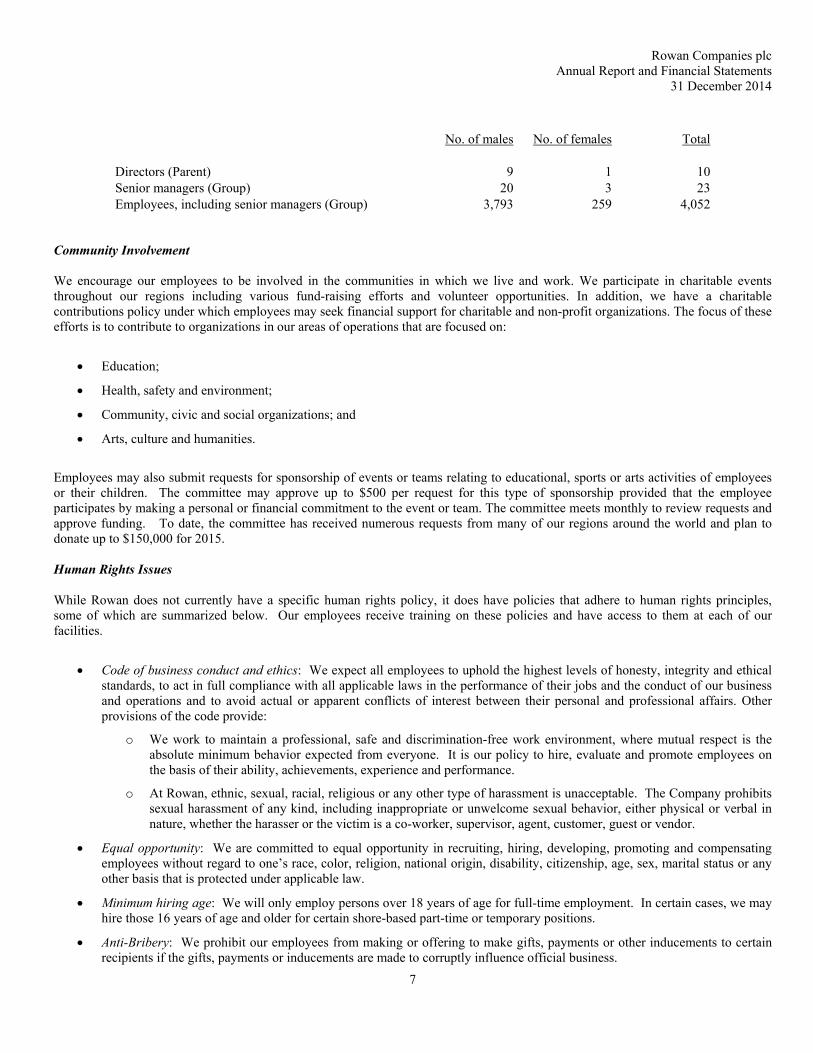
No. of males No. of females Total Directors (Parent) 9 1 10Senior managers (Group) 20 3 23Employees, including senior managers (Group) 3,793 259 4,052
Community Involvement We encourage our employees to be involved in the communities in which we live and work. We participate in charitable events throughout our regions including various fund-raising efforts and volunteer opportunities. In addition, we have a charitable contributions policy under which employees may seek financial support for charitable and non-profit organizations. The focus of these efforts is to contribute to organizations in our areas of operations that are focused on:
Education;
Health, safety and environment;
Community, civic and social organizations; and
Arts, culture and humanities.
Employees may also submit requests for sponsorship of events or teams relating to educational, sports or arts activities of employees or their children. The committee may approve up to $500 per request for this type of sponsorship provided that the employee participates by making a personal or financial commitment to the event or team. The committee meets monthly to review requests and approve funding. To date, the committee has received numerous requests from many of our regions around the world and plan to donate up to $150,000 for 2015. Human Rights Issues
While Rowan does not currently have a specific human rights policy, it does have policies that adhere to human rights principles, some of which are summarized below. Our employees receive training on these policies and have access to them at each of our facilities.
Code of business conduct and ethics: We expect all employees to uphold the highest levels of honesty, integrity and ethical standards, to act in full compliance with all applicable laws in the performance of their jobs and the conduct of our business and operations and to avoid actual or apparent conflicts of interest between their personal and professional affairs. Other provisions of the code provide:
o We work to maintain a professional, safe and discrimination-free work environment, where mutual respect is the absolute minimum behavior expected from everyone. It is our policy to hire, evaluate and promote employees on the basis of their ability, achievements, experience and performance.
o At Rowan, ethnic, sexual, racial, religious or any other type of harassment is unacceptable. The Company prohibits sexual harassment of any kind, including inappropriate or unwelcome sexual behavior, either physical or verbal in nature, whether the harasser or the victim is a co-worker, supervisor, agent, customer, guest or vendor.
Equal opportunity: We are committed to equal opportunity in recruiting, hiring, developing, promoting and compensating employees without regard to one’s race, color, religion, national origin, disability, citizenship, age, sex, marital status or any other basis that is protected under applicable law.
Minimum hiring age: We will only employ persons over 18 years of age for full-time employment. In certain cases, we may hire those 16 years of age and older for certain shore-based part-time or temporary positions.
Anti-Bribery: We prohibit our employees from making or offering to make gifts, payments or other inducements to certain recipients if the gifts, payments or inducements are made to corruptly influence official business.

Rowan Companies plc Annual Report and Financial Statements
31 December 2014
8
In addition, our management team reinforces our value statements at employee gatherings throughout the year to ensure that we treat each other, our vendors and our customers with respect at all times. Lastly, we maintain a whistleblower policy and whistleblower hotline, through which employees may call or write anonymously should they have any concerns of violations of any of our policies or values. We receive numerous calls and emails to the hotline and each one is thoroughly investigated by our compliance officer. Investigations that show inappropriate conduct or behavior are handled through disciplinary action, up to and including termination. Results of each investigation and action taken are reported to the audit committee of our board of directors on a quarterly basis. Safety and Environment We are committed to an injury-free workplace and to protecting the environment. Our senior management has identified the following seven quality, health, safety and environmental priorities for all employees and third-party personnel:
1. The safety of personnel is our first and highest priority. There is no job so urgent or important that we cannot take the time to plan it well and do it safely.
2. All employees and third-party personnel have an obligation and the authority to stop any activity if they believe it is not safe.
3. We will do what’s right. We will comply with all applicable laws and regulations.
4. Our operations will not harm the environment. Each facility will have a plan to prevent pollution and manage any incident to minimize impact to the environment.
5. The Rowan Management System (RMS) is how we conduct our business. We will follow the policies and procedures or change our policies and procedures to reflect best work practice.
6. We will perform risk assessments to ensure the safety of our personnel, the environment and our assets. We will either eliminate any hazards or plan our business to manage risk using appropriate safeguards.
7. We will continuously improve our operations in order to protect the health and safety of personnel, safeguard the environment and improve our service quality.
The offshore drilling business is subject to various environmental hazards, including oil spills, pollutant and greenhouse gas discharges, blowouts and other incidents which may affect the environment. Rowan is committed to preserving the environment and being a responsible steward of the planet’s natural resources. We strive to provide our customers with drilling services in an environmentally conscious manner; comply with the environmental laws and regulations of the countries in which we operate; and act responsibly in the absence of laws and regulations. Each of our drilling units have an approved Shipboard Oil Pollution Emergency Plan that establishes detailed procedures for rapid and effective response to spill events that may occur as a result of our operations or those of our customer. This plan is reviewed annually and tested periodically through onboard emergency drills conducted by our crews. In addition to environmental laws and regulations, Rowan has a number of environmental policies and procedures that outline important requirements and provide guidance to our crews to ensure understanding of international and governmental regulations, including policies regarding waste and garbage management, fuel oil management, bilge water management, sanitary waste, and paint removal and disposal. We train and educate our employees to be environmentally responsible, to prevent pollution and reduce the amount of waste at each of our facilities. We also actively participate in industry and government organizations to further common environmental objectives. The company’s Greenhouse Gas Emission Statement, which comprises the statutory carbon reporting disclosures required by Companies Act 2006, can be found on page 21.

Rowan Companies plc Annual Report and Financial Statements
31 December 2014
9
BUSINESS REVIEW During 2014, we took delivery of three newly constructed drillships: the Rowan Renaissance, which commenced drilling operations offshore West Africa in April 2014; the Rowan Resolute, which commenced operations in the US GOM in October 2014; and the Rowan Reliance, which commenced operations in the US GOM in February 2015. Our fourth drillship, the Rowan Relentless, is scheduled for delivery in late March 2015 and is expected to commence operations in the US GOM in the third quarter of 2015. As of February 19, 2015, the date of our most recent Fleet Status Report, we had six jack-ups in the North Sea, ten in the Middle East, seven in the US GOM (including three cold-stacked rigs), two in Trinidad, three in Malaysia, and one in each of Tunisia and Indonesia. At February 19, 2015, our backlog totaled $5.1 billion compared to $5.0 billion at this time last year. Revenues for 2014 increased by 16% to $1.824 billion from $1.579 billion in 2013 primarily due to the addition of the Rowan Renaissance and Rowan Resolute. Fleet utilization improved to 82% in 2014 from 81% in 2013, and fleet average day rates improved to $190,629 in 2014 from $170,912 in 2013. Out-of-service days totaled approximately 10% of available rig days in 2014 and 2013. We define out-of-service days as those when a rig is (or planned to be) out of service and is not able to earn revenue. Operational downtime, which is the unbillable time attributable to equipment breakdowns or procedural failures, was approximately 1% of in-service days in 2014 and 2013.
Due to a number of factors including the rapid and dramatic fall in worldwide oil prices in the last half of 2014 and decline in the Company's stock price; the expected delivery of a large number of newbuild jack-up drilling rigs over the next few years; and the finalization of the Company's 2015 operating budget, among others, we conducted an impairment test of our assets and determined that the carrying values of our twelve oldest jack-up rigs were not recoverable from their undiscounted cash flows and exceeded their fair values. As a result, we recognized a noncash asset impairment charge in the fourth quarter of 2014 in the amount of $565.7 million.
RESULTS OF OPERATIONS Our profitability is primarily a function of our ability to keep our rigs under contract earning operating day rates, offset by any downtime while a rig is under contract. The Company typically receives a reduced day rate or no day rate during periods of downtime. Our ability to obtain contracts for our rigs and the day rates received are primarily determined by the level of oil and gas exploration and development expenditures, which are heavily influenced by trends in oil and natural gas prices and the availability of competitive equipment. When drilling markets are strengthening, day rates generally lag the upward trend in rig utilization, and day rate increases can be more significant as fleet utilization approaches 90% or more. When drilling markets are weakening, contractors often reduce day rates in an effort to maintain fleet utilization. Both rig utilization and day rates have historically declined much faster than they have risen. As a result of the dramatic decline in oil and gas prices over the last half of 2014, many oil and gas operators have significantly reduced their capital expenditure budgets for 2015. In addition, the offshore drilling market is currently experiencing an oversupply of drilling units as newbuilds enter the market. In the current environment, we may have difficulty securing new drilling contracts; we may be forced to enter into contracts at unattractive day rates; customers may seek to renegotiate or terminate existing contracts; and we may have difficulty selling older rigs. We currently have a mix of short- and long-term contracts and are unable to predict the duration of the current market condition or its financial effects on the Company. Current Operations and Markets Worldwide demand for offshore drilling services is inherently volatile and has historically varied among geographic markets, as has the supply of competitive equipment. Exploration and development expenditures can be impacted by many local factors, such as political and regulatory policies, seasonal weather patterns, lease expirations, new oil and gas discoveries and reservoir depletion. Over time, the level and expected direction of oil and natural gas prices are the principal determinants of drilling activity, and oil and gas prices are ultimately a function of the supply of and demand for those commodities. We currently operate in the U.K. and Norwegian sectors of the North Sea, the Middle East, US GOM, West and North Africa, Southeast Asia and Trinidad. As demand shifts among geographic areas, the Company may from time to time relocate rigs from one major geographic area to another. The relocation of rigs is a significant undertaking, and often interrupts revenues and cash flows for
Rowan Companies plc Annual Report and Financial Statements
31 December 2014
10
several months, particularly when equipment upgrades are involved. Thus, major relocations are typically carried out only when the likelihood of higher long-term returns outweighs the short-term costs. The North Sea is a mature, harsh-environment offshore drilling market that has long been dominated by major oil and gas companies operating within a highly regulated environment. Project lead times are often lengthy, and drilling assignments, which typically require ultra-premium equipment capable of handling extreme weather conditions and high down-hole pressures and temperatures, can range from several months to several years. Drilling activity and day rates in the North Sea move slowly in response to market conditions, and generally follow trends in oil prices. As of February 16, 2015, industry utilization for jack-up rigs in the North Sea was 98%, and we had six rigs in the U.K. and Norwegian sectors with expected contract completion dates ranging from 2015 through 2018. The Middle East is a market in which we have had a significant presence in recent years. As of February 16, 2015, industry utilization in the Middle East for jack-up rigs was 85%, and we had nine rigs under contract in Saudi Arabia and one under contract in Qatar. Four of our ten rigs working there have contracts estimated to complete in 2015, five have contracts estimated to complete from 2016 through 2018, and one has a contract estimated to complete in 2024. The US GOM jack-up drilling market is highly fragmented among many participants, many of which are independent operators whose drilling activities may be highly dependent on near-term operating cash flows. A typical drilling assignment may call for 60 days of exploration or development work performed under a single-well contract with negotiable renewal options. Long-term contracts for jack-up rigs have been relatively rare, and generally are available only from the major integrated oil companies and a few of the larger independent operators. Jack-up drilling demand and day rates in the US GOM have tended to move quickly and generally follow trends in natural gas prices. Demand in the shallower waters of the US GOM has been weak over the last few years and at almost record lows currently as a result of the availability of natural gas and low prices. As of February 16, 2015, industry utilization for jack-up rigs in the US GOM was 27%, and we had seven jack-up rigs there – two under contracts estimated to complete in 2015, one under contract estimated to complete in 2016, one that was idle, and three that were cold-stacked. A number of newbuild rigs have entered the Southeast Asia market recently due to its proximity to construction shipyards. We currently have one rig operating in Malaysia through the end of 2015 and one rig operating in Indonesia that is contracted for work in Malaysia from approximately April through July 2015. In addition, we have two idle rigs in Malaysia. Industry utilization for jack-up rigs in Southeast Asia was 81% at February 16, 2015. We expect the Southeast Asia market to weaken through 2015 due to an oversupply of rigs in the area. The ultra-deepwater drilling market consists of semisubmersibles and drillships with a rated water depth of 7,500 feet or greater (“ultra-deepwater rigs”). As of February 24, 2015, there were a total of 162 units in this category, including Rowan’s three ultra-deepwater drillships, with a worldwide utilization rate of 89%. There were an additional 68 ultra-deepwater rigs under construction, including Rowan’s fourth drillship, scheduled for delivery over the next five years. The major ultra-deepwater drilling markets in the world are the US GOM, South America and West Africa. The highest specification deepwater rigs, such as those owned by Rowan, can obtain work at better rates than lower specification rigs, as drilling requirements have become more stringent, particularly in the post-Macondo environment. In down markets, the highest specification rigs typically displace lower specification rigs, although at reduced rates. Most ultra-deepwater rigs are committed many months in advance given the extensive planning and high costs associated with ultra-deepwater projects. Contracts are usually long term, but sublets are common within a company’s contract window. Three of our drillships are contracted into 2017, and one is contracted into early 2018.
Rowan Companies plc Annual Report and Financial Statements
31 December 2014
11
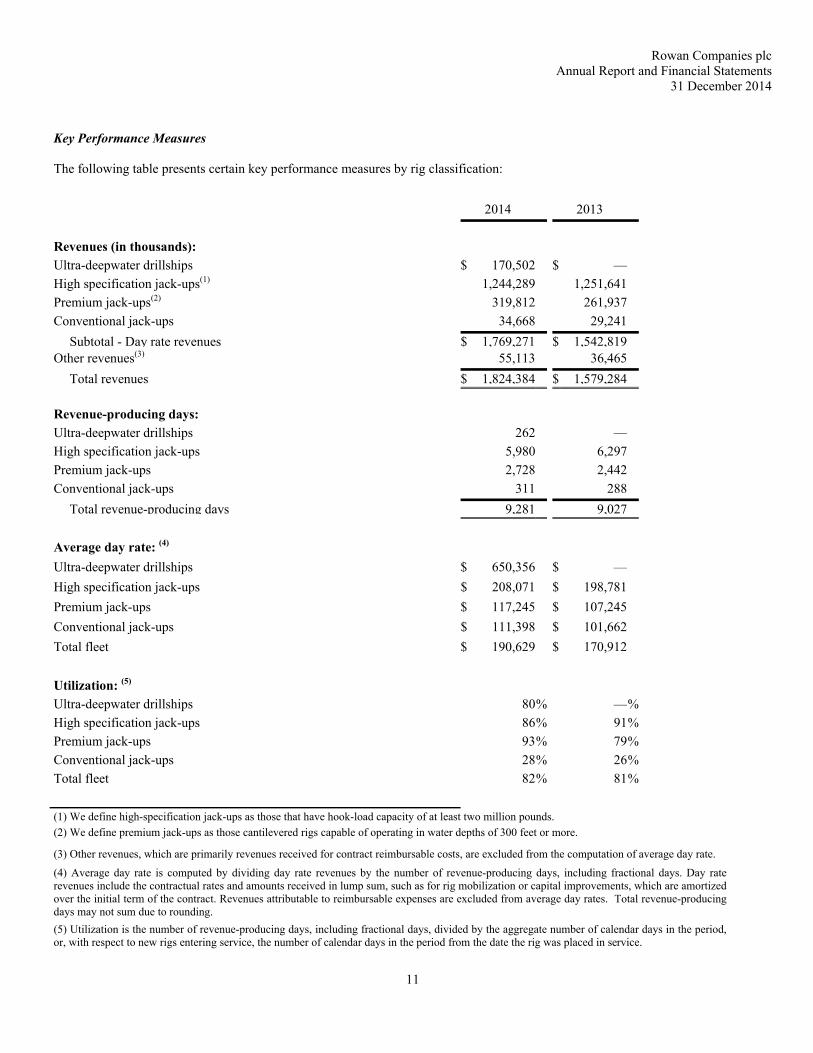
Key Performance Measures The following table presents certain key performance measures by rig classification:
2014 2013
Revenues (in thousands):
Ultra-deepwater drillships $ 170,502 $ —
High specification jack-ups(1) 1,244,289 1,251,641
Premium jack-ups(2) 319,812 261,937
Conventional jack-ups 34,668 29,241
Subtotal - Day rate revenues $ 1,769,271 $ 1,542,819 Other revenues(3) 55,113 36,465
Total revenues $ 1,824,384 $ 1,579,284
Revenue-producing days:
Ultra-deepwater drillships 262 —
High specification jack-ups 5,980 6,297
Premium jack-ups 2,728 2,442
Conventional jack-ups 311 288
Total revenue-producing days 9,281 9,027
Average day rate: (4)
Ultra-deepwater drillships $ 650,356 $ —
High specification jack-ups $ 208,071 $ 198,781
Premium jack-ups $ 117,245 $ 107,245
Conventional jack-ups $ 111,398 $ 101,662
Total fleet $ 190,629 $ 170,912
Utilization: (5)
Ultra-deepwater drillships 80% —%
High specification jack-ups 86% 91%
Premium jack-ups 93% 79%
Conventional jack-ups 28% 26%
Total fleet 82% 81%
(1) We define high-specification jack-ups as those that have hook-load capacity of at least two million pounds.
(2) We define premium jack-ups as those cantilevered rigs capable of operating in water depths of 300 feet or more.
(3) Other revenues, which are primarily revenues received for contract reimbursable costs, are excluded from the computation of average day rate.
(4) Average day rate is computed by dividing day rate revenues by the number of revenue-producing days, including fractional days. Day rate revenues include the contractual rates and amounts received in lump sum, such as for rig mobilization or capital improvements, which are amortized over the initial term of the contract. Revenues attributable to reimbursable expenses are excluded from average day rates. Total revenue-producing days may not sum due to rounding.
(5) Utilization is the number of revenue-producing days, including fractional days, divided by the aggregate number of calendar days in the period, or, with respect to new rigs entering service, the number of calendar days in the period from the date the rig was placed in service.
Rowan Companies plc Annual Report and Financial Statements
31 December 2014
12
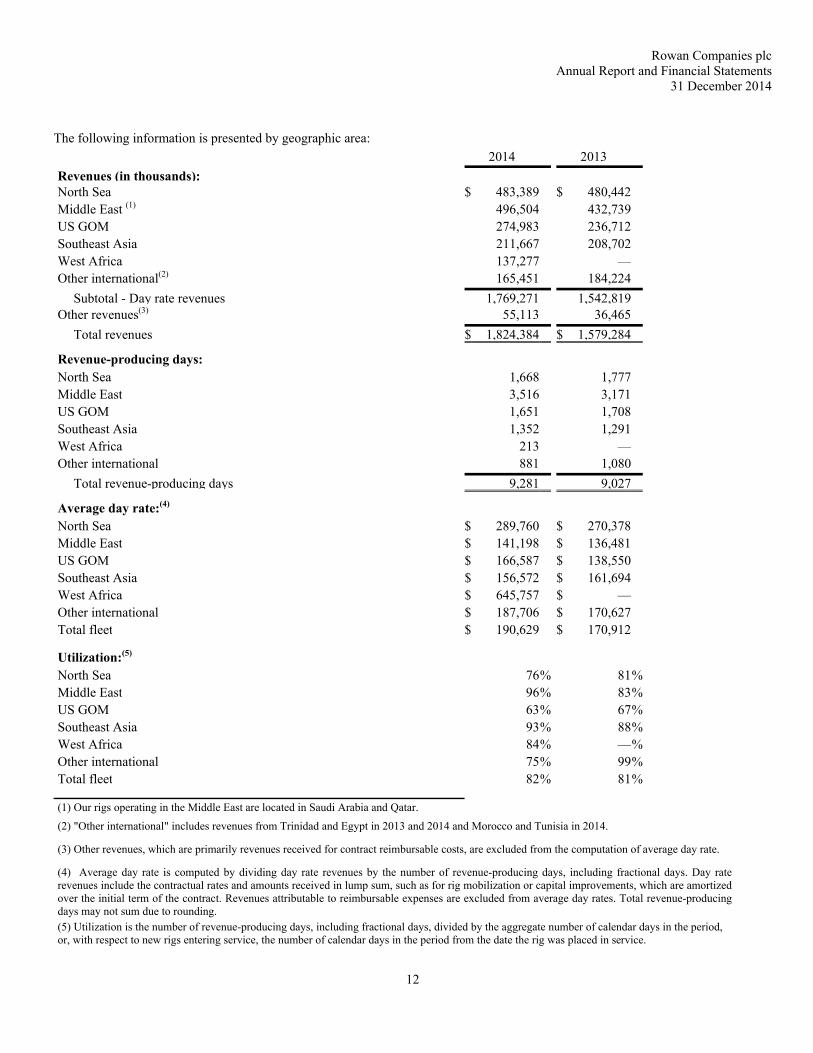
The following information is presented by geographic area:
2014 2013
Revenues (in thousands): North Sea $ 483,389 $ 480,442 Middle East (1) 496,504 432,739 US GOM 274,983 236,712 Southeast Asia 211,667 208,702 West Africa 137,277 — Other international(2) 165,451 184,224
Subtotal - Day rate revenues 1,769,271 1,542,819 Other revenues(3) 55,113 36,465
Total revenues $ 1,824,384 $ 1,579,284
Revenue-producing days: North Sea 1,668 1,777 Middle East 3,516 3,171 US GOM 1,651 1,708 Southeast Asia 1,352 1,291 West Africa 213 — Other international 881 1,080
Total revenue-producing days 9,281 9,027
Average day rate:(4) North Sea $ 289,760 $ 270,378 Middle East $ 141,198 $ 136,481 US GOM $ 166,587 $ 138,550 Southeast Asia $ 156,572 $ 161,694 West Africa $ 645,757 $ — Other international $ 187,706 $ 170,627 Total fleet $ 190,629 $ 170,912
Utilization:(5) North Sea 76% 81% Middle East 96% 83% US GOM 63% 67% Southeast Asia 93% 88% West Africa 84% —% Other international 75% 99% Total fleet 82% 81%
(1) Our rigs operating in the Middle East are located in Saudi Arabia and Qatar.
(2) "Other international" includes revenues from Trinidad and Egypt in 2013 and 2014 and Morocco and Tunisia in 2014.
(3) Other revenues, which are primarily revenues received for contract reimbursable costs, are excluded from the computation of average day rate.
(4) Average day rate is computed by dividing day rate revenues by the number of revenue-producing days, including fractional days. Day rate revenues include the contractual rates and amounts received in lump sum, such as for rig mobilization or capital improvements, which are amortized over the initial term of the contract. Revenues attributable to reimbursable expenses are excluded from average day rates. Total revenue-producing days may not sum due to rounding. (5) Utilization is the number of revenue-producing days, including fractional days, divided by the aggregate number of calendar days in the period, or, with respect to new rigs entering service, the number of calendar days in the period from the date the rig was placed in service.

Rowan Companies plc Annual Report and Financial Statements
31 December 2014
13
2014 Compared to 2013 Our operating results for the years ended December 31, 2014 and 2013 are highlighted below (dollars in millions):
2014 2013
Amount % of Revenues Amount % of Revenues
Revenues $ 1,824.4 100% $ 1,579.3 100%
Direct operating costs (excluding items below) (991.4) -54% (860.9) -55%
Depreciation expense (322.6) -18% (271.0) -17%
Selling, general and administrative expenses (125.8) -7% (131.3) -8%
Net gain on property disposals 1.8 0% 20.1 1%
Litigation settlement 20.9 -2% — —%
Material charges and other operating expenses (574.0) -31% (4.5) —%
Operating income (loss) $ (166.7) -9% $ 331.7 21%
Revenues for 2014 increased by $245.1 million or 16% compared to 2013 as a result of the following (in millions):
Increase
(decrease)
Addition of the Rowan Renaissance and Rowan Resolute $ 170.5
Higher average day rates for existing rigs 57.3
Revenues for reimbursable costs 17.6
Other, net (0.3)
Net increase $ 245.1
Operating costs other than depreciation, selling, general and administrative expenses, litigation settlement and material charges and other operating expenses for 2014 increased by $130.4 million or 15% over the prior year, as a result of the following (in millions):
Increase
Addition of the Rowan Renaissance and Rowan Resolute $ 62.0
Higher costs due to rigs in shipyard 29.7
Expansion of foreign shorebases 15.8
Reimbursable costs 17.6
Other, net 5.3
Net increase $ 130.4
For purposes of this discussion, we define our operating margin as revenues in excess of operating costs, other than depreciation, selling, general and administrative expenses, gains or losses on asset disposals, litigation settlement, and material charges and other operating expenses. Operating margin as we have defined it is a non-GAAP financial measure. The impacts on operating margin of those excluded items are discussed separately below and have been excluded solely to simplify the discussion. Operating margin, as defined, increased to approximately 46% in 2014 from 45% in 2013. Depreciation increased by $51.6 million or 19% over 2013 primarily due to the addition of the drillships. Selling, general and administrative expenses decreased by $5.5 million or 4% primarily due to fewer professional services and fees for corporate restructuring, initiatives related to the Company's internationalization and entry into the ultra-deepwater market; and to

Rowan Companies plc Annual Report and Financial Statements
31 December 2014
14
lower equity compensation expense resulting from fair market adjustments to certain share-based awards recorded under the liability method of accounting. Net gain on property disposals in 2013 included a $19.1 million gain resulting from the sale of the Rowan Paris, one of the Company's older rigs, for approximately $40.0 million in cash. In 2014, the Company settled its litigation with the owners and operators of a tanker that collided with the Rowan EXL I in 2012 and received $20.9 million in cash as compensation for damages incurred in 2012 for repair costs to and loss of use of the rig. Such amount was recognized in operating income in 2014. Long-lived assets are required to be reviewed for impairment whenever circumstances indicate their carrying values may not be recoverable. Due to a number of factors including the rapid and dramatic fall in worldwide oil prices in the last half of 2014 and decline in the Company's stock price; the expected delivery of a large number of newbuild jack-up drilling rigs over the next few years; and the finalization of the Company's 2015 operating budget, among others, we conducted an impairment test of our assets and determined that the carrying values of our twelve oldest jack-up drilling units were not recoverable from their undiscounted cash flows and exceeded their fair values. As a result, we recognized a noncash asset impairment charge of $565.7 million in the fourth quarter of 2014. Material charges for 2014 also included an $8.3 million noncash impairment charge on a Company aircraft, which we sold later in 2014 at an immaterial loss. Material charges and other operating expenses for 2013 consisted of a $4.5 million noncash asset impairment charge on a dock and maintenance facility. In 2014, we recognized an income tax benefit of $150.7 million on a $269.6 million pretax loss from continuing operations, as compared to a provision of $8.7 million on $261.2 million of pretax income from continuing operations in 2013. The benefit in 2014 was primarily due to the acceleration of previously deferred intercompany gains and losses associated with impaired assets, the amortization of deferred intercompany gains and losses related to outbounding certain U.S.-owned rigs to our non-U.S. subsidiaries in prior years, and the settlement agreement reached with the U.S. Internal Revenue Service in September 2014 (see Note 7 of Notes to Consolidated Financial Statements of our Form 10-K). The low effective tax rate of 3.3% in 2013 was due in part to the amortization of deferred intercompany gains and losses related to outbounding certain U.S.-owned rigs to our non-U.S. subsidiaries in prior years; a significant proportion of income earned in low-tax foreign jurisdictions; the implementation of our international restructuring plan, which resulted in the utilization of non-U.S. subsidiaries’ foreign taxes paid as credits against U.S. taxable income; additional tax basis in fixed assets due to the application of a ruling in a third-party tax case to the Company's situation; and the continued recognition of tax benefits related to the application of certain tax planning strategies implemented in 2012 related to interest capitalization.

Rowan Companies plc Annual Report and Financial Statements
31 December 2014
15
Outlook Our backlog by geographic area as of the date of our most recent Fleet Status Report is presented below (in millions):
February 19, 2015
Jack-ups Drillships Total
US GOM $ 14 $ 1,892 $ 1,906
Middle East 1,666 — 1,666
North Sea 942 — 942
West Africa — 274 274
Southeast Asia 61 — 61
Other international 241 — 241
Total backlog $ 2,924 $ 2,166 $ 5,090
For purposes of computing backlog, we have assumed the Rowan Renaissance, which is currently operating in West Africa, will relocate to the US GOM for the third year of its three-year contract based on discussions with the customer, where it would earn a contract day rate of $630,000. Alternatively, if the rig continues to operate in West Africa during year three, the contract day rate would be $660,000. We estimate our backlog will be realized as follows (in millions):
February 19, 2015
Jack-ups Drillships Total
2015 $ 1,038 $ 670 $ 1,708
2016 793 889 1,682
2017 489 589 1,078
2018 256 18 274
2019 and later years 348 — 348
Total backlog $ 2,924 $ 2,166 $ 5,090
For comparative purposes, our backlog by geographic area as reported in our 2013 Form 10-K, is set forth below (in millions):
February 20, 2014
Jack-ups Drillships Total
US GOM $ 84 $ 1,777 $ 1,861
North Sea 1,405 — 1,405
Middle East 1,029 — 1,029
West Africa — 226 226
Southeast Asia 160 — 160
Other international 297 — 297
Total backlog $ 2,975 $ 2,003 $ 4,978
As a result of the dramatic decline in oil and gas prices over the last half of 2014, many oil and gas operators have significantly reduced their capital expenditure budgets for 2015. In addition, the offshore drilling market is currently experiencing an oversupply of

Rowan Companies plc Annual Report and Financial Statements
31 December 2014
16
drilling units as newbuilds enter the market. In the current environment, we may have difficulty securing new drilling contracts; we may be forced to enter into contracts at unattractive day rates; customers may seek to renegotiate or terminate existing contracts; and we may have difficulty selling older rigs. We currently have a mix of short- and long-term contracts, which we expect will help to mitigate the effect of a prolonged downturn. Nevertheless, we are unable to predict the duration of the current market condition or its financial effects on the Company. Newbuild deliveries in recent years have increased the pool of rigs competing for contracts in many areas in which we operate, putting significant downward pressure on utilization and day rates. As of February 16, 2015, there were approximately 132 jack-up rigs under construction worldwide for delivery through 2017 (24% of the current jack-up fleet), including 53 that are considered high-specification (77% of the current high-specification fleet). Approximately 22 of these jack-up rigs, which are not contracted, are scheduled for delivery in 2015. Utilization and day rates in certain regions are expected to come under additional pressure as these rigs enter the worldwide fleet. About 63% of our remaining available rig days in 2015 (excluding our three cold-stacked rigs) and 43% of available rig days in 2016 were under contract or commitment as of February 19, 2015. As of that date, we had three rigs without contracts (excluding the three cold-stacked rigs). Failure to obtain or renew contracts would significantly impact the Company's results of operations and cash flow. Out-of-Service Days – We define out-of-service days as those days when a rig is (or planned to be) out of service and is not able to earn revenue. The Company may be compensated for certain out-of-service days, such as for shipyard stays or for rig transit periods preceding a contract; however, recognition of any such compensation is deferred and recognized over the period of drilling operations. Our out-of-service days totaled approximately 10% of available rig days in 2014 and 2013, down from 12% in 2012. We estimate planned out-of-service time for 2015 to range from 3% to 6%. Operational Downtime – We define operational downtime as the unbillable time a rig is under contract and unable to conduct planned operations due to equipment breakdowns or procedural failures. Our operational downtime, which is in addition to out-of-service days, was approximately 1% of in-service days for both 2014 and 2013, down from 2% in 2012. We estimate operational downtime for our jack-up fleet will typically approximate 2.5% of operating days on a go-forward basis. Following its January 2014 delivery from the shipyard and commencement of operations in April, the Rowan Renaissance ultra-deepwater drillship experienced 41 off-rate days, which included 23 out-of-service days for commissioning of late-arriving equipment and 18 days of operational downtime in 2014. Our second ultra-deepwater drillship, the Rowan Resolute, began operating in the US GOM in mid-October 2014 and experienced 27 out-of-service days for commissioning and no operational downtime days in 2014. We estimate that operational downtime for our newly constructed ultra-deepwater drillships will be less than 5% of operating days following an initial break-in period of operations, which could range from approximately six months to one year, during which time the actual rate could be somewhat higher. Other Matters – During the fourth quarter of 2014, we engaged a broker to assist in the potential sale of certain of our older jack-up rigs.

Rowan Companies plc Annual Report and Financial Statements
31 December 2014
17
LIQUIDITY AND CAPITAL RESOURCES Key balance sheet amounts and ratios at December 31 were as follows (dollars in millions):
2014 2013
Cash and cash equivalents $ 339.2 $ 1,092.8
Current assets (excluding assets of discontinued operations) $ 941.1 $ 1,505.1
Current liabilities (excluding liabilities of discontinued operations) $ 333.2 $ 334.5
Current ratio (excluding assets and liabilities of discontinued operations) 2.82 4.50
Long-term debt $ 2,807.3 $ 2,008.7
Shareholders' equity $ 4,691.4 $ 4,893.8
Debt to capitalization ratio 37% 29%
Sources and uses of cash and cash equivalents were as follows:
2014 2013
Net operating cash flows $ 423.0 $ 623.2
Borrowings, net of issue costs 792.7 —
Payment of cash dividends (37.7) —
Capital expenditures (1,958.2) (607.3)
Proceeds from asset disposals 22.0 44.5
Proceeds from equity compensation plans 4.7 2.9
All other, net (0.1) 5.5
Total net (use) sources $ (753.6 ) $ 68.8
Operating Cash Flows Cash flows from operations decreased to approximately $423 million in 2014 from $623 million in 2013. Operating cash flows for 2014 compared to 2013 were negatively impacted by an increase in trade and other receivables, receipt of an approximately $53 million U.S. federal income tax refund in 2013, and higher pension contributions in 2014. Investing Activities During 2014, we took delivery of three of our four newly constructed ultra-deepwater drillships, with the fourth expected to be delivered in late March 2015. Capital expenditures in 2014 totaled $1.958 billion and included the following:
• $1.560 billion for construction of the ultra-deepwater drillships Rowan Renaissance, Rowan Resolute, Rowan Reliance and Rowan Relentless;
• $345 million for improvements to the existing fleet, including contractually required modifications; and
• $53 million for rig equipment inventory and other.
We currently estimate our 2015 capital expenditures to be approximately $850-$875 million, including $660-$685 million in connection with our two newbuild drillships, including costs for mobilization, commissioning, riser gas-handling equipment, software certifications and drillship fleet spares to support our deepwater operations. The remaining amount is related to existing fleet maintenance capital and worldwide spares.

Rowan Companies plc Annual Report and Financial Statements
31 December 2014
18
We expect to fund our 2015 capital expenditures using available cash, cash flows from operations and our revolving credit facility. The capital budget reflects an appropriation of money that we may or may not spend, and the timing of such expenditures may change. We will periodically review and adjust the capital budget as necessary based upon current and forecast cash flows and liquidity, anticipated market conditions in our business, the availability of financial resources, and alternative uses of capital to enhance shareholder value. Capital expenditures for 2013 totaled $607 million and included $229 million towards construction of the Rowan Renaissance, Rowan Resolute, Rowan Reliance and Rowan Relentless; $323 million for improvements to the existing fleet, including contractually required modifications; and $55 million for rig equipment, inventory and other. Financing Activities In January 2014 we completed the issuance and sale in a public offering of $400 million aggregate principal amount of 4.75% Senior Notes due 2024, and $400 million aggregate principal amount of 5.85% Senior Notes due 2044. Net proceeds of the offering were approximately $792 million, which the Company used for its rig construction program and for general corporate purposes. Additionally, the Company amended and restated its credit agreement to increase the borrowing capacity under the revolving credit facility from $750 million to $1.0 billion, among other things. There were no amounts drawn under the revolving credit facility at December 31, 2014. As of December 31, 2014, we had $2.8 billion of outstanding long-term debt consisting of:
$400 million principal amount of 5% Senior Notes due 2017; $500 million principal amount of 7.875% Senior Notes due 2019; $700 million principal amount of 4.875% Senior Notes due 2022; $400 million principal amount of 4.75% Senior Notes due 2024; $400 million principal amount of 5.4% Senior Notes due 2042; and $400 million principal amount of 5.85% Senior Notes due 2044 (together, the “Senior Notes”).
The Senior Notes are fully and unconditionally guaranteed on a senior and unsecured basis by Rowan plc (see Note 15 of Notes to Consolidated Financial Statements in our Form 10-K). Annual interest payments on the Senior Notes total $160 million. No principal payments are required until each series’ final maturity date. Management believes that cash flows from operating activities, existing cash balances, and amounts available under the revolving credit facility will be sufficient to satisfy the Company’s cash requirements for the following twelve months. The Company expects to utilize its revolving credit facility in the first or second quarter of 2015 to fund the final shipyard payment for the Rowan Relentless. Restrictive provisions in the Company’s bank credit facility agreement limit consolidated debt to 60% of book capitalization. Our consolidated debt to total capitalization ratio at December 31, 2014, was 37%. Other provisions of our debt agreements limit the ability of the Company to create liens that secure debt, engage in sale and leaseback transactions, merge or consolidate with another company and, in the event of noncompliance, restrict investment activities and asset purchases and sales, among other things. Additionally, our credit facility agreement provides that the facility will not be available in the event of a material adverse change in the Company’s condition, operations, business, assets, liabilities or ability to perform. The Company was in compliance with its debt covenants at December 31, 2014, and expects to remain in compliance throughout 2015. By order of the Board of Directors /s/ Thomas P. Burke Thomas P. Burke Chief Executive Officer and Director 13 March 2015

Rowan Companies plc Annual Report and Financial Statements
31 December 2014
19
DIRECTORS’ REPORT The directors of Rowan Companies plc present their Annual Report and financial statements for the year ended 31 December 2014. The group accounts for the years ended 31 December 2014 and 2013 have been prepared in accordance with United States Generally Accepted Accounting Principles (US GAAP), as permitted under The Accounting Standards (Prescribed bodies) (United States of America and Japan) Regulations 2012 (“the Regulations”). The Regulations expired in 2014, and we expect that the group accounts will be prepared in IFRS beginning with the year ended 31 December 2015. Political donations None. Derivative financial instruments and risk exposures As a general practice, neither the company nor the group holds or issues derivative financial instruments. We invest our excess cash primarily in time deposits and high-quality money market accounts at several large commercial banks with strong credit ratings, and therefore believe that our risk of loss is minimal. Credit risk is the risk that one party to a financial instrument will cause a financial loss for the other party by failing to discharge an obligation. The group is exposed to credit risk relating to its receivables from customers. The group’s customers largely consist of major international oil and gas exploration companies, national oil and gas companies and independent oil and gas companies. The group routinely evaluates the credit quality of potential customers and maintains reserves for credit losses, which have been within management’s expectations. Liquidity risk is the risk that an entity will encounter difficulty in meeting obligations associated with financial liabilities. In 2012, the group issued $1.1 billion in debt in public offerings and an additional $800 million in January 2014. In January 2014, we amended our revolving credit facility to increase the borrowing capacity from $750 million to $1.0 billion, among other things. There were no amounts drawn under the revolving credit facility at 31 December 2014. Management believes that cash flows from operating activities, existing cash balances, and amounts available under the group’s revolving credit facility will be sufficient to satisfy the group’s near- and long-term cash requirements. Market risk is the risk of exposure to variability in cash flows that is attributable to a particular risk associated with a recognized asset or liability such as changes in currency exchange rates. The majority of the group’s transactions are denominated in United States dollars. In order to reduce the impact of exchange rate fluctuations, the group generally requires customer payments to be in U.S. dollars and limits non-U.S. currency holdings to the extent they are needed to pay liabilities denominated in local currencies. In certain countries in which we operate, local laws or contracts may require us to receive payment for a portion of the contract in the local currency. In such instances, we may hold a greater amount of local currency than would otherwise be the case exposing us to a risk of exchange loss. Fluctuating commodity prices affect the group’s future earnings materially to the extent that they influence demand for the group’s products and services. Essential contracts The group has contractual and other arrangements with numerous suppliers, customers and other third parties in support of its business activities. We do not consider any individual arrangement to be essential to the business of the group. Branches The group maintains branch operations in Bahrain, Dubai, Namibia, Norway, Qatar, Saudi Arabia, Spain, Trinidad and Tunisia. Executive offices of the group are located in Houston, Texas.
Rowan Companies plc Annual Report and Financial Statements
31 December 2014
20
Acquisition of company shares In 2012, the Board of Directors approved the continuation of a $150 million share repurchase program, of which approximately $25 million remained available. The company did not acquire any shares under its share repurchase program in 2014. Share repurchases may be commenced or suspended from time to time without prior notice subject to further Board approval. Any shares acquired under the share repurchase program will be canceled. The company established an employee benefit trust (EBT) for purposes of administering the group’s share-based compensation arrangements. The EBT may be used to issue shares of the company under such arrangements or to acquire shares from participants upon forfeiture of nonvested restricted shares or in satisfaction of tax withholding requirements. Shares held by the EBT are treated as treasury shares for accounting purposes, and are not eligible for voting or receipt of dividends. During 2014, the EBT acquired approximately 110,000 shares as a result of restricted share forfeitures and in satisfaction of tax withholding requirements at a cost of approximately $3.4 million. At 31 December 2014, the EBT held approximately 265,000 shares.
Rowan Companies plc Annual Report and Financial Statements
31 December 2014
21
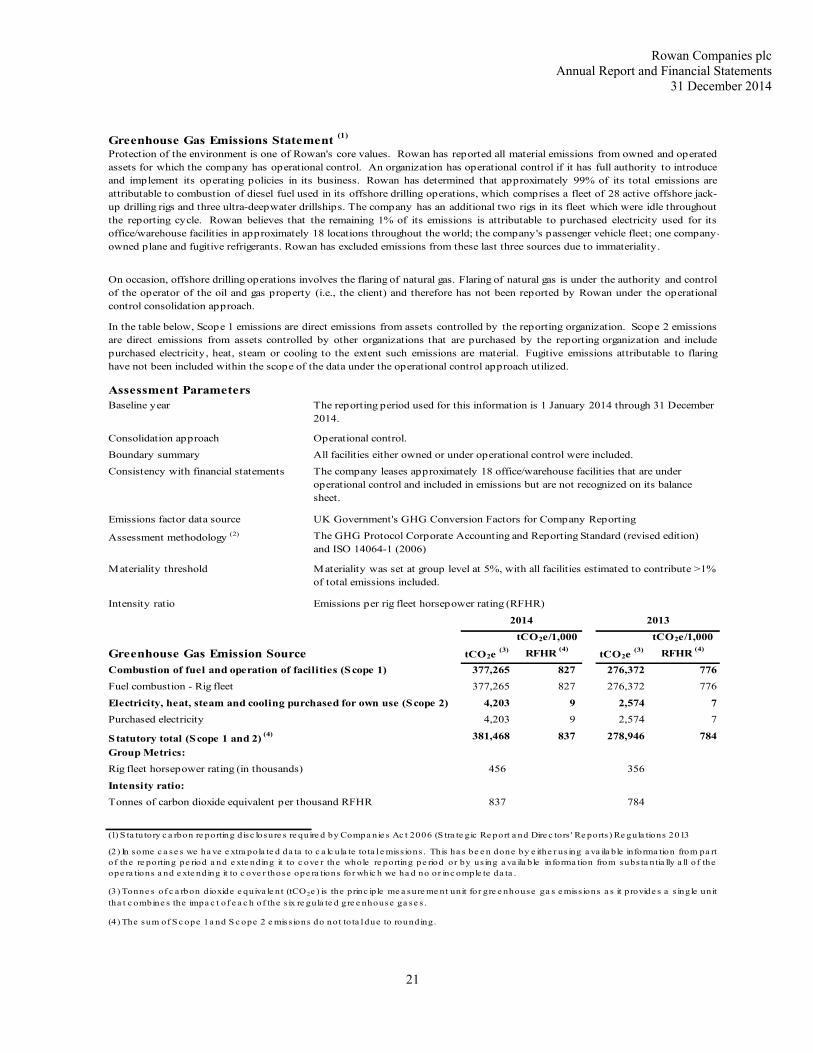
Assessment ParametersBaseline year
Consolidation approach
Boundary summary
Consistency with financial statements
Emissions factor data source
Assessment methodology (2)
Materiality threshold
Intensity ratio
tCO2e (3)
tCO2e/1,000
RFHR (4)
tCO2e (3)
tCO2e/1,000
RFHR (4)
377,265 827 276,372 776
377,265 827 276,372 776
4,203 9 2,574 7
4,203 9 2,574 7
381,468 837 278,946 784
456 356
837 784
Statutory total (Scope 1 and 2) (4)
Group Metrics:
Rig fleet horsepower rating (in thousands)
Intensity ratio:
Tonnes of carbon dioxide equivalent per thousand RFHR
2013
All facilities either owned or under operational control were included.
The company leases approximately 18 office/warehouse facilities that are under operational control and included in emissions but are not recognized on its balance sheet.
UK Government's GHG Conversion Factors for Company Reporting
The GHG Protocol Corporate Accounting and Reporting Standard (revised edition) and ISO 14064-1 (2006)
Materiality was set at group level at 5%, with all facilities estimated to contribute >1% of total emissions included.
Emissions per rig fleet horsepower rating (RFHR)
Greenhouse Gas Emissions Statement (1)
Protection of the environment is one of Rowan's core values. Rowan has reported all material emissions from owned and operatedassets for which the company has operational control. An organization has operational control if it has full authority to introduceand implement its operating policies in its business. Rowan has determined that approximately 99% of its total emissions areattributable to combustion of diesel fuel used in its offshore drilling operations, which comprises a fleet of 28 active offshore jack-up drilling rigs and three ultra-deepwater drillships. The company has an additional two rigs in its fleet which were idle throughoutthe reporting cycle. Rowan believes that the remaining 1% of its emissions is attributable to purchased electricity used for itsoffice/warehouse facilities in approximately 18 locations throughout the world; the company's passenger vehicle fleet; one company-owned plane and fugitive refrigerants. Rowan has excluded emissions from these last three sources due to immateriality.
On occasion, offshore drilling operations involves the flaring of natural gas. Flaring of natural gas is under the authority and controlof the operator of the oil and gas property (i.e., the client) and therefore has not been reported by Rowan under the operationalcontrol consolidation approach.
In the table below, Scope 1 emissions are direct emissions from assets controlled by the reporting organization. Scope 2 emissionsare direct emissions from assets controlled by other organizations that are purchased by the reporting organization and includepurchased electricity, heat, steam or cooling to the extent such emissions are material. Fugitive emissions attributable to flaringhave not been included within the scope of the data under the operational control approach utilized.
(4) The sum of S c ope 1 a nd S c ope 2 e miss ions do not to ta l due to rounding.
Greenhouse Gas Emission SourceCombustion of fuel and operation of facilities (Scope 1)
Fuel combustion - Rig fleet
Electricity, heat, steam and cooling purchased for own use (Scope 2)
Purchased electricity
The reporting period used for this information is 1 January 2014 through 31 December 2014.
Operational control.
(1) S ta tu tory c a rbon re porting disc losure s re quire d by Compa nie s Ac t 2006 (S tra te gic Re port a nd Dire c tors ' Re ports ) Re gula tions 2013
(2) In some c a se s we ha ve e xtra pola te d da ta to c a lc ula te tota l e miss ions . This ha s be e n done by e ithe r us ing a va ila ble informa tion from pa rtof the re porting pe riod a nd e xte nding it to c ove r the whole re porting pe riod or by using a va ila ble informa tion from subs ta ntia lly a ll of theope ra tions a nd e xte nding it to c ove r those ope ra tions for whic h we ha d no or inc omple te da ta .
(3) Tonne s of c a rbon dioxide e quiva le nt (tCO2e ) is the princ ip le me a sure me nt unit for gre e nhouse ga s e miss ions a s it provide s a s ingle unit
tha t c ombine s the impa c t of e a c h of the s ix re gula te d gre e nhouse ga se s .
2014

Rowan Companies plc Annual Report and Financial Statements
31 December 2014
22
Dividends No dividends were declared in 2013. On April 25, 2014, the Board of Directors approved a quarterly cash dividend of $0.10 per share, paid on May 20, 2014, to shareholders of record at the close of business on May 5, 2014. On July 31, 2014, the Board of Directors approved a quarterly cash dividend of $0.10 per share, paid on August 26, 2014, to shareholders of record at the close of business on August 11, 2014. On October 30, 2014, the Board of Directors approved a quarterly cash dividend of $0.10 per share, paid on November 25, 2014, to shareholders of record at the close of business on November 11, 2014. On January 29, 2015, the Board of Directors approved a quarterly cash dividend of $0.10 per share paid on March 3, 2015, to shareholders of record at the close of business on February 9, 2015. Qualifying indemnity provisions The indemnification agreements with Rowan Companies, Inc. (RCI) in favour of those directors and officers of the company who held such positions at the time of the redomestication on May 4, 2012 remain in place. These agreements provide for RCI to, among other things, indemnify the individual against certain liabilities that may arise by reason of his or her status or service as a director or officer, to advance expenses incurred as a result of certain proceedings and to cover him or her under our directors’ and officers’ liability insurance policy. These agreements are intended to provide indemnification rights to the fullest extent permitted under U.K. and Delaware law and under our governing documents and those of RCI. In addition, the company has made qualifying third-party indemnity provisions for the benefit of its directors in respect of liabilities incurred as a result of their office, to the extent permitted by law. Further details can be found at page 44 of the proxy statement. Going concern basis The group’s business activities, together with the factors likely to affect its future development, performance and position, are set out in the Strategic Report beginning on page 2. The directors have considered the use of the going concern basis in the preparation of the financial statements of the company and the group in light of the current market conditions and conclude that the use of the going concern basis is appropriate. In coming to their conclusion, the directors have considered the financial position and cash requirements of the company and the group for the period of 12 months from the date of signing of these financial statements.
The directors have a reasonable expectation that the company and the group have adequate resources to continue in operational existence for the foreseeable future. Thus, the directors continue to adopt the going concern basis of accounting in preparing the annual financial statements.
Directors The following persons were directors of the company during the year ended 31 December 2014 and up to the date of this report, except as noted:
H.E. Lentz (Chairman) (retired 25 April 2014) Thomas P. Burke (appointed 25 April 2014) William T. Fox III Sir Graham Hearne Thomas R. Hix W. Matt Ralls (appointed Executive Chairman 25 April 2014) Lord Colin Moynihan Suzanne P. Nimocks P. Dexter Peacock John J. Quicke Tore I. Sandvold
Details of the directors' remuneration and their interests in the shares of the company are set out in Annex A, U.K. Statutory Directors’ Remuneration Report (Part II) and in the Compensation Discussion and Analysis section of the 2015 Proxy Statement.
Rowan Companies plc Annual Report and Financial Statements
31 December 2014
23
Disclosure of information to the auditor The directors who held office at the date of approval of this directors’ report confirm that, so far as they are each aware, there is no relevant audit information of which the company’s auditor is unaware; and each director has taken all the steps that they ought to have taken as a director to make themselves aware of any relevant audit information and to establish that the company’s auditor is aware of that information. Re-appointment of the auditor In accordance with Section 489 of the U.K. Companies Act 2006, a resolution for the re-appointment of Deloitte LLP as statutory auditor of the company will be proposed at the forthcoming annual general meeting. By order of the Board of Directors /s/ Thomas P. Burke Thomas P. Burke Chief Executive Officer and Director 13 March 2015

Rowan Companies plc Annual Report and Financial Statements
31 December 2014
24
PARENT COMPANY FINANCIAL STATEMENTS
Page Statement of Directors’ Responsibilities 25 Independent Auditor’s Report to the Members of Rowan Companies plc 26 Parent Company Balance Sheet 28 Parent Company Statement of Changes in Equity 29 Parent Company Cash Flow Statement 30 Notes to the Parent Company Financial Statements 31

Rowan Companies plc Annual Report and Financial Statements
31 December 2014
25
STATEMENT OF DIRECTORS’ RESPONSIBILITIES The directors are responsible for preparing the annual report and the financial statements in accordance with applicable law and regulations. U.K. company law requires the directors to prepare financial statements for each financial year. Under that law, the directors have elected to prepare the group financial statements in accordance with accounting principles generally accepted in the United States of America (US GAAP) and the parent company financial statements in accordance with International Financial Reporting Standards (IFRSs) as adopted by the European Union. The consolidated and parent company financial statements are also required by law to be properly prepared in accordance with the Companies Act 2006. Under U.K. company law, the directors must not approve the accounts unless they are satisfied that they give a true and fair view of the state of affairs of the company and of the profit or loss of the company for that period. The directors are responsible for keeping adequate accounting records that disclose with reasonable accuracy at any time the financial position of the company and to enable them to ensure that the financial statements comply with the Companies Act 2006. They are also responsible for safeguarding the assets of the company and hence for taking reasonable steps for the prevention and detection of fraud and other irregularities. The directors are responsible for the maintenance and integrity of the corporate and financial information included on the company’s website. Legislation in the United Kingdom governing the preparation and dissemination of financial statements may differ from legislation in other jurisdictions.

Rowan Companies plc Annual Report and Financial Statements
31 December 2014
26
INDEPENDENT AUDITOR’S REPORT TO THE MEMBERS OF ROWAN COMPANIES PLC We have audited the financial statements of Rowan Companies plc for the year ended 31 December 2014 which comprise the Consolidated and Parent Company Balance Sheets, the Consolidated Statement of Income, the Consolidated Statement of Comprehensive Income, the Consolidated Statement of Changes in Shareholders’ Equity, the Parent Company Statement of Changes in Equity, the Consolidated Statement of Cash Flows, the Parent Company Cash Flow Statement and the related notes. The consolidated financial statements to which this opinion refers are on pages 45 to 82 of the Form 10-K. The financial reporting framework that has been applied in the preparation of the consolidated financial statements is applicable law and accounting principles generally accepted in the United States of America. The financial reporting framework that has been applied in the preparation of the parent company financial statements is applicable law and International Financial Reporting Standards (IFRSs) as adopted by the European Union, as applied in accordance with the provisions of the Companies Act.
This report is made solely to the company’s members, as a body, in accordance with Chapter 3 of Part 16 of the Companies Act 2006. Our audit work has been undertaken so that we might state to the company’s members those matters we are required to state to them in an auditor’s report and for no other purpose. To the fullest extent permitted by law, we do not accept or assume responsibility to anyone other than the company and the company’s members as a body, for our audit work, for this report, or for the opinions we have formed. Respective responsibilities of directors and auditor As explained more fully in the Directors’ Responsibilities Statement, the directors are responsible for the preparation of the financial statements and for being satisfied that they give a true and fair view. Our responsibility is to audit and express an opinion on the financial statements in accordance with applicable law and International Standards on Auditing (UK and Ireland). Those standards require us to comply with the Auditing Practices Board’s Ethical Standards for Auditors. Scope of the audit of financial statements An audit involves obtaining evidence about the amounts and disclosures in the financial statements sufficient to give reasonable assurance that the financial statements are free from material misstatement, whether caused by fraud or error. This includes an assessment of: whether the accounting policies are appropriate to the group’s and the parent company’s circumstances and have been consistently applied and adequately disclosed; the reasonableness of significant accounting estimates made by the directors; and the overall presentation of the financial statements. In addition, we read all the financial and non-financial information in the annual report to identify material inconsistencies with the audited financial statements and to identify any information that is apparently materially incorrect based on, or materially inconsistent with, the knowledge acquired by us in the course of performing the audit. If we become aware of any apparent material misstatements or inconsistencies we consider the implications for our report.
Opinion on financial statements
In our opinion:
the financial statements give a true and fair view of the state of the group’s and of the parent company's affairs as at 31 December 2014 and of the group’s loss for the year then ended;
the group financial statements have been properly prepared in conformity with accounting principles generally accepted in the United States of America;
the parent company financial statements have been properly prepared in accordance with IFRSs as adopted by the European Union and as applied in accordance with the provisions of the Companies Act 2006; and
the financial statements have been prepared in accordance with the requirements of the Companies Act 2006.

Rowan Companies plc Annual Report and Financial Statements
31 December 2014
27
Opinion on other matters prescribed by the Companies Act 2006
In our opinion:
the part of the Directors’ Remuneration Report to be audited, as shown on pages A-6 through A-9 of the U.K. Statutory Directors’ Remuneration Report (Part II) section of the Proxy Statement, has been properly prepared in accordance with the Companies Act 2006;
the information given in the Strategic Report and the Directors’ Report for the financial year for which the financial statements are prepared is consistent with the financial statements.
Matters on which we are required to report by exception
We have nothing to report in respect of the following matters where the Companies Act 2006 requires us to report to you if, in our opinion:
adequate accounting records have not been kept by the parent company, or returns adequate for our audit have not been received from branches not visited by us; or
the parent company financial statements and the part of the Directors’ Remuneration Report to be audited are not in agreement with the accounting records and returns; or
certain disclosures of directors’ remuneration specified by law are not made; or
we have not received all the information and explanations we require for our audit.
/s/ David Paterson
David Paterson (Senior statutory auditor) for and on behalf of Deloitte LLP Chartered Accountants and Statutory Auditor London, UK
13 March 2015
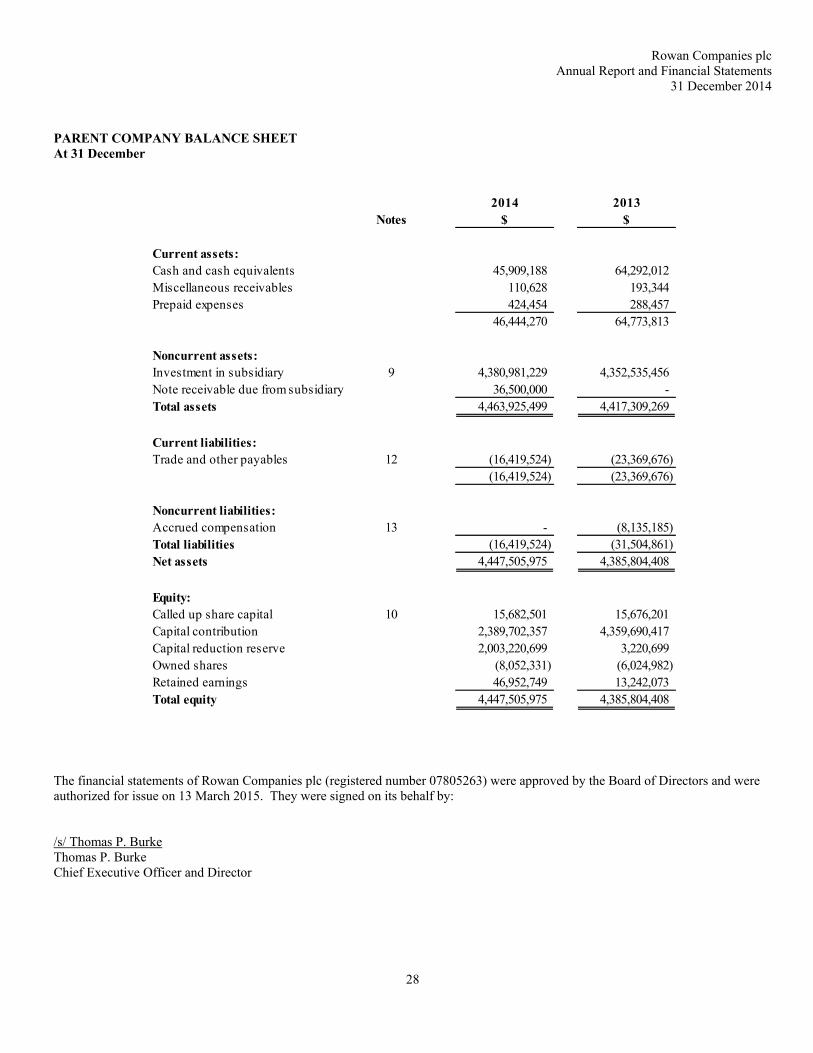
Rowan Companies plc Annual Report and Financial Statements
31 December 2014
28
PARENT COMPANY BALANCE SHEET At 31 December
2014 2013Notes $ $
Current assets:Cash and cash equivalents 45,909,188 64,292,012 Miscellaneous receivables 110,628 193,344 Prepaid expenses 424,454 288,457
46,444,270 64,773,813
Noncurrent assets:Investment in subsidiary 9 4,380,981,229 4,352,535,456 Note receivable due from subsidiary 36,500,000 - Total assets 4,463,925,499 4,417,309,269
Current liabilities:Trade and other payables 12 (16,419,524) (23,369,676)
(16,419,524) (23,369,676)
Noncurrent liabilities:Accrued compensation 13 - (8,135,185) Total liabilities (16,419,524) (31,504,861) Net assets 4,447,505,975 4,385,804,408
Equity:Called up share capital 10 15,682,501 15,676,201 Capital contribution 2,389,702,357 4,359,690,417 Capital reduction reserve 2,003,220,699 3,220,699 Owned shares (8,052,331) (6,024,982) Retained earnings 46,952,749 13,242,073 Total equity 4,447,505,975 4,385,804,408
The financial statements of Rowan Companies plc (registered number 07805263) were approved by the Board of Directors and were authorized for issue on 13 March 2015. They were signed on its behalf by: /s/ Thomas P. Burke Thomas P. Burke Chief Executive Officer and Director
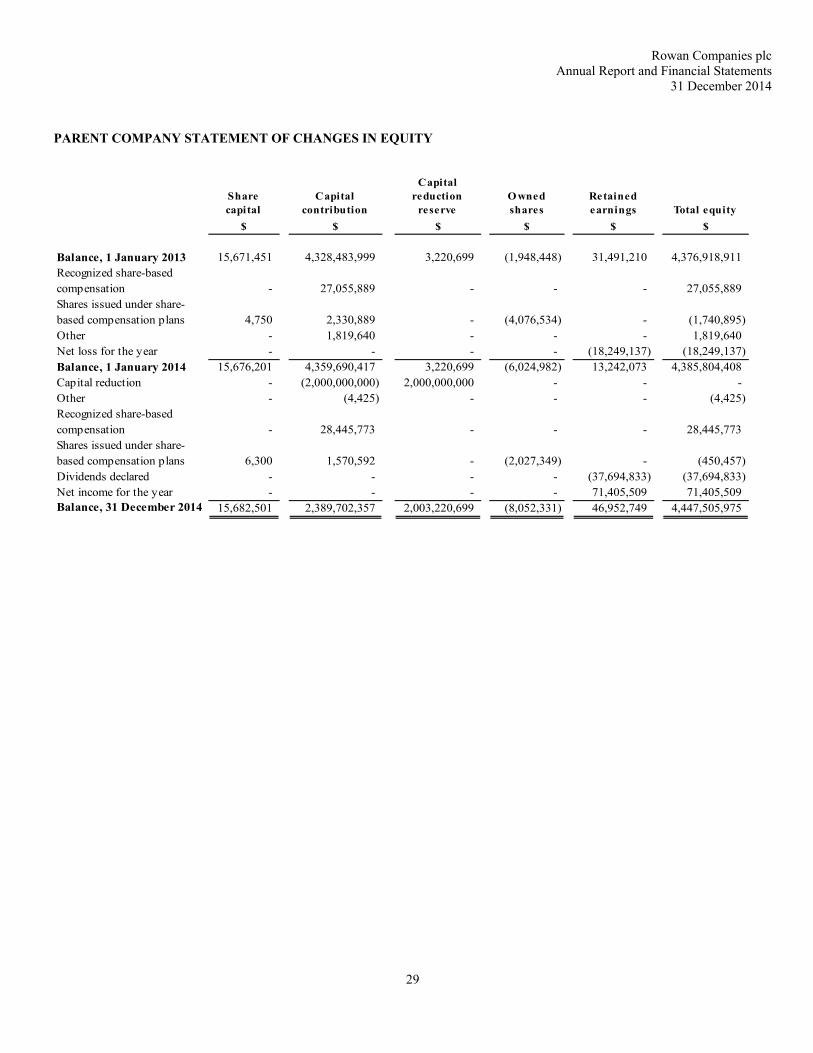
Rowan Companies plc Annual Report and Financial Statements
31 December 2014
29
PARENT COMPANY STATEMENT OF CHANGES IN EQUITY
Share capital
Capital contribution
Capital reduction
reserveO wned shares
Retained earnings Total equity
$ $ $ $ $ $
Balance, 1 January 2013 15,671,451 4,328,483,999 3,220,699 (1,948,448) 31,491,210 4,376,918,911 Recognized share-based compensation - 27,055,889 - - - 27,055,889 Shares issued under share-based compensation plans 4,750 2,330,889 - (4,076,534) - (1,740,895) Other - 1,819,640 - - - 1,819,640 Net loss for the year - - - - (18,249,137) (18,249,137) Balance, 1 January 2014 15,676,201 4,359,690,417 3,220,699 (6,024,982) 13,242,073 4,385,804,408 Capital reduction - (2,000,000,000) 2,000,000,000 - - - Other - (4,425) - - - (4,425) Recognized share-based compensation - 28,445,773 - - - 28,445,773 Shares issued under share-based compensation plans 6,300 1,570,592 - (2,027,349) - (450,457) Dividends declared - - - - (37,694,833) (37,694,833) Net income for the year - - - - 71,405,509 71,405,509 Balance, 31 December 2014 15,682,501 2,389,702,357 2,003,220,699 (8,052,331) 46,952,749 4,447,505,975

Rowan Companies plc Annual Report and Financial Statements
31 December 2014
30
PARENT COMPANY CASH FLOW STATEMENT
Notes 2014 2013$ $
Net cash (outflow) inflow from operating activities 16 (19,496,420) 5,553,804
Investing activitiesDividend income received 75,000,000 - Investment in and advances to subsidiaries (36,500,000) (100,000) Interest income received 312,854 209,590
Net cash from investing activities 38,812,854 109,590
Financing activitiesDividends paid 11 (37,694,833) - Other (4,425) -
Net cash used in financing activities (37,699,258) -
Net (decrease) increase in cash and cash equivalents (18,382,824) 5,663,394
Cash and cash equivalents at beginning of period 64,292,012 58,628,618
Cash and cash equivalents at end of period 45,909,188 64,292,012

Rowan Companies plc Annual Report and Financial Statements
31 December 2014
31
NOTES TO PARENT COMPANY FINANCIAL STATEMENTS 1. General information
Rowan Companies plc (the “company”) is a public limited company incorporated in the United Kingdom under the Companies Act and listed on the New York Stock Exchange. Effective May 4, 2012, the company became the successor issuer to Rowan Companies, Inc. (RCI) pursuant to an agreement and plan of merger and reorganization (the “redomestication”) approved by the stockholders of RCI on April 16, 2012. As a result of the redomestication, RCI became an indirect subsidiary of the company, and the company became a public limited company and the parent of the group of companies previously headed by RCI. The address of the registered office is c/o CMS Cameron McKenna, Mitre House, 160 Aldersgate Street, London, United Kingdom, EC1A4DD.
The company is the parent of a group of companies that provide offshore oil and gas contract drilling services internationally utilizing a fleet of 30 self-elevating mobile offshore “jack-up” drilling units (including two that were inactive or “stacked” for all of the year and one that became stacked in February 2015), three ultra-deepwater drillships and one ultra-deepwater drillship under construction. The company has no operating or significant assets other than its investments in its consolidated subsidiaries.
The group conducts offshore drilling operations in various markets throughout the world including the U.K. and Norwegian sectors of the North Sea, Middle East, United States Gulf of Mexico (US GOM), Southeast Asia, West and North Africa, and Trinidad. These financial statements are presented in United States dollars because that is the currency of the primary economic environment in which the company operates. The company registration number is 07805263.
2. Adoption of new and revised standards
At the date of authorisation of these financial statements, the following relevant Standards and Interpretations that have not been applied in these financial statements were in issue but not yet effective.
Effective date Date applicable to the company
IFRS 9 ‘Financial Instruments’** 1 January 2018 1 January 2018Defined Benefit Plans: Employee Contributions (Amendments to IAS 19)* 1 July 2014 1 January 2015Amendments to IFRSs ‘Annual Improvements to IFRSs 2010-2012 Cycle’* 1 July 2014 1 January 2015Amendments to IFRSs ‘Annual Improvements to IFRSs 2011-2013 Cycle’* 1 July 2014 1 January 2015IFRIC 21 Levies ** 17 June 2014 1 January 2015IFRS 15 Revenue from Contracts with Customers** 1 January 2017 1 January 2017Accounting for Acquisitions of Interests in Joint Operations (Amendments to IFRS 11)** 1 January 2016 1 January 2016Clarification of Acceptable Methods of Depreciation and Amortisation (Amendments to IAS 16 and IAS 36)**
1 January 2016 1 January 2016
Equity method in Separate Financial Statements (Amendments to IAS 27)** 1 January 2016 1 January 2016Sale or Contribution of Assets between an Investor and its Associate or Joint Venture (Amendments to IFRS 10 and IAS 28)**
1 January 2016 1 January 2016
Annual Improvements 2012-2014 Cycle** 1 July 2016 1 January 2017Disclosure Initiative (Amendments to IAS1)** 1 January 2016 1 January 2016Investment Entities: Applying the Consolidation Exception** 1 January 2016 1 January 2016* These standards were endorsed for use by the European Union from 1 July 2014.
**These standards, amendments or interpretations have not been endorsed for use by the European Union at the date of this report and as a result the date applicable to the Company may change.

Rowan Companies plc Annual Report and Financial Statements
31 December 2014
32
The directors do not expect that the adoption of the standards listed above will have a material impact on the financial statements of Rowan Companies plc in future periods.
3. Significant Accounting policies
The consolidated financial statements are prepared in conformity with accounting principles generally accepted in the United States of America (US GAAP). The accounting policies applied in the consolidated financial statements are disclosed in Note 2 to the consolidated financial statements in the Form 10-K. The directors consider that the group accounting policy in respect of discontinued operations, under which their results are shown as a one-line item on the face of the consolidated statement of income but which represents a departure from the more detailed analysis required on the face of the income statement under the statutory accounting rules, is necessary to provide a true and fair view as required under ASC 205-20 Presentation of Financial Statements - Discontinued Operations. As permitted by the Companies Act 2006, the consolidated balance sheet and statement of income formats have been adapted to comply with US GAAP. The separate financial statements of the company are presented as required by the Companies Act 2006. As permitted by that Act, the separate financial statements have been prepared in accordance with International Financial Reporting Standards adopted by the European Union and IFRIC interpretations and have been prepared in accordance with the historical cost convention. The principal accounting policies applied in preparation of the parent company financial statements are set out below. These policies have been consistently applied unless otherwise stated.
Going concern
The directors have considered the use of the going concern basis in the preparation of the financial statements in light of current market conditions and have concluded that the use of the going concern basis is appropriate. In coming to their conclusion, the directors have considered the financial position and cash requirements of the company for the period of 12 months from the date of signing of the financial statements. Further details are provided in the “going concern basis” section of the directors’ report.
The directors have a reasonable expectation that the company has adequate resources to continue in operational existence for the foreseeable future. Thus the directors continue to adopt the going concern basis in preparing the annual financial statements.
Investments
The company records its investments in subsidiary undertakings at cost, subject to any provision for impairment. For these purposes, the cost on initial recognition is the fair value of the subsidiary undertaking on the date of acquisition (see note 10).
Share-based payments
Equity-settled share-based payments to employees and others providing similar services are measured at the fair value of the equity instruments at the grant date. The fair value excludes the effect of non-market-based vesting conditions.
The fair value determined at the grant date of the equity-settled share-based payments is recognized in the financial statements on a straight-line basis over the vesting period, based on the group’s estimate of equity instruments that will eventually vest. At each balance sheet date, the group revises its estimate of the number of equity instruments expected to vest as a result of the effect of non-market-based vesting conditions. The impact of the revision of the original estimates, if any, is recognised in profit or loss such that the cumulative expense reflects the revised estimate, with a corresponding adjustment to equity reserves.
Share-based awards granted to nonemployee directors may be settled in cash or shares at the discretion of the Compensation Committee determined at the settlement date. The Company accounts for such awards under the liability method of accounting. Compensation is recognized over the service period initially based on the market price of the underlying shares on the grant date and is adjusted for changes in market value through the settlement date.
Share-based compensation for employees of the Company’s subsidiaries is recognised as an investment in the subsidiary, unless this expense is recharged.
Rowan Companies plc Annual Report and Financial Statements
31 December 2014
33
3. Significant Accounting policies (continued)
Trade payables
Payables are recognised initially at fair value and subsequently stated at amortised cost. The difference between the proceeds and the amount payable is recognised over the year of the payable using the effective interest method. There is no difference in the year between fair value and amortised costs.
Foreign currencies
The individual financial statements are presented in United States dollars. The U.S. dollar is the currency of the primary economic environment and the functional currency of the company. Transactions in currencies other than the U.S. dollar are recorded at the average exchange rates for the month, unless the exchange rate on the transaction date varies significantly from the average rate, in which case the rate at the transaction date is used. Assets and liabilities denominated in currencies other than the U.S. dollar are remeasured in U.S. dollars at the exchange rates prevailing on the balance sheet date. Exchange differences are recognised in profit or loss in the period in which they arise.
4. Critical accounting judgements and key sources of estimation uncertainty
In the application of the company’s accounting policies, which are described in note 3, the directors are required to make judgements, estimates and assumptions about the carrying amounts of assets and liabilities that are not readily apparent from other sources. The estimates and associated assumptions are based on historical experience and other factors that are considered to be relevant. Actual results may differ from these estimates.
The estimates and underlying assumptions are reviewed on an ongoing basis. Revisions to accounting estimates are recognised in the period in which the estimate is revised if the revision affects only that period or in the period of the revision and future periods if the revision affects both current and future periods.
Key sources of estimation uncertainty
The key assumptions concerning the future, and other key sources of estimation uncertainty at the balance sheet date, that have a significant risk of causing a material adjustment to the carrying amounts of assets and liabilities within the next financial year, involve the recoverability of the company’s investment in subsidiary.
We evaluate the carrying value of our investment in subsidiaries whenever events or changes in circumstances indicate that their carrying values may not be recoverable. Impairment evaluations are, by nature, highly subjective. In most instances, they involve expectations of future cash flows to be generated by the group’s offshore drilling rigs underlying the value of the company’s investments in subsidiaries and are based on management's judgments and assumptions regarding future industry conditions and operations, as well as management's estimates of an appropriate discount rate together with future expected utilization, contract rates, expense levels and capital requirements of our drilling rigs. The estimates, judgments and assumptions used by management in the application of our impairment policies reflect both historical experience and an assessment of current operational, industry, market, economic and political environments. The use of different estimates, judgments, assumptions and expectations regarding future industry conditions and operations would likely result in materially different asset carrying values and operating results. During the year, management considered the recoverability of its investment in its subsidiary and believes that the carrying value of $4.381 billion is recoverable.

Rowan Companies plc Annual Report and Financial Statements
31 December 2014
34
5. Net profit (loss) for the year
As permitted by section 408 of the Companies Act 2006, the company has elected not to present its own profit and loss account for the year. The company reported a net profit for the financial year ended 31 December 2014 of $71,405,509 (2013: loss of $18,249,137). Profit for 2014 includes dividend income of $75,000,000 (2013: nil).
6. Share-based payments
As a result of the redomestication process the existing share-based compensation schemes were transferred to the company from the date that it became the head of the Rowan group of companies. Effective 1 January 2013, a liability in the amount of $5,773,065 was assumed by the company upon transfer. The net profit for 2014 included a net credit of $1,144,356 for share based compensation (2013: a net charge of $3,164,838). The net credit for 2014 was the result of fair market value adjustments to the liability for share based compensation.
During 2014, liability awards were settled totalling $1,164,280. Further details on the various schemes in place are provided in Note 8 to the consolidated financial statements in the Form 10-K.
7. Staff numbers and costs
The average monthly number of employees (including executive directors) was:
2014 2013Number Number
Offshore 2,963 2,570 Onshore 833 762
3,796 3,332
Their aggregate remuneration comprised:
2014 2013$ $
Wages and salaries 398,864,808 339,351,566 Share-based compensation 35,690,779 30,776,236 Social security costs 36,540,110 25,324,054 Other pension and post-employment costs 46,403,172 45,823,224
517,498,869 441,275,080
8. Auditors’ remuneration
The analysis of auditor remuneration is as follows:
2014 2013$ $
Fees payable to the company's auditor for the audit of the company's annual accounts 20,000 20,000
The auditors’ remuneration for the group (both audit and non-audit fees) is disclosed on page 57 of the company’s proxy statement included in the annual report.

Rowan Companies plc Annual Report and Financial Statements
31 December 2014
35
9. Significant subsidiaries
The following were the company’s significant subsidiaries at 31 December 2014:
Company Name Place of Incorporation
Rowan No. 1 Limited United Kingdom
Atlantic Maritime Services LLC USA (Delaware)
Great White Shark Limited Gibraltar
RDC Arabia Drilling, Inc. Cayman Islands
RDC Qatar, Inc. USA (Delaware)
Ralph Coffman Luxembourg S.a.r.l. Luxembourg
Rowan Companies, Inc. USA (Delaware)
Rowan Deepwater Drilling (Gibraltar) Limited Gibraltar
Rowan Drilling (Gibraltar) Limited Gibraltar
Rowan Drilling (Trinidad) Limited Cayman Islands
Rowan Drilling (U.K.) Limited Scotland
Rowan Gorilla V (Gibraltar) Limited Gibraltar
Rowan Gorilla VII (Gibraltar) Limited Gibraltar
Rowan N-Class (Gibraltar) Limited Gibraltar
Rowan Norway Limited Gibraltar
Rowan Offshore (Gibraltar) Limited Gibraltar
All subsidiaries are (i) holding companies, (ii) owners or operators of offshore drilling equipment, or (iii) subsidiaries that otherwise support the company’s offshore drilling operations, and are generally 100% held.
The movement in the company’s investment during the year was as follows: $
Balance, 1 January 2014 4,352,535,456 Capital contribution - share-based compensation charged to subsidiary undertakings 28,445,773 Balance, 31 December 2014 4,380,981,229
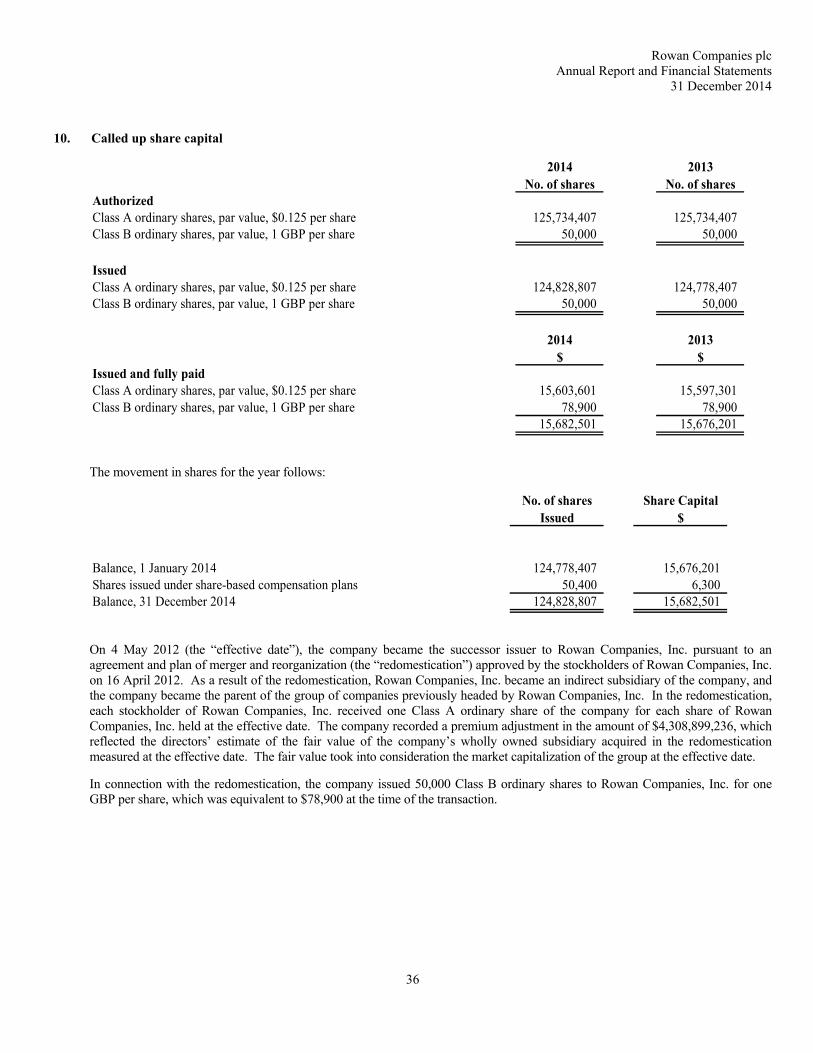
Rowan Companies plc Annual Report and Financial Statements
31 December 2014
36
10. Called up share capital
2014 2013No. of shares No. of shares
AuthorizedClass A ordinary shares, par value, $0.125 per share 125,734,407 125,734,407 Class B ordinary shares, par value, 1 GBP per share 50,000 50,000
IssuedClass A ordinary shares, par value, $0.125 per share 124,828,807 124,778,407 Class B ordinary shares, par value, 1 GBP per share 50,000 50,000
2014 2013$ $
Issued and fully paidClass A ordinary shares, par value, $0.125 per share 15,603,601 15,597,301 Class B ordinary shares, par value, 1 GBP per share 78,900 78,900
15,682,501 15,676,201
The movement in shares for the year follows:
No. of shares Share CapitalIssued $
Balance, 1 January 2014 124,778,407 15,676,201 Shares issued under share-based compensation plans 50,400 6,300 Balance, 31 December 2014 124,828,807 15,682,501
On 4 May 2012 (the “effective date”), the company became the successor issuer to Rowan Companies, Inc. pursuant to an agreement and plan of merger and reorganization (the “redomestication”) approved by the stockholders of Rowan Companies, Inc. on 16 April 2012. As a result of the redomestication, Rowan Companies, Inc. became an indirect subsidiary of the company, and the company became the parent of the group of companies previously headed by Rowan Companies, Inc. In the redomestication, each stockholder of Rowan Companies, Inc. received one Class A ordinary share of the company for each share of Rowan Companies, Inc. held at the effective date. The company recorded a premium adjustment in the amount of $4,308,899,236, which reflected the directors’ estimate of the fair value of the company’s wholly owned subsidiary acquired in the redomestication measured at the effective date. The fair value took into consideration the market capitalization of the group at the effective date.
In connection with the redomestication, the company issued 50,000 Class B ordinary shares to Rowan Companies, Inc. for one GBP per share, which was equivalent to $78,900 at the time of the transaction.
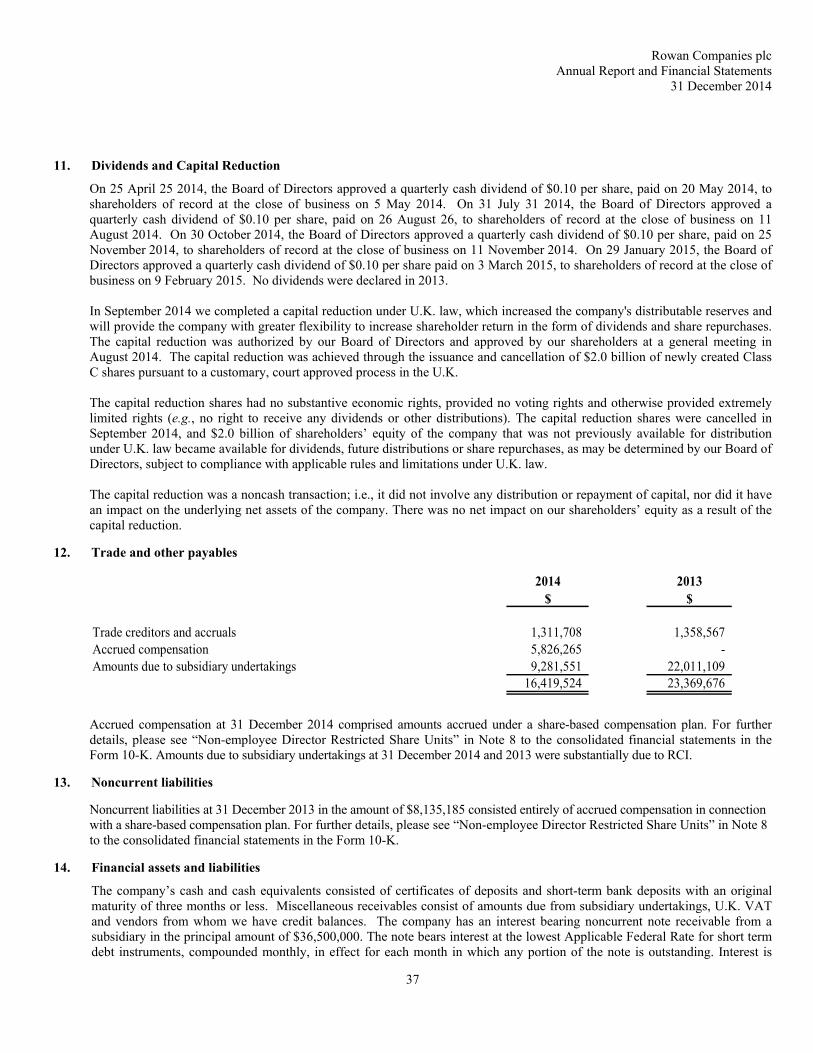
Rowan Companies plc Annual Report and Financial Statements
31 December 2014
37
11. Dividends and Capital Reduction
On 25 April 25 2014, the Board of Directors approved a quarterly cash dividend of $0.10 per share, paid on 20 May 2014, to shareholders of record at the close of business on 5 May 2014. On 31 July 31 2014, the Board of Directors approved a quarterly cash dividend of $0.10 per share, paid on 26 August 26, to shareholders of record at the close of business on 11 August 2014. On 30 October 2014, the Board of Directors approved a quarterly cash dividend of $0.10 per share, paid on 25 November 2014, to shareholders of record at the close of business on 11 November 2014. On 29 January 2015, the Board of Directors approved a quarterly cash dividend of $0.10 per share paid on 3 March 2015, to shareholders of record at the close of business on 9 February 2015. No dividends were declared in 2013. In September 2014 we completed a capital reduction under U.K. law, which increased the company's distributable reserves and will provide the company with greater flexibility to increase shareholder return in the form of dividends and share repurchases. The capital reduction was authorized by our Board of Directors and approved by our shareholders at a general meeting in August 2014. The capital reduction was achieved through the issuance and cancellation of $2.0 billion of newly created Class C shares pursuant to a customary, court approved process in the U.K.
The capital reduction shares had no substantive economic rights, provided no voting rights and otherwise provided extremely limited rights (e.g., no right to receive any dividends or other distributions). The capital reduction shares were cancelled in September 2014, and $2.0 billion of shareholders’ equity of the company that was not previously available for distribution under U.K. law became available for dividends, future distributions or share repurchases, as may be determined by our Board of Directors, subject to compliance with applicable rules and limitations under U.K. law. The capital reduction was a noncash transaction; i.e., it did not involve any distribution or repayment of capital, nor did it have an impact on the underlying net assets of the company. There was no net impact on our shareholders’ equity as a result of the capital reduction.
12. Trade and other payables
2014 2013$ $
Trade creditors and accruals 1,311,708 1,358,567 Accrued compensation 5,826,265 - Amounts due to subsidiary undertakings 9,281,551 22,011,109
16,419,524 23,369,676
Accrued compensation at 31 December 2014 comprised amounts accrued under a share-based compensation plan. For further details, please see “Non-employee Director Restricted Share Units” in Note 8 to the consolidated financial statements in the Form 10-K. Amounts due to subsidiary undertakings at 31 December 2014 and 2013 were substantially due to RCI.
13. Noncurrent liabilities
Noncurrent liabilities at 31 December 2013 in the amount of $8,135,185 consisted entirely of accrued compensation in connection with a share-based compensation plan. For further details, please see “Non-employee Director Restricted Share Units” in Note 8 to the consolidated financial statements in the Form 10-K.
14. Financial assets and liabilities
The company’s cash and cash equivalents consisted of certificates of deposits and short-term bank deposits with an original maturity of three months or less. Miscellaneous receivables consist of amounts due from subsidiary undertakings, U.K. VAT and vendors from whom we have credit balances. The company has an interest bearing noncurrent note receivable from a subsidiary in the principal amount of $36,500,000. The note bears interest at the lowest Applicable Federal Rate for short term debt instruments, compounded monthly, in effect for each month in which any portion of the note is outstanding. Interest is

Rowan Companies plc Annual Report and Financial Statements
31 December 2014
38
paid quarterly. The note is due October 16, 2017. Financial liabilities consist of trade creditors and amounts due to subsidiary undertakings carried at amortized cost. The directors consider that the carrying amounts of financial assets and financial liabilities recorded at amortised cost in the financial statements approximate their fair values.
Liquidity and interest risk
The company’s receivables and payables due within one year are non-interest bearing.
The risk management policies employed by the company to manage these risks are discussed below. The primary objective of the financial instrument risk management function is to establish risk limits, and then ensure that exposure to risks stay within these limits.
Credit risk
Credit risk refers to the risk that a counterparty will default on its contractual obligations resulting in financial loss to the company. The company does not have significant exposure to credit risk as it does not have any trade receivables, and only trades with its subsidiaries.
Market risk
The company’s activities expose it primarily to the financial risks of changes in foreign currency exchange rates. The company’s policy is to maintain natural hedges, where possible, by matching revenue and receipts with expenditures. During the year the company had limited exposure to Pounds Sterling (GBP). Due to the limited foreign currency exposure, management believes that movements in exchange rates would not have a material effect on the carrying values of assets and liabilities.
Capital risk management
The group manages its capital to ensure that the group will be able to continue as going concerns while maximising the return to shareholders through the optimisation of the debt and equity balance. The group’s overall strategy remains unchanged from 2013. The capital structure of the group consists of net debt, which includes the borrowings disclosed in Note 5 to the consolidated financial statements in the Form 10-K after deducting cash and cash equivalents, and equity attributable to equity holders of the parent, comprising issued capital, reserves and retained earnings. Restrictive provisions in the Company’s bank credit facility agreement limit consolidated debt to 60% of book capitalization.
15. Related party transactions
Other than the directors, who, (together with executive officers) represent the company’s key management personnel, the company has no paid employees. Executive officers are paid employees of RCI and provide services to the company. RCI provides support services to the company at cost plus a nominal fee as a percentage of cost. For 2014, such charges totalled $22,837,147 (2013: $17,235,549).
The company and RCI have entered into agreements providing for, among other things, the full, unconditional and irrevocable guarantee by the company of the prompt payment, when due, of any amount owed by RCI under its Senior Notes and revolving credit facility (see Note 15 to the consolidated financial statements in the Form 10-K). The company charges RCI a guarantee fee at an annual rate of 0.8% for 2014 (2013: 0.5%) of the outstanding balance of the Senior Notes and amounts outstanding under the revolving credit facility, if any. Such guarantee fee totalled $22,400,000 in 2014 (2013: $10,000,000). The company entered into a loan agreement with a subsidiary whereby the subsidiary issued a note payable to the company in the principal amount of $36,500,000. The note bears interest at the lowest Applicable Federal Rate for short term debt instruments, compounded monthly, in effect for each month in which any portion of the note is outstanding. Interest is paid quarterly. The note is due October 16, 2017.
Details of directors’ emoluments presented in accordance with Accounting Regulations Schedule 5 are provided on pages A-6 through A-9 of Annex A of the proxy statement.

Rowan Companies plc Annual Report and Financial Statements
31 December 2014
39
16. Reconciliation of operating loss to operating cash flows
2014 2013$ $
Operating (loss) income (3,594,491) (18,249,137) Change in working capital (15,901,929) 23,802,941
Net cash (outflow) inflow from operating activities (19,496,420) 5,553,804
All cash flows are generated from continuing operations.