roundabout capacity analysis based on conflict...
TRANSCRIPT

1
Roundabout Capacity Analysis Based on Conflict Technique
By Ning Wu1 and Werner Brilon
Abstract
The conventional way of capacity analysis is based on the critical gap method or on empirical regression or a combination of both. Influence of pedestrians is modeled by reduction factors with a rather questionable empirical background. Thus, the current methods are based on an incoherent mix of sophistications. Moreover, they do not account for the interaction between the different elements.
The paper presents a new model which treats the whole intersection as one entity. Here all the conflicts where different streams (vehicles and non-motorized road users) intersect within the roundabout are identified. Each conflict point is treated as one queuing system with a simplified queuing mechanism. This theory has already been used successfully for 4-way-stop (4WSC) and 2-way-stop (2WSC) intersections. However, the previous conflict theory is extended in order to cope with the actual priority behavior at roundabouts. In addition, these systems are interacting according to the theory of chains of queues where the distance (= storage area) between the conflict points becomes important.
The paper explains the sophistication of the model, presents the mathematical derivations of ready-to-use capacity equations plus parameter calibration by existing data, and demonstrates real-world application. The advantages of the technique are: all conflicts - both between vehicle streams and pedestrian conflicts at entries and exits - are treated by the same congruent methods. Also the interaction between consecutive arms of the roundabout is modeled. By the technique it becomes also possible to model limited priorities (e.g. for pedestrians at crosswalks or zebra crossings) for all conflict points. Finally the conflicts which are decisive for the performance of the whole intersection are identified. The methods can easily be implemented into relevant computer software.
Keywords:
Roundabout capacity, conflict technique, quality of flow
1Prof. Dr. Ning Wu ([email protected]) Prof. Dr. Werner Brilon ([email protected]) (corresponding author) Ruhr-University Bochum; D-44780 Bochum / Germany
1 Introduction
The capacity of roundabouts is a matter of intense scientific investigations in many countries since the implementation of modern roundabouts in the 1980ies. The remarkable aspect is that each country has attempted to find its own solution. Up to some degree this may be justified by different driver attitudes or divergent traffic rules. Finally the differences between solutions in the various countries, however, have become rather small and may be mainly based on limited sample sizes or differing methods for analysis.
What, however, is common to each of the classical approaches is the fact that each entry to a roundabout is treated like an isolated T-junction. Effects of mutual interaction between the various conflict points of the roundabouts remain disregarded.
As one theory-based solution the maximum throughput (= capacity C) of one entry into the roundabout is calculated by the theory of unsignalized intersections. The easy way would be to apply the Siegloch-formula (Siegloch, 1973):
036003600 t
q
f
C
et
C
(1)
with
C = capacity [veh/h] t0 = so-called zero-gap [s] = tc - tf / 2 tf = follow-up time [s] tc = critical gap [s] qC = traffic volume on the circular lane in front of the entry [veh/h]
A consequent application would require reliable estimates for tc and tf (cf. Brilon, 2016). The other problem of this formula is that it is derived under the assumption of Poisson-distributed traffic on the circular lane (i.e. no bunching) which is more unrealistic at roundabouts than it is at Two-Way-Stop-Control (TWSC) intersections. Also effects of priority reversal or typical influences of the degree of saturation on tc and tf cannot be described.
As a consequence most researchers favor the so-called “empirical regression” approach for roundabout capacity estimation. Here the real-world traffic at a roundabout entry is counted over periods of uninterrupted queuing on the entry during specific time intervals, e.g. 1 minute. In case of a steady queue on the entry lane the observed flow volume is the capacity. This can be plotted over the observed conflict volume qC on the circular lane. Result from this kind of empirical investigation is a cloud of points which shows that the capacity has a strong tendency to be reduced with increasing circular flow. Then a regression line is applied to represent these results.
The earliest attempt following this idea was the well-known British investigation by Kimber (1980). Here a linear regression equation for C as a function of qC was applied where the parameters of the equation were modified according to geometric features of the intersection. Linear equations were also applied elsewhere, e.g. Brilon, Bondzio, and Wu (1997). Other authors found nonlinearities within their empirical results. They used exponential regression functions. One such solution is to use tc and tf in eq. (1) as regression parameters (e.g. Brilon and Wu, 2008). Others (e.g. Rodegerds e.a., 2015) transformed this into a simple exponential function of the type
(2) CBqAeC
with 2

C = capacity [veh/h] A, B = regression parameters [-] qC = traffic volume on the circular lane in front of the entry [veh/h]
In this form the capacity formulas of the new HCM (2016) have become a standard for the US. Both forms of the regression analysis are equivalent.
The linear and the exponential regression approach for estimating the capacity at roundabouts are rather pragmatic. On one side it does not make use of theories for unsignalized intersections. On the other side one cannot be sure that these linear or exponential functions do also apply in areas of the C-qC-diagram where only few measurement points have been observed. Therefore, Wu (1997) proposed the following formula for the capacity of a single lane entry to a roundabout:
)(
3600exp
3600
36001 0
tq
t
qC C
f
C [veh/h] (3)
where
C = capacity of the entry [veh/h] qC = flow on circular lanes at the subject entry [veh/h] = minimum headway between vehicles on the circular lane [s]
Eq. (3) is the generalized form for the exponential and the linear capacity function. For example, this formula converges to an exponential function by = 0 and to a linear function by t0 = .
There are also reports which found an influence of the exiting traffic on the entry capacity like Bovy e.a. (1991) for single lane roundabouts in Switzerland, Wu (2006) for double lane roundabouts with single lane exists, or Schmotz (2014) for mini roundabouts which found its way into the German guideline HBS (2015).
On the entries there may be another type of conflict which requires capacity consideration. Besides the conflicting flow on the circular lane this is the pedestrian crossing where pedestrians may be prioritized over the entering motorized vehicles, e.g. by a zebra crossing. The capacity reducing effect of the pedestrian crossing on the entry capacity has been studied by Stuwe (1992). Her results, which were based on a rather limited sample size of German zebra crossings, have been implemented into the German guidelines HBS (2001 and 2015) and also into the HCM (2010 and 2016).
Also the exits from the roundabout can establish a bottleneck for vehicle traffic with limited capacity which can also be influenced by pedestrians crossing the exit. A solution to describe this capacity has been presented by Marlow, Maycock (1982) in conjunction with Griffith’s (1981) capacity formula for vehicular traffic traversing a zebra crossing. Even if the concept has been developed for junction entries it could also be applied for roundabout exits. Another more recent result for exit capacity at mini-roundabouts was presented by Schmotz (2014) – a solution which has the potential to be also applied for single-lane roundabouts.
Of course, the cited literature covers only a small extract from the large set of relevant publications within the international arena.
One commonality of all the results published up to now is that they treat specific conflicts at the roundabout with differing and incoherent methods and that they are not regarding any interaction between adjacent conflict areas. Under this aspect the solutions may be realistic as long as each element of the intersection is not operating near or above capacity. As soon as one of the conflict points is overloaded for a short period queues may be formed. Due to
3
limited storage spaces on the circular lane these queues are impeding other conflict points with the consequence of reduced capacities there. Thus, a short overload at one point can easily become the starting point for an overload of the whole intersection – even if the analysis for all the single conflicts still leads to a sufficient service quality. This kind of mutual interdependencies of different parts of the roundabout are not confined to the case of a complete overload. Instead they occur already at a moderate increase of traffic demand. Due to this aspect it is desirable to formulate algorithms which describe the capacity of the roundabout as a whole regarding capacities of the various conflicts as well as the influence of limited internal storage areas. This paper tries to point out a mathematical model which is capable to estimate the capacity of the roundabout as a whole. The model represents the various conflict points by a homogeneous set of models including also a stochastic approach to cope with the interlocking between subsequent bottlenecks within the intersection.
2 Methodology
2.1 Capacity of traffic streams with priority control
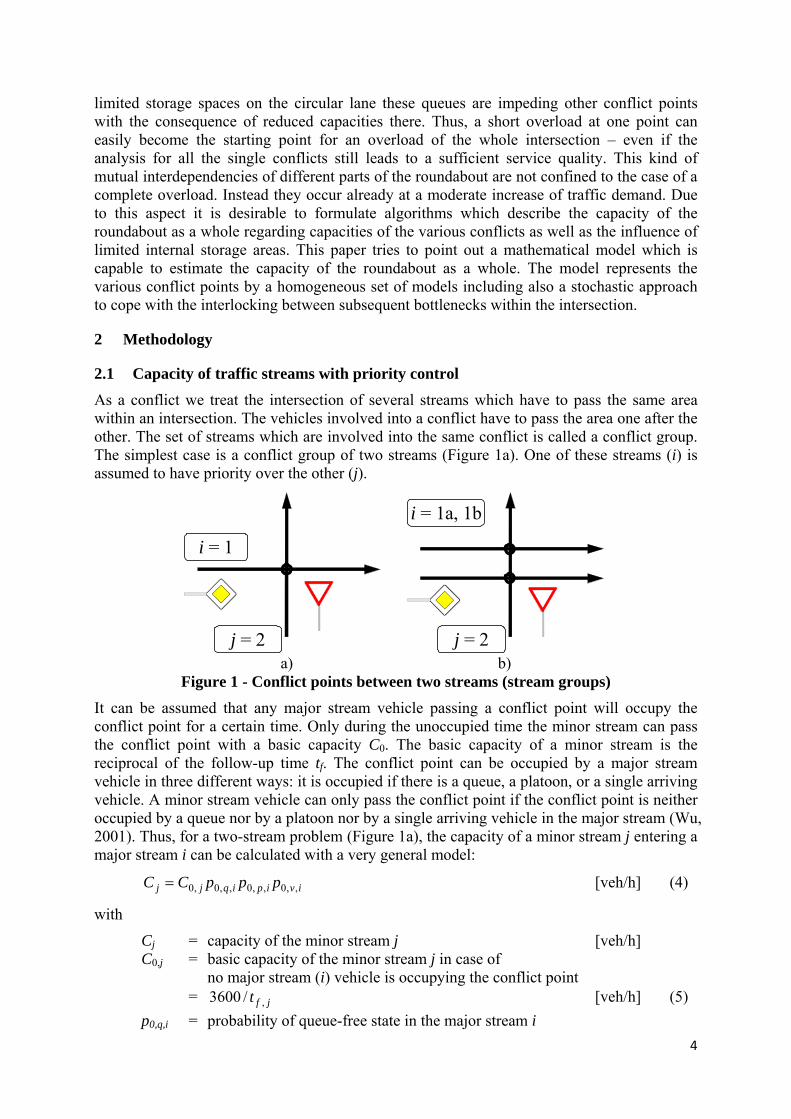
As a conflict we treat the intersection of several streams which have to pass the same area within an intersection. The vehicles involved into a conflict have to pass the area one after the other. The set of streams which are involved into the same conflict is called a conflict group. The simplest case is a conflict group of two streams (Figure 1a). One of these streams (i) is assumed to have priority over the other (j).
i = 1
j = 2
i = 1a, 1b
j = 2 a) b)
Figure 1 - Conflict points between two streams (stream groups)
It can be assumed that any major stream vehicle passing a conflict point will occupy the conflict point for a certain time. Only during the unoccupied time the minor stream can pass the conflict point with a basic capacity C0. The basic capacity of a minor stream is the reciprocal of the follow-up time tf. The conflict point can be occupied by a major stream vehicle in three different ways: it is occupied if there is a queue, a platoon, or a single arriving vehicle. A minor stream vehicle can only pass the conflict point if the conflict point is neither occupied by a queue nor by a platoon nor by a single arriving vehicle in the major stream (Wu, 2001). Thus, for a two-stream problem (Figure 1a), the capacity of a minor stream j entering a major stream i can be calculated with a very general model:
ivipiqjj pppCC ,,0,,0,,0,0 [veh/h] (4)
with
Cj = capacity of the minor stream j [veh/h] C0,j = basic capacity of the minor stream j in case of
no major stream (i) vehicle is occupying the conflict point = [veh/h] (5) jft ,/3600
p0,q,i = probability of queue-free state in the major stream i
4
= impedance factor within the major stream = ix for queueing at the conflict point [-] (6) 1
p0,p,i = probability of no vehicle platooning (vehicles following consecutively each other with a minimum headway i) in the major stream i
= 3600
1 , iiCq [-] (7)
p0,v,i = probability of no impedance caused by an upstream arriving vehicle in the major stream i
= Pr( headway > t0,ij )
=
)(
3600exp ,0
,iij
iC tq
[-] (8)
with
tf,j = follow-up time of the minor stream j [s] qC,i = volume of the major stream
(= circular stream at a roundabout) i [veh/h] t0,ij = tc,i - tf,j/2 [s] (9) tc,i = critical gap of the major stream i (Note, the critical gap is considered as
major stream related because the critical time is actually the time consumed by an arriving major stream vehicle at the conflict point. This is a more general consideration. Thus, in case of more than one major stream opposing a minor stream, this minor stream may have different values of the critical time.)
i = minimum time headway of the major stream i [s] xi = degree of saturation of the major stream i [-]
For more than one major stream on the circular roadway (Figure 1b), the probabilities p0,q, p0,p, and p0,v for different major streams can be considered as independent of each other. Thus, for an minor stream j with multiple major streams i we get (Wu, 2001)
Ii
ivIi
ipIi
iqjj pppCC ,,0,,0,,0,0 [veh/h] (10)
where I is the set of all major streams under consideration.
The probability of a queue-free state p0,q,i is also known as the impedance factor fimp. The impedance can also be caused by the queue from a downstream conflict point. The downstream queue and its impedance will be considered later in section 5. In this section, the queues in the major streams are neglected (xi = 0) as a first approach. Thus p0,q,i = 1 and therefore,
Ii
ivIi
ipjj ppCC ,,0,,0,0 [veh/h] (11)
That is,
Ii
iiC
Iiiij
iCj
Ii
iiC
Iiiij
iCjj
qt
qC
qt
qCC
36001)(
3600exp
36001)(
3600exp
,,0
,,0
,,0
,,0
[veh/h] (12)
5

All parameters mentioned in the model are related either to the major streams i or to the minor stream j or to both of them. This can be clearly seen regarding the indices i and j. That is, the critical gap tc,i and the minimum headway i are related to the major stream i, the basic capacity C0,j is related to the minor stream j.
As a further simplification, the impedance caused by a single upstream arriving vehicle in the major stream can be neglected. That is we assume here p0,v,i = 1 and thus
Ii
iiCjj
qCC
36001 ,
,0
[veh/h] (13)
(13)
The assumption that p0,v,i = 1 corresponds to the condition t0,ij i. It means that the so-called zero-gap is of the same magnitude as the minimum time gap between major stream vehicles which can be considered as realistic in most of cases for traffic behavior at a roundabout. Eq. is a linear function for a single lane circular roadways and a quadratic, convex function for double lane circular roadways. Both shapes of capacity functions can be observed in reality respectively.
In case of a "limited priority" (Troutbeck and Kako, 1997, major stream i yielding to minor stream j to some specific extend) this equation can be expressed as following (cf. also Miltner, 2003).
Ii
iiCijjj
qbCC
36001 ,
,0
[veh/h] (14)
with
bij = probability of right of way for a major stream on the circular lane (bij=1: no i yielding to j, or in other words: the priority of i is always obeyed by j) [-]
The values of bij can be defined according to a so-called conflict matrix. The probability of
right of way bij is related to both of the major stream i and the minor stream j.
The total capacity of an entry with more than one lane is the sum of capacities of all entry lanes (Figure 2a). That is,
Jj Ii
iiCijj
Jjj
qbCCC
36001 ,
,0
[veh/h] (15)
where J is the set of all minor streams under consideration.
i = 1L,1R
j = 2L,2R
i = 1L,1R
j = 2L,2R
ns
a) b)
Figure 2 - Conflict points with more than one minor stream
6

For estimating the total entry capacity, the proportion of the volumes on each entry lane is assumed to remain constant, and the total entry capacity is subject to some boundary condition. For example, for a double lane entry the following condition has to be satisfied:
R
R
L
L
R
RLR
L
RLL a
C;
a
Cmin
q
qqC;
q
qqCminC
2
2
2
2
2
222
2
222 [veh/h] (16)
(16)
with a2L = q2L / (q2L + q2R) = proportion of traffic in the entry for lane 2L [-] a2R = q2R / (q2L + q2R) = proportion of traffic in the entry for lane 2R [-]
That is the maximum capacity of the two lanes together. Eq. shows that the maximum capacity of a double lane entry is a function of the distribution of traffic volumes on both lanes. For example, if lane 2R accommodates 80% of the total entry capacity, say a2R = 0.8, and the capacity of the lane 2R is 600 veh/h, the maximum capacity of the double lane entry is than 600/0.8 = 750 veh/h. That is much less than the two-fold of the single lane capacity (600*2 = 1200 veh/h).
2.2 Multilane entry with limited length of lanes
If one of the entry lanes has only a limited length ns, and both lanes emerge from a single upstream lane (Figure 2b), the capacities of the single lanes at the entry cannot be utilized as calculated. According to the usual concept of unsignalized intersections, we have here a “short-share lane” problem. The capacity of shared lanes can be determined according to a formula first developed by Harders (1968). This concept has been extended by Wu (1997) such that also additional lanes of limited length (short lane) can be taken into account. For the case of a single-lane approach with an additional short lane near the intersection the capacity of the entry with short-share traffic lane can be calculated from (Wu, 1997):
1
1
2
2
1
2
2
221 1
21
2
22
s
sss ss
n
n
R
R
n
L
L
RLn n
Rn
L
RLs
C
q
C
q
xx
qqC [veh/h] (17)
with Cs = capacity of the short-shared lane [veh/h] q2L = volume for the entry lane 2L [veh/h] q2R = volume for the entry lane 2R [veh/h] C2L = capacity for the entry lane 2L [veh/h] C2R = capacity for the entry lane 2R [veh/h] x2L = degree of saturation of the entry lane 2L [-] x2R = degree of saturation of the entry lane 2R [-]
In case ns goes to infinite, eq. (17) yields eq. . (16)
For ns = 0, eq. (17) yields the well-known shared lane formula:
R
R
L
L
RL
RL
RLs
C
q
C
qqq
xx
qqC
2
2
2
2
22
22
22
[veh/h] (18)
7

2.3 The two-stage queuing problem
Eq. (14) deals only with cases where the major streams are crossed by a minor stream at an isolated conflict point. In case of a pedestrian crossing at a roundabout, there are often several spaces between the circular major stream and the pedestrian crossing (Figure 3). The minor stream at the entry can pass the pedestrian crossing and the circular major stream one-by-one and if necessary wait in between. The capacity of this two-stage queuing system with nw waiting places is given by Brilon and Wu (1999).
Stage b: i = 1L
j = 2
Waiting places nw Stage a: i = 1R
Figure 3 - Two-stage priority with nw waiting places
We consider two consecutive queuing stages a and b with nw possible waiting places in between. Then the total capacity of the combined queuing system can be expressed by
elsewhereCwCw
yforCCnnC
abb
abbwwT
001
11
1 [veh/h] (19)
where
CT = total capacity of the combined queuing system
w0 = 1
11 wny
y
nw = possible waiting places between both queueing stages Ca = C0,a p0,a = capacity of the first stage a Cb = C0,b p0,b = capacity of the second stage b Cab = C0,ab p0,a p0,b
= capacity of queuing system in case nw = 0
y = abb
aba
CC
CC
Different applications for the two-stage model are described in the following chapters. The calculation of Ca and Cb is explained for each case in these chapters.
In Brilon and Wu (1999), the capacity Cab of the queuing system in case of nw = 0 is only given for a special case with C0,a = C0,b = C0,ab. For the two-stage problem at roundabouts regarding pedestrians this assumption does not apply. However, also in the general case with C0,a ≠ C0,b ≠ C0,ab the capacity Cab can be calculated. The capacity Cab of the queuing system in case of nw = 0 can be expressed as a function of capacities of the two stages. That is,
baabb
b
a
aabbaabab CCf
C
C
C
CCppCC
,0,0,0,0,0,0 [veh/h] (20)
8

with
ba
abab CC
Cf
,0,0
,0
This leads to
aabb
baba
abb
aba
CfC
CfC
CC
CCy
1
1 [-] (21)
The values of C0 are actually the reciprocal of the follow-up time tf. It is the time headway h at lane capacity Cln plus the lost time t experienced by an approaching vehicle needed for deceleration and orientation maneuver. That is
ln0
36003600
CChtt f [s] (22)
For crossing stage a and b in one step, the deceleration and orientation time t is the sum of t in both stages. That is,
lnb,a,baab CCC
ttt3600236003600
00
[s] (23)
Thus,
ln,0,0
,0 1111
)(
3600
CCCtth
C
ba
baab
[veh/h] (24)
In the following, a time headway of h = 2.2 s is used at roundabouts. Thus, the lane capacity Cln is 3600/2.2s = 1640 veh/h.
Eq. was derived for a queuing system with Markovian arrivals and departures. In the reality those presumptions are rarely satisfied. For accounting for the stochastic property of a queuing system, a factor Cn can be applied to the parameter nw. That is, as an approximation to the stochastic property of the queuing system instead of nw a parameter nw
* = Cn
(19)
(19)
(19)
nw can be used in eq. . For a queuing system with Markovian arrivals and departures is Cn = 1. The factor Cn is normally greater than 1. For example, one can use Cn = 1.68 for a queuing system with Markovian arrivals and deterministic service times (Wu, 1994). The value of Cn is subject to calibration.
In general, the total capacity of a two-stage queuing system can be expressed with 4 significant parameters (cf. eq. (19)):
),,,( *,0 wabbaT nCCCfC [veh/h] (25)
The formulation (eq. ) of the capacity of a two-stage queuing system is very complex. As a simplification the following formulation can be used instead of eq. (19):
),,,(11
11min *
,01
1
*
*
wabban
aabb
nbaba
T nCCCfCfC
CfCC
w
w
[veh/h] (26)
For practical applications this approximation provides a rather good fit.
9

3 Conflict groups at a roundabout
All capacities of the individual conflicts or conflict groups at a roundabout can be estimated using the equations presented in section 2. The total set of conflict points at a roundabout with 4 arms and 12 movements is illustrated in Figure 4. For a particular double lane entry yielding to a double lane circular roadway, the traffic streams and the involved conflict points are depicted in Figure 5. The traffic lanes are named left (L) and right (R) entry lane, outer (O), inner (I) circular lane, and pedestrian crosswalk (PE).
5
1
2
3
9
8
7
6 4
1012 11
Arm 1
Arm 2
Arm 3
Arm 4
5
1
2
3
9
8
7
6 4
1012 11
Arm 1
Arm 2
Arm 3
Arm 4
Figure 4 – Conflict points at roundabouts in the real world
In order to calculate the entry capacity, the lane volume distributions at the entry and on the circular roadway have to be estimated in advance according the O-D relationship of all movements at the intersection.
From the O-D relationship the circular volume qC, the entry volume qE, and the exit volume qA at the subject approach k can be calculated as follows.
)( 1,31,22,11,1, kkkkkkkkkC qqqqq [veh/h] (27)
3,2,1,, kkkkkkkE qqqq [veh/h] (28)
kkkkkkkA qqqq ,3,2,1, [veh/h] (29)
with k = number of the arm. qk,m is the volume from arm k to arm m (cf. Figure 4). In case that m > 4 it has to be transformed into m – 4. For a roundabout with 3 or more than 4 arms the calculations have to be adequately adjusted. The volume in parentheses is the U-turn volume which does not always exist.
For double lane roundabouts, one can assume that the volume on the left entry lane (L) corresponds to the left-turn volume at the entry. Furthermore, it can be assumed that nearly none (0%) of the left-turn vehicle from the upstream arm will use the inner circular lane (I) at a very low circular volume and nearly all of them will use the inner circular lane at high circular volume (up to 1600 veh/h). In between the volumes can be obtained by interpolation. These assumptions are realistic because the inner circular lane and the left entry lane are mostly used by the corresponding left-turn vehicles. That is,
16001600 2,11,,,C
kkC
kLkICq
qq and 3,, kkkL qq [veh/h] (30)
10

For example, for an entry with two lanes (L and R) shown in Figure 5a with one outer (O), one inner (I) circular lane, and one pedestrian crosswalk (PE), the capacity of the left and the right entry are
36001
36001
36001 ,,,
,0PEPEc
PELOOc
OLIIc
ILLL
qb
qb
qbCC
[veh/h] (31)
36001
36001 ,,
,0PEPEc
PEROOc
ORRR
qb
qbCC
[veh/h] (32)
R L
I
OnE
PE Stage a
Stage b
RL
I
OnE
PE Stage a
Stage b
a) b)
Figure 5 – An entry with two lanes in the entry and two circular lanes
In the real world, there is normally a waiting area with nE storage places (nE ≥ 1) between the outer circular lane and the pedestrian crosswalk. A minor stream vehicle can cross the pedestrian crosswalk first and stay in between. In this case the capacity of a minor stream must be calculated for crossing the pedestrian crosswalk (Ca) and for entering the major stream (Cb). Thus,
36001 ,
,0,PEPEC
PELPELaL
qbCC
[veh/h] (33)
36001
36001 ,,
,0,OOC
OLIIC
ILLbL
qb
qbCC
[veh/h] (34)
The combined capacity of this two-stage problem can be obtained from eq. (19) or eq. (26):
),,,( ,,0,,, EabLbLaLTL nCCCfC [veh/h] (35)
Similarly for the right entry lane we have
36001 ,
,0,PEPEc
PERPERaR
qbCC
[veh/h] (36)
36001 ,
,0,OOc
ORRbR
qbCC
[veh/h] (37)
),,,( ,,0,,, EabRbRaRTR nCCCfC [veh/h] (38)
where f is the functionality given by eq. (19) or eq. (26).
Obviously, for a multi-lane roundabout, the volume distribution between qI and qO on the circular lanes and the volume distribution between qL and qR on the entry lanes must be calculated in advance. The distributions of those volumes can be estimated according to the turning movements at the intersection. For a single lane roundabout, for all equations the indices I and L are no longer applicable and they just must be neglected.
11

Taking into account the volumes of both left (qL) and right (qR) entry lanes and the length of the double-lane area (nd) upstream from the pedestrian crossing, the total capacity of the double-lane entry (CE,d) can then be calculated using eq. . (17)
1
1
,
1
,
,
d
dd
n
n
TR
R
n
TL
L
RLdE
C
q
C
q
qqC [veh/h] (39)
Setting nd = 0, this equation yields the shared lane capacity (CE,s) of a single lane entry opposing two circular lanes at a roundabout:
TR
R
TL
L
RLsE
C
q
C
qqq
C
,,
,
[veh/h] (40)
In this case two minor streams on one entry lane are actually calculated (cf. Figure 5a). One of them (qL) crosses the outer circular lane and proceeds into the inner circular lane. And another (qR) continues directly into the inner circular lane.
Note, at a single lane entry the approach arm has normally a flare area to enable the turning movement of the right-turn vehicle entering the roundabout. Thus, there is actually a double lane area able to accommodate one vehicle. Under real world conditions, this flare area is not used by all vehicles but only by a portion af of them. Thus the capacity of the single lane entry yielding to a double lane circular roadway is
TR
R
TL
L
RLf
TR
R
TL
L
RLf
sEfddEfE
C
q
C
qqq
a
C
q
C
q
qqa
CanCaC
,,2
2
,
2
,
,,lanesingle,
)1(
)1()1(
[veh/h] (41)
Again, the value of af is subject to calibration depending on the geometric layout of the entry area. With af = 0 one is on the safer side of calculation.
Setting the traffic volume on the inner circular lane qI = 0, all formulas mentioned here can be used for a roundabout with a single lane circular roadway.
As a summary, all parameters mentioned above can be defined using a conflict matrix. through show the calibrated parameters representing German roundabouts based on
methods and data from the HBS (2015). The basic capacities of the minor stream C0,j and the minimum headway i of the corresponding major stream mentioned above are given for traffic streams under consideration (veh, ped, and two-stage). For the calibration of double lane roundabouts, it was assumed that nearly no (0%) circular vehicles are using the inner circular lane at very low circular volume and 30% at high circular volume (1600 veh/h). For a double lane entry 30% of the total entry volume is assumed to use the left entry lane. These assumptions are realistic because the inner circular lane and the left entry lane are mostly used by the corresponding left-turn vehicles and due to the fact that in Germany the left lanes at a two-lane roundabout are used by the drivers rather reluctantly. That is,
Table 1 Table 4
1600
3.0, C
C
IC q
q
q or
1600
3.0 2
,C
ICq
q [veh/h] (42)
and
12

[veh/h] (43) EL qq 3.0
Table 1 – Conflict matrix for parameters of a roundabout entry with one entry lane and two circular lanes (1/2)
Circular inner
(I)
Circular outer (O)
Ped (PE) Major lane i
Minor lane j
Stage b Stage a
C0,j
[veh/h]
i [s] 2.3 2.3 2.3 Veh
Stage bPed
Stage a 2-Stage
ab
Places btw. two
stages nE
[veh]
Entry left (L) bij 0.9 0.9 0.9 1270 1330 1080 1
Entry right (R) bij 0.9 0.9 0.9 1420 1420 1250 1
Table 2 – Conflict matrix for parameters of a roundabout entry with two entry lanes and two circular lanes (2/2)
Circular inner
(I)
Circular outer (O)
Ped (PE) Major lane i
Minor lane j
Stage b Stage a
C0,j
[veh/h]
i [s] 2.4 2.4 2.6 Veh
Stage bPed
Stage a 2-Stage
ab
Places btw. two
stages nE
[veh]
Entry left (L) bij 0.9 0.9 0.9 1010 1010 730 1
Entry right (R) bij 0.9 0.9 0.9 1100 1100 830 1
Table 3 – Conflict matrix for parameters of a roundabout entry with single lane entry and single circular lane (1/1)
Circular lane Ped (PE) Major lane i
Minor lane j Stage b Stage a
C0,j
[veh/h]
i [s] 1.8+14.5/D*) 2.8 Veh
Stage bPed
Stage a 2-Stage
ab
Places btw. two
stages nE
[veh]
Entry lane bij 0.9 0.9 1200 1550 1150 1 *) D = outer diameter of the roundabout [m]
Table 4 – Conflict matrix for parameters of mini roundabout entry with single lane entry and single circular lane (1/1 mini)
Circular lane Ped (PE) Major lane i
Minor lane j Stage b Stage a
C0,j
[veh/h]
i [s] 2.6 3.0 Veh
Stage bPed
Stage a 2-Stage
Ab
Places btw. two
stages nE
[veh]
Entry lane bij 0.9 0.9 1080 1500 1020 1
13

a) b)
Figure 6 – Comparison of the model calibration to the HBS 2015 data dots=data from HBS 2105, lines=models
mini 1/1
1/2L 1/2R
2/2L 2/2R
Figure 7 – Comparison of the model calibration to the HBS 2015 data for impedance factor of pedestrians, dots=data from HBS 2105, lines=models
Figure 7In Figure 6, a comparison of the model calibration to the HBS 2015 data is depicted. It can be seen, that the simplified model can be calibrated to the HBS data very well. shows a comparison of the model to the HBS 2015 data with regards to the pedestrian impedance
14

factor at roundabout entries. For single lane roundabouts the model results represent the HBS 2015 methodology very well. For double lane roundabouts, the results of HBS 2015 cannot represent the whole range of the circular volume. The reason of those deviations must be found in the HBS 2015 model, because the HBS 2105 model is a regression based on limited data without any theoretical background. However, in the common range of circular volume the results of HBS 2015 data can also be represented by the new model properly.
4 Capacity of an exit at a roundabout
An exit at a roundabout can also be considered as a two-stage queueing system (cf. Figure 8)
O
AnA
PAI
Stage b
Stage a
Figure 8 – An exit with two circular lanes
The combined capacity of this two-stage problem can be obtained from eq. (19) or eq. (26):
),,,( ,,0,,, AabAbAaATA nCCCfC [veh/h] (44)
where CA,a = Cln is the capacity of the exit lane at the edge of the outer circular lane. CA,b is the capacity of the pedestrian crossing at the exit, and C0,A,ab is the basic capacity of the two-stage problem at the exit.
The capacity CA,b can be calculated as
36001 ,
,0,,PAPAa
PARRARPAAbA
qbCCC
[veh/h] (45)
The upstream outer circular lane at an exit can be treated as a shared lane consisting of the exit lane (qA) and the downstream outer circular lane (qO,D). Thus, the capacity of the upstream outer circular lane at an exit is
DO
DO
TA
A
DOAUO
C
q
C
q
qqC
,
,
,
,,
[veh/h] (46)
In accordance, the parameters for an exit are given in Table 5. The lane capacity of the downstream outer circular lane CO,D is set to the lane capacity Cln (1640 veh/h).
15

Table 5 – Conflict matrix for parameters of a roundabout exit with only one exit lane
Exit lane at edge of the outer circular lane
with Cj =C0,j
Ped (PA) Major lane i
Minor lane j
Stage a Stage b
C0,j
[veh/h]
i [s] - 2.9 Veh
Stage aPed
Stage b 2-Stage
ab
Places btw. two
stages nE
[veh]
Exit lane (A) bij 1 0.9 1400 1550 1330 1
Exit lane (A) CA,T Upstream outer circular lane as a share lane (O,U) Downstream outer circular (O,D) 1640
5 Reduction of entry capacity at a roundabout due to queuing at the downstream exit
RL
I
O
A
nE
nA
nEA
PE
PA
Stage b
Stage a
Figure 9 – An entry - exit constellation with two lanes in the entry and two circular lanes
For both the left and right entry lane, the capacity can be impeded by queuing vehicles on the outer circular lane caused by the downstream exit. Assuming that the downstream exit obeys an M/G/1 queuing system, the impedance factor fimp,EA can approximately be calculated as following.
1,,,0, 1 EAn
EA
nCEAOnEAEAimp xpf [-] (47)
with
EAnEAp ,,0 = probability that the entry is not impeded by queuing
from the downstream exit = probability that the space between the downstream exit
and the subject entry is not totally occupied by the downstream queue = Pr(QO,EA ≤ nEA)
= [-] 1,1 EAnnCEAOx
xO,EA = degree of saturation of the downstream outer circular lane = qO,EA/CO,EA [-] qO,EA = volume of the downstream outer circular lane [veh/h] CO,EA = capacity of the downstream outer circular lane [veh/h]
nEA = storage places between the entry and the downstream exit on the outer circular lane [veh]
16

Cn = Factor accounting for the stochastic property of the queuing system. [-]
In this equation, the service time of the queuing system is considered less stochastic using a factor Cn = 1.68 applied to the parameter nEA assuming the service time of the queuing system on a circular lane is nearly deterministic (Wu, 1994). In Table 6, the parameters for calculating the impedance caused by the downstream queue are given. The value of nEA = 3 is assumed for a midsize single lane roundabout with an outer diameter D = 35m. For a real world roundabout, the value of nEA can be obtained from the given geometry.
Table 6 – Conflict matrix for parameters of an entry – exit constellation
Downstream outer lane at
the entry with Cj =C0,j
Upstream outer lane at the exit
with Cj = CO,U
from Eq.(46)
Major lane i Minor lane j
Stage a Stage b
C0,j
[veh/h]
i [s] - - Stage a Stage b 2-Stage
ab
Places btw. two
stages CnnEA [veh]
Outer circular lane btw. an entry and an
exit (EA) bij 1 1 1640 1640 1640 1.68*3
Considering the impedance of queuing caused by the downstream exit, the capacity of the second stage of the left lane is
bLEAimpbLnEAbLiqbL CfCpCpCEA ,,,,,0,,,0
*, [veh/h] (48)
with CL,b form eq. (34) and fimp,EA from eq. (47).
The capacity of the first stage remains unchanged:
aLaL CC ,*
,
with CL,a from eq. (33). And with the functionality f from eq. (19) or eq. (26),
),,,( ,,0*
,*
,*
, EabLbLaLTL nCCCfC [veh/h] (49)
Similarly, for the right entry lane we get
bREAimpbRnEAbR CfCpCEA ,,,,,0
*, [veh/h] (50)
aRaR CC ,*
, [veh/h] (51)
with CR,a from eq. and CR,b from eq. . Thus, with functionality f from eq. or eq. (26),
(36) (37) (19)
),,,( ,,0*
,*
,*
, EabRbRaRTR nCCCfC [veh/h] (52)
All parameters are defined previously.
For applications in the practice, the following steps of an algorithm with the corresponding equations are summarized as a guide for the calculation procedure at an entry-exit constellation:
17

18
1 Estimation of the demand volumes qC, qE and qA at the subject entry and exit (eqs. , , and ) (27) (28) (29)
2 Estimation of the distributed demand volumes (if applicable) or lane demand volumes on the circular lanes qI and qO and on the entry lanes qL and qR according to applicable assumptions
3 Downstream exit: 3.1 Estimation of the first stage capacity Ca of the exit lane at the edge of the outer
circular lane (e.g. Ca = 1400 veh/h) 3.2 Estimation of the second stage capacity Cb against the pedestrian stream (Cb
from eq. (45)) 3.3 Estimation of the two-stage capacity CA,T at the exit lane (CA,T from eq. , Ca
from point 3 and Cb from point 3.2) (44)
3.4 Estimation of the shared lane capacity CO,U of the diverge point at the exit (eq. ) consisting of the downstream circular lane (CO,D = Cln) and the exit lane (CT,A from point 3.3)
(46)
3.5 Estimation of the impedance factor fimp,EA (eq. ) to the upstream entry lanes due to queues from the downstream circular lane (CO,U from point 3.4)
(47)
4 Upstream entry (entry under consideration): 4.1 Estimation of the first stage capacities Ca on entry lanes against the pedestrian
stream (eqs. and ) (33) (36)4.2 Estimation of the second stage capacities Cb on entry lanes against the circular
major stream (eqs. (34) and (37)) 4.3 Estimation of the second stage capacities Ca
* and Cb* impeded by the
downstream impedance factor (eqs. (48) and (50), fimp,EA from point 3.5) 4.4 Estimation the two-stage capacities CL,T
* and CR,T* at the entry lanes (eqs.
and (52)) (49)
4.5 Estimation of the shared lane capacity CE,d (if applicable, eq. , with CL,T = CL,T
* and CR,T = CR,T* from point 4.4)
(39)
6 Evaluation of the proposed model
To evaluate the proposed model, two examples are constructed for a single lane roundabout using the calibrated parameters in sections 3 through 5. One example is for an entry – exit constellation where the blockage effect due to queue spillback from the downstream exit is demonstrated. And another example deals with the whole roundabout considering all the entries and exits in a consecutive way.
For the evaluation, we consider a roundabout connecting a major (arms 1 and 3, cf. Figure 4) and a minor (arms 2 and 4) road. The flow split of the major and the minor volume is 60% to 40% of the total intersection volume. The volumes of the turning movements are defined correspondingly. That is, 20%/60%/20% at a major street arm and 30%/40%/30% at a minor street arm.
At first, an entry - exit constellation at a single-lane roundabout with all possible conflict points depicted in is considered. For this constellation, the conflict against the circular major stream (A), against the pedestrian stream (B) at the entry, and the combination of both (BA) are calculated. At the exit, the conflict against the pedestrian stream (D), the conflict at the edge of the circular lane (C), and the combination of both have to be dealt with. In addition, the capacity of the diverge point at the exit (F) is calculated as a shared lane consisting of the downstream circular lane (H) and the exit lane (CD). Furthermore the, impedance factor (fimp,EF) due to queues from the downstream circular lane (F) at the exit to the upstream circular lane (E) at the entry is calculated. The capacity of the entry (A) and of
Figure 10

the up- and downstream circular lane (G and E) at the entry are reduced by the impedance factor.
Arm k Arm k+1
A
B BA
D
C
CDF HE G H G
Figure 10 – Conflict points of an entry-exit constellation
Due to the different entry and exit volumes at a major street and a minor street entry and due to the symmetric volumes there are two cases for the traffic volumes on the circle:
A) major street entry followed by a minor street exit B) minor street entry followed by a major street exit
At first, the investigated roundabout is loaded by a total intersection volume of 1900 veh/h. The results of the evaluation are depicted in for case A) and for case B) in Table 8. As a result the maximum degree of saturation at a major street arm is 0.663 and at a minor stream arm is 0.635.
Table 7
Table 7 – Capacity of the conflict points of an entry - exit constellation (A): major street entry - minor street exit) with total intersection volume of 1900 veh/h
Then, the total volume is raised step by step in order to investigate the total intersection capacity and the interaction between the entry and the downstream exit. For the major street arms (case A), the results of the evaluation are depicted in . The results for the minor street arms (case B) are shown in Table 10. According to the evaluation results, the example roundabout can at maximum accommodate a total intersection volume of 2297 veh/h. This corresponds to an ADT of ca. 28000 veh/d (for typical urban conditions of a peak hour volume = ADT * 0.08). At this volume (intersection capacity) the degree of saturation for conflict BA at the major street arms is nearly equal to 1 (0.999). The corresponding degree of saturation at a minor street arm is 0.854.
Table 9
Point qj qC,i C0,j i bij n C* fimp,EF C x Note
A 570 380 1200 2.2 0.9 - 921 0.917 870 0.655 Entry B 570 100 1550 2.8 0.9 1429 - 1429 0.399 Ped at entry
BA 570 - - - - 1 938 - 869 0.656 2-stage, entry C 570 - 1400 - - - 1400 - 1400 0.407 Exit D 570 100 1550 2.8 0.9 - 1442 - 1442 0.395 Ped at exit
CD 570 - - - - 1 1322 - 1322 0.431 2-stage,exit H 380 - 1640 - - - 1640 - 1640 0.232 Downstream of exit
F 950 - - - - - 1433 - 1433 0.663 Shared lane H/CD, upstream of exit
E 950 - 1640 - - 3 1640 0.917 1503 0.632 Downstream of entryG 380 1640 1640 0.917 1503 0.253 Upstream of entry
max x 0.663
19

20
Table 8 – Capacity of the conflict points of an entry - exit constellation (B): minor street entry - major street exit) with total intersection volume of 1900 veh/h
Point qj qC,i C0,j i bij n C* fimp,EF C x Note
A 380 570 1200 2.2 0.9 - 782 0.936 771 0.493 Entry B 380 100 1550 2.8 0.9 1429 - 1429 0.266 Ped at entry
BA 380 - - - - 1 814 - 770 0.493 2-stage, entry C 380 - 1400 - - - 1400 - 1400 0.271 Exit D 380 100 1550 2.8 0.9 - 1442 - 1442 0.264 Ped at exit
CD 380 - - - - 1 1322 - 1322 0.287 2-stage,exit H 570 - 1640 - - - 1640 - 1640 0.348 Downstream of exit
F 950 - - - - - 1496 - 1496 0.635 Shared lane H/CD, upstream of exit
E 950 - 1640 - - 3 1640 0.936 1534 0.619 Downstream of entry
G 570 1640 1640 0.936 1534 0.371 Upstream of entry
max x 0.635
Table 9 – Capacity of the conflict points of an entry - exit constellation (A): major street entry - minor street exit) with total intersection volume of 2297 veh/h
Point qj qC,i C0,j i bij n C* fimp,EF C x Note
A 689 459 1200 2.2 0.9 - 863 0.779 698 0.987 Entry B 689 100 1550 2.8 0.9 1429 - 1429 0.482 Ped at entry
BA 689 - - - - 1 886 - 690 0.999 2-stage, entry C 689 - 1400 - - - 1400 - 1400 0.492 Exit D 689 100 1550 2.8 0.9 - 1442 - 1442 0.478 Ped at exit
CD 689 - - - - 1 1381 - 1381 0.499 2-stage,exit H 459 - 1640 - - - 1640 - 1640 0.280 Downstream of exit
F 1149 - - - - - 1474 - 1474 0.779 Shared lane H/CD, upstream of exit
E 1149 - 1640 - - 3 1640 0.779 1277 0.900 Downstream of entryG 459 1640 1640 0.779 1277 0.359 Upstream of entry
max x 0.999
Table 10 – Capacity of the conflict points of an entry - exit constellation (B): minor street entry - major street exit) with total intersection volume of 2297 veh/h
Point qj qC,i C0,j i bij n C* fimp,EF C x Note
A 459 689 1200 2.2 0.9 - 695 0.820 611 0.751 Entry B 459 100 1550 2.8 0.9 1429 - 1429 0.321 Ped at entry
BA 459 - - - - 1 736 - 604 0.760 2-stage, entry C 459 - 1400 - - - 1400 - 1400 0.328 Exit D 459 100 1550 2.8 0.9 - 1442 - 1442 0.318 Ped at exit
CD 459 - - - - 1 1381 - 1381 0.332 2-stage,exit H 689 - 1640 - - - 1640 - 1640 0.420 Downstream of exit
F 1149 - - - - - 1526 - 1526 0.753 Shared lane H/CD, upstream of exit
E 1149 - 1640 - - 3 1640 0.820 1345 0.854 Downstream of entry
G 689 1640 1640 0.820 1345 0.512 Upstream of entry
max x 0,854

In the second example, we consider the whole roundabout considering all the entries and exits in a consecutive way. That is, the queues from the downstream entry (Gk) will impede the upstream exit (Hk). Thus, we have here a circular reference by the calculation which requires an iterative calculation. For the impedance from the entry to the exit (section HG) we assume that one vehicle (nAE = 1) can be stored between the exit and the entry (at the same arm). Obviously, the total intersection capacity will be smaller due to the circular interference of queuing. In this case we actually have a queuing sequence on the circular lane of the following sections:
)( 111444433332222111 GHFEGHFEGHFEGHFEGH
For a preloaded intersection volume of 1900 veh/h the degrees of saturations at different conflict points are illustrated in Table 11. One can recognize that the degrees of saturation are larger than those in example 1 as a consequence of the mutual queueing interactions on the circle.
Table 11 – Capacity of the conflict points on the circular lane considering all arms in the consecutive way with circular queuing interference with a total volume of 1900 veh/h
On circular lane At corresponding arm down stream section
Cross section at arm k q C*
n+1 fimp,+1 C x q C x
1 Exit (F1) 950 1386 H1G1: nAE =1 0.97 1343 0.71 570 1384 0.41 Entry (G1) 380 1640 E1F2: nEA =3 0.85 1390 0.27 570 853 0.67
2 Exit (F2) 950 1416 H2G2: nAE =1 0.92 1297 0.73 380 1384 0.27 Entry (G2) 570 1640 E2F3: nEA =3 0.88 1438 0.40 380 973 0.39
3 Exit (F3) 950 1386 H3G3: nAE =1 0.97 1343 0.71 570 1384 0.41 Entry (G3) 380 1640 E3F4: nEA =3 0.85 1390 0.27 570 860 0.66
4 Exit (F4) 950 1416 H4G4: nAE =1 0.92 1297 0.73 380 1384 0.27 Entry (F4) 570 1640 E4F1: nEA =3 0.88 1438 0.40 380 973 0.39
1 Exit (F1) 950 1386 H1G1: nAE =1 0.97 1343 0.71
max x 0.73 0.67 q = traffic volume of the considered cross section on the circular lane [veh/h] n+1 = storage places on the next downstream section of circular lane [veh] = nEA (storage places between the entry and the downstream exit on the circular lane) = nAE (storage places between the exit and the entry on the circular lane) C* = capacity of the considered cross section without impedance of downstream queueing [veh/h] C = C*fimp+1
= capacity of the considered cross section with impedance of downstream queueing [veh/h] fimp+1 = impedance factor of downstream queueing on the next section of circular lane (cf. eq. (47)) [-] (e.g.: for the cross section F1 section is C*=1386, fimp+1 = fimp (H1G1)=f(xG1) =1-0.27(1.681+1) = 0.97, C=1386*0.97=1343)
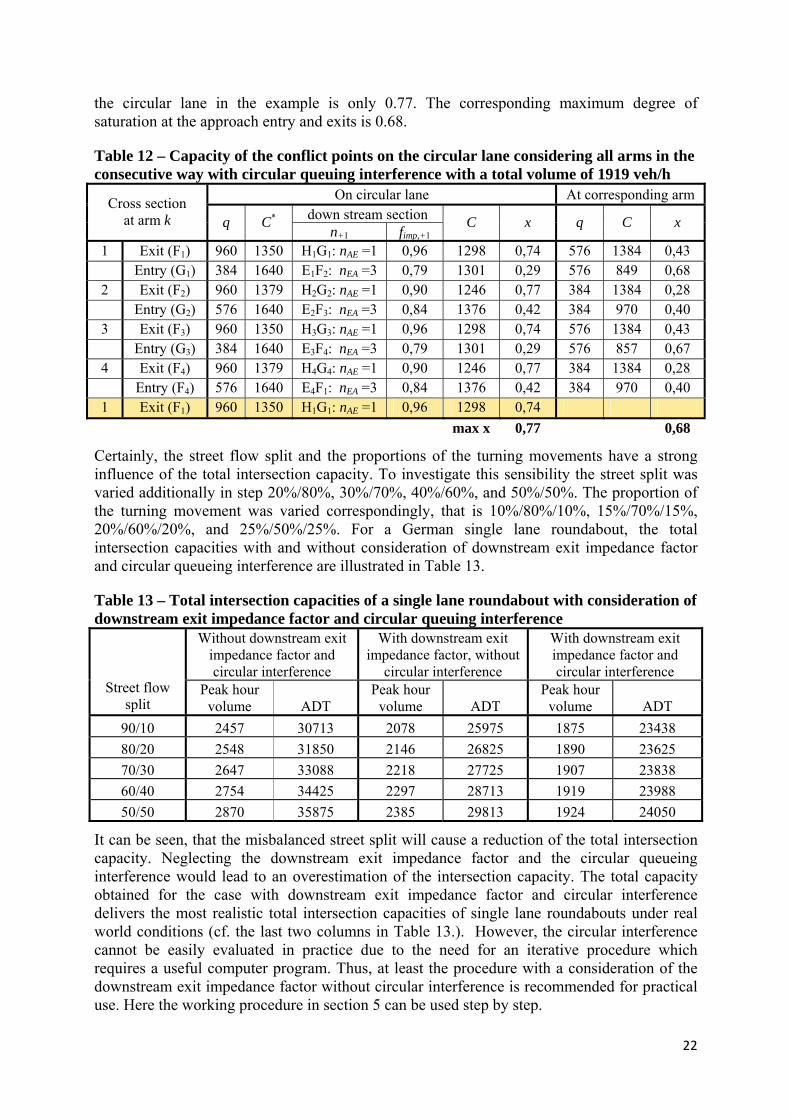
Again, by raising the total intersection volume, the total intersection capacity can be obtained. The results of this calculation are illustrated in Table 12. Obviously, none of the degrees of saturation on the circular lane can approach the value 1. Otherwise the whole roundabout will be totally gridlocked. According to the evaluation results, the example roundabout can only accommodate a critical total intersection volume of 1919 veh/h. This corresponds to an ADT of around 24000 veh/d (peak hourly volume = ADT * 0.08). Beyond this volume, the roundabout will be gridlocked and a breakdown will occur with no chance of recovery as long as the demand volumes remain constant. The gridlock effect becomes obvious by a steady increase of the x-values and a steady reduction of the capacities (down to zero) during the run of the iteration. At the critical total intersection volume, the maximum degree of saturation on
21
22
the circular lane in the example is only 0.77. The corresponding maximum degree of saturation at the approach entry and exits is 0.68.
Table 12 – Capacity of the conflict points on the circular lane considering all arms in the consecutive way with circular queuing interference with a total volume of 1919 veh/h
On circular lane At corresponding arm down stream section
Cross section at arm k q C*
n+1 fimp,+1 C x q C x
1 Exit (F1) 960 1350 H1G1: nAE =1 0,96 1298 0,74 576 1384 0,43 Entry (G1) 384 1640 E1F2: nEA =3 0,79 1301 0,29 576 849 0,68
2 Exit (F2) 960 1379 H2G2: nAE =1 0,90 1246 0,77 384 1384 0,28 Entry (G2) 576 1640 E2F3: nEA =3 0,84 1376 0,42 384 970 0,40
3 Exit (F3) 960 1350 H3G3: nAE =1 0,96 1298 0,74 576 1384 0,43 Entry (G3) 384 1640 E3F4: nEA =3 0,79 1301 0,29 576 857 0,67
4 Exit (F4) 960 1379 H4G4: nAE =1 0,90 1246 0,77 384 1384 0,28 Entry (F4) 576 1640 E4F1: nEA =3 0,84 1376 0,42 384 970 0,40
1 Exit (F1) 960 1350 H1G1: nAE =1 0,96 1298 0,74
max x 0,77 0,68
Certainly, the street flow split and the proportions of the turning movements have a strong influence of the total intersection capacity. To investigate this sensibility the street split was varied additionally in step 20%/80%, 30%/70%, 40%/60%, and 50%/50%. The proportion of the turning movement was varied correspondingly, that is 10%/80%/10%, 15%/70%/15%, 20%/60%/20%, and 25%/50%/25%. For a German single lane roundabout, the total intersection capacities with and without consideration of downstream exit impedance factor and circular queueing interference are illustrated in Table 13.
Table 13 – Total intersection capacities of a single lane roundabout with consideration of downstream exit impedance factor and circular queuing interference
Without downstream exit impedance factor and circular interference
With downstream exit impedance factor, without
circular interference
With downstream exit impedance factor and circular interference
Street flow split
Peak hour volume ADT
Peak hour volume ADT
Peak hour volume ADT
90/10 2457 30713 2078 25975 1875 23438
80/20 2548 31850 2146 26825 1890 23625
70/30 2647 33088 2218 27725 1907 23838
60/40 2754 34425 2297 28713 1919 23988
50/50 2870 35875 2385 29813 1924 24050
It can be seen, that the misbalanced street split will cause a reduction of the total intersection capacity. Neglecting the downstream exit impedance factor and the circular queueing interference would lead to an overestimation of the intersection capacity. The total capacity obtained for the case with downstream exit impedance factor and circular interference delivers the most realistic total intersection capacities of single lane roundabouts under real world conditions (cf. the last two columns in .). However, the circular interference cannot be easily evaluated in practice due to the need for an iterative procedure which requires a useful computer program. Thus, at least the procedure with a consideration of the downstream exit impedance factor without circular interference is recommended for practical use. Here the working procedure in section 5 can be used step by step.
Table 13

23
Analogously, the total intersection capacities of double lane roundabouts can be estimated as well. Details and examples for the calculation of the total intersection capacities of double lane roundabouts are not given here, they can be obtained from the authors.
7 Conclusion
This paper presents a model for capacity analysis of roundabouts with a completely new sophistication. It is based on the analysis of conflicts within the roundabout. The conflict points between the traffic streams of different types (cars and pedestrians) are considered by a homogenous model. The interaction between consecutive conflict points can be modeled according to the impedance probabilities. Together with this the distance between the consecutive conflict points is modeled properly.
Based on the proposed model, the capacity of the total roundabout can be analyzed more precisely. Especially, the interaction between different traffic streams and consecutive conflict points at roundabouts can be accurately taken into account according to the model. Using the proposed model, the whole roundabout can be treated as one entity and the total intersection capacity can be obtained according to given traffic volumes for the movements at the intersection. As a result the capacities of all the conflict points together with their degrees of saturation are obtained.
As one important result it becomes obvious that the interference of potential queuing processes between conflicts on the circular lanes can not be neglected, as it is the case for all the conventional roundabout capacity calculation methods. The current practice may lead to a significant overestimation of the total intersection capacity. Above a degree of saturation of x = 0.7 (obtained by conventional capacity estimation) a risk of queuing gridlock on the circle may occur.
The correct application of the derived equations may be rather complex. It is, however, not too problematic to implement them into a computer program.
To transfer the model to other countries a recalibration of the decisive parameters may be useful.
Further research may be directed on the influence of the bij (degrees of priority observation) between vehicles and in the vehicle/pedestrian conflicts. Additional empirical research should also analyze how these bij are depending on the saturation of the intersection.
References Bovy, H., Dietrich, K., Harmann, A. (1991): Guide Suisse des Giratoires (Swiss guideline for
roundabouts), ISBN 2-8298-0065-6, Lausanne, Feb. 1991, S. 75 Brilon, W. (2016): Some Remarks Regarding the Estimation of Critical Gaps. Presented at the TRB
Annual Meeting, paper no. 16-1785 (to be published in TRR) Brilon, W., Bondzio, L., Wu, N. (1997): Unsignalized intersections in Germany - a state of the art.
Proceedings of the 3rd international symposium on intersections without traffic signals, Portland, Oregon, , TR Circular E-C018, Transportation Research Board pp. 61–70.
Brilon. W.; Wu, N. (1999): Capacity at Unsignalized Two-Stage Priority Intersections. Transportation Research, A33, Issue: 3-4. Elsevier Science Ltd., New York, Tokyo, Oxford, 1999.
Brilon, W. and Wu, N. (2001): Capacity at Unsignalized Intersections Derived by Conflict Technique. Transportation Research Record 1776. TRB, National Research Council, Washington, D.C., USA., 2001
Brilon, W. and Wu, N. (2002): Unsignalized Intersections - A Third Method for Analysis. In Taylor, A.P. (ed.): Proceedings of the 15th International Symposium on Transportation and Traffic Theory. Pergamon, Elsevier Science Ltd., New York, Tokyo, Oxford, 2002.
Brilon, W., Wu, N. (2008): Kapazitaet von Kreisverkehren – Aktualisierung (An update for the capacity of roundabouts). Strassenverkehrstechnik, Nr. 5, pp. 280 – 288

24
Griffith, J.D. (1981): A mathematical model of a nonsignalized pedestrian crossing. Transportation Science, vol. 15, no. 3, pp. 222-232
Harders, J. (1968): Die Leistungsfähigkeit nicht signalgeregelten städtischen Verkehrsknoten. (The capacity of unsignalized urban intersections) Series Strassenbau und Strassenverkehrstechnik, Nr. 76.
HBS (2001 + 2015): Handbuch für die Bemessung von Strassen (Guideline for the dimensioning of highways), edited by the FGSV (Research Association for Highways and Traffic), Cologne, 2001 and 2015
HCM (2010 and 2016): Highway capacity manual. Transportation Research Board. Kimber, R.M.(1980): The traffic capacity of roundabouts. TRRL report LR 942, 1980 Marlow, M., Maycock, G. (1982): The effect of zebra crossing on junction entry capacities. TRRL SR
724, 1982. Miltner, T. (2003): Verkehrsqualitaet an vorfahrtgeregelten Innerortsknotenpunkten (Traffic flow
performance at unsignalized urban intersections). Ruhr-University Bochum, Institute for Transportation, No. 27,
Rodegerdts, L.A., Malinge, A., Marnell, P.S., Baird, S.G, Kittelson, M.J., Mereszcak, Y.S. (2015): Accelerating Roundabout Implementation in the United States, volume 2: Assessment of Roundabout Capacity Models for the Highway Capacity Manual, publication no. FHWA-SA-15-070
Schmotz, M. (2014): Bemessungsverfahren für Minikreisverkehre und einstreifige Kreisverkehre (Dimensioning of mini-roundabouts and single-lane roundabouts). Technical University of Dresden,
Siegloch, W. (1973): Die Leistungsermittlung an Knotenpunkten ohne Lichtsignalsteuerung (Capacity calculations for unsignalized intersections). Series Strassenbau und Strassenverkehrstechnik, Vol. 154
Stuwe, B. (1992): Untersuchung der Leistungsfaehigkeit und Verkehrssicherheit an deutschen Kreisverkehrsplaetzen (Capacity and traffic safety at German roundabouts), Ruhr-University Bochum, Institute for Transportation, No. 10
Troutbeck, R. J.; Kako, S. (1997): Limited priority merge at unsignalized intersections Proceedings of the Third International Symposium on Intersections without Traffic Signals. Portland Oregon, pp. 291-304. also in: Transportation Research part A (1999)
Wu. N. (1994): An Approximation for the Distribution of Queue Lengths at Unsignalized Intersections. In Akcelik, R. (ed.): Proceedings of the Second International Symposium on Highway Capacity. Sydney, Australia, Aug. 1994. Australian Road Research Board Ltd., Victoria, Australia, 1994.
Wu, N. (1997): An Universal Formula for Calculating Capacity at Roundabouts. Arbeitsblaetter, Institute for Traffic Engineering, Ruhr-University Bochum, No.13, March 1997.
Wu, N. (2000): Determination of Capacity at All-Way Stop-Controlled (AWSC) intersections. Transportation Research Record 1710. TRB, National Research Board, Washington, D.C., USA., 2000.
Wu, N. (2001): A Universal Procedure for Capacity Determination at Unsignalized (priority-controlled) Intersections. Transportation Research B 35, Issue 3. pp 592-623. Elsevier Science Ltd., New York, Tokyo, Oxford, 2001
Wu, N. (2006): Capacity Enhancement and Limitation at Roundabouts with Double-lane or Flared Entries. In: Proceeding of the 5th International Symposium on Highway Capacity and Quality of Service. Yokohama, Japan, July 25 - 29, 2006.