round 4 may 2015 - written report - australian oilseeds€¦ · percent discrepancy from the lower...
TRANSCRIPT

2015 AOF Test Check Program Monthly Report
Round 4 May – 2015
01/05//2015 – 01/06/2015
Store ID #4932829 AOF report 2015
Result Receival Dates
Lab Code Date A 29/5/2015 B N/A C 27/5/2015 D 25/5/2015 E 15/5/2015 F N/A G 5/5/2015 H 20/5/2015 I 13/5/2015 J 28/5/2015 K 15/5/2015 L 6/5/2015 M 26/5/2015 N 15/5/2015 O 30/5/2015 Q 3/6/2015 R 2/5/2015 S 29/5/2015

2015 AOF Test Check Program Monthly Report
Round 4 May – 2015
01/05//2015 – 01/06/2015
Store ID #4932829 AOF report 2015
Discussion of Results
Test Weight
Sample 1 – No outliers were observed for this test. Sample 2 – One outlier was identified for Lab J with a 1.55 kg/Hl from the upper quartile
limit (69.65kg/Hl). Sample 3 – No outliers were observed for this test.
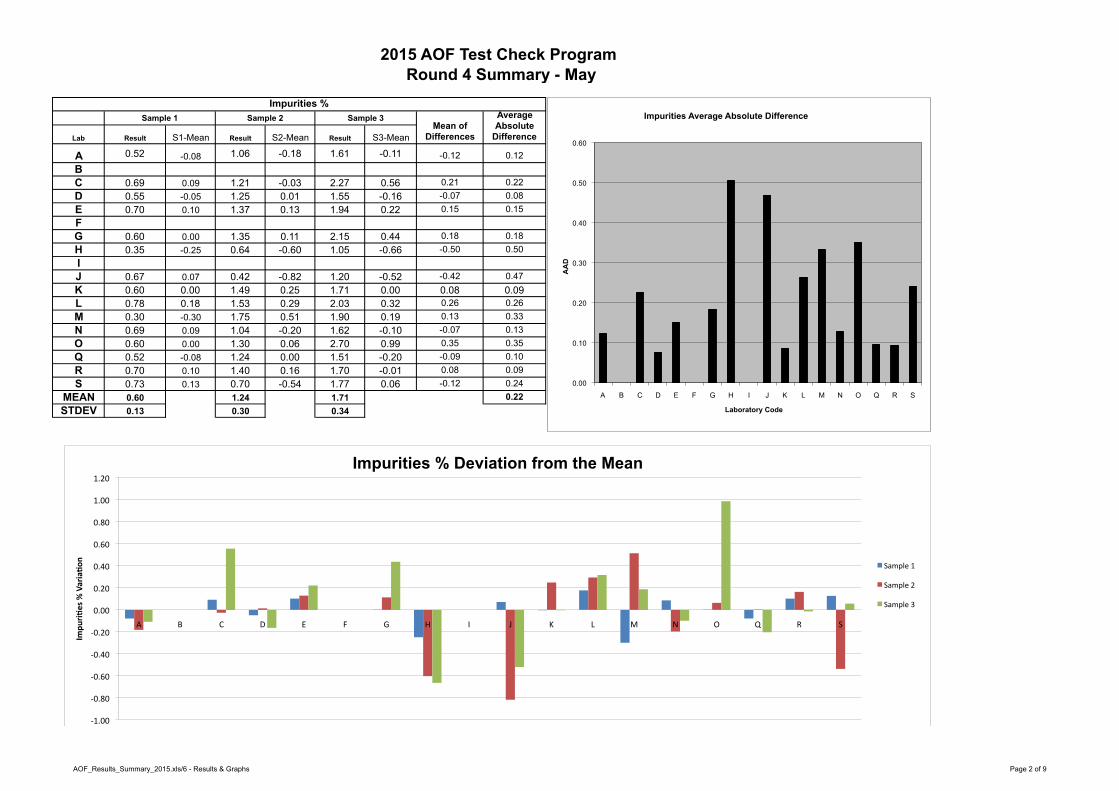
Impurities
Sample 1 – No outliers were observed for this test. Sample 2 – One outlier was identified for Lab J with a 0.13 of a percent discrepancy from
the lower quartile limit (0.53%). Sample 3 – One outlier was identified for Lab O with a 0.05 of a percent discrepancy from
the lower quartile limit (0.53%).
Oil Rapid
Sample 1 – Outliers were identified for Lab C and H. Lab C was a 1.28 of a percent discrepancy from the upper quartile limit (48.94%). Lab H was a 0.44 of a percent discrepancy from the lower quartile limit (46.90%).
Sample 2 – No outliers were observed for this test. Sample 3 – No outliers were observed for this test.
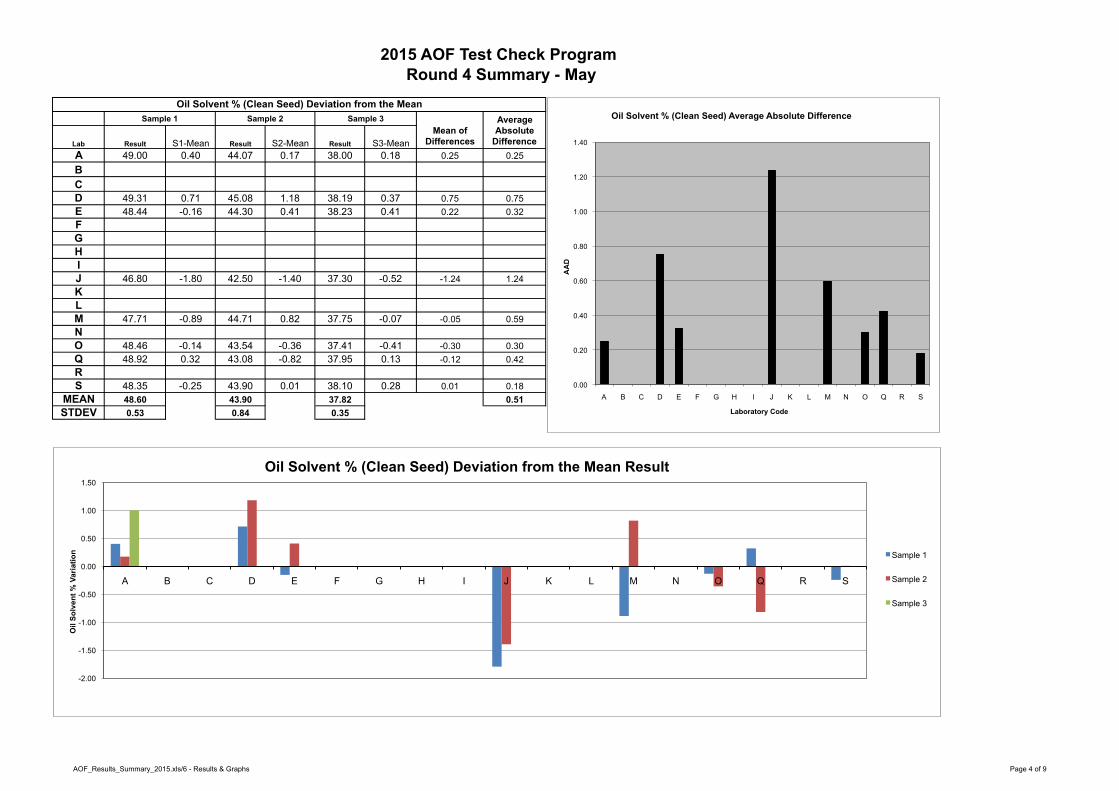
Oil Solvent Extraction
Sample 1 – One outlier was identified for Lab J with a 0.27 of a percent discrepancy from the lower quartile limit (47.07%).
Sample 2 – No outliers were observed for this test. Sample 3 – No outliers were observed for this test. Reproducibility limit of the extraction method ISO-659:2009 remains at 1.54 for oil contents at ~43% in canola. Recent survey has shown an increase to 75%, in this round, for laboratories to participate within the scope of the standard.

2015 AOF Test Check Program Monthly Report
Round 4 May – 2015
01/05//2015 – 01/06/2015
Store ID #4932829 AOF report 2015
Moisture Oven
Sample 1 – One outlier was identified for Lab C with a 0.31 of a percent discrepancy from the upper quartile limit (5.09%).
Sample 2 – One outlier was identified for Lab C with a 0.16 of a percent discrepancy from
the lower quartile limit (5.99%). Sample 3 – No outliers were observed for this test.
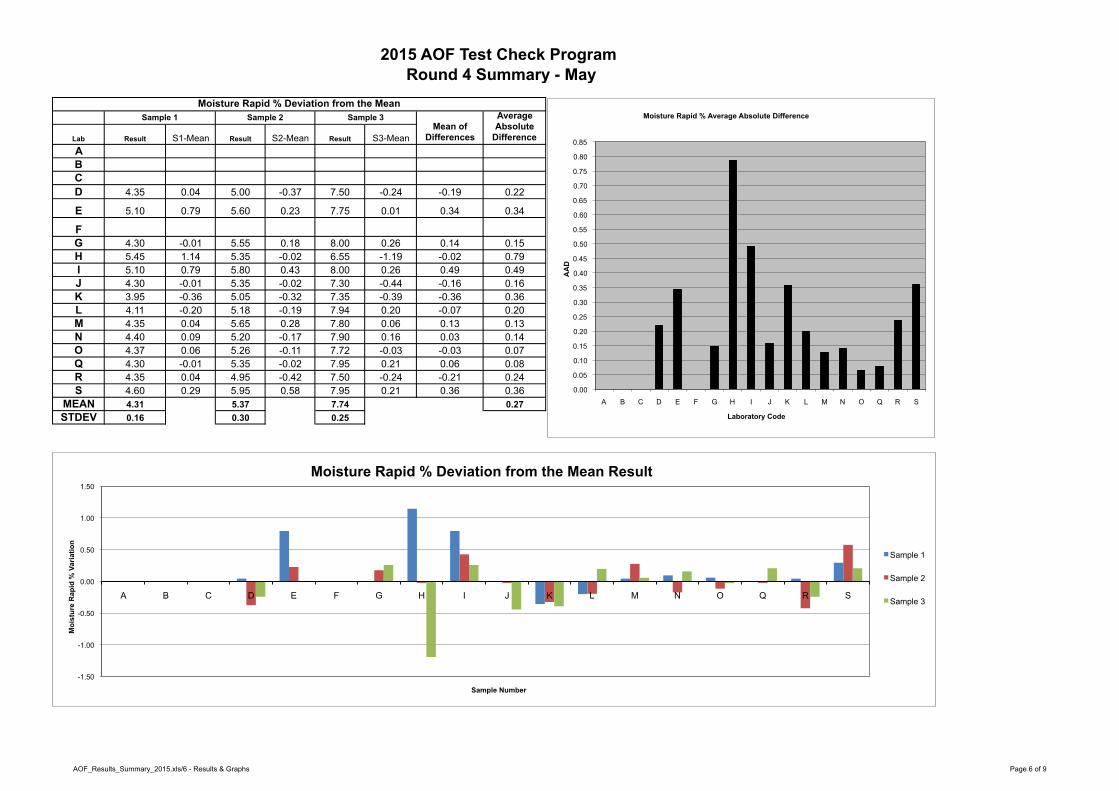
Moisture Rapid
Sample 1 – Outliers were identified for Lab E, H and I which were a 0.18, 0.53 and 0.18 of a percent discrepancy, respectively, from the upper quartile limit (4.93%).
Sample 2 – No outliers were observed for this test. Sample 3 – One outlier was identified for Lab H with a 0.28 of a percent discrepancy from
the lower quartile limit (6.83%).
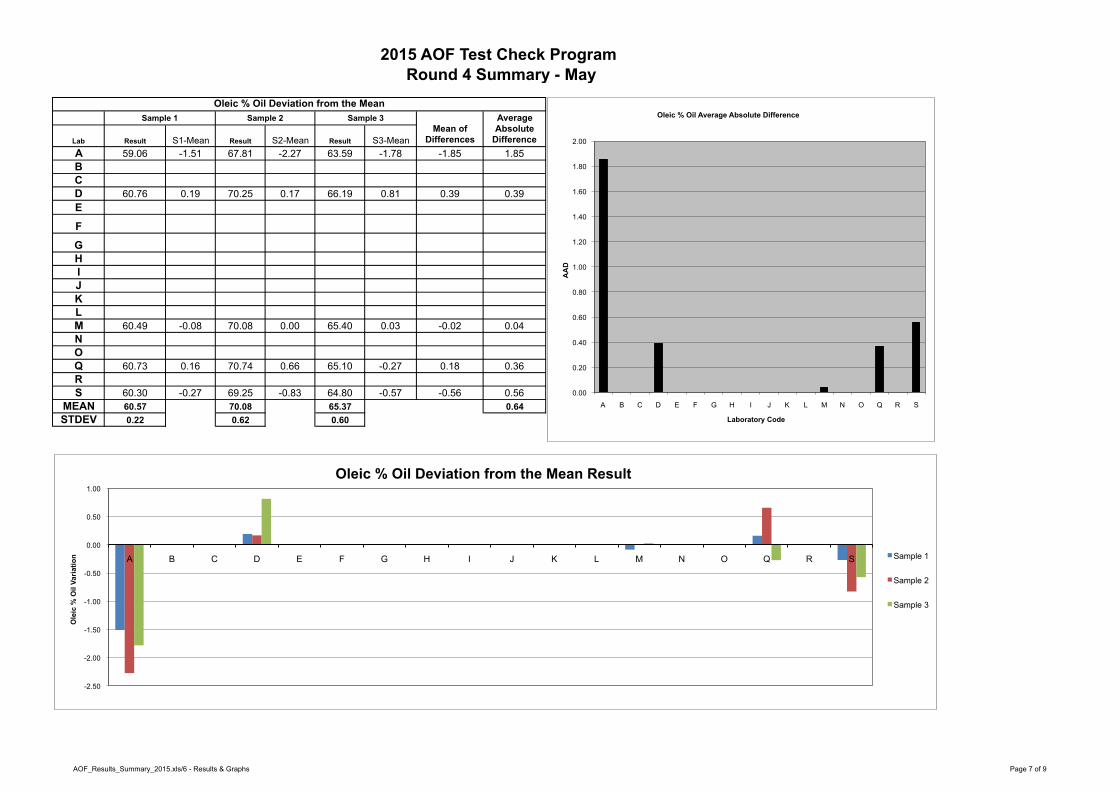
Oleic Oil
Sample 1 – One outlier was identified for Lab A with a 0.68 of a percent discrepancy from the lower quartile limit (59.74%).
Sample 2 – One outlier was identified for Lab A with a 0.22 of a percent discrepancy from
the lower quartile limit (68.03%). Sample 3 – One outlier was identified for Lab A with a 0.06 of a percent discrepancy from
the lower quartile limit (63.65%).
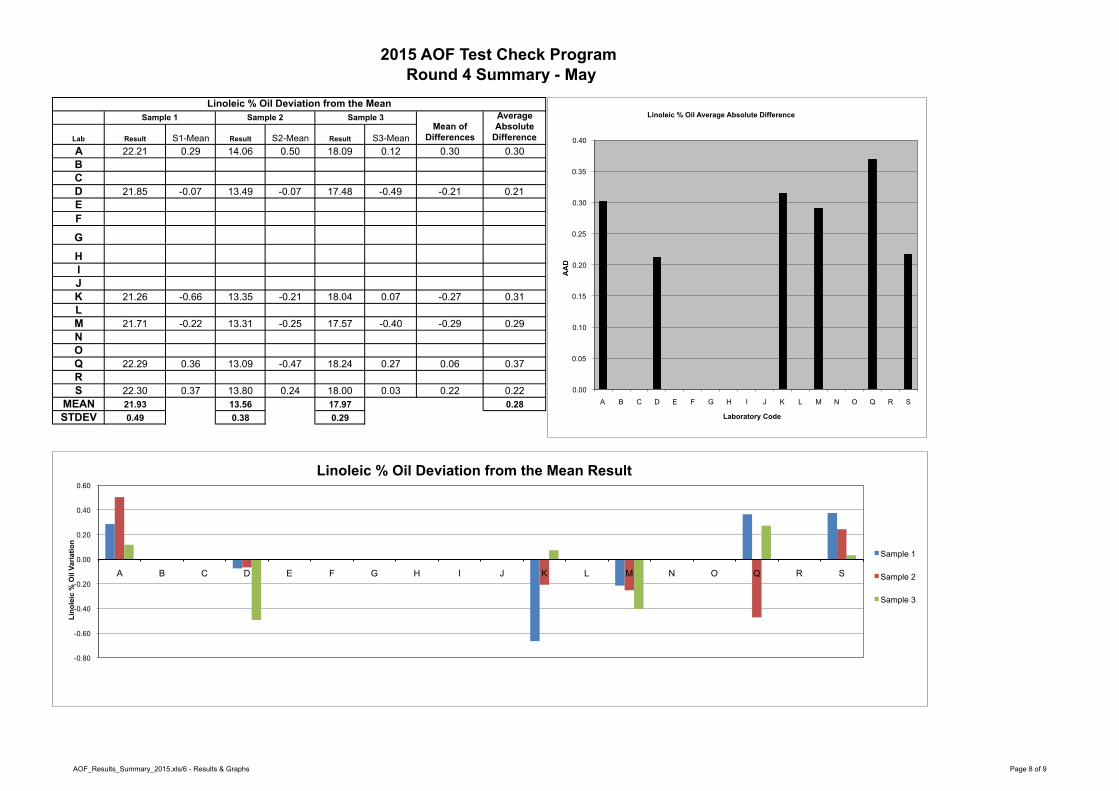
Linoleic Oil
No outliers were observed for this test.
Free Fatty Acid
Sample 1 – No outliers were observed for this test. Sample 2 – One outlier was identified for Lab K with a 0.33 of a percent discrepancy from
the upper quartile limit (0.37%). Sample 3 – No outliers were observed for this test.

AOF_Results_Summary_2015.xls/6 - Results & Graphs Page 1 of 9
Lab Result S1-Mean Result S2-Mean Result S3-MeanA 66.75 0.80 68.50 1.36 68.50 1.36 1.17 1.17BC 65.00 -0.95 66.00 -1.14 66.75 -0.39 -0.83 0.83D 66.50 0.55 65.75 -1.39 66.25 -0.89 -0.58 0.94E 65.95 -0.01 67.34 0.20 67.25 0.11 0.10 0.10FG 65.80 -0.15 66.70 -0.44 66.70 -0.44 -0.35 0.35H 65.55 -0.40 67.20 0.06 66.05 -1.09 -0.48 0.52IJ 64.85 -1.10 66.90 -0.24 65.75 -1.39 -0.91 0.91K 66.20 0.25 67.30 0.16 67.70 0.56 0.32 0.32L 65.94 -0.01 66.93 -0.21 66.89 -0.26 -0.16 0.16MN 66.84 0.88 68.64 1.50 68.62 1.47 1.28 1.28O 66.00 0.05 67.00 -0.14 66.00 -1.14 -0.41 0.44Q 66.29 0.34 71.20 4.06 69.50 2.36 2.25 2.25R 65.15 -0.80 66.45 -0.69 66.30 -0.84 -0.78 0.78S 65.95 0.00 68.10 0.96 67.75 0.61 0.72 0.72
MEAN 65.95 67.14 67.14 0.77STDEV 0.63 0.87 1.13
Test Weight kg/hl
Sample 1 Sample 2 Sample 3Mean of
Differences
Average Absolute
Difference
2015 AOF Test Check Program Round 4 Summary - May
0.00
0.50
1.00
1.50
2.00
2.50
A B C D E F G H I J K L M N O Q R S
AA
D
Laboratory Code
Test Weight Average Absolute Difference
!"#$$%
!&#$$%
$#$$%
&#$$%
"#$$%
'#$$%
(#$$%
)#$$%
*% +% ,% -% .% /% 0% 1% 2% 3% 4% 5% 6% 7% 8% 9% :% ;%
!"#$%&
"'()$%*
(+),%-./'.012
%
Test Weight kg/hl Deviation form the Mean
;<=>?@%&%
;<=>?@%"%
;<=>?@%'%
AOF_Results_Summary_2015.xls/6 - Results & Graphs Page 2 of 9
2015 AOF Test Check Program Round 4 Summary - May
Lab Result S1-Mean Result S2-Mean Result S3-Mean
A 0.52 -0.08 1.06 -0.18 1.61 -0.11 -0.12 0.12BC 0.69 0.09 1.21 -0.03 2.27 0.56 0.21 0.22D 0.55 -0.05 1.25 0.01 1.55 -0.16 -0.07 0.08E 0.70 0.10 1.37 0.13 1.94 0.22 0.15 0.15FG 0.60 0.00 1.35 0.11 2.15 0.44 0.18 0.18H 0.35 -0.25 0.64 -0.60 1.05 -0.66 -0.50 0.50IJ 0.67 0.07 0.42 -0.82 1.20 -0.52 -0.42 0.47K 0.60 0.00 1.49 0.25 1.71 0.00 0.08 0.09L 0.78 0.18 1.53 0.29 2.03 0.32 0.26 0.26M 0.30 -0.30 1.75 0.51 1.90 0.19 0.13 0.33N 0.69 0.09 1.04 -0.20 1.62 -0.10 -0.07 0.13O 0.60 0.00 1.30 0.06 2.70 0.99 0.35 0.35Q 0.52 -0.08 1.24 0.00 1.51 -0.20 -0.09 0.10R 0.70 0.10 1.40 0.16 1.70 -0.01 0.08 0.09S 0.73 0.13 0.70 -0.54 1.77 0.06 -0.12 0.24
MEAN 0.60 1.24 1.71 0.22STDEV 0.13 0.30 0.34
Impurities %Sample 1 Sample 2 Sample 3
Mean of Differences
Average Absolute
Difference
0.00
0.10
0.20
0.30
0.40
0.50
0.60
A B C D E F G H I J K L M N O Q R S
AA
D
Laboratory Code
Impurities Average Absolute Difference
!&#$$%
!$#A$%
!$#B$%
!$#($%
!$#"$%
$#$$%
$#"$%
$#($%
$#B$%
$#A$%
&#$$%
&#"$%
*% +% ,% -% .% /% 0% 1% 2% 3% 4% 5% 6% 7% 8% 9% :% ;%
3456
/'0"#%7%-./'.012
%
Impurities % Deviation from the Mean
;<=>?@%&%
;<=>?@%"%
;<=>?@%'%

AOF_Results_Summary_2015.xls/6 - Results & Graphs Page 3 of 9
2015 AOF Test Check Program Round 4 Summary - May
Lab Result S1-Mean Result S2-Mean Result S3-Mean
A
BC 50.22 2.27 44.85 1.17 38.07 0.14 1.19 1.19D 47.55 -0.39 43.94 0.26 38.05 0.12 0.00 0.26E 47.80 -0.14 43.05 -0.63 38.00 0.07 -0.23 0.28FG 47.90 -0.04 44.60 0.92 38.25 0.32 0.40 0.43H 46.46 -1.49 42.78 -0.90 37.25 -0.68 -1.02 1.02I 47.85 -0.09 43.65 -0.03 37.60 -0.33 -0.15 0.15J 47.60 -0.34 42.15 -1.53 37.35 -0.58 -0.82 0.82K 48.20 0.26 44.40 0.72 38.70 0.77 0.58 0.58L 48.30 0.36 43.86 0.18 38.16 0.23 0.26 0.26M 48.35 0.41 44.00 0.32 38.10 0.17 0.30 0.30N 48.00 0.06 43.00 -0.68 37.90 -0.03 -0.22 0.26O 47.73 -0.22 43.86 0.17 37.50 -0.43 -0.16 0.27Q 48.10 0.16 43.60 -0.08 38.00 0.07 0.05 0.11R 47.60 -0.34 43.95 0.27 37.45 -0.48 -0.18 0.36S 48.25 0.31 44.75 1.07 38.55 0.62 0.67 0.67
MEAN 47.94 43.68 37.93 0.46STDEV 0.28 0.72 0.43
Oil Rapid % (Clean Seed) Deviation from the Mean
Sample 1 Sample 2 Sample 3Mean of
Differences
Average Absolute
Difference
-2.00
-1.50
-1.00
-0.50
0.00
0.50
1.00
1.50
2.00
2.50
A B C D E F G H I J K L M N O Q R S
Oil
Rap
id %
Var
iatio
n
Oil Rapid % (Clean Seed) Deviation from the Mean Result
Sample 1
Sample 2
Sample 3
0.00
0.20
0.40
0.60
0.80
1.00
1.20
1.40
A B C D E F G H I J K L M N O Q R S
AA
D
Laboratory Code
Oil Rapid % (Clean Seed) Average Absolute Difference
!&#$$%
AOF_Results_Summary_2015.xls/6 - Results & Graphs Page 4 of 9
2015 AOF Test Check Program Round 4 Summary - May
Lab Result S1-Mean Result S2-Mean Result S3-MeanA 49.00 0.40 44.07 0.17 38.00 0.18 0.25 0.25BCD 49.31 0.71 45.08 1.18 38.19 0.37 0.75 0.75E 48.44 -0.16 44.30 0.41 38.23 0.41 0.22 0.32FGHIJ 46.80 -1.80 42.50 -1.40 37.30 -0.52 -1.24 1.24KLM 47.71 -0.89 44.71 0.82 37.75 -0.07 -0.05 0.59NO 48.46 -0.14 43.54 -0.36 37.41 -0.41 -0.30 0.30Q 48.92 0.32 43.08 -0.82 37.95 0.13 -0.12 0.42RS 48.35 -0.25 43.90 0.01 38.10 0.28 0.01 0.18
MEAN 48.60 43.90 37.82 0.51STDEV 0.53 0.84 0.35
Oil Solvent % (Clean Seed) Deviation from the MeanSample 1 Sample 2 Sample 3
Mean of Differences
Average Absolute
Difference
-2.00
-1.50
-1.00
-0.50
0.00
0.50
1.00
1.50
A B C D E F G H I J K L M N O Q R S
Oil
Solv
ent %
Var
iatio
n
Oil Solvent % (Clean Seed) Deviation from the Mean Result
Sample 1
Sample 2
Sample 3
0.00
0.20
0.40
0.60
0.80
1.00
1.20
1.40
A B C D E F G H I J K L M N O Q R S
AA
D
Laboratory Code
Oil Solvent % (Clean Seed) Average Absolute Difference

AOF_Results_Summary_2015.xls/6 - Results & Graphs Page 5 of 9
2015 AOF Test Check Program Round 4 Summary - May
Lab Result S1-Mean Result S2-Mean Result S3-MeanA 4.69 0.07 5.44 0.06 7.84 0.00 0.04 0.04BC 5.40 0.78 6.15 0.77 8.25 0.42 0.66 0.66
D 4.35 -0.28 4.98 -0.40 7.46 -0.38 -0.35 0.35
E 4.65 0.03 5.50 0.12 7.80 -0.03 0.04 0.06FGHIJ 4.95 0.33 5.70 0.32 8.10 0.27 0.31 0.31K 4.25 -0.37 5.21 -0.17 7.55 -0.29 -0.28 0.28L 4.58 -0.05 5.47 0.09 7.80 -0.04 0.00 0.06M 4.43 -0.19 5.27 -0.11 7.59 -0.24 -0.18 0.18NO 4.60 -0.02 5.39 0.01 7.53 -0.31 -0.11 0.11Q 5.00 0.38 5.74 0.36 8.35 0.52 0.42 0.42R 4.65 0.03 5.00 -0.38 7.60 -0.23 -0.19 0.21S 4.70 0.08 5.50 0.12 8.15 0.32 0.17 0.17
MEAN 4.62 5.38 7.83 0.24STDEV 0.23 0.25 0.31
Moisture Oven % Deviation from the MeanSample 1 Sample 2 Sample 3
Mean of Differences
Average Absolute
Difference
-0.60
-0.40
-0.20
0.00
0.20
0.40
0.60
0.80
1.00
A B C D E F G H I J K L M N O Q R S
Moi
stur
e O
ven
% V
aria
tion
Moisture Oven % Deviation from the Mean Result
Sample 1
Sample 2
Sample 3
0.00
0.10
0.20
0.30
0.40
0.50
0.60
0.70
A B C D E F G H I J K L M N O Q R S
AA
D
Laboratory Code
Moisture Oven % Average Absolute Difference
AOF_Results_Summary_2015.xls/6 - Results & Graphs Page 6 of 9
2015 AOF Test Check Program Round 4 Summary - May
Lab Result S1-Mean Result S2-Mean Result S3-MeanABCD 4.35 0.04 5.00 -0.37 7.50 -0.24 -0.19 0.22
E 5.10 0.79 5.60 0.23 7.75 0.01 0.34 0.34
FG 4.30 -0.01 5.55 0.18 8.00 0.26 0.14 0.15H 5.45 1.14 5.35 -0.02 6.55 -1.19 -0.02 0.79I 5.10 0.79 5.80 0.43 8.00 0.26 0.49 0.49J 4.30 -0.01 5.35 -0.02 7.30 -0.44 -0.16 0.16K 3.95 -0.36 5.05 -0.32 7.35 -0.39 -0.36 0.36L 4.11 -0.20 5.18 -0.19 7.94 0.20 -0.07 0.20M 4.35 0.04 5.65 0.28 7.80 0.06 0.13 0.13N 4.40 0.09 5.20 -0.17 7.90 0.16 0.03 0.14O 4.37 0.06 5.26 -0.11 7.72 -0.03 -0.03 0.07Q 4.30 -0.01 5.35 -0.02 7.95 0.21 0.06 0.08R 4.35 0.04 4.95 -0.42 7.50 -0.24 -0.21 0.24S 4.60 0.29 5.95 0.58 7.95 0.21 0.36 0.36
MEAN 4.31 5.37 7.74 0.27STDEV 0.16 0.30 0.25
Moisture Rapid % Deviation from the MeanSample 1 Sample 2 Sample 3
Mean of Differences
Average Absolute
Difference
-1.50
-1.00
-0.50
0.00
0.50
1.00
1.50
A B C D E F G H I J K L M N O Q R S
Moi
stur
e R
apid
% V
aria
tion
Sample Number
Moisture Rapid % Deviation from the Mean Result
Sample 1
Sample 2
Sample 3
0.00
0.05
0.10
0.15
0.20
0.25
0.30
0.35
0.40
0.45
0.50
0.55
0.60
0.65
0.70
0.75
0.80
0.85
A B C D E F G H I J K L M N O Q R S
AA
D
Laboratory Code
Moisture Rapid % Average Absolute Difference
AOF_Results_Summary_2015.xls/6 - Results & Graphs Page 7 of 9
2015 AOF Test Check Program Round 4 Summary - May
Lab Result S1-Mean Result S2-Mean Result S3-MeanA 59.06 -1.51 67.81 -2.27 63.59 -1.78 -1.85 1.85BCD 60.76 0.19 70.25 0.17 66.19 0.81 0.39 0.39E
F
GHIJKLM 60.49 -0.08 70.08 0.00 65.40 0.03 -0.02 0.04NOQ 60.73 0.16 70.74 0.66 65.10 -0.27 0.18 0.36RS 60.30 -0.27 69.25 -0.83 64.80 -0.57 -0.56 0.56
MEAN 60.57 70.08 65.37 0.64STDEV 0.22 0.62 0.60
Oleic % Oil Deviation from the MeanSample 1 Sample 2 Sample 3
Mean of Differences
Average Absolute
Difference
-2.50
-2.00
-1.50
-1.00
-0.50
0.00
0.50
1.00
A B C D E F G H I J K L M N O Q R S
Ole
ic %
Oil
Varia
tion
Oleic % Oil Deviation from the Mean Result
Sample 1
Sample 2
Sample 3
0.00
0.20
0.40
0.60
0.80
1.00
1.20
1.40
1.60
1.80
2.00
A B C D E F G H I J K L M N O Q R S
AA
D
Laboratory Code
Oleic % Oil Average Absolute Difference
AOF_Results_Summary_2015.xls/6 - Results & Graphs Page 8 of 9
2015 AOF Test Check Program Round 4 Summary - May
Lab Result S1-Mean Result S2-Mean Result S3-MeanA 22.21 0.29 14.06 0.50 18.09 0.12 0.30 0.30BCD 21.85 -0.07 13.49 -0.07 17.48 -0.49 -0.21 0.21EF
G
HIJK 21.26 -0.66 13.35 -0.21 18.04 0.07 -0.27 0.31LM 21.71 -0.22 13.31 -0.25 17.57 -0.40 -0.29 0.29NOQ 22.29 0.36 13.09 -0.47 18.24 0.27 0.06 0.37RS 22.30 0.37 13.80 0.24 18.00 0.03 0.22 0.22
MEAN 21.93 13.56 17.97 0.28STDEV 0.49 0.38 0.29
Sample 3Mean of
Differences
Average Absolute
Difference
Linoleic % Oil Deviation from the MeanSample 1 Sample 2
-0.80
-0.60
-0.40
-0.20
0.00
0.20
0.40
0.60
A B C D E F G H I J K L M N O Q R S
Lino
leic
% O
il Va
riatio
n
Linoleic % Oil Deviation from the Mean Result
Sample 1
Sample 2
Sample 3
0.00
0.05
0.10
0.15
0.20
0.25
0.30
0.35
0.40
A B C D E F G H I J K L M N O Q R S
AA
D
Laboratory Code
Linoleic % Oil Average Absolute Difference

AOF_Results_Summary_2015.xls/6 - Results & Graphs Page 9 of 9
2015 AOF Test Check Program Round 4 Summary - May
Lab Result S1-Mean Result S2-Mean Result S3-MeanA 0.04 -0.17 0.05 -0.09 0.14 -0.25 -0.17 0.17BCD 0.33 0.11 0.13 -0.02 0.59 0.21 0.10 0.11EFG
H
IJ 0.37 0.16 0.18 0.04 0.18 -0.21 -0.01 0.13K 0.50 0.28 0.70 0.55 0.79 0.41 0.41 0.41LM 0.12 -0.09 0.18 0.03 0.29 -0.09 -0.05 0.07NO 0.10 -0.11 0.09 -0.05 0.16 -0.22 -0.13 0.13Q 0.30 0.09 0.28 0.14 0.28 -0.10 0.04 0.11RS 0.12 -0.09 0.10 -0.04 0.45 0.06 -0.03 0.07
MEAN 0.21 0.14 0.38 0.15STDEV 0.16 0.08 0.24
Free Fatty Acid % Oil Deviation from the MeanSample 1 Sample 2 Sample 3
Mean of Differences
Average Absolute
Difference
-0.30
-0.20
-0.10
0.00
0.10
0.20
0.30
0.40
0.50
0.60
A B C D E F G H I J K L M N O Q R S
Free
Fat
ty A
cid
% O
il Va
riatio
n
Free Fatty Acid % Oil Deviation from the Mean Result
Sample 1
Sample 2
Sample 3
0.00
0.05
0.10
0.15
0.20
0.25
0.30
0.35
0.40
0.45
A B C D E F G H I J K L M N O Q R S
AA
D
Laboratory Code
Free Fatty Acid % oil Average Absolute Difference