rough proportionality – it’s state law! · rough proportionality – it’s state law!...
TRANSCRIPT

Rough Proportionality – It’s State Law!
Presentation by: Dan Sefko, FAICP, Freese and Nichols, Inc.
Edmund Haas, AICP, Freese and Nichols, Inc. Alan D. Greer, P.E., Freese and Nichols, Inc.
Texas APA Conference February 6, 2009

Discussion Agenda:
1.
Introduction
2.
Why are we here?
3.
Legal Considerations
4.
Roadway proportionality
5.
Water and Wastewater proportionality
6.
Drainage proportionality
7.
Closing Comments
Why Are We Here?A long time ago, in a galaxy (State) far, far way…
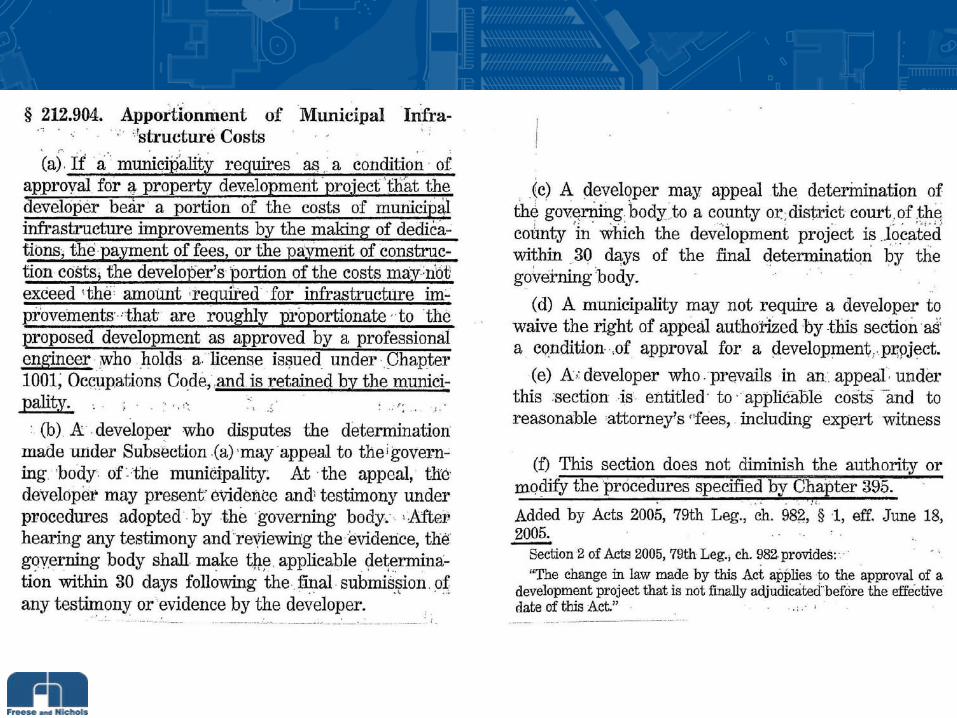
…We ended up with Chapter 212.904 of the Texas Local Government Code.
Although enacted in 2005, cities are just now beginning to experience the impact of this law (similar to many of our state
laws affecting cities).
We have addressed proportionality changes in several DFW cities.
So…what are the issues facing cities?
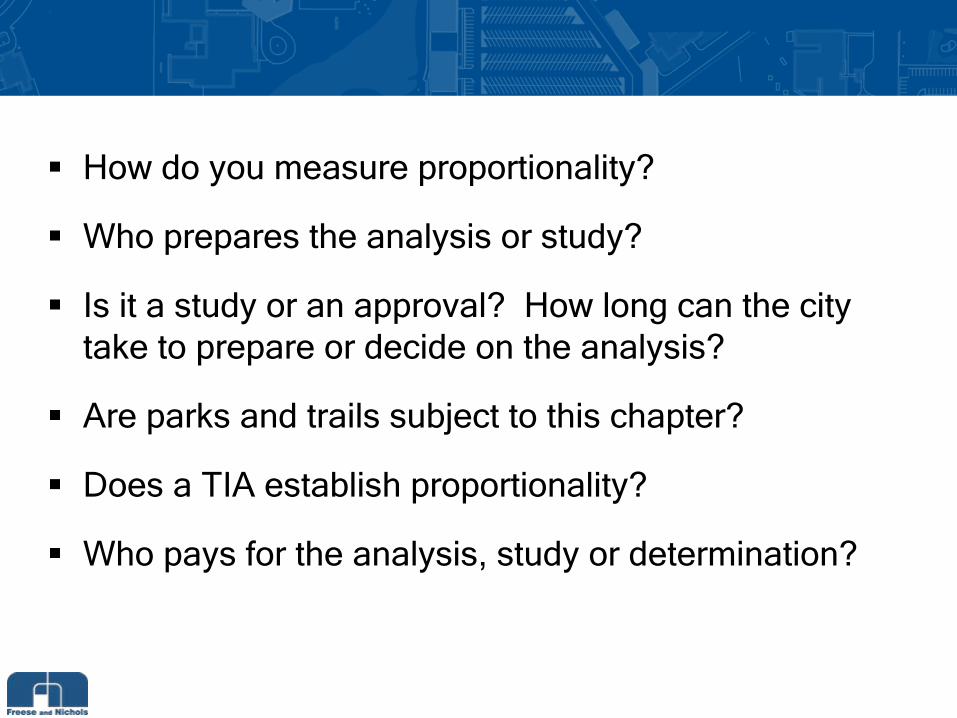
How do you measure proportionality?
Who prepares the analysis or study?
Is it a study or an approval? How long can the city take to prepare or decide on the analysis?
Are parks and trails subject to this chapter?
Does a TIA establish proportionality?
Who pays for the analysis, study or determination?
What if you already have impact fees under Chapter 395? What if you do not?
If your subdivision regulations require it (i.e., it is on-site) are you still subject to proportionality?
Where should your proportionality processes be located?
How do pre-existing drainage laws affect proportionality requirements?
Legal Aspects of Rough Proportionality
Proportionality is a legal concept that must be translated into a concrete set of rules and procedures Every development exaction is subject to test
Legal Issue of Rough ProportionalityThat Should be Discussed with Your Attorney
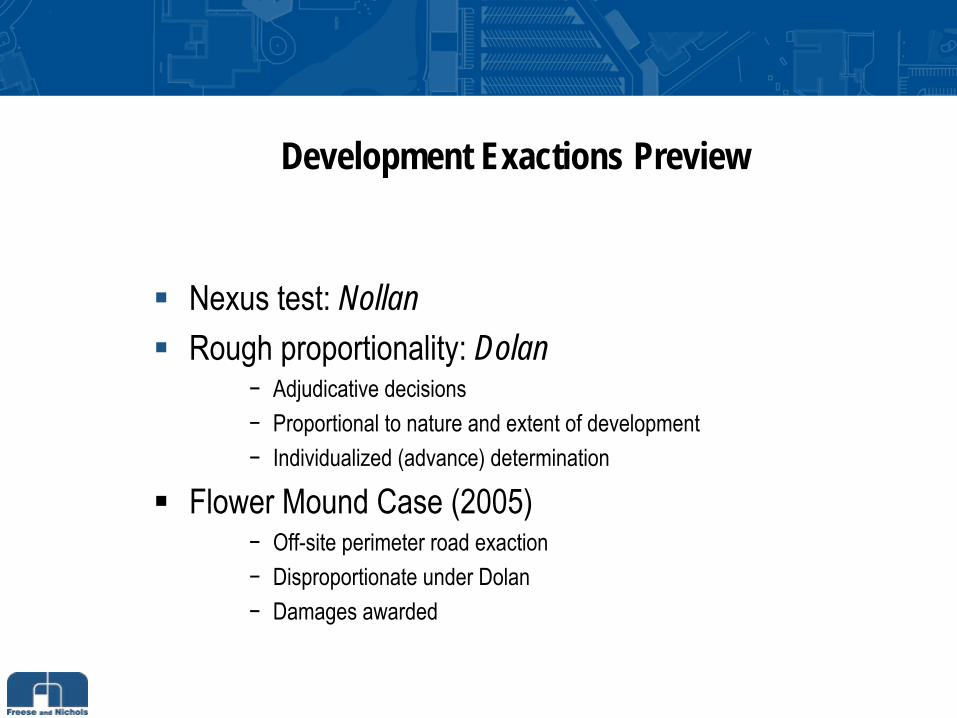
Development Exactions Preview
Nexus test: NollanRough proportionality: Dolan
−
Adjudicative decisions−
Proportional to nature and extent of development−
Individualized (advance) determination
Flower Mound Case (2005)−
Off-site perimeter road exaction−
Disproportionate under Dolan−
Damages awarded

Proportionality Statute TLGC sec. 212.904
2005 Law implementing Flower MoundApplies to exactions of land, facilities or feesNo limitation to off-site improvementsApplies to all types of facilitiesCity engineer initially must make proportionality determination
Proportionality Statute cont’d
Automatic right of appeal to City Council•
Council must make decision 30 days after hearingAppeal to District or County CourtCity can’t require waiver as conditionDoesn’t affect authority or procedures under ch. 395
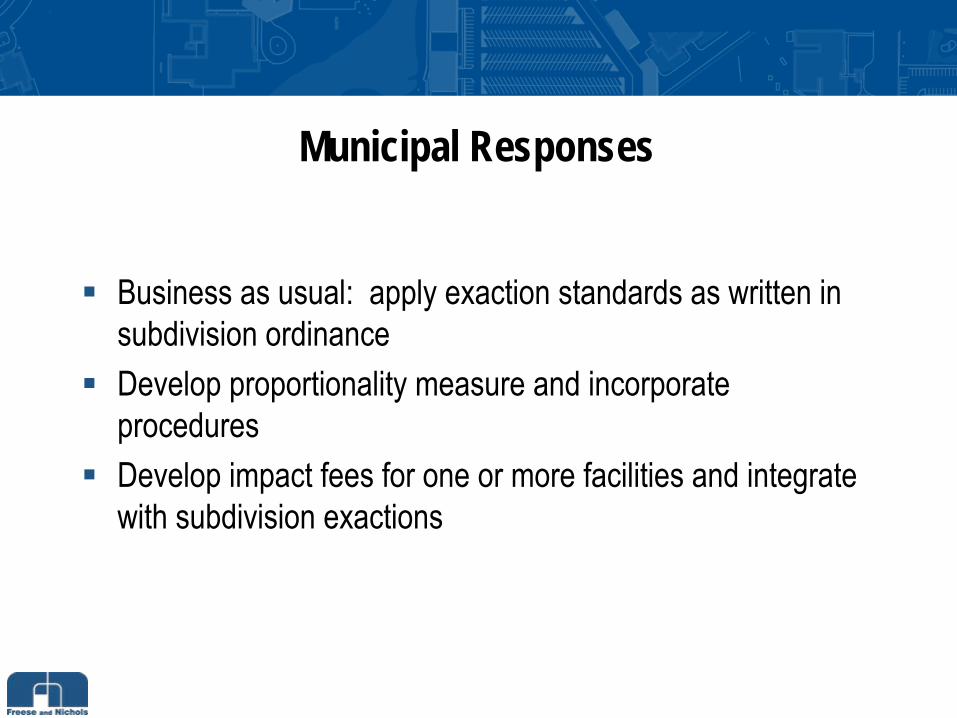
Municipal Responses
Business as usual: apply exaction standards as written in subdivision ordinanceDevelop proportionality measure and incorporate proceduresDevelop impact fees for one or more facilities and integrate with subdivision exactions
Roadway Proportionality
Presented by: Eddie Haas, AICPFreese and Nichols, Inc.Sefko Planning Group
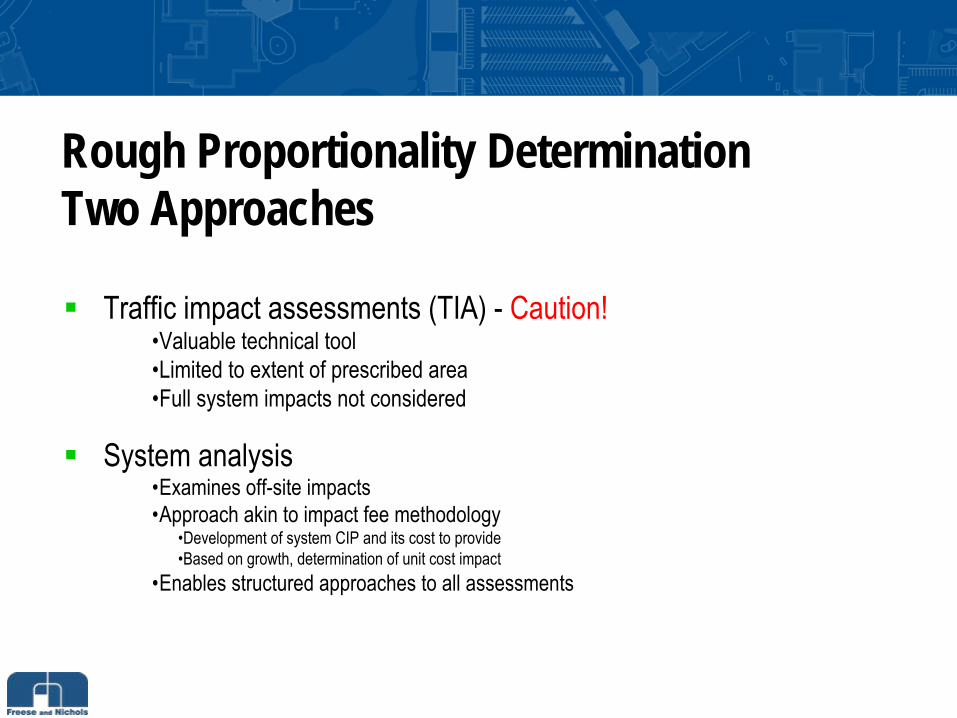
Rough Proportionality DeterminationTwo ApproachesRough Proportionality DeterminationTwo Approaches
Traffic impact assessments (TIA) - Caution!•Valuable technical tool•Limited to extent of prescribed area•Full system impacts not considered
System analysis•Examines off-site impacts•Approach akin to impact fee methodology
•Development of system CIP and its cost to provide•Based on growth, determination of unit cost impact
•Enables structured approaches to all assessments
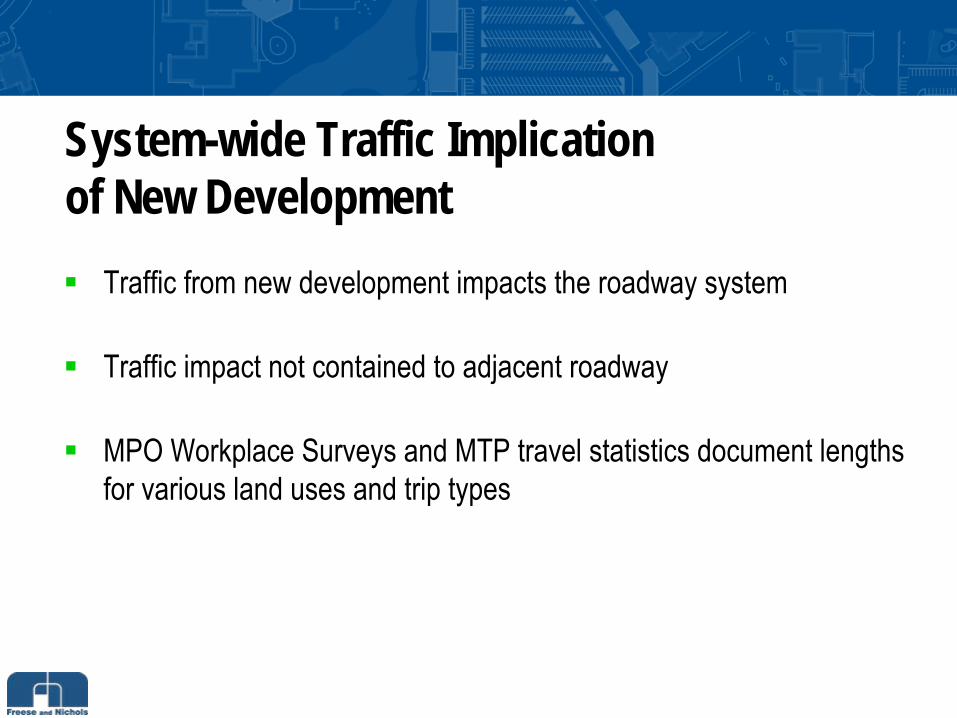
System-wide Traffic Implication of New DevelopmentSystem-wide Traffic Implication of New Development
Traffic from new development impacts the roadway system
Traffic impact not contained to adjacent roadway
MPO Workplace Surveys and MTP travel statistics document lengthsfor various land uses and trip types
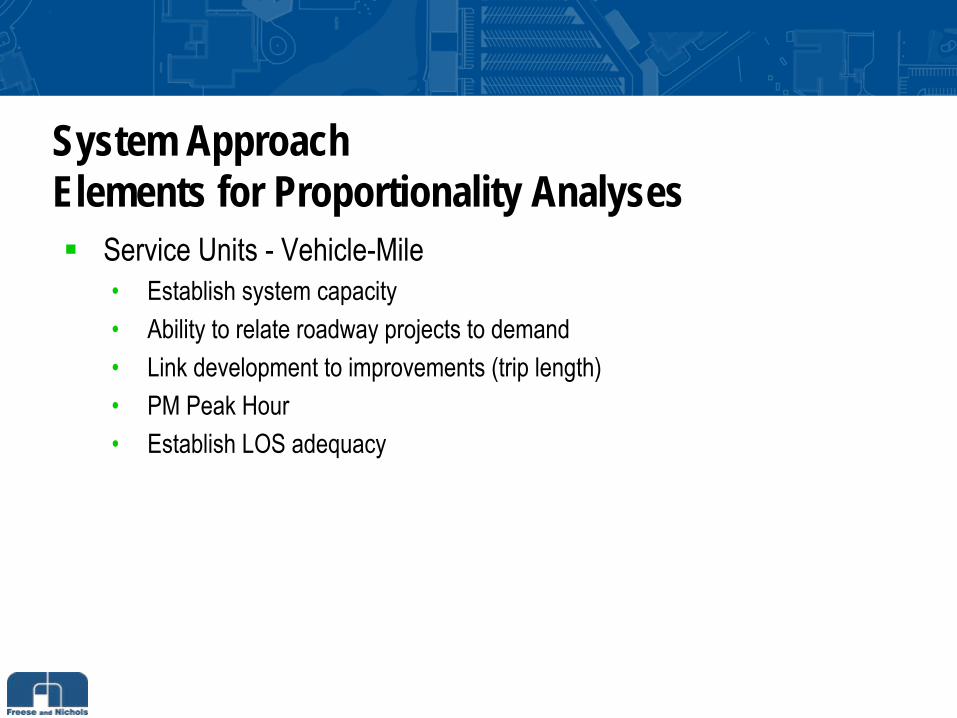
Service Units - Vehicle-Mile•
Establish system capacity •
Ability to relate roadway projects to demand•
Link development to improvements (trip length)•
PM Peak Hour•
Establish LOS adequacy
System ApproachElements for Proportionality AnalysesSystem ApproachElements for Proportionality Analyses
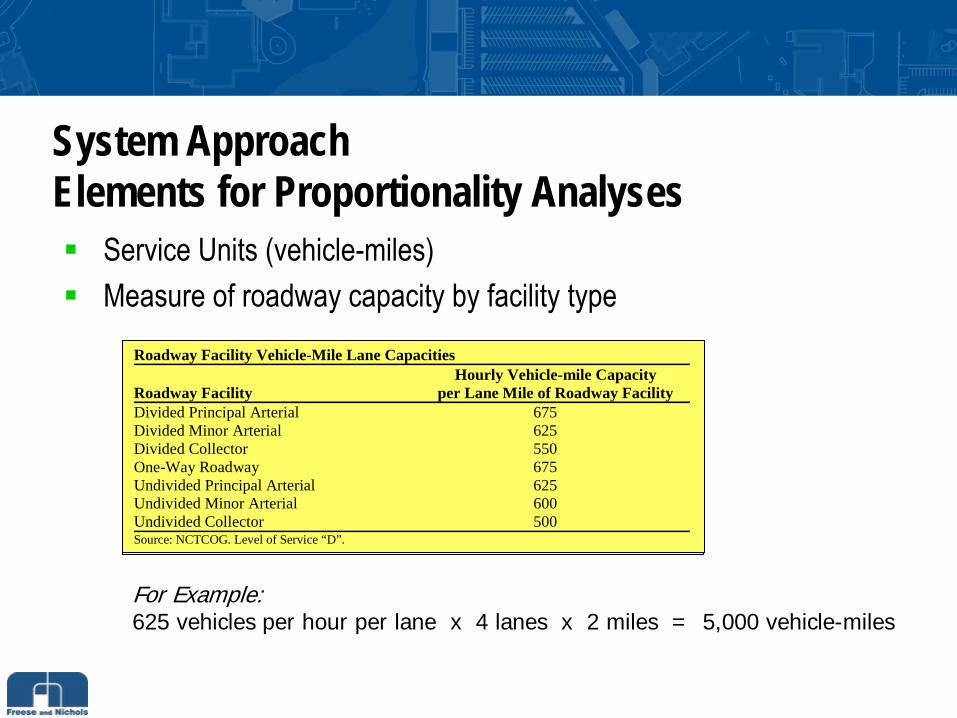
Service Units (vehicle-miles)Measure of roadway capacity by facility type
For Example:625 vehicles per hour per lane x 4 lanes x 2 miles = 5,000 vehicle-miles
Roadway Facility Vehicle-Mile Lane Capacities Hourly Vehicle-mile Capacity Roadway Facility per Lane Mile of Roadway Facility Divided Principal Arterial 675 Divided Minor Arterial 625 Divided Collector 550 One-Way Roadway 675 Undivided Principal Arterial 625 Undivided Minor Arterial 600 Undivided Collector 500 Source: NCTCOG. Level of Service “D”.
System ApproachElements for Proportionality AnalysesSystem ApproachElements for Proportionality Analyses
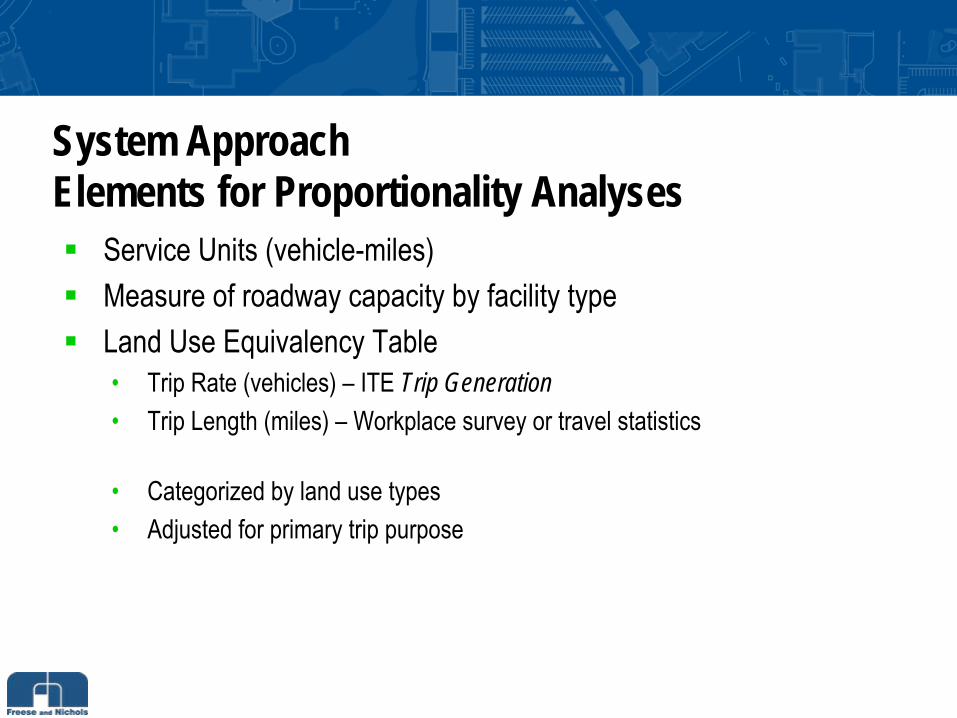
Service Units (vehicle-miles)Measure of roadway capacity by facility typeLand Use Equivalency Table•
Trip Rate (vehicles) –
ITE Trip Generation•
Trip Length (miles) –
Workplace survey or travel statistics
•
Categorized by land use types•
Adjusted for primary trip purpose
System ApproachElements for Proportionality AnalysesSystem ApproachElements for Proportionality Analyses
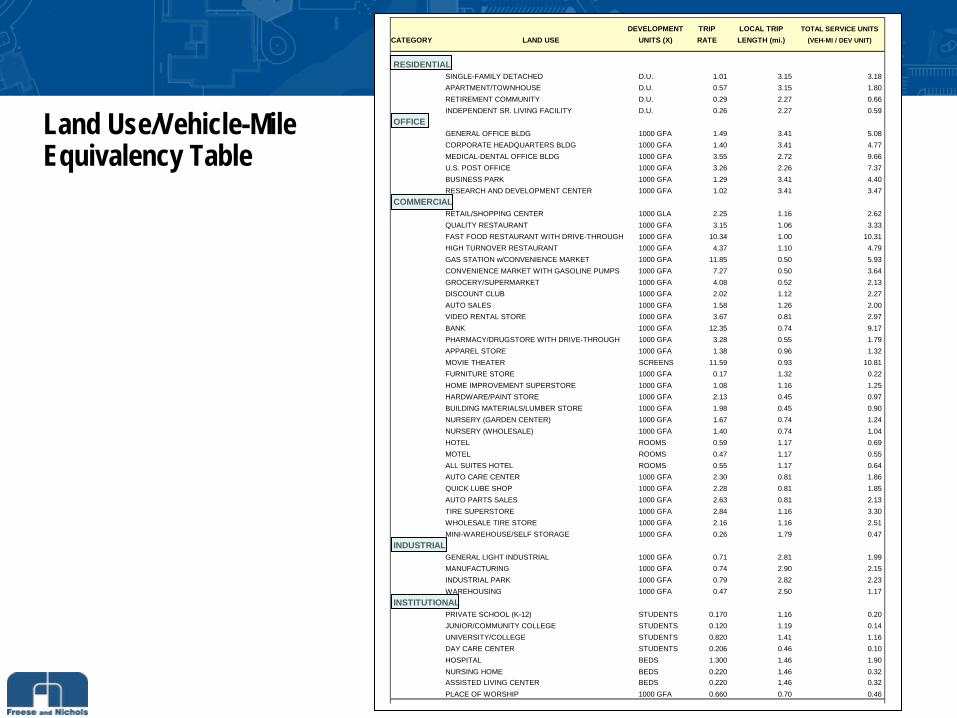
DEVELOPMENT TRIP LOCAL TRIP TOTAL SERVICE UNITSCATEGORY LAND USE UNITS (X) RATE LENGTH (mi.) (VEH-MI / DEV UNIT)
LOCALIZED RESIDENTIAL
SINGLE-FAMILY DETACHED D.U. 1.01 3.15 3.18APARTMENT/TOWNHOUSE D.U. 0.57 3.15 1.80RETIREMENT COMMUNITY D.U. 0.29 2.27 0.66INDEPENDENT SR. LIVING FACILITY D.U. 0.26 2.27 0.59
OFFICEGENERAL OFFICE BLDG 1000 GFA 1.49 3.41 5.08CORPORATE HEADQUARTERS BLDG 1000 GFA 1.40 3.41 4.77MEDICAL-DENTAL OFFICE BLDG 1000 GFA 3.55 2.72 9.66U.S. POST OFFICE 1000 GFA 3.26 2.26 7.37BUSINESS PARK 1000 GFA 1.29 3.41 4.40RESEARCH AND DEVELOPMENT CENTER 1000 GFA 1.02 3.41 3.47
COMMERCIAL66% RETAIL/SHOPPING CENTER 1000 GLA 2.25 1.16 2.6258% QUALITY RESTAURANT 1000 GFA 3.15 1.06 3.3359% FAST FOOD RESTAURANT WITH DRIVE-THROUGH 1000 GFA 10.34 1.00 10.3160% HIGH TURNOVER RESTAURANT 1000 GFA 4.37 1.10 4.7988% GAS STATION w/CONVENIENCE MARKET 1000 GFA 11.85 0.50 5.9389% CONVENIENCE MARKET WITH GASOLINE PUMPS 1000 GFA 7.27 0.50 3.64
GROCERY/SUPERMARKET 1000 GFA 4.08 0.52 2.13DISCOUNT CLUB 1000 GFA 2.02 1.12 2.27AUTO SALES 1000 GFA 1.58 1.26 2.00VIDEO RENTAL STORE 1000 GFA 3.67 0.81 2.97
73% BANK 1000 GFA 12.35 0.74 9.1762% PHARMACY/DRUGSTORE WITH DRIVE-THROUGH 1000 GFA 3.28 0.55 1.79
APPAREL STORE 1000 GFA 1.38 0.96 1.32MOVIE THEATER SCREENS 11.59 0.93 10.81
64% FURNITURE STORE 1000 GFA 0.17 1.32 0.2256% HOME IMPROVEMENT SUPERSTORE 1000 GFA 1.08 1.16 1.25
HARDWARE/PAINT STORE 1000 GFA 2.13 0.45 0.97BUILDING MATERIALS/LUMBER STORE 1000 GFA 1.98 0.45 0.90NURSERY (GARDEN CENTER) 1000 GFA 1.67 0.74 1.24NURSERY (WHOLESALE) 1000 GFA 1.40 0.74 1.04HOTEL ROOMS 0.59 1.17 0.69MOTEL ROOMS 0.47 1.17 0.55
ALL SUITES HOTEL ROOMS 0.55 1.17 0.64AUTO CARE CENTER 1000 GFA 2.30 0.81 1.86QUICK LUBE SHOP 1000 GFA 2.28 0.81 1.85AUTO PARTS SALES 1000 GFA 2.63 0.81 2.13
32% TIRE SUPERSTORE 1000 GFA 2.84 1.16 3.30WHOLESALE TIRE STORE 1000 GFA 2.16 1.16 2.51MINI-WAREHOUSE/SELF STORAGE 1000 GFA 0.26 1.79 0.47
INDUSTRIAL GENERAL LIGHT INDUSTRIAL 1000 GFA 0.71 2.81 1.99MANUFACTURING 1000 GFA 0.74 2.90 2.15INDUSTRIAL PARK 1000 GFA 0.79 2.82 2.23WAREHOUSING 1000 GFA 0.47 2.50 1.17
INSTITUTIONAL PRIVATE SCHOOL (K-12) STUDENTS 0.170 1.16 0.20JUNIOR/COMMUNITY COLLEGE STUDENTS 0.120 1.19 0.14UNIVERSITY/COLLEGE STUDENTS 0.820 1.41 1.16DAY CARE CENTER STUDENTS 0.206 0.46 0.10HOSPITAL BEDS 1.300 1.46 1.90NURSING HOME BEDS 0.220 1.46 0.32ASSISTED LIVING CENTER BEDS 0.220 1.46 0.32PLACE OF WORSHIP 1000 GFA 0.660 0.70 0.46
Land Use/Vehicle-MileEquivalency Table
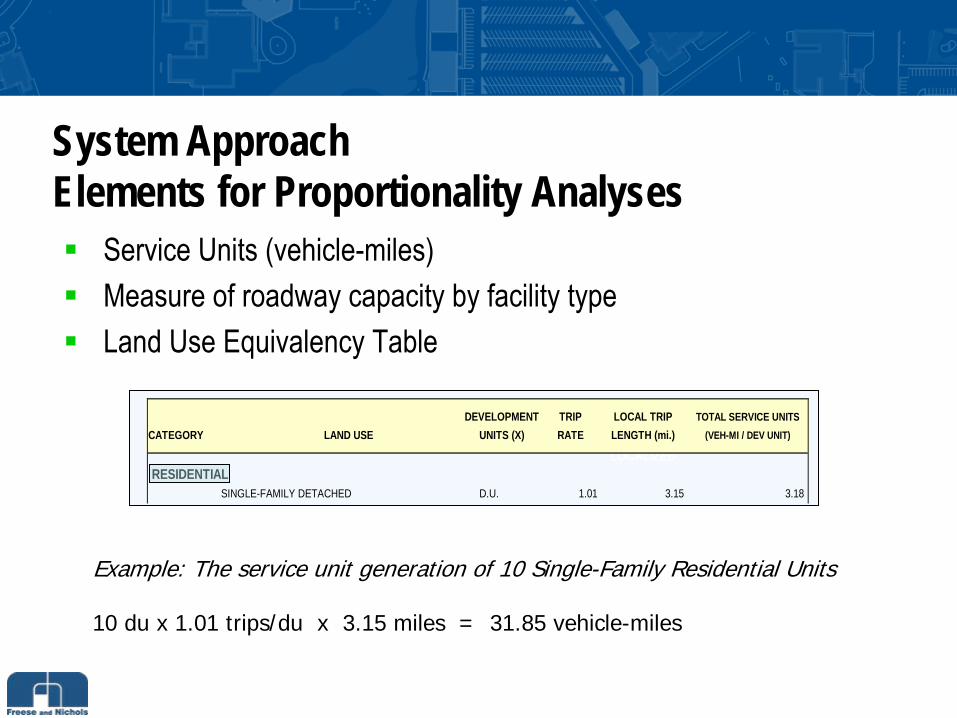
Service Units (vehicle-miles)Measure of roadway capacity by facility typeLand Use Equivalency Table
DEVELOPMENT TRIP LOCAL TRIP TOTAL SERVICE UNITSCATEGORY LAND USE UNITS (X) RATE LENGTH (mi.) (VEH-MI / DEV UNIT)
LOCALIZED RESIDENTIAL
SINGLE-FAMILY DETACHED D.U. 1.01 3.15 3.18
Example: The service unit generation of 10 Single-Family Residential Units
10 du x 1.01 trips/du x 3.15 miles = 31.85 vehicle-miles
System ApproachElements for Proportionality AnalysesSystem ApproachElements for Proportionality Analyses

Proportionality ApplicationsProportionality Applications
Roadway Dedication (VMT supply vs. VMT demand assessment)
Cost Approach•
Cost of improvements vs. system impact
•
Land dedication: cost of dedication vs. cost of service
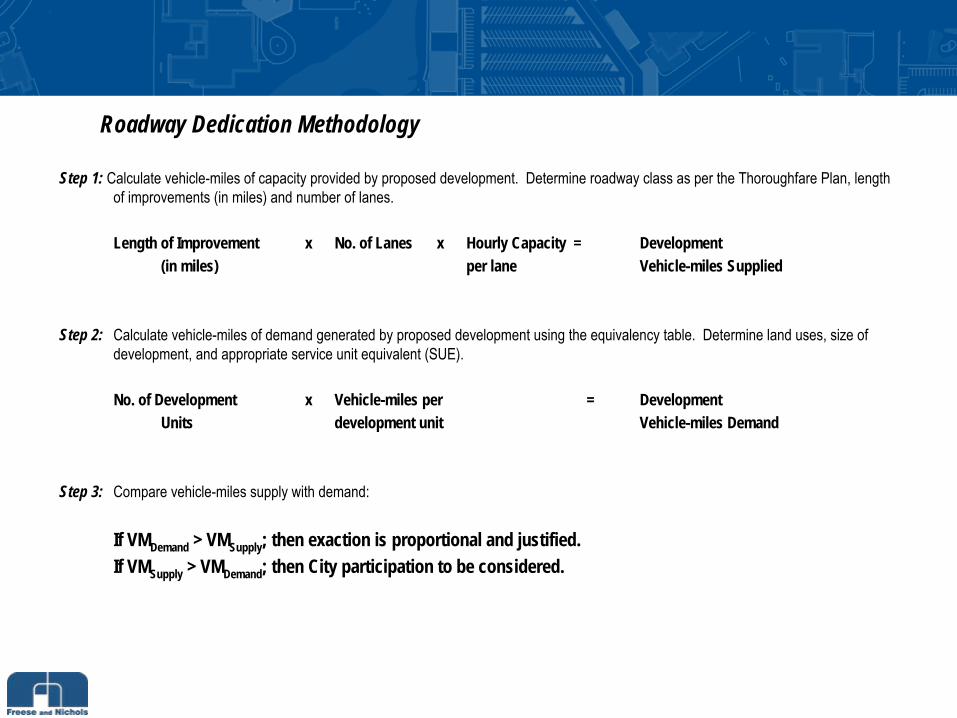
Roadway Dedication MethodologyRoadway Dedication Methodology
Step 1: Calculate vehicle-miles of capacity provided by proposed development. Determine roadway class as per the Thoroughfare Plan, length of improvements (in miles) and number of lanes.
Length of Improvement x No. of Lanes x Hourly Capacity = Development(in miles) per lane Vehicle-miles Supplied
Step 2: Calculate vehicle-miles of demand generated by proposed development using the equivalency table. Determine land uses, size of development, and appropriate service unit equivalent (SUE).
No. of Development x Vehicle-miles per = DevelopmentUnits development unit Vehicle-miles Demand
Step 3: Compare vehicle-miles supply with demand:
If VMDemand > VMSupply ; then exaction is proportional and justified.If VMSupply > VMDemand ; then City participation to be considered.
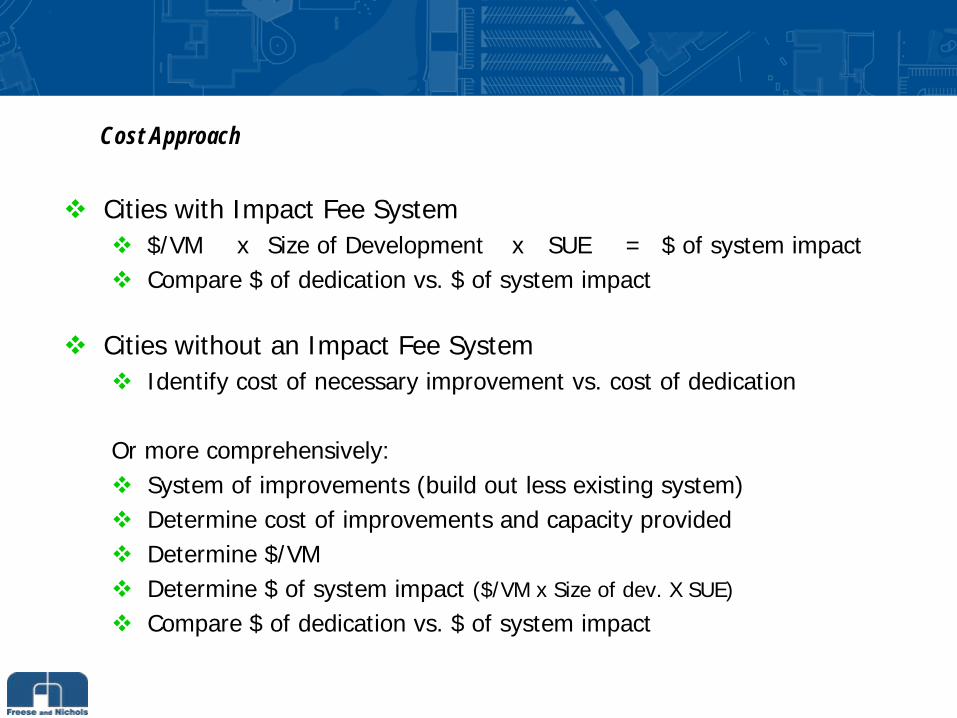
Cost ApproachCost Approach
Cities with Impact Fee System$/VM x Size of Development x SUE = $ of system impactCompare $ of dedication vs. $ of system impact
Cities without an Impact Fee SystemIdentify cost of necessary improvement vs. cost of dedication
Or more comprehensively:System of improvements (build out less existing system)Determine cost of improvements and capacity providedDetermine $/VMDetermine $ of system impact ($/VM x Size of dev. X SUE)
Compare $ of dedication vs. $ of system impact

Case Study 1: Mapleshade TractCase Study 1: Mapleshade TractProposed Development165,582.45 square feet of retail uses
15.2 ac.
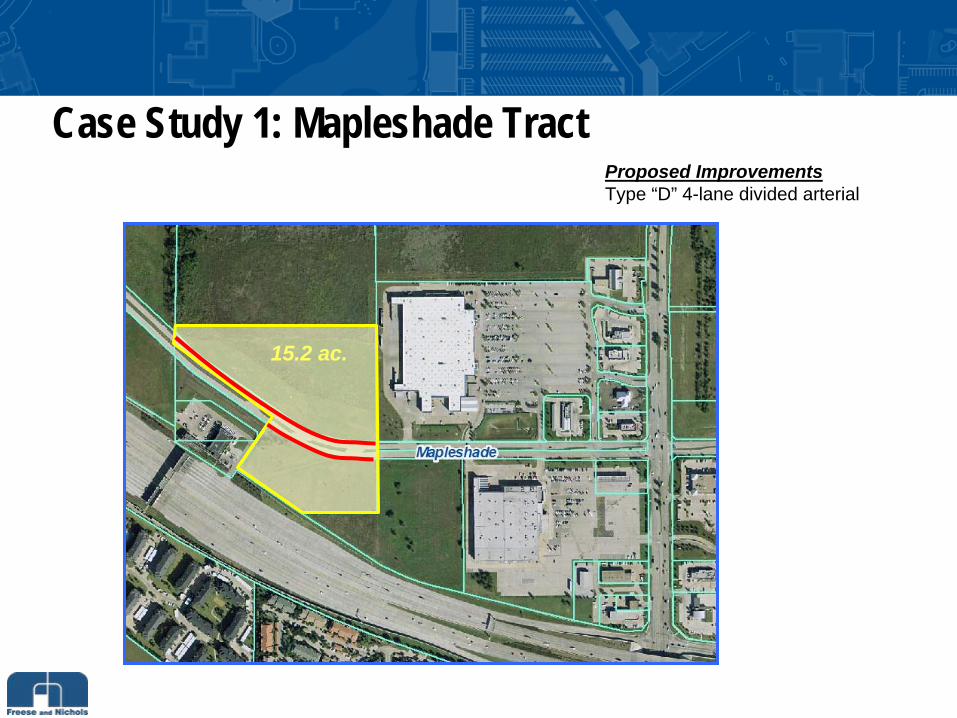
Case Study 1: Mapleshade TractCase Study 1: Mapleshade TractProposed ImprovementsType “D” 4-lane divided arterial
15.2 ac.

Case Study 1: Mapleshade TractCase Study 1: Mapleshade TractProportionality Calculation
Step 1: Vehicle-Miles of Capacity SuppliedMapleshade
Lane; 4-lane divided roadway, 1,250’
(1,250’/5,280’/mi) x 4 lanes x 625 veh/lane = 591.85Less (623.29’/5,280’/mi) x 2 lanes x 625 veh/lane =-147.56 Total vehicle-miles supplied
444.29 vms
Step 2: Vehicle-Miles of Demand Generated by the Site
165,582.45 SF x 2.25 trips/1,000 SF of dev. x 1.28 miles
= 476.877Total vehicle-miles of demand
476.877 vmd
Step 3: Supply/Demand Comparison
476.877 vmd > 444.29 vmsThe projected demand of the site is greater than supply provided; therefore the exaction by the City is proportional and justified.
15.2 ac.

Case Study 2: Liberty Cypress Business ParkCase Study 2: Liberty Cypress Business ParkProposed Development190,871 square feet of office park
22.2 ac.
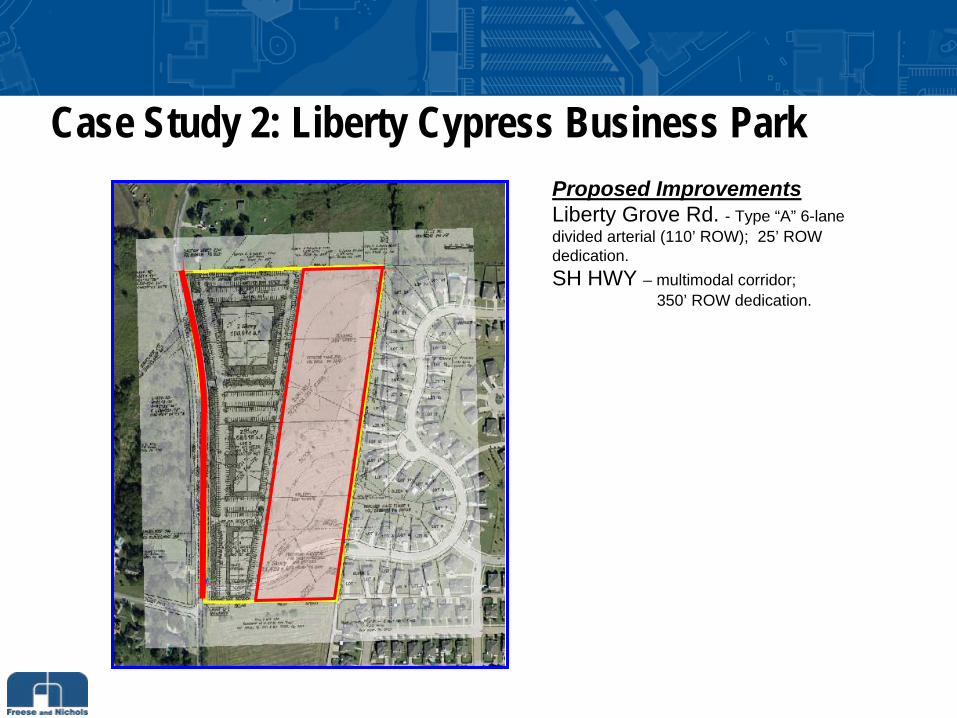
Proposed ImprovementsLiberty Grove Rd. - Type “A” 6-lane divided arterial (110’ ROW); 25’ ROW dedication.SH HWY – multimodal corridor;
350’ ROW dedication.
Case Study 2: Liberty Cypress Business ParkCase Study 2: Liberty Cypress Business Park
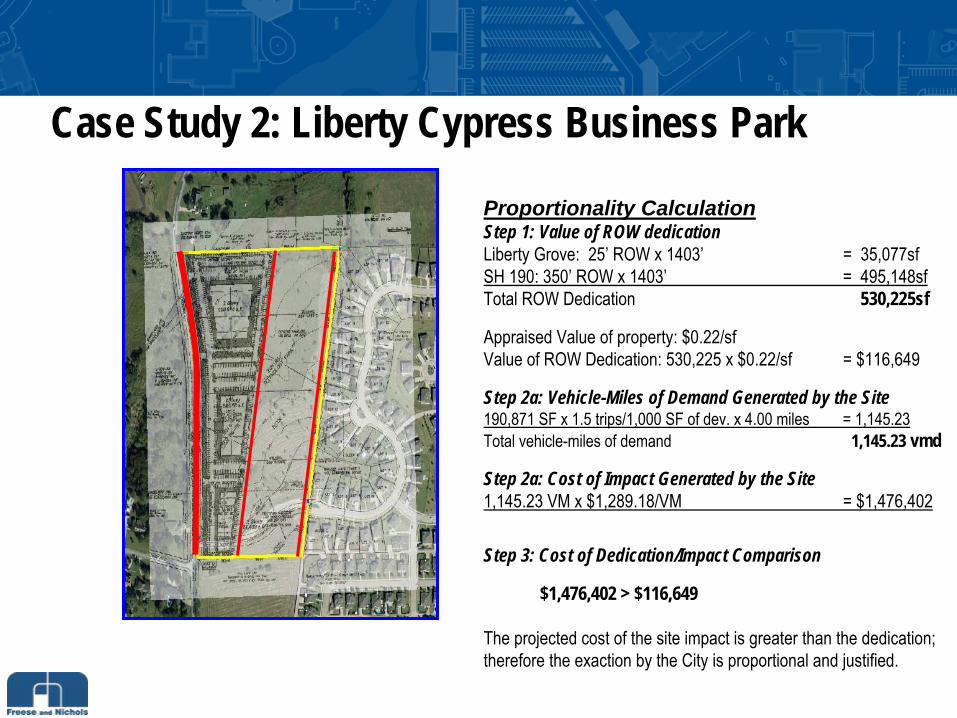
Proportionality CalculationStep 1: Value of ROW dedicationLiberty Grove: 25’
ROW x 1403’
= 35,077sfSH 190: 350’
ROW x 1403’
= 495,148sfTotal ROW Dedication
530,225sf
Appraised Value of property: $0.22/sfValue of ROW Dedication: 530,225 x $0.22/sf
= $116,649
Step 2a: Vehicle-Miles of Demand Generated by the Site190,871 SF x 1.5 trips/1,000 SF of dev. x 4.00 miles
= 1,145.23Total vehicle-miles of demand
1,145.23 vmd
Step 2a: Cost of Impact Generated by the Site1,145.23 VM x $1,289.18/VM = $1,476,402
Step 3: Cost of Dedication/Impact Comparison
$1,476,402 > $116,649
The projected cost of the site impact is greater than the dedication; therefore the exaction by the City is proportional and justified.
Case Study 2: Liberty Cypress Business ParkCase Study 2: Liberty Cypress Business Park
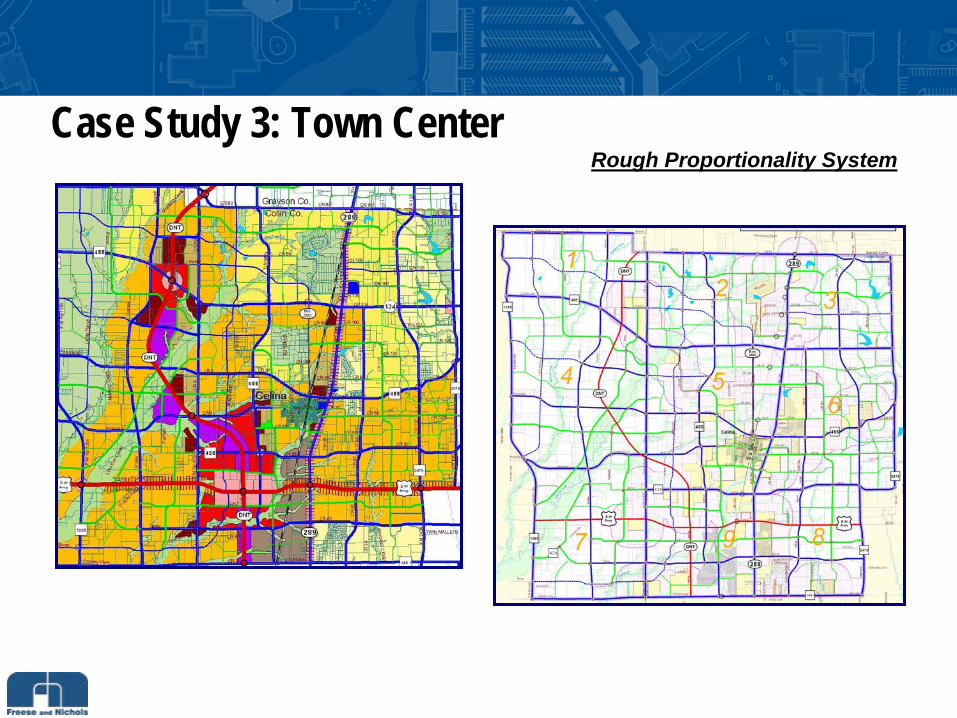
Case Study 3: Town CenterCase Study 3: Town CenterRough Proportionality System
15.2 ac.
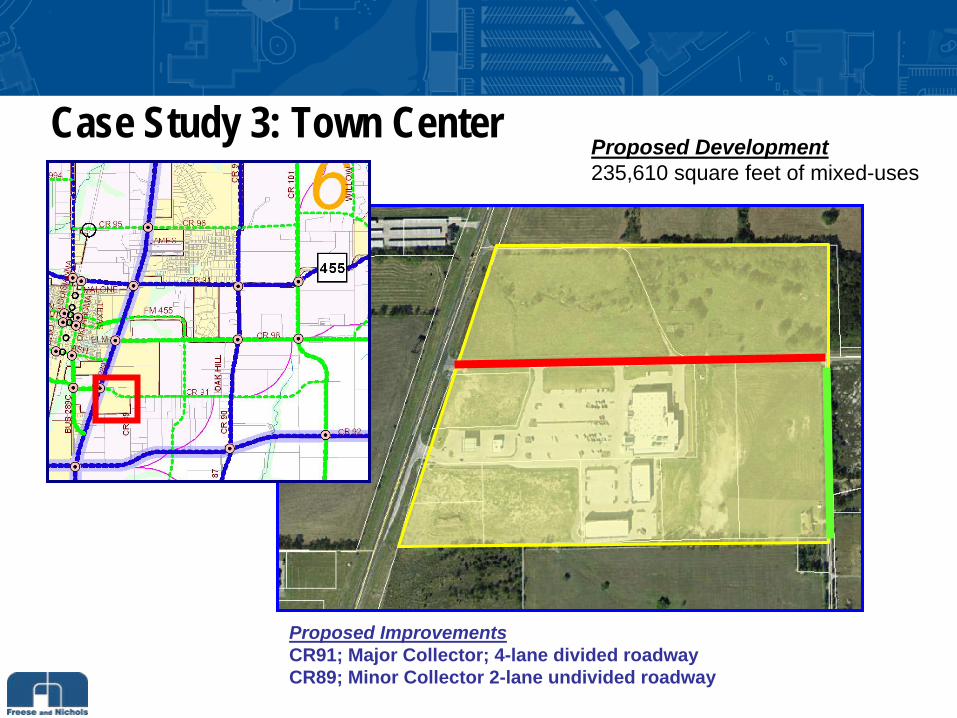
Case Study 3: Town CenterCase Study 3: Town CenterProposed Development235,610 square feet of mixed-uses
Proposed ImprovementsCR91; Major Collector; 4-lane divided roadwayCR89; Minor Collector 2-lane undivided roadway

Case Study 3: Town CenterCase Study 3: Town Center Proportionality CalculationStep 1: Vehicle-Miles of Capacity Supplied
CR91; 4-lane divided roadway, 1,488.06 linear feet (1,488’/5,280’/mi) x 4 lanes x 550 veh/lane
=
620.02Less Portion of Brookshire’s(718.30’/5,280’/mi) x 2 lanes x 550 veh/lane
=
-149.64CR89; 2-lane undivided roadway, 692.44 linear feet (692.44’/5,280’/mi) x 2 lanes x 500 veh/lane
=131.14 Total
Vehicle-miles Supplied
601.52 vms
Step 2: Vehicle-Miles of Demand Generated by the Site46,910sf /1,000sf dev. unit x 3.06 veh-miles/dev. unit = 143.5435,000sf /1,000sf dev. unit x 3.06 veh-miles/dev. unit = 107.1069,700sf /1,000sf dev. unit x 5.08 veh-miles/dev. unit = 354.063,000sf /1,000sf dev. unit x 10.71 veh-miles/dev. unit = 32.133,000sf /1,000sf dev. unit x 12.04 veh-miles/dev. unit = 36.1273,000sf /1,000sf dev. unit x 3.06 veh-miles/dev. unit = 223.385,000sf /1,000sf dev. unit x 4.94 veh-miles/dev. unit = 24.70Vehicle-miles of Demand 921.05 vmd
Step 3: Supply/Demand Comparison
921.05 vmd > 601.52 vms
Exaction is proportional and justified.
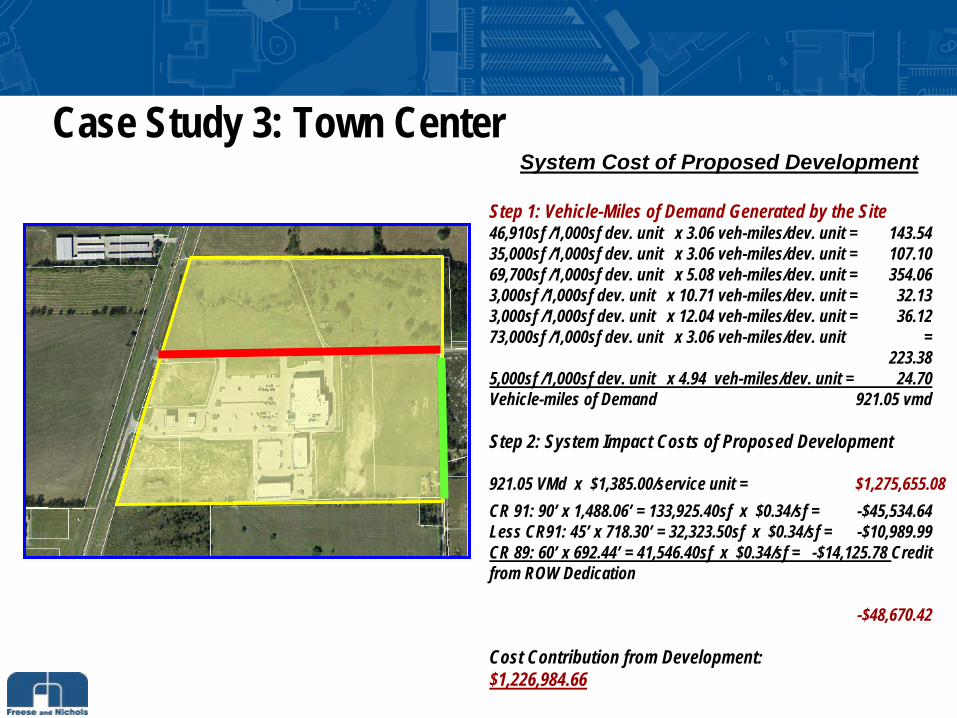
Case Study 3: Town CenterCase Study 3: Town CenterSystem Cost of Proposed Development
Step 1: Vehicle-Miles of Demand Generated by the Site46,910sf /1,000sf dev. unit x 3.06 veh-miles/dev. unit = 143.5435,000sf /1,000sf dev. unit x 3.06 veh-miles/dev. unit = 107.1069,700sf /1,000sf dev. unit x 5.08 veh-miles/dev. unit = 354.063,000sf /1,000sf dev. unit x 10.71 veh-miles/dev. unit = 32.133,000sf /1,000sf dev. unit x 12.04 veh-miles/dev. unit = 36.1273,000sf /1,000sf dev. unit x 3.06 veh-miles/dev. unit =
223.385,000sf /1,000sf dev. unit x 4.94 veh-miles/dev. unit = 24.70Vehicle-miles of Demand 921.05 vmd
Step 2: System Impact Costs of Proposed Development
921.05 VMd x $1,385.00/service unit = $1,275,655.08CR 91: 90’ x 1,488.06’ = 133,925.40sf x $0.34/sf = -$45,534.64Less CR91: 45’ x 718.30’ = 32,323.50sf x $0.34/sf = -$10,989.99CR 89: 60’ x 692.44’ = 41,546.40sf x $0.34/sf = -$14,125.78 Credit from ROW Dedication
-$48,670.42
Cost Contribution from Development:$1,226,984.66
Municipal PreparednessMunicipal PreparednessFor Cities with impact fee systems:•
Basics in place•
Establish methodology/approach of proportionality test, system approach of analyses, information required as part of application, and role of city in proportionality determinations.
For Cities without impact fees•
Consider preparation of a proportionality study•
Establish methodology/approach of proportionality test, system approach of analyses, information required as part of application, and role of city in proportionality determinations.
•
You’re ready for challenges!
Water & Sewer Utility Proportionality
Presented by: Alan Greer, P.E.Freese and Nichols, Inc.
New Development System Impact
Infrastructure adequate to support developmentApplication of minimum standardsSizing to meet flow requirements of developmentOversizing for future development•
Development agreement –
City participation
•
Pro Rata agreement•
Reimbursement on developer’s impact fee
•
Reimbursement on future impact fees
Develop clear and flexible Participation Policy•
Define developer’s responsibility
•
Address City participation•
Reimbursement instrument options
•
Development agreements
Determining New Development’s “Fair Share”
Determining New Development’s “Fair Share”
Projects without impact fee•
Determine developer’s loading−
Standard per capita if lots known−
Land use estimations−
I/I allowances for sewer−
Peaking factors−
Fire flow
Determining New Development’s “Fair Share”•
Comparison to capacity or buildout
flow
−
Sewer:Manning’s flowModeled dynamic flowBuildout loading based on projected development
−
Water:Estimated capacity based upon max friction lossCapacity based upon modeled systemBuildout loading based on projected development
Determining New Development’s “Fair Share”•
Comparison to minimum standard−
Policy to determine responsibility for this•
Reimbursement for oversizing−
Reimbursement for cost over minimum standard−
Reimbursement by Pro Rata agreementDevel. % = Loading/Capacity or Loading/B.O. Flow

Determining New Development’s “Fair Share”
Projects with impact fees•
Accounting for impact fees separate from reimbursement−
Collect all impact fees−
Developer still responsible for fair share•
Determine number of service units of loading−
Based upon number of meters and meter size−
Equivalency table (see next slide for example)
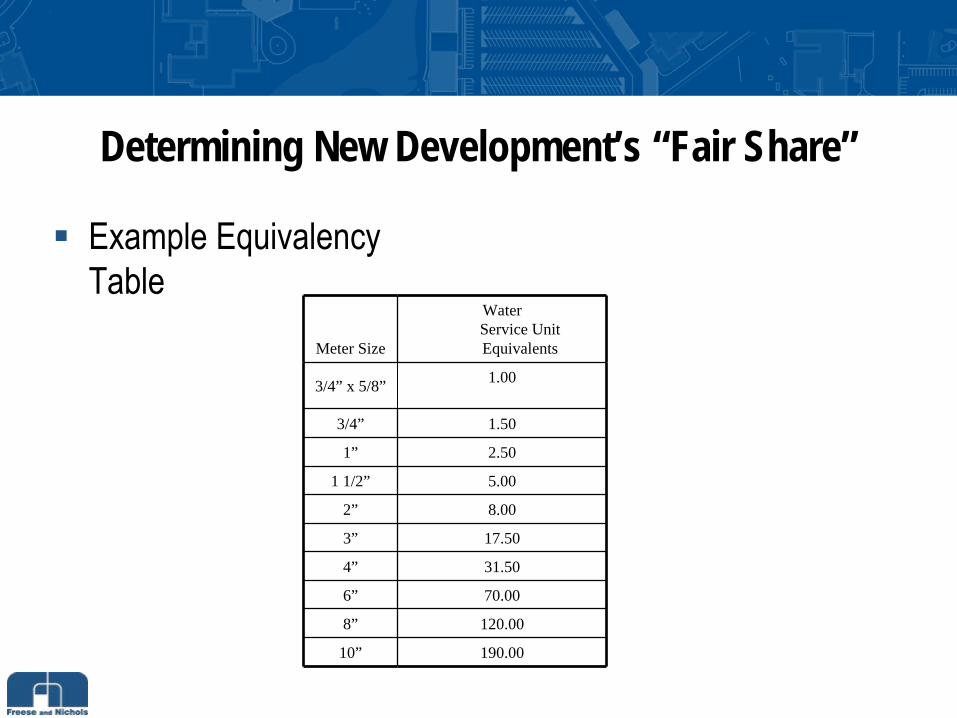
Determining New Development’s “Fair Share”
Example Equivalency Table
Meter Size
Water Service Unit Equivalents
3/4” x 5/8” 1.00
3/4” 1.50
1” 2.50
1 1/2” 5.00
2” 8.00
3” 17.50
4” 31.50
6” 70.00
8” 120.00
10” 190.00

Determining New Development’s “Fair Share”
•
Comparison to minimum standard•
Comparison to capacity or buildout
loading
−
Same as without impact fees, except translate to service units•
Reimbursement for oversizing−
Governed by LGC Chapter 395−
Reimbursement on developer’s impact fee−
Reimbursement from future impact fees−
Reimbursement for size over minimum standard−
Reimbursement as % of IF CIP projectBased upon IF collection rate

Sample Case #1
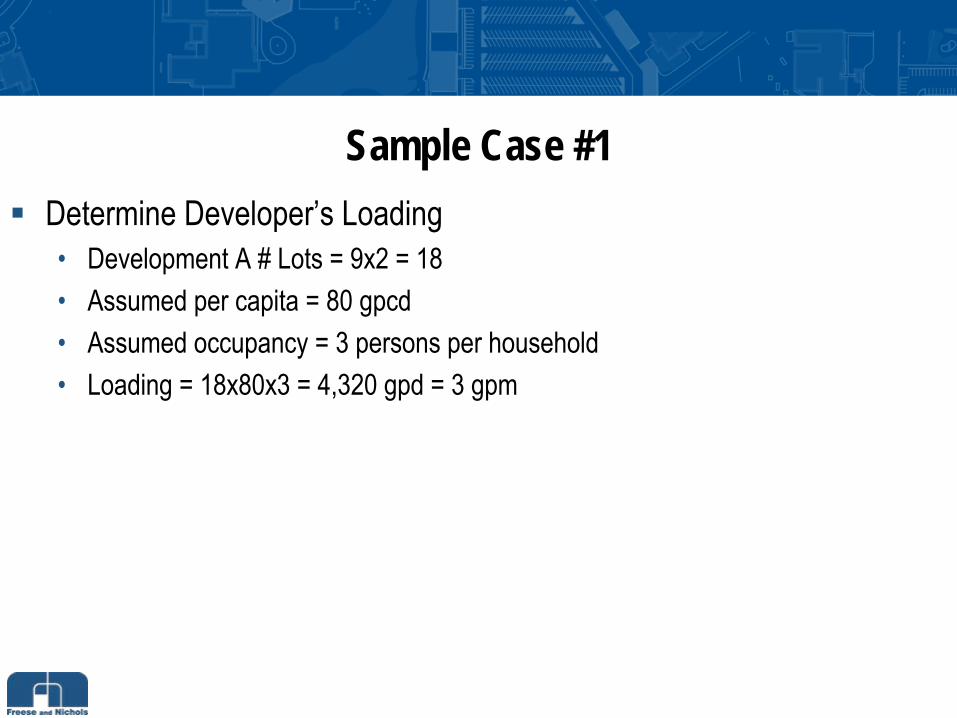
Sample Case #1Determine Developer’s Loading•
Development A # Lots = 9x2 = 18
•
Assumed per capita = 80 gpcd•
Assumed occupancy = 3 persons per household
•
Loading = 18x80x3 = 4,320 gpd
= 3 gpm

Sample Case #1
Comparison to buildout flow•
Total Lots = 9x2 + 3x3 + 3x4 = 39 Lots
•
Assumed per capita = 80 gpcd•
Assumed occupancy = 3 persons per household
•
Loading = 39x80x3 = 9,360 gpd
= 6.5 gpm
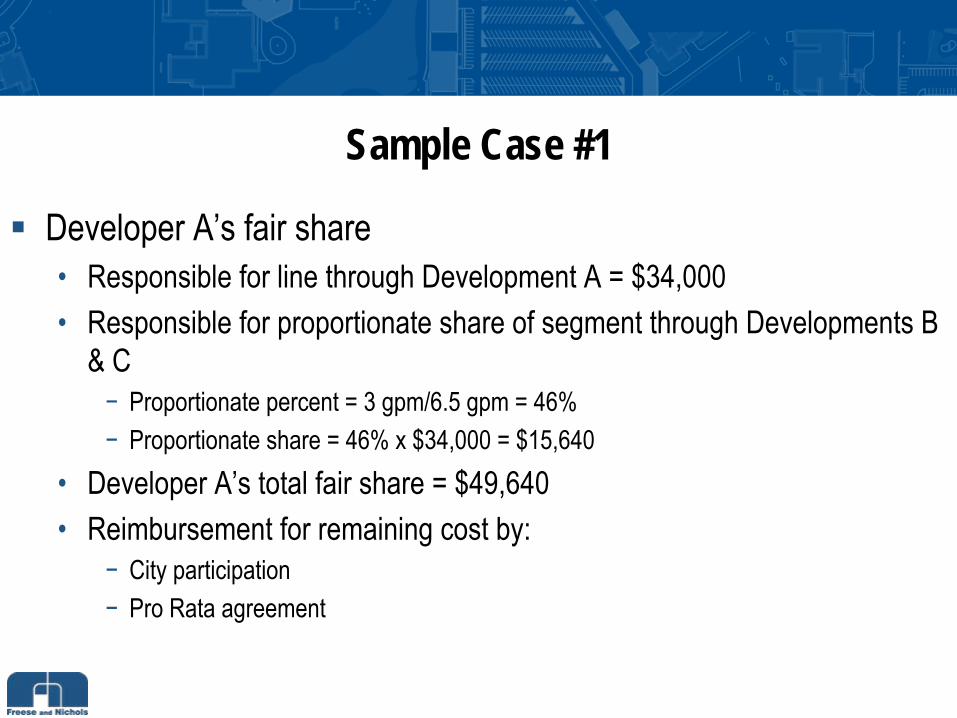
Sample Case #1
Developer A’s fair share•
Responsible for line through Development A = $34,000
•
Responsible for proportionate share of segment through Developments B & C−
Proportionate percent = 3 gpm/6.5 gpm
= 46%−
Proportionate share = 46% x $34,000 = $15,640•
Developer A’s total fair share = $49,640
•
Reimbursement for remaining cost by:−
City participation−
Pro Rata agreement

Sample Case #2
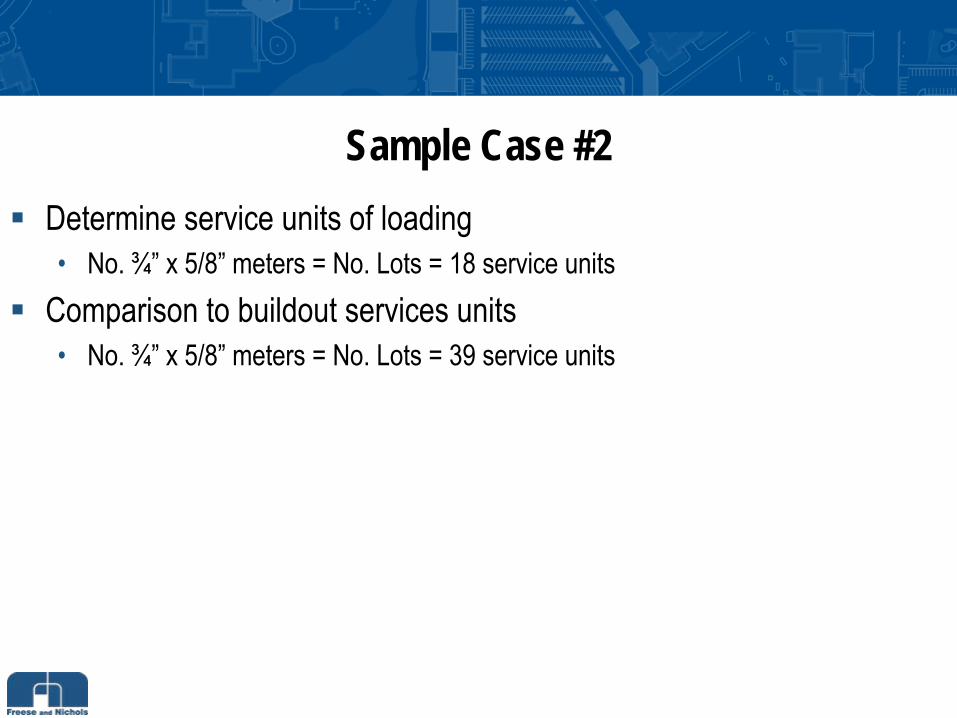
Sample Case #2Determine service units of loading•
No. ¾”
x 5/8”
meters = No. Lots = 18 service units
Comparison to buildout services units•
No. ¾”
x 5/8”
meters = No. Lots = 39 service units

Sample Case #2Reimbursement analysis•
Available impact fees−
Developer A = 18 -
¾”
x 5/8”
meters = 18 x $1,000 = $18,000 (Developer A pays impact fee)−
Developer B = 9 –
¾”
x 5/8”
meters = 9 x $1,000 = $9,000−
Developer C = 12 –
¾”
x 5/8”
meters = 12 x $1,000 = $12,000−
Total potential impact fee collections = $39,000
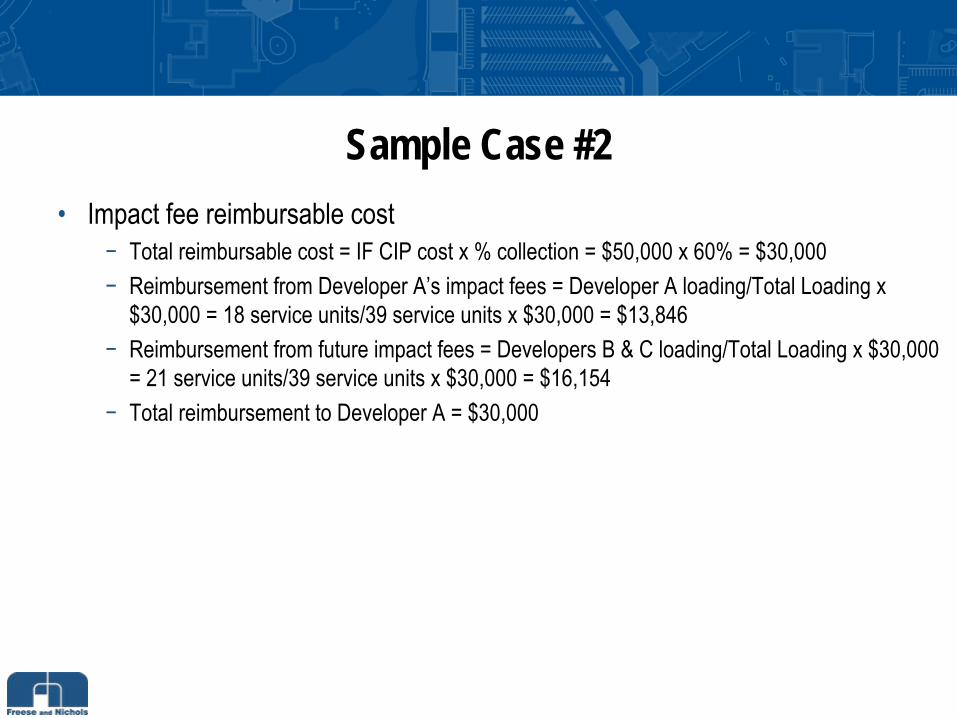
Sample Case #2•
Impact fee reimbursable cost−
Total reimbursable cost = IF CIP cost x % collection = $50,000 x
60% = $30,000−
Reimbursement from Developer A’s impact fees = Developer A loading/Total Loading x $30,000 = 18 service units/39 service units x $30,000 = $13,846
−
Reimbursement from future impact fees = Developers B & C loading/Total Loading x $30,000 = 21 service units/39 service units x $30,000 = $16,154
−
Total reimbursement to Developer A = $30,000

Drainage Proportionality

Drainage Issues
Current Drainage Ordinances and CriteriaLegal Issues – Downstream and Upstream Impacts from increased runoffUpsizing for fully-developed conditionsMethods to determine and size proportional share of capacityAnalyzing and accommodating for fully developed conditions but constructing facilities for individual site runoffCity-wide/Regional Master Plans
Existing Ordinances in North Texas
Most ordinances require sizing for fully developed watershed conditions.Most ordinances do not allow increase in runoff downstream above existing conditions.Typically, development pays for its own drainage with on-site detention or individual site improvements. Some developments are looking at potential downstream impacts and are building facilities to accommodate fully developed watershed conditionsSome Cities are doing watershed studies to develop regional stormwaterplansSo, what is being done for proportional share??
Downstream & Upstream Assessments
Evaluate impacts of increased runoff from site to determine if any DS or US impacts occur due to new development and size on-site facilities accordinglyLegally, a site still has to accept stormwater that flows onto the site, as long as it is coming onto the site in the same manner as pre-developed conditions (concentration, velocity, etc.)Legally, a site should not cause flooding damage downstream due to proposed developmentSo, what is being done for proportional share??

Options that are being done for Proportional Share
Make it a site specific issueAnalyze for fully developed, but build for existing plus increase from projectAccommodate fully developed conditions by allowing for easements and future expansion of facilitiesJoint participation with Cities for regional solutionsDeveloping funding alternatives:•
Drainage Utility Fees
•
Impact Fees•
Developer Agreements

Ordinance ExampleDownstream Impact Assessment
The downstream impacts of proposed development must be carefullyevaluated to show that design criteria established in this Ordinance and the Stormwater Design Manual are met. The purpose of the downstream assessment is to protect downstream properties from increased flooding, to protect downstream channels from increased erosion potential due to upstream development, and to protect public health and safety. The assessment shall extend from each outfall of a proposed development to a major stream (FEMA-defined floodplain), to a storm water facility identified by the City as having fully-developed flow capacity or to a point designated by the City Engineer, whichever is the nearest point downstream. Runoff computations shall be based upon fully developed watershed conditions in accordance with the City’s latest land use projections. Portions of the watershed which lie within the city limits and ETJ of City shall be analyzed and accommodated as if fully developed. Portions of the watershed which lie outside the City’s limits and ETJ shall be analyzed for existing conditions.

Limitation of Runoff •
Calculations using the following runoff limitation options shall
be performed for the proposed development to demonstrate downstream adequacy in accordance with the design criteria in this Ordinance and the Stormwater
Design Manual:•
If the necessary future capacities of the affected drainage systems within the downstream impact area are shown to adequately convey the fully developed 2-year and 100-year design flows from the watershed that meet the design criteria specified in the Stormwater
Design Manual no limitation of development runoff is required.
•
If the downstream analysis demonstrates conditions that exceed the design criteria
established in this Ordinance and the Stormwater
Design Manual within the downstream impact area, the developer shall conduct one or more of the following:
a.
Identify the required upsizing of any affected downstream structures and any needed drainage easement within the downstream impact area to handle the fully developed watershed conditions within the requirements of the Stormwater
Design Manual.
Determine the capacity of those downstream facilities to convey:
i.
existing watershed conditionsii.
existing watershed conditions with the proposed development; and iii.
fully developed watershed conditions.The City may, at its discretion, participate in construction of facilities that correct existing drainage inadequacies and/or convey the fully developed watershed conditions, other than for the proposed development, if adequate funds or other funding agreements are available. Funding options are identified in Section 12.410 of the Ordinance.
b.
Limit discharge to existing, predevelopment conditions or less; c.
Acquire suitable drainage easement on the City’s behalf to contain the increased runoff to meet the design criteria in this Ordinance and the Stormwater
Design Manual; ord.
Participate in a regional facility that accommodates fully developed watershedconditions as mutually agreed upon with the City.

Drainage Improvements Required for DevelopmentDevelopments for which this Ordinance applies shall provide for any new drainage facilities, the improvement of any existing drainage facilities, channel improvements or grading, driveway adjustments, culvert improvements or any other improvement, drainage facility, or work which is necessary to provide for the stormwater drainage requirements specified in the Stormwater Design Manual.The developer is required to dedicate drainage easements across the site that will accommodate fully developed watershed conditions. The developer is only required to construct that portion of the drainage system across the site that will convey existing offsite flows and the flows from the proposed site development. Upsizing or phasing the construction of the drainage systems to accommodate fully developed watershed conditions shall be coordinated with the City. Funding for the increased sizing of these facilities shall be in accordance with Section 12.410 (Funding) of this Ordinance.
Funding Examples
Establish Drainage Utility and use drainage utility fee for O & M and include some portion for capital and/or regional projectsImplement a Drainage Impact Fee by watershed. Must have watershed study, 10-yr CIP, and watershed specific rates. Also, potentially requires City to up-front cost or first phase. Not very successful to-date in North TexasCity participate in the up-sizing of facilities to accommodate fully developed watershed conditionsPublic/Private partnerships and/or agreements between City and Developer to fund up-sizing or regional facilities
How do you measure proportionality?
Who prepares the analysis or study?
Is it a study or an approval? How long can the city take to prepare or decide on the analysis?
Are parks and trails subject to this chapter?
Does a TIA establish proportionality?
Who pays for the analysis, study or determination?
Closing Comments

What if you already have impact fees under Chapter 395? What if you do not?
If your subdivision regulations require it (i.e., it is on-site) are you still subject to proportionality?
Where should your proportionality processes be located?
How do pre-existing drainage laws affect proportionality requirements?

Rough Proportionality – It’s State Law!
Dan Sefko, FAICP ([email protected]) Edmund Haas, AICP ([email protected]) Alan D. Greer, P.E. ([email protected])
1717 North Market Street, Ste. 500 Dallas, Texas 75202
(214) 217-2200 www.freese.com