rotary-wing brownout mitigation: technologies and training
TRANSCRIPT

NORTH ATLANTIC TREATY ORGANISATION
RESEARCH AND TECHNOLOGYORGANISATION
AC/323(HFM-162)TP/400 www.rto.nato.int
RTO TECHNICAL REPORT TR-HFM-162
Rotary-Wing Brownout Mitigation: Technologies and Training
(Remèdes contre le phénomène de brownout sur les appareils à voilure tournante :
Technologies et entraînement)
This Report documents the findings of Task Group HFM-162 (2008 – 2011)
that investigated the training and technologies employed by member NATO
Nations to mitigate the impact of brownout on rotary-winged operations.
Published January 2012
Distribution and Availability on Back Cover


NORTH ATLANTIC TREATY ORGANISATION
RESEARCH AND TECHNOLOGYORGANISATION
AC/323(HFM-162)TP/400 www.rto.nato.int
RTO TECHNICAL REPORT TR-HFM-162
Rotary-Wing Brownout Mitigation: Technologies and Training
(Remèdes contre le phénomène de brownout sur les appareils à voilure tournante :
Technologies et entraînement)
This Report documents the findings of Task Group HFM-162 (2008 – 2011)
that investigated the training and technologies employed by member NATO
Nations to mitigate the impact of brownout on rotary-winged operations.

ii RTO-TR-HFM-162
The Research and Technology Organisation (RTO) of NATO
RTO is the single focus in NATO for Defence Research and Technology activities. Its mission is to conduct and promote co-operative research and information exchange. The objective is to support the development and effective use of national defence research and technology and to meet the military needs of the Alliance, to maintain a technological lead, and to provide advice to NATO and national decision makers. The RTO performs its mission with the support of an extensive network of national experts. It also ensures effective co-ordination with other NATO bodies involved in R&T activities.
RTO reports both to the Military Committee of NATO and to the Conference of National Armament Directors. It comprises a Research and Technology Board (RTB) as the highest level of national representation and the Research and Technology Agency (RTA), a dedicated staff with its headquarters in Neuilly, near Paris, France. In order to facilitate contacts with the military users and other NATO activities, a small part of the RTA staff is located in NATO Headquarters in Brussels. The Brussels staff also co-ordinates RTO’s co-operation with nations in Middle and Eastern Europe, to which RTO attaches particular importance especially as working together in the field of research is one of the more promising areas of co-operation.
The total spectrum of R&T activities is covered by the following 7 bodies: • AVT Applied Vehicle Technology Panel • HFM Human Factors and Medicine Panel • IST Information Systems Technology Panel • NMSG NATO Modelling and Simulation Group • SAS System Analysis and Studies Panel • SCI Systems Concepts and Integration Panel
• SET Sensors and Electronics Technology Panel
These bodies are made up of national representatives as well as generally recognised ‘world class’ scientists. They also provide a communication link to military users and other NATO bodies. RTO’s scientific and technological work is carried out by Technical Teams, created for specific activities and with a specific duration. Such Technical Teams can organise workshops, symposia, field trials, lecture series and training courses. An important function of these Technical Teams is to ensure the continuity of the expert networks.
RTO builds upon earlier co-operation in defence research and technology as set-up under the Advisory Group for Aerospace Research and Development (AGARD) and the Defence Research Group (DRG). AGARD and the DRG share common roots in that they were both established at the initiative of Dr Theodore von Kármán, a leading aerospace scientist, who early on recognised the importance of scientific support for the Allied Armed Forces. RTO is capitalising on these common roots in order to provide the Alliance and the NATO nations with a strong scientific and technological basis that will guarantee a solid base for the future.
The content of this publication has been reproduced directly from material supplied by RTO or the authors.
Published January 2012
Copyright © RTO/NATO 2012 All Rights Reserved
ISBN 978-92-837-0149-1
Single copies of this publication or of a part of it may be made for individual use only. The approval of the RTA Information Management Systems Branch is required for more than one copy to be made or an extract included in another publication. Requests to do so should be sent to the address on the back cover.

RTO-TR-HFM-162 iii
Table of Contents
Page
List of Figures viii
List of Tables xi
List of Acronyms xii
Acknowledgements xv
Programme Committee xvi
Executive Summary and Synthèse ES-1
Chapter 1 – Introduction 1-1 1.1 The Rotary-Wing Brownout Problem 1-1
Chapter 2 – Physiological and Perceptual Limitations: Current Approach in 2-1 Brownout 2.1 Introduction 2-1 2.2 Background on Spatial Orientation in Flight 2-1 2.3 The “Brownout” Phenomenon 2-1 2.4 Pertinent Orientation Information for Helicopter Take-Offs and Landings 2-2 2.5 Physiological Limitations During Brownout 2-2 2.6 Other Aggravating Factors that May Predispose SD 2-4 2.7 Inadequacies of Current Landing Approach During Brownout 2-4 2.8 Conclusion 2-8 2.9 References 2-8
Chapter 3 – Countermeasures: Human Machine Interfaces 3-1 3.1 Introduction 3-1 3.2 Visual Display 3-1
3.2.1 2-D Low Speed Symbology – Brownout Symbology System (BOSS) 3-1 3.2.2 3-D Conformal Symbology Display System – FTL 3-D Conformal Symbology 3-4
3.2.2.1 Synthetic Vision 3-6 3.3 Alternative Displays 3-7
3.3.1 3-D Audio Displays Overview 3-7 3.3.2 Tactile Displays 3-9 3.3.3 Haptic Controls 3-10 3.3.4 Conclusion 3-10
3.4 References 3-10
iv RTO-TR-HFM-162
Chapter 4 – Technology: Sensors and Data Processing 4-1 4.1 Introduction 4-1 4.2 Technology Assumptions 4-1
4.2.1 The Helicopter 4-1 4.2.2 Mission Scenario 4-1 4.2.3 Minimal Information Required for Safe Landing 4-2 4.2.4 Types of Brownout Accident 4-2
4.3 Technologies 4-3 4.3.1 Onboard Systems 4-3
4.4 Analysis of Sensor Sub-Systems 4-4 4.4.1 Radar 4-4
4.4.1.1 Active MMW Radar Altimeter Sensor 4-4 4.4.1.2 MMW Electronic Bumper Sensor 4-5 4.4.1.3 Scanning Active Millimetre Wave (MMW) Radar Sensor 4-7
4.4.2 Laser 4-9 4.4.2.1 LADAR Sensor System 4-9
4.4.3 Passive Electro-Optical 4-11 4.4.3.1 Visible Waveband or Low Light Level TV Cameras 4-11 4.4.3.2 Passive MMW Imaging Sensor 4-12 4.4.3.3 Thermal Imaging Sensor 4-14
4.5 Human Machine Interface/Display Sub-Systems 4-15 4.5.1 Head-Mounted Display 4-15
4.5.1.1 Capability 4-15 4.5.1.2 Strengths 4-15 4.5.1.3 Limitations 4-16 4.5.1.4 System Maturity 4-16 4.5.1.5 System Integration Issues 4-16 4.5.1.6 Required Sub-Systems 4-17 4.5.1.7 Human Factors 4-17
4.5.2 Symbology 4-17 4.5.2.1 Two-Dimensional Symbology 4-18 4.5.2.2 Conformal Landing Symbology 4-20 4.5.2.3 Synthetic Vision 4-21
4.5.3 Tactile 4-24 4.5.3.1 Capability 4-24 4.5.3.2 Strengths 4-24 4.5.3.3 Limitations 4-24 4.5.3.4 System Maturity 4-24 4.5.3.5 System Integration Issues 4-25 4.5.3.6 Required Sub-Systems 4-25 4.5.3.7 Human Factors 4-25
4.6 Flight Control 4-25 4.6.1 Automatic Flight Control Systems (AFCS) with Advanced Flight Control Laws 4-25

RTO-TR-HFM-162 v
4.6.1.1 Capability 4-25 4.6.1.2 Strengths 4-25 4.6.1.3 Limitations 4-26 4.6.1.4 System Maturity 4-26 4.6.1.5 System Integration Issues 4-26 4.6.1.6 Required Sub-Systems 4-26 4.6.1.7 Human Factors 4-26
4.6.2 Haptic Cueing with Active Sidesticks for Helicopter Operation 4-26 4.6.2.1 Capability 4-27 4.6.2.2 Strengths 4-28 4.6.2.3 Limitations 4-28 4.6.2.4 System Maturity 4-28 4.6.2.5 System Integration Issues 4-28 4.6.2.6 Required Sub-Systems 4-28 4.6.2.7 Human Factors 4-28
4.6.3 Dimensional Audio 4-28 4.6.3.1 Capability 4-28 4.6.3.2 Strengths 4-29 4.6.3.3 Limitations 4-29 4.6.3.4 System Maturity 4-29 4.6.3.5 System Integration Issues 4-29 4.6.3.6 Required Sub-Systems 4-29 4.3.6.7 Human Factors 4-29
4.6.4 Head-Up Displays 4-29 4.6.4.1 Capability 4-29 4.6.4.2 Strengths 4-30 4.6.4.3 Limitations 4-30 4.6.4.4 System Maturity 4-30 4.6.4.5 System Integration Issues 4-30 4.6.4.6 Required Sub-Systems 4-30 4.6.4.7 Human Factors 4-31
4.6.5 Helmet-Mounted Sight and Display (HMSD) 4-31 4.6.5.1 Capability 4-31 4.6.5.2 Strengths 4-31 4.6.5.3 Limitations 4-31 4.6.5.4 System Maturity 4-31 4.6.5.5 System Integration Issues 4-31 4.6.5.6 Required Sub-Systems 4-31 4.6.5.7 Human Factors 4-32
4.6.6 Summary on Capabilities and Limitations 4-32 4.7 Discussion 4-37
4.7.1 Technology Availability and Maturity 4-37 4.7.2 Short-Term Brownout Solutions 4-39 4.7.3 Promising Long-Term Solutions 4-39

vi RTO-TR-HFM-162
4.7.4 Abandoned Potential Solutions 4-39 4.7.5 Example Brownout Solutions 4-40
4.7.5.1 Day Scenario 4-40 4.7.5.2 Night Scenario 4-41 4.7.5.3 Worst Case Scenario 4-41
4.8 Conclusions 4-43 4.9 References 4-43
Chapter 5 – Risk Management Strategies to Counter Brownout 5-1 5.1 Introduction 5-1 5.2 Principles of Risk Management 5-1 5.3 Contributory Factors 5-1 5.4 Landing Techniques 5-2
5.4.1 Zero Speed Landing 5-3 5.4.2 Short Running Landing 5-4 5.4.3 Low Hover and Land 5-5 5.4.4 High Hover and Vertical Descent 5-6
5.5 Comparison of Landing Techniques 5-7 5.6 Crew Coordination 5-8
5.6.1 Overshoot 5-10 5.7 Tactical Constraints/Variations 5-10 5.8 Take-Off Techniques 5-11 5.9 Ground and Hover Taxi Maneuvers 5-11 5.10 Night Operations 5-11 5.11 Snow Operations 5-12 5.12 Approach to Land 5-12 5.13 Take Off 5-13 5.14 Under Slung Loads 5-13
5.14.1 USL Techniques 5-13 5.15 Formation Procedures 5-13 5.16 Platform Specifics 5-14
5.16.1 Tilt Rotor 5-14 5.16.2 Tandem Rotor 5-14 5.16.3 Single Main Rotor 5-14 5.16.4 Undercarriage Factors 5-15
5.17 Training for Transitions in Degraded Visual Environment 5-15 5.17.1 Development of the Procedure 5-15 5.17.2 Theoretical Training 5-16 5.17.3 Synthetic Training 5-16
5.17.3.1 Vision 5-16 5.17.3.2 Motion 5-16 5.17.3.3 Crew Concept 5-16 5.17.3.4 Synthetic Training Conclusions 5-16

RTO-TR-HFM-162 vii
5.17.4 Actual Flying 5-17 5.17.5 Continuation Training 5-17 5.17.6 Training Conclusions 5-17
5.18 Conclusions 5-17
Chapter 6 – Conclusion 6-1 6.1 Sensor Development 6-2 6.2 High-Resolution LADAR 6-3
Chapter 7 – Supplemental Material 7-1
Annex A – TTPC-AER-TP2-2011 Task Outcome Report for Enhanced/Synthetic A-1 Vision Pilotage Systems A.1 Task Description A-1 A.2 Achievement of Task Objectives A-1 A.3 Conclusions A-23 A.4 Recommendations A-23 A.5 References A-23 A.6 Annex A – Personnel and Organizations Involved A-24
Annex B – In-Flight Studies with Tactile Displays B-1 B.1 Flight Tests Using TSAS B-1 B.2 TSAS Lite B-2 B.3 Flight Test with TNO Tactile Torso Display B-3 B.4 Concluding Remarks B-8
B.4.1 Open Issues B-9 B.5 References B-9
Annex C – Combination of Visual Display System with Sensor Technologies C-1 C.1 3D-LZ LADAR System C-1
C.1.1 Integration of Symbology and Sensor-Based Imagery C-3 C.1.2 3D-LZ Yuma Flight Test C-8
C.1.2.1 Objective Results C-13 C.1.2.2 Subjective Results C-20 C.1.2.3 Conclusions C-23 C.1.2.4 Future Suggested Improvements C-24
C.2 References C-24

viii RTO-TR-HFM-162
List of Figures
Figure Page
Figure 2-1 The Vestibular System 2-3 Figure 2-2 Helicopter Entering a Brownout Condition 2-5 Figure 2-3 Helicopter Entering a Snow-Induced Whiteout Condition 2-6 Figure 2-4 An Example of a Take-Off in Brownout Conditions 2-6
Figure 3-1a Enroute Page of BOSS Symbology 3-2 Figure 3-1b Hover-Approach-Take-Off (HAT) Page of BOSS Symbology 3-3 Figure 3-2 A Comparison between 2-D and 3-D Symbology Displays 3-4 Figure 3-3 2-D Flight Data are Combined with the 3-D Symbols 3-5 Figure 3-4 Line of Sight Principle 3-6 Figure 3-5 3-D Audio 3-8 Figure 3-6 Examples of Tactile Cueing Devices; Vest; Seat 3-9
Figure 5-1 Zero Speed Landing 5-4 Figure 5-2 Short Running Landing 5-5 Figure 5-3 Low Hover and Land 5-6 Figure 5-4 High Hover and Vertical Descent 5-7
Figure A-1a Hover Symbology for Hawkowl A-2 Figure A-1b Low Level Flight and Approach for Hawkowl A-2 Figure A-2 Imaging Sensors and Pilot’s Panel-Mounted Display A-2 Figure A-3 New Flight Path Marker Symbol (ATP-FPM) Used with Synthetic Terrain A-3 Imagery as Flown on the US Army Fly-by-Wire RASCAL UH-60 Figure A-4 Flight Test Result – Maximum Low Altitude Error A-3 Figure A-5 Flight Test Result – Max. Ground Track Error A-4 Figure A-6 Pilot’s Display for the Integrated Multi-Sensor Synthetic Imaging System (IMSIS) A-4 Used in Simulation by the US Army AFDD Figure A-7 Sandblaster Display Includes Radar Data (Close) and Pre-Stored Terrain Elevation A-6 Data (Far) and Symbology Figure A-8 Low Visibility Landing (LVL) Symbology A-7 Figure A-9a Start Approach A-8 Figure A-9b Nearing LZ A-8 Figure A-9c At LZ A-8 Figure A-10 University of Iowa Simulator for Brownout Landing A-9 Figure A-11a CAAS Display Modified with an Integrated Altimeter and Vertical Speed Indicator A-10 Figure A-11b Synthetic Vision Display A-10

RTO-TR-HFM-162 ix
Figure A-12 NASA-Ames Vertical Motion Simulator with Panel-Mounted Displays and A-11 NVG-HUD Figure A-13 BOSS Display as Flown on the NASA-Ames Vertical Motion Simulator A-11 Figure A-14 Test Matrix for NASA-Ames Simulation A-12 Figure A-15 Vertical Speed at Touchdown, BOSS Study in the NASA-Ames Simulator A-12 Figure A-16 Distance from Landing Point, NASA-Ames Simulator A-13 Figure A-17 BAE Terrain Elevation Data Morphed with Simulated Radar Data A-14 Figure A-18 BAE LVL Symbology A-14 Figure A-19 HALS Enroute Page with BOSS Symbology A-15 Figure A-20a National Research Council Canada Bell 412 Research Helicopter A-16 Figure A-20b Pilot Flying Approach Using BOSS Display with Hood to Obscure the A-16 Out-the-Window View Figure A-21 CAE Corporation Augmented Visionics System (AVS) with BOSS Symbology A-16 Superimposed Figure A-22 Lateral Speed at Touchdown for BOSS Symbology A-17 Figure A-23 3D-LZ Display Screen Captures during Actual Brownout Landings in an EH-60L A-18 Aircraft Figure A-24 Vertical Speed Recorded During All Brownout Landings A-19 Figure A-25 Lateral Speed Recorded During All Brownout Landings A-19 Figure A-26 HQR Rating for 3D-LZ A-19 Figure A-27 Display Preference for 3D-LZ A-19 Figure A-28a Final Configuration BOSS Enroute Page A-20 Figure A-28b Final Configuration BOSS Hover-Approach-Take-Off Page A-20 Figure A-29 ANVIS HUD Symbology Set A-21 Figure A-30 Seahawk Operating to Frigate at Night A-21 Figure A-31 AS Simulation of Seahawk Operating to FFG Frigate with NVGs and HUD A-22 Figure A-32 HUD Effectiveness Ratings – Ship Recovery A-22
Figure B-1 TSAS-Lite Belt B-2 Figure B-2 Ground Track During Hover Performance B-3 Figure B-3 TNO Tactile Torso Display and Inside View of a Tactor B-4 Figure B-4 Cartoon Showing the Horizontal Tactor Array for Indication of Groundspeed, B-5 and the Vertical Array for Indication of Height-Above-Terrain Figure B-5 Recorded Height-Above Terrain, Forward Speed, and Lateral Speed Recorded B-7 During the Last Landing Maneuver in Three Conditions (Bearing and Altitude Information Presented on Tactile Display, Clear Vision, and No Tactile Support) Figure B-6 Handling Qualities Rating Scale B-8
Figure C-1 Gimballed LADAR, Fixed FLIR, and Fixed Color Camera Mounted on Aircraft Nose C-2 Figure C-2 LADAR Display Modes C-3 Figure C-3 AFDD Synthetic Vision Cab C-4 Figure C-4 AFRL SIRE Helicopter Simulator C-4

x RTO-TR-HFM-162
Figure C-5 Average Handling Quality Rating C-5 Figure C-6 Average Horizontal Translation Rate Rating C-6 Figure C-7 Average Vertical Translation Rate Rating C-6 Figure C-8 Average Preference Ranking C-7 Figure C-9 Scales for the Horizontal Velocity, Target Velocity, and Target Position Symbols C-8 Figure C-10 Combined Altimeter and Vertical Speed Indicator with Target Altitude Symbol C-9 Used for the Approach to High Hover Maneuver Figure C-11 Combined Altimeter and Vertical Speed Indicator with Target Vertical Speed C-9 Symbol Used for the Landing Maneuver Figure C-12 Vertical Profile for the Vertical Speed Guidance Algorithm C-10 Figure C-13 Dual Display with VSD and HSD C-11 Figure C-14 Right: Switched Display on Low-Speed Page; Left: Display Stays as an HSD C-11 Figure C-15 Landings were Conducted Primarily in Lane 7 at the Yuma Proving Ground Dust C-12 Course Figure C-16 Lanes were Plowed to Increase Quantity of Dust (EH-60L shown) C-12 Figure C-17 Vertical Speed C-14 Figure C-18 Lateral Speed C-15 Figure C-19 Forward Speed C-16 Figure C-20 Aft Speed C-17 Figure C-21 Landing Position (at -1 ft Radar Altitude) Relative to Target Landing Point as C-18 Measured by EGI and Displayed to the Pilot Figure C-22 Lateral Position Error C-19 Figure C-23 Longitudinal Position Error C-20 Figure C-24 Display Preference for the Four Evaluation Pilots C-20 Figure C-25 Average HQR C-21 Figure C-26 Average Scores for the TLX Dimensions C-22

RTO-TR-HFM-162 xi
List of Tables
Table Page
Table 4-1 Technology Readiness Levels 4-6 Table 4-2 System Maturity Level Key 4-32 Table 4-3 Sensor Technologies, Limitations, and System Maturity Levels 4-33 Table 4-4 HMI / Display Hardware Technologies, Limitations, and System Maturity Levels 4-34 Table 4-5 HMI / Display Symbology Technologies, Limitations, and System Maturity Levels 4-35 Table 4-6 HMI / Display Technologies, Limitations, and System Maturity Levels 4-36 Table 4-7 Flight Control Technologies, Limitations, and System Maturity Levels 4-37
Table 5-1 Comparison of Landing Techniques 5-8

xii RTO-TR-HFM-162
List of Acronyms
2-D Two Dimensional 3-D Third Dimensional AAFD Army Aeroflightdynamics Directorate AATD Aviation Applied Technology Directorate ACAH Attitude Command Attitude Hold AFCS Automated Flight Control System AFDD Aeroflightdynamics Directorate AFRL Air Force Research Laboratory AGL Above Ground Level ALARP As Low As Reasonably Practical AMRDEC Aviation and Missile Research Development and Evaluation Centre AUM All Up Mass AVS Advanced Vision System BOSS Brownout Symbology System BRU Boresight Reticule Unit BSAU Brownout Situational Awareness Upgrade CAAS Common Avionics Architecture System CG Center of Gravity CMOTS Commercial Military Off-The-Shelf CNS Central Nervous System CONOPS Concept of Operations CRM Crew Resource Management CRT Cathode-Ray Tube CSAR Combat Search And Rescue DAFCS Digital Advanced Flight Control Systems DARPA Defence Advanced Research Projects Agency DAS Distributed Aperture System DNVG Display Night Vision Goggle DoD Department of Defense DSTL Defence Science and Technology Laboratory DTED Digital Terrain and Elevation Database DVE Degraded Visual Environments EGI Embedded GPS/Inertial system FARP Forward Arming and Refuel Point FLIR Forward-Looking Infrared FM Frequency Modulation FOR Field Of Regard FOV Field Of View GHz Gigahertz GPS Global Positioning System GVE Good Visual Environment

RTO-TR-HFM-162 xiii
HALS Helicopter Autonomous Landing System HAT Height Above Terrain HDD Head-Down Display HFM Human Factors and Medicine HMD Helmet-Mounted Display HMI Human Machine Interface HMSD Helmet-Mounted Sight and Display HOCAS Hands On Collective And Stick HOGE Hover Out of Ground Effect HP Handling Pilot HRM Hover Reference Markers HRTF Head-Related Transfer Function HSD Horizontal Situation Display HUD Head-Up Display Hz Hertz ICR International Collaborative Research IED Improvised Explosive Device IFR Instrument Flight Rules IMC Instrument Meteorological Conditions IMU Inertial Measurement Unit INS Inertial Navigation System IR Infrared IRBA Institut de Recherche Biomédicale des Armées IRT Immediate Response Team KIAS Knots Indicated Airspeed LADAR Laser Detection And Ranging LCD Liquid-Crystal Display LED Light-Emitting Diode LIDAR Light Detection And Ranging LLLTV Low-Light-Level Television LLTV Low-Light Television LOS Line Of Sight LP Landing Point LS Landing Site LVL Low-Visibility Landing LWIR Long-Wave Infrared LZ Landing Zone MFD Multi-Function Display MHz Megahertz MMW Millimeter Wave MW Medium Wave MWIR Mid-Wave Infrared NATO North Atlantic Treaty Organisation NHP Non-Handling Pilot NM Nautical Miles NVD Night Vision Device NVG Night Vision Goggle

xiv RTO-TR-HFM-162
OSW Outside World PFP Partners for Peace PhLASH Photographic Landing Augmentation System for Helicopters PMMW Passive Millimeter Wave PNVS Panoramic Night Vision System QRF Quick-Reaction Force RADAR Radio Detection And Ranging RNLAF Royal Netherlands Air Force ROD Rate Of Decent RTO Research and Technology Organisation RW Rotary Wing RWB Rotary-Wing Brownout SA Situational Awareness SD Spatial Disorientation SERE Survive Evade Resist and Extract SOP Standard Operating Procedure SV Synthetic Vision TA Terrain Avoidance TF Terrain Following TG Task Group TI Thermal Imagery TNO Netherlands Organization for Applied Scientific Research TRL Technology Readiness Level TTCP The Technical Cooperation Program UAV Unmanned Aerial Vehicle UH Utility Helicopter UK United Kingdom US United States USAARL Unites States Army Aeromedical Research Laboratory USL Under Slung Load VMC Visual Meteorological Conditions

RTO-TR-HFM-162 xv
Acknowledgements
The Task Group acknowledges the gracious hosts and hostesses for our six, semi-annual working meetings and the generous use of meeting facilities in the Canada, France, Germany, United Kingdom and United States, for RTO-HFM-162 from October 2007 through June 2010.
1st meeting: Moffett Field, CA, USA, US Army AFDD, October 2007 – Host: Mr. Zoltan Szoboszlay
2nd meeting: Paris FRA, IRBA, April 2008 – Hostess: Dr. Anne-Emmanuelle Priot
3rd meeting: Munich DEU, ESG Corp., September 2008 – Host: Capt. Detlef Kolletzki (retired)
4th meeting: Ft. Rucker, AL, USA, USAARL, March 2009 – Host: Dr. Art Estrada
5th meeting: Toronto CAN, DRDC, September 2009 – Host: Dr. Bob Cheung
6th meeting: London GBR, USAF EOARD, June 2010 – Hostess: LtCol. Tammy Savoie

xvi RTO-TR-HFM-162
Programme Committee
CHAIRMAN Dr. William ALBERY Booz Allen Hamilton
1465 E. Social Row Rd. Centerville, OH 45458
USA E-mail: [email protected]
CANADA Dr. Bob CHEUNG DRDC Toronto 1133 Sheppard Avenue West P.O. Box 2000 Toronto, Ontario M3M 3B9 E-mail: [email protected] FRANCE Dr. Anne-Emmanuelle PRIOT IRBA BP 73 91223 Brétigny-sur-Orge Cedex E-mail: [email protected] GERMANY LtCol. Thorsten EGER DEU Army Aviation School Achumer Straße 1 D-31675 Bückeburg E-mail: [email protected] Mr. Peter KIELHORN EADS Deutschland GmbH P.O. Box 88039 Friedrichshafen E-mail: [email protected] Capt. Detlef KOLLETZKI (Retired) Senior Consultant 29336 Nienhagen Waldweg 39 E-mail: [email protected] Dr. Thomas MÜNSTERER EADS Deutschland GmbH P.O. Box 88039 Friedrichshafen E-mail: [email protected]
ISRAEL Mr. Ofer KLEIN Elbit Systems Aerospace Adv. Tech. Center P.O. Box 539 Haifa 31053 E-mail: [email protected] Mr. Erez NUR Senior Consultant E-mail: [email protected] NETHERLANDS Maj. Marjon de GRAAFF Royal Netherlands Airforce Center for Man in Aviation Kampweg 3 3769 DE Soesterberg E-mail: [email protected] Dr. Eric GROEN TNO Kampweg 5 P.O. Box 23 3769 ZG Soesterberg E-mail: [email protected] NORWAY Capt. Vidar NORDSETH 720 SQ/137 Air Wing Flyplassveien 300 N-1590 Rygge E-mail: [email protected] Dr. Jan OWE Norwegian Armed Forces Medical Services P.O. Box 14 Blindern 0313 Oslo E-mail: [email protected]

RTO-TR-HFM-162 xvii
SWEDEN Mr. Patrik LIF FOI – Swedish Defence Research Agency SE-581 11 Linköping E-mail: [email protected] Dr. Staffan NÄHLINDER FOI – Swedish Defence Research Agency SE-581 11 Linköping E-mail: [email protected] UNITED KINGDOM Mr. Adrian BALL Air and Weapons Systems D-111, Grenville Bldg. E. Portsdown Hill Fareham, PO17 6AD E-mail: [email protected] LtCol. Alaistair BUSHBY Dept. Aviation Medicine SA Aviation Middle Wallop, Stockbridge E-mail: [email protected] UNITED STATES Dr. Bill ERCOLINE Wyle Laboratories Bldg. 170 Gillingham Drive Brooks City-Base, TX 78235 E-mail: [email protected] Dr. Art ESTRADA U.S. Army Aeromedical Research Laboratory P.O. Box 620577 Fort Rucker, AL 36362 E-mail: [email protected]
Dr. R. Andy MCKINLEY 711th Human Performance Wing 2215 1st Street Wright-Patterson AFB, OH 45433 E-mail: [email protected] Mr. Bob PEARSON Air Force Research Laboratory 1864 4th Street Wright-Patterson AFB, OH 45433 E-mail: [email protected] Dr. Alan PINKUS (Editor) 711th Human Performance Wing 2255 H Street Wright-Patterson AFB, OH 45433 E-mail: [email protected] Dr. Angus RUPERT U.S. Army Aeromedical Research Laboratory P.O. Box 620577 Fort Rucker, AL 36362 E-mail: [email protected] Mr. Zoltan SZOBOSZLAY U.S. Army Aeroflightdynamics Directorate Ames Research Center Moffett Field, CA 94035 E-mail: [email protected] Ms. Catherine WEBB U.S. Army Aeromedical Research Laboratory P.O. Box 620577 Fort Rucker, AL 36362 E-mail: [email protected]

xviii RTO-TR-HFM-162

RTO-TR-HFM-162 ES - 1
Rotary-Wing Brownout Mitigation: Technologies and Training
(RTO-TR-HFM-162)
Executive Summary
Issue The RTO-HFM-162 “Rotary-Wing (RW) Brownout Mitigation” Task Group (TG) was formed to examine the effects of Rotary-Wing Brownout (RWB) and whiteout on pilots during operations. Brownout is the condition developed by re-circulating rotor downwash as a helicopter lands or takes off in an arid or a snowy environment. The dust, dirt, or snow (whiteout) that is developed by the downwash renders out-the-cockpit visibility severely degraded or non-existent. The resultant mishaps due to the Degraded Visual Environment (DVE) are a serious problem, especially for operations in Afghanistan, Iraq, and Africa. RWB is a $100M/yr problem in the US Services alone.
Purpose This study was undertaken to investigate the incidence and severity of the problem in partner nations, to examine and document current and planned technological developments, to evaluate and document the brownout training procedures of the NATO RW air forces and to recommend solutions to the problem in order to reduce mishaps.
Scope The study includes the experiences of the nine partner nations that participated in the Task Group over a three-year period and includes their evaluations of the current and emerging technologies and inputs from their DVE training procedures. Several of the countries are operating in the conflicts mentioned above.
Limitations Only nine countries participated in the semi-annual task group meetings and tours and as a result the full impact of RWB on NATO operations is not fully captured. However, the report includes the experiences from most of the primary participants in the theatre of operations including the Canada, Germany, France, Netherlands, the United Kingdom and the United States. Inputs from other key participants (Israel, Norway and Sweden) help complement the report.
Considerations A significant aspect of this report was the opinions of the eight RW pilots from six of the countries who participated in the TG. Their analysis and evaluation of the technologies was a hallmark of this research and conclusions.
Analysis/Results, Decisions and Recommendations To provide a true multi-purpose helicopter sensor, the TG members envision laser radar technology integrated with a navigation forward looking infrared sensor. Intuitive hovering and landing cockpit display

ES - 2 RTO-TR-HFM-162
symbology, such as that described in this report, must also be an integral part of an effective system for DVE landings. The TG members encourage the transition of the technology described in this report to a production brownout aid for the forces.

RTO-TR-HFM-162 ES - 3
Remèdes contre le phénomène de brownout sur les appareils à voilure tournante :
Technologies et entraînement (RTO-TR-HFM-162)
Synthèse
Sujet
Le groupe de travail RTO-HFM-162 « Remède contre le phénomène de brownout sur les appareils à voilure tournante » a été constitué pour étudier les effets sur les pilotes du phénomène de perte de visibilité lorsque les appareils à voilure tournante de ces derniers soulèvent, en opérations, de la poussière ou de la neige (phénomènes respectivement appelés, en anglais : Rotary Wing Brownout et Rotary Wing whiteout). Le phénomène de perte de visibilité due à des poussières est causé par la création d’une circulation du flux d’air défléchi vers le bas lorsqu’un hélicoptère atterrit ou décolle dans un milieu aride ou enneigé. La poussière ou la neige qui sont soulevées par la déflexion vers le bas provoquent une importante perte de visibilité depuis le cockpit, voire une perte totale de visibilité. Les incidents qui découlent de la dégradation de l’environnement visuel (Degraded Visual Environment, DVE) constituent un sérieux problème, notamment en ce qui concerne les opérations en Afghanistan, en Irak et en Afrique. Rien que dans l’armée américaine, le problème de la perte de visibilité par soulèvement de poussière a un coût annuel de 100 millions de dollars.
Objectif
La présente étude a été entreprise pour examiner l’incidence et la gravité du problème dans les pays partenaires, pour étudier et décrire les développements technologiques courants et projetés, pour évaluer et décrire les procédures d’entraînement des composantes « voilures tournantes » des armées de l’OTAN, et pour recommander des solutions au problème afin de réduire les incidents.
Champ
L’étude comprend l’expérience acquise par les neuf pays partenaires qui ont participé au groupe de travail pendant une période de trois ans et elle inclut leur évaluation respective des technologies courantes et naissantes, ainsi que les enseignements qu’ils tirent de leurs procédures d’entraînement à faire face à un environnement visuel dégradé. Plusieurs de ces pays sont parties prenantes aux conflits mentionnés ci-dessus.
Limitations
Seuls neuf pays ont participé aux réunions semestrielles et aux déplacements du groupe de travail et, par conséquent, il n’a donc été possible de prendre en compte l’ensemble des effets de la perte de visibilité par soulèvement de poussière sur les opérations de l’OTAN. Toutefois, le rapport témoigne de l’expérience de la plupart des principaux pays présents sur le théâtre des opérations, parmi lesquels : l’Allemagne, le Canada, la France, les Pays-Bas, le Royaume-Uni et les Etats-Unis. La contribution d’autres participants-clés (Israël, Norvège et Suède) permet de compléter le rapport.

ES - 4 RTO-TR-HFM-162
Considérations
Un pan important du présent rapport est constitué par le témoignage de huit pilotes d’aéronef à voilure tournante qui sont issus de six des pays ayant pris part au groupe de travail. Leur analyse et leur évaluation des technologies constituent un apport essentiel à cette recherche et à ses conclusions.
Analyse/résultats, décisions et recommandations
Pour réaliser un véritable capteur d’hélicoptère polyvalent, les membres du groupe de travail imaginent l’association d’une technologie « radar à laser » à une caméra infrarouge de navigation. Un système intuitif de symboles de sustentation et d’atterrissage pour visualisation de poste de pilotage, tel que le système décrit dans le présent rapport, doit également faire partie intégrante d’un système performant d’atterrissage en environnement visuel dégradé. Les membres du groupe de travail sont favorables au transfert de la technologie décrite dans le présent rapport vers un système d’aide au pilotage sous visibilité restreinte par la poussière qui soit produit en série à destination des forces.

RTO-TR-HFM-162 1 - 1
Chapter 1 – INTRODUCTION
1.1 THE ROTARY-WING BROWNOUT PROBLEM
Brownout is the condition where there is little or no out-the-cockpit window visibility caused by dirt and dust being stirred up by the rotor downwash and then re-circulated by the rotor blades of a helicopter during taking off or landing in an arid climate. Similar conditions can be created by landing or taking off in snow (whiteout) or over water. It should be noted that whiteout in snowy conditions is also commonly referred to as “snowball” by aircrew to distinguish this particular condition from atmospheric whiteout caused by omnidirectional cirrus cloud formation, fog, or overcast sky over continuous snow surface or intermittent cloud blend in with snow-covered terrain. In general, Degraded Visual Environments (DVE) cause pilots to rely on inadequate cockpit instrumentation, callouts by on-board aircrew, and innate piloting skill to successfully execute a brownout landing. Flying in DVE has always been a challenge for rotary-wing pilots. Since NATO has been operating in the arid climates (e.g., Africa and Afghanistan), Rotary-Wing Brownout (RWB) is responsible for approximately 75% of coalition helicopter mishaps.
The US Department of Defense (DoD) has an inventory of over 7000 Rotary-Wing (RW) aircraft since 1985. In the US Air Force, more than 30 Special Operations RW aircraft and 60 crew-members have lost their lives during landing in desert environments in DVE since 1990. The US Army reports 50 helicopter mishaps with damage from 2001 – 2007; 40 of these incidents occurred in brownout conditions. The US Navy reported 38 personnel have been injured in brownout/whiteout mishaps in their helicopter operations since 1985. However, they report no fatalities due to mishaps in whiteout/brownout. RWB is a $100M/yr for the US Services, alone. Few lives are lost due to RWB and few injuries occur compared to other causes in the nearly 1000 lost or damaged US DoD helicopters (1985 – 2005) even though RWB landings are the overall largest cause of RW airframe loss in the US Services.
Other NATO countries also reported RWB mishaps that impact operations. The United Kingdom (UK) experienced 24 brownout mishaps involving material damage in the 5 year period 2005 – 2009 of which, 70% were assessed as being due to Spatial Disorientation (SD) and/or mishandling and 30% were attributed to an unseen Landing Site (LS) hazard. France has experienced eight brownout mishaps over the past 15 years, most of them in Africa. Since 1973, Bundeswehr (German Defence Forces) has recorded a significant number of mishaps (>30) in association with dust or snow. Similarly, the Netherlands has lost aircraft due to RWB as well. Most recently, RWB contributed to a Canadian Forces (CF) Griffon (CH146) crash in Afghanistan on 6 July 2009, during take-off, which resulted in three fatalities and three injuries. Between 1986 and 2006, there were 2 whiteout related accidents and 54 incidents in the CF. In Sweden, whiteout was a contributing factor in one fatal and one minor mishap. Norway cites seven whiteout/brownout mishaps since 1982.
Although research and development in dust penetration, “see through”, “see and remember” and obstacle warning technology has been on-going for some time, the technology development has not reached the Technology Readiness Level (TRL) that will allow aircrew to “see through” dust and dirt and be able to be implemented operationally. Obstacles on the ground including poles, trenches, walls, barricades, trees, and uneven terrain can be catastrophic to the aircraft and crew. Currently, no ‘electronic bumper’ exists on RW aircraft to detect, display, and provide warnings for such obstacles. In addition, especially in legacy helicopters, there is no single instrument display that can indicate lateral and longitudinal drifts. Moreover, current cockpit displays do not provide information about the terrain and the designated landing zone in DVE. However, there are recent developments in landing symbology system that will provide better altitude, velocity cues, and a critical sense of drift for the rotary-wing pilot during landings. The objectives of this Task Group can be summarised as follows:
INTRODUCTION
1 - 2 RTO-TR-HFM-162
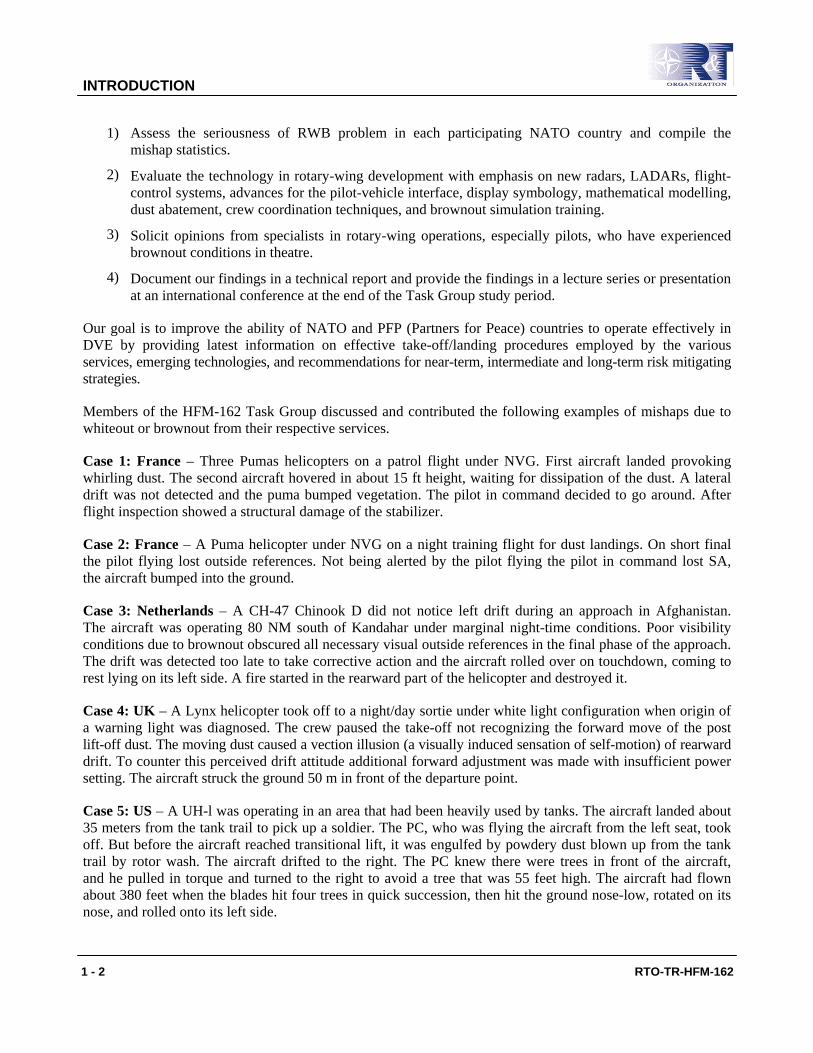
1) Assess the seriousness of RWB problem in each participating NATO country and compile the mishap statistics.
2) Evaluate the technology in rotary-wing development with emphasis on new radars, LADARs, flight-control systems, advances for the pilot-vehicle interface, display symbology, mathematical modelling, dust abatement, crew coordination techniques, and brownout simulation training.
3) Solicit opinions from specialists in rotary-wing operations, especially pilots, who have experienced brownout conditions in theatre.
4) Document our findings in a technical report and provide the findings in a lecture series or presentation at an international conference at the end of the Task Group study period.
Our goal is to improve the ability of NATO and PFP (Partners for Peace) countries to operate effectively in DVE by providing latest information on effective take-off/landing procedures employed by the various services, emerging technologies, and recommendations for near-term, intermediate and long-term risk mitigating strategies.
Members of the HFM-162 Task Group discussed and contributed the following examples of mishaps due to whiteout or brownout from their respective services.
Case 1: France – Three Pumas helicopters on a patrol flight under NVG. First aircraft landed provoking whirling dust. The second aircraft hovered in about 15 ft height, waiting for dissipation of the dust. A lateral drift was not detected and the puma bumped vegetation. The pilot in command decided to go around. After flight inspection showed a structural damage of the stabilizer.
Case 2: France – A Puma helicopter under NVG on a night training flight for dust landings. On short final the pilot flying lost outside references. Not being alerted by the pilot flying the pilot in command lost SA, the aircraft bumped into the ground.
Case 3: Netherlands – A CH-47 Chinook D did not notice left drift during an approach in Afghanistan. The aircraft was operating 80 NM south of Kandahar under marginal night-time conditions. Poor visibility conditions due to brownout obscured all necessary visual outside references in the final phase of the approach. The drift was detected too late to take corrective action and the aircraft rolled over on touchdown, coming to rest lying on its left side. A fire started in the rearward part of the helicopter and destroyed it.
Case 4: UK – A Lynx helicopter took off to a night/day sortie under white light configuration when origin of a warning light was diagnosed. The crew paused the take-off not recognizing the forward move of the post lift-off dust. The moving dust caused a vection illusion (a visually induced sensation of self-motion) of rearward drift. To counter this perceived drift attitude additional forward adjustment was made with insufficient power setting. The aircraft struck the ground 50 m in front of the departure point.
Case 5: US – A UH-l was operating in an area that had been heavily used by tanks. The aircraft landed about 35 meters from the tank trail to pick up a soldier. The PC, who was flying the aircraft from the left seat, took off. But before the aircraft reached transitional lift, it was engulfed by powdery dust blown up from the tank trail by rotor wash. The aircraft drifted to the right. The PC knew there were trees in front of the aircraft, and he pulled in torque and turned to the right to avoid a tree that was 55 feet high. The aircraft had flown about 380 feet when the blades hit four trees in quick succession, then hit the ground nose-low, rotated on its nose, and rolled onto its left side.

INTRODUCTION
RTO-TR-HFM-162 1 - 3
Case 6: Germany – A serious category B incident occurred during an intended landing in Rustaq, Afghanistan involving a CH-53GS. Recognizing a drift, the pilot decided for a go around. During the take-off, the rotor hit a wall followed by the fuselage front and side sections striking a tree. Though heavily damaged, the aircraft was able to return to its base. In his final report, the Director of Bundeswehr Flight Safety stated that the “technical tools to support the crews during dust landings (e.g., sensor-based or automatic landing technology) must be developed”.
Case 7: US – A CH-47D Chinook was lost due to brownout. The helicopter crashed near the city of Ghazni in Afghanistan, killing 18 people on-board, having encountered spatial disorientation during a severe dust storm.
Case 8: US – A HH-60 approached into a survivor’s location. As the Aircraft descended below 200 feet AGL and began to establish a hover, it encountered severe brownout conditions that obscured all outside references from the cockpit. Brownout at such high altitude is extremely rare and was completely unanticipated. At this point, the pilot determined the need for a go-around, called “on the go”, and initiated a go around. Approximately one to two seconds after leaving the dust cloud, the aircraft impacted rising and rolling terrain. The helicopter skipped up the side of the hill on its belly for several feet until the momentum dissipated. The helicopter then rolled 5 – 7 times down the hill coming to rest on its right side approximately 180 feet below the point of impact.
Case 9: Sweden – During a flight in an Augusta Bell 412HP in northern Sweden the weather got bad with heavy snow and since it was early evening the light conditions were poor. The pilot decided to continue with reduced height and speed. When the weather situation got worse the pilot decided to land, but the situation was problematic with an ice-covered river and a large road in the surrounding. At a height of five meters the helicopter had a tail wind and shortly after they completely lost the ground references. The helicopter crashed in the ice with major damages of the helicopter but with no serious personnel injuries.
Case 10: Norway – The Lynx was flying westward following the northern shoreline of a snow covered lake in slight snow showers. The forward visibility was 2 – 4 km, but left hand visibility was very poor with no defined horizon due to dense snow showers. Slightly up-sloping terrain with small trees sticking out of the snow were visible on the right-hand side. As the shoreline turned southwest, a slight left turn was started at about 15 degrees bank. Shortly after the helicopter hit the snow-covered lake, it slid about 140 m before coming to a standstill. All three crew-members were convinced they had good clearance to the lake at the time of impact.
Case 11: Norway – After a difficult NVG snow landing to pick up an injured soldier, the Bell 412 crew had to shovel away a snow pile on the left of the aircraft for better rotor clearance. The pile had been invisible on NVGs during high and low recce. During take-off in white out, the helicopter drifted forward and hit the top of a tree with the nose and belly. The only damage was a broken left pitot tube.
Case 12: Norway – It was a very dark night, with the crew on NVGs, during a Bell 412 medevac pick-up exercise near Meymaneh, Afghanistan. The LZ seemed normal on high and low recce. They entered brownout three seconds before landing. Then the tail stinger unexpectedly touched the ground one sec before landing, hitting a 50 – 80 cm terrain elevation, not visible on NVGs. The only damage was the anti-collision lights falling off.

INTRODUCTION
1 - 4 RTO-TR-HFM-162

RTO-TR-HFM-162 2 - 1
Chapter 2 – PHYSIOLOGICAL AND PERCEPTUAL LIMITATIONS: CURRENT APPROACH IN BROWNOUT
2.1 INTRODUCTION
This chapter describes the mechanism of orientation in flight and the inadequacies of the human sensory system in dealing with the brownout phenomenon. It also outlines basic flight requirements that are essential to land the helicopter under Degraded Visual Environment (DVE) conditions.
2.2 BACKGROUND ON SPATIAL ORIENTATION IN FLIGHT
Our perception of position, motion and attitude with respect to the fixed frame of reference provided by the gravitational vertical and the surface of the earth is based on the neural integration of concordant and redundant information from the visual, vestibular and somatosensory (tactile cues and proprioceptors) systems [2]. To a lesser extent, the auditory system also provides information on orientation. Within this multi-loop control system, the individual components are mutually interactive and partially redundant because their functional ranges overlap. To the extent that their functional ranges do not overlap, the individual components compensate for each other’s deficiencies. For example, if visual function is normal and external visual cues are unambiguous, at frequencies below 1 – 2 Hz, vision provides reliable sensory information from which orientation may be perceived correctly. However, when devoid of vision as in brownout and under instrument flight conditions, where the pilot has meager, if any, visual information outside of the instrument display, and at higher frequencies, vestibular information plays a significant role.
Our perception of correct orientation based on these sensory systems is developed under a normal 1G environment. Therefore, the relative contribution of the various sensory systems is significantly altered when exposed to unusual gravitoinertial environments such as in the air. Once we are airborne and subjected to abnormal or unusual accelerative forces, the information provided by different sensory modalities, particularly the vestibular apparatus and proprioceptors, may be interpreted incorrectly with potentially dangerous consequences. For example, the effective muscular response is redirected to maintain control of the aircraft rather than the maintenance of posture and equilibrium. In addition, the vestibular system is inadequate to perceive heave motion when devoid of visual input. Under continuous variation in both the magnitude and direction of the apparent gravitational field and prolonged rotational movements, the Central Nervous System (CNS) has the added responsibility of determining what sensory information is valid and what is not. When presented with reduced and or conflicting sensory information, it is normal to experience episodes of Spatial Disorientation (SD). Spatial disorientation is defined as the failure to perceive or perceive incorrectly the position, motion and attitude of the aircraft with respect to a fixed frame of reference, which is the surface of the earth and the gravitational vertical [2];[11]. The added responsibility to the CNS presents a major challenge when developing technological solutions to combat SD.
2.3 THE “BROWNOUT” PHENOMENON
Brownout/whiteout represents SD traps both because of its potential for obscuring the horizon, and overall visibility. As described briefly in Chapter 1 (Introduction), brownout/whiteout is a situation in which blowing dust or desert sand or snow from rotor down wash obscure both horizon and terrain features, and can lead to undetected drift or bank or even create vection (visually induced sensation of self motion). Specifically, when

PHYSIOLOGICAL AND PERCEPTUAL LIMITATIONS: CURRENT APPROACH IN BROWNOUT
2 - 2 RTO-TR-HFM-162
descending vertically through the last 75 feet, the recirculation of dust or sand cause sudden loss of overall visibility. During formation flight, fine sand/dust coming from wingman also contributes to DVE. Moreover, fine sand does not remain stable over time but rather shifts in location and height as a result of wind direction.
2.4 PERTINENT ORIENTATION INFORMATION FOR HELICOPTER TAKE-OFFS AND LANDINGS
For safe helicopter landings the main source of information available to the pilots is visual contact with the environment. Focal vision uses the central 30 degrees or so of the visual field; it is concerned with object recognition and identification. It involves relatively fine detail (high spatial frequencies). The information processed by focal vision is well represented in our consciousness. Therefore, it contributes to the conscious percepts of orientation. During flights in Visual Meteorological Conditions (VMC), central vision allows distant judgment, depth perception employing binocular cues of stereopsis, vergence, motion parallax and accommodation. On the other hand, ambient vision involves broader areas of the visual field (including the visual periphery). It subserves spatial localization and orientation and is primarily involves with the position, motion and attitude of the individual/airframe in the environment. Under Good Visual Environment (GVE), ambient vision provides motion cues and position cues such as the horizon. In summary, focal vision orients the perceived object relative to the individual, whereas ambient vision orients the individual relative to the perceived environment.
2.5 PHYSIOLOGICAL LIMITATIONS DURING BROWNOUT
The potential SD traps from brownout can be compounded with the inherent vestibular inadequacies. The vestibular system is divided into the semi-circular canals responsible for angular acceleration detection and the otolith organs responsible for linear acceleration detection including head tilt. However, the vestibular system is a poor sense for spatial orientation in aviation (Figure 2-1). It concerns with the detection of signals arising from movements of the head and therefore does not necessarily inform the pilot about the state of the external world. Furthermore, as an integrated accelerometer, it is only sensitive to velocity changes (acceleration) and is unable to detect constant velocities. Moreover, changes in velocity below our perceptual threshold are not perceived. Therefore it is incapable of detecting sub-threshold drifts. It has also been shown that acceleration along the z (spinal) axis, i.e., heave motion, leads to uncertain and usually erroneous perception of velocity and direction of motion [8].

PHYSIOLOGICAL AND PERCEPTUAL LIMITATIONS: CURRENT APPROACH IN BROWNOUT
RTO-TR-HFM-162 2 - 3
Crista ampullaris superior
Crista ampullaris lateral
Crista ampullaris posterior
Oval window
Round window
Utricle
Saccule
Cochlear duct
membranous canal
bony canal
Figure 2-1: The Vestibular System. An illustration showing the relationship of the canals with the utricle and saccule.
Three common misperceptions during brownout could occur that may lead to dire consequences:
a) Sub-threshold lateral drifts often occur just prior to touchdown. The phenomenon appears when a gradual turn occurs at a rate that is below the threshold for detection of a change in angular velocity. The angular acceleration occurs smoothly enough for the semi-circular canals not to be stimulated. Perceptual threshold values are 0.14°/s² for rotation about the z-axis and 0.5°/s² for rotation about the x- and y-axis [2]. Detection thresholds also depend on the duration of the stimulation. The product of acceleration and stimulus duration is a constant for stimulus duration of 5 s or less. Thus, perceptual threshold in terms of angular velocity is 2.5°/s (Mulder’s constant). Such brownout-induced disorientation can be referred to as Type I (unrecognized) SD in flight [10] as the pilot is unaware of the lateral drift.
b) The movement of dust or blowing dust during landing may give the pilot the impression that the helicopter is respectively banking or turning or vection (visually induced sensation of self motion) when it is actually in a level hover. Vection, can be induced by the nearly uniform motion of a large part of the visual field [3]. Vection occurs in the opposite direction to the stimulus direction, i.e., if the

PHYSIOLOGICAL AND PERCEPTUAL LIMITATIONS: CURRENT APPROACH IN BROWNOUT
2 - 4 RTO-TR-HFM-162
dust and sand is circulated in a clockwise direction, it could induce a sensation of self motion in the counter-clockwise direction. Vection can occur across all six degrees of freedom of body motion for example, roll, pitch, yaw (circular vection) and linear translations along the x. y and z axes (linear vection) or some combination.
c) Without clear external visual references, deceleration from forward flight may give the false impression that the helicopter is pitching down, the somatogravic illusion. The otolith organ as in any physical accelerometer, follows “Einstein Equivalence Principle”, and cannot distinguish between gravity and the inertial reaction force to any linear acceleration, so they actually indicate the orientation of the head relative to the gravitoinertial force. Without additional sensory information, the CNS cannot distinguish linear motion from gravity. However, neural processing seems to apply some kind of low-pass filtering to determine gravity from the resultant gravitoinertial acceleration signaled by the otolith organs. This is adequate for the detection of short duration self-induced head movements. However, sustained accelerations occurring in flight may be misinterpreted as pitch motion.
2.6 OTHER AGGRAVATING FACTORS THAT MAY PREDISPOSE SD Typical aggravating factors (although not exclusive) that may lead to SD during brownout include fatigue, high workload, unexpected flight plan (or mission) changes, and inexperience. A specific aggravating factor for brownout is take-off or landing using Night Vision Goggles (NVG). Flying under NVG is a difficult task per se due to the reduction of visual Field Of View (FOV), reduced contrast, stereopsis, accommodation, differences in illumination perspective of objects due to light and shadows, differences in aerial perspective etc. However, hovering could abolish motion parallax. During night take-off and landings, aircraft lighting, can enhance the visual illusions by illuminating the brownout cloud. Rotor blades/dust interaction also may result in strong scintillation effects, which saturate parts of the NVG image and reduces the sensitivity (gain) of the system.
2.7 INADEQUACIES OF CURRENT LANDING APPROACH DURING BROWNOUT
A common landing technique is to choose noticeable features on the ground (rocks, bushes, trees, fences, etc.) in order to set up the approach and land at the designated Landing Zone (LZ). An example of the visual reference necessary to control the aircraft near the ground is shown in the following figure.

PHYSIOLOGICAL AND PERCEPTUAL LIMITATIONS: CURRENT APPROACH IN BROWNOUT
RTO-TR-HFM-162 2 - 5
Figure 2-2: Helicopter Entering a Brownout Condition.
These external ground-based features provide the pilot with necessary and valuable information for landing. However, the sudden loss of visibility or degraded visibility abolishes visual guidance references (pre-identified landmarks as stated above), other moving targets, distance and height perception that are essential to control the aircraft near the ground.
As brownout is a sudden phenomenon that occurs close to the ground, there is little tolerance for error and inherent correction delay. Although the sudden loss of visual references would necessitate the transitions from VMC (Visual Meteorological Conditions) to IMC (Instrument Meteorological Conditions), there remains an inadequacy between task requirements (landing in a non-visual environment) and the lack of feedback for drift and height above terrain, especially in legacy aircraft equipped with only standard flight instrumentation. By the time when lateral drift is detected, corrective actions might not be implemented on time.
Whiteout landings pose a similar problem to the helicopter pilot. As the aircraft descends closer to the ground, rotor downwash stirs loose snow which is drawn into the rotors and circulated (figure below). Visibility is significantly reduced and plots must adopt landing strategies similar to those used in brownout landings. Whiteout mishaps have been reported by Scandinavian and Canadian members of the Task Group.

PHYSIOLOGICAL AND PERCEPTUAL LIMITATIONS: CURRENT APPROACH IN BROWNOUT
2 - 6 RTO-TR-HFM-162
Figure 2-3: Helicopter Entering a Snow-Induced Whiteout Condition.
Figure 2-4: An Example of a Take-Off in Brownout Conditions.
PHYSIOLOGICAL AND PERCEPTUAL LIMITATIONS: CURRENT APPROACH IN BROWNOUT
RTO-TR-HFM-162 2 - 7
During flights under Instrument Flight Rules (IFR) in Instrument Meteorological Conditions (IMC), pilots should be able to read the instrument displays that provide the necessary, yet basic, spatial awareness information with confidence. Pilots who are trained to trust their instruments will most likely ignore the physiological inputs during landing even if external visual cues are available in order to concentrate on the flight instruments. Therefore, the instrument displays should be functioning properly in order to provide veridical flight parameters. However, in GVE, peripheral (ambient) vision facilitates the detection of drift and height above terrain which are the most critical information required during take-offs and landings.
The helicopter, by nature is an unstable platform. Pilots have to “work” persistently with their controls in order to gain and maintain stability. Without inputs to the controls through either the Automated Flight Control System (AFCS) or hands-on control, the position of the helicopter in three dimensional space can only be maintained for a very short period of time. Usually, it is much shorter than the time that it takes to land the helicopter. This time period depends on the specific airframe and the environmental conditions.
The landing procedure itself is challenging. In order to descend and land from hovering, the helicopter pilot must reduce the torque (force). The reduction of force immediately (within a fraction of a second) requires a change of tail rotor power. The amount of tail rotor power change is determined by the amount of main power reduction (the torque) and is in turn determined through visual information obtained by the pilot. The impact of a change in tail rotor power is to create drift, which is compensated by moving the cyclic, in order to influence the requirement of power. This process requires “working” of the controls by the pilot in order to maintain stability. Moreover, as the helicopter is closer to the ground, the rotors are further influenced by the turbulence of air impacting the ground and the subsequent reflection off the ground surface. If mission requirement dictates that the landing procedure were to be sped up (i.e., a quick reduction in power), it would create a greater disturbance.
The fidelity of current helicopter instrumentation is not sufficient to execute instrument landing in remote and unfamiliar Landing Zones (LZ) in DVE. Therefore “brownout landing” in current helicopters relies on hands-on control and may be supported by AFCS in some legacy airframes. The requirement of external (or virtual) visual cues is an important factor for safe take-offs and landings. Therefore, additional technological aids are required to support the aircrew in situations of limited visibility due to rising and re-circulating loose particulates (sand/snow) in order to avoid the SD trap of brownout/whiteout.
In order to secure safe landing, mission related visual cues that will provide drift, Height Above Terrain (HAT), descent rate, ground speed, attitude, slope, terrain features, LZ location, obstacle clearance and moving obstacle detection must be available. Specifically, drift is the most crucial information prior to touchdown as mentioned above. Ground speed refers to the horizontal speed in the final phase of the approach. The attitude of the aircraft refers to roll, pitch and yaw information. The priority and importance of this information depends on the helicopter type. For example, there is a distinct difference between the CH-53 and CH-47. In the CH-53 the information of the pitch attitude of the airframe prior to touchdown is critical in order to prevent the tail rotor from hitting the ground. If a CH-53 encounters a nose-up attitude greater than 12° short of the ground, it will impact the ground with the tail rotor first. On the other hand, this critical issue is not of concern in the CH-47 because of its tandem rotor system.
Mission related technologies such as auto hover functionality, sensors, helmet-mounted displays (AH-64 vs. CH-53 vs. UH-1D, etc.) and knowledge of the known and unknown geographical environment and time of day are equally important in order to maintain the full capability to safely land the helicopter in DVE. In searching for technological solutions, the following human factors related issues must be taken into consideration:

PHYSIOLOGICAL AND PERCEPTUAL LIMITATIONS: CURRENT APPROACH IN BROWNOUT
2 - 8 RTO-TR-HFM-162
a) Cultural mindset – Does the organisation support IFR training? b) Self-confidence – the pilots’ experience on the specific A/C, their specific role with respect to the
mission will all exert an influence on the pilots’ self confidence, regardless of their personalities. c) Lack of ambiguity – the procedure and rationale that one should follow when two independent
instruments showing contradicting data. Should this be allowed in principle? Should a solution be forced through the use of a third instrument in such cases?
d) Duplication of information displays – Since there are two crew-members on most platforms, identical information should be presented to both pilots, in order to allow the non-handling pilot to be able to alert the aircraft commander of safety concerns.
e) Workload – should be similar to those require for regular landing procedure. If a brief observation out the window in regular landing (e.g., NVG landing) is all that is required to provide enough data regarding attitude, drift, HAT, etc., then the brownout solution should aspire to maintain similar workload.
f) Latency – should be defined in numerical terms. For example, in AH-64 the latency between the movement of the head and the response of the Panoramic Night Vision System (PNVS) is around 50 – 100 ms.
g) Prevent coning of attention – A solution should be developed so that it will resemble known procedures such as those employed in NVG landing.
h) Perceptual issues – The implementation of such technology should be intuitive, easy to use and comprehend, and should be implemented in a manner that it would become intuitive (natural thing to do), not only in DVE, but also in normal procedures.
2.8 CONCLUSION
Brownout causes a loss of visual reference close to the ground, allowing little tolerance for error and a correction delay below that required for situational awareness. This will be compounded with inherent vestibular inadequacies. Sudden loss of visual references induces major changes in the piloting process, which increases the opportunity for SD. The discrepancy between task requirements (landing in a remote location in DVE) and insufficient information from legacy instruments and technology further compound the problem.
The potential risk mitigating strategies for rotary-wing brownout take-offs and landings could fall into two broad categories:
1) Technology development to overcome the environmental limitation described above under DVE conditions, for example, “see through” or “dust-penetrating” technology.
2) Technology development to overcome the physiological limitation under DVE conditions, for example, provide pertinent information, in an intuitive manner (better landing symbology systems or other sensory displays) to the pilot in order to compensate for the lack of external visual cues.
2.9 REFERENCES
[1] *Brandt, T., Dichgans, J. and Koenig, E. (1973). Differential effects of central verses peripheral vision on egocentric and exocentric motion perception. Exp Brain Res 16: 476-491.
* Supplemental Material.

PHYSIOLOGICAL AND PERCEPTUAL LIMITATIONS: CURRENT APPROACH IN BROWNOUT
RTO-TR-HFM-162 2 - 9
[2] Cheung, B. (2004). Spatial Orientation – Nonvisual Spatial Orientation Mechanisms. In: F. Previc, W. Ercoline (Eds.) Spatial Disorientation in Aviation. Progress in Astronautics and Aeronautics Volume 203. pp 37-94. American Institute of Aeronautics and Astronautics, Inc. Restin, VA, USA.
[3] Dichgans, J. and Brandt, T. (1978). Visual-vestibular interaction: Effects on self-motion perception and postural control. In: Held, R., Leibowitz, H. and Teuber, H.L. (Eds) Handbook of sensory physiology: Vol. 8. Perception. Springer-Verlag, Berlin, Germany.
[4] *Henn, V., Cohen, B. and Young, L.R. (1980). Visual-vestibular interaction in motion perception and the generation of nystagmus. Neurosci Res Program Bull 18: 457-651.
[5] *Hettinger, L.J. (2002). Illusory self-motion in virtual environments. In: Stanney, K.M. (Ed) Handbook of virtual environments: design, implementation, and application. Lawrence Erlbaum, Mahwah.
[6] *Howard, I.P. (1986). The perception of posture, self motion, and the visual vertical. In: Boff, K.R., Kaufman, L., and Thomas, J.P. (Eds) Handbook of perception and human performance: Vol. 1. Sensory processes and perception. Wiley, New York, USA.
[7] *Jansen, C., Wennemers, A., Vos, W. and Groen, E.L. (2008). Flytact: A Tactile Display Improves a Helicopter Pilot’s Landing Performance in Degraded Visual Environment. Lecture Notes in Computer Science 5024: 867-875.
[8] Malcolm, R. and Jones, G.M. (1974). Erroneous perception of vertical motion by humans seated in the upright position. Acta Otolaryngol 77: 274-283.
[9] *McCauley, M.E. and Sharkey, T.J. (2002). Cybersickness: perception of self-motion in virtual environments. Presence: Teleoperators and Virtual Environments 1: 311-318.
[10] Parmet, A.J. and Ercoline, W. (2008). Spatial orientation in flight. In: Davis, J.R., Johnson, R., Stepanek, J. and Fogarty, J.A. (Eds) Fundamentals of aerospace medicine. Lippincott, Williams, and Wilkins.
[11] Previc, F. and Ercoline, W. (2004). Spatial Disorientation in Aviation. Progress in Astronautics and Aeronautics Volume 203. American Institute of Aeronautics and Astronautics, Inc. Restin, VA, USA.
* Supplemental Material.

PHYSIOLOGICAL AND PERCEPTUAL LIMITATIONS: CURRENT APPROACH IN BROWNOUT
2 - 10 RTO-TR-HFM-162

RTO-TR-HFM-162 3 - 1
Chapter 3 – COUNTERMEASURES: HUMAN MACHINE INTERFACES
3.1 INTRODUCTION
As alluded to in Chapter 2, rotary-wing aircraft pilots are trained to rely primarily on external visual cues to land. Pilots will visually scan the intended or designated landing zone for hazards using ground features as a reference to maintain spatial orientation and adequate control of the aircraft. This becomes particularly important when landing or maneuvering near various obstacles such as trees, poles, buildings, etc. Because rotorcraft are inherently unstable and require constant control inputs, pilots must closely monitor the orientation of aircraft (i.e., attitude; the lateral, vertical, and longitudinal velocity and acceleration) at all times. When operating in Degraded Visual Environments (DVE; i.e., brownout, whiteout), the blowing dust or snow obscures ground features. Hence, pilots must rely on aircraft instruments and displays to safely maneuver (e.g., hover, take-off, landing) in such environments. Traditional displays using symbol sets to depict aircraft orientation provide no information with respect to drift while maneuvering the aircraft. They are mostly incapable of depicting potential obstructions (e.g., rocks, ditches, berms, vehicles) without an accompanying sensor system. By replacing some of the visual cues used for maneuvering with virtual references, one might prevent spatial disorientation during such degraded visual conditions. This section provides an overview of a number of sensory displays that have been investigated to aid the rotary-wing pilot in maintaining orientation while operating in DVE.
3.2 VISUAL DISPLAY
With respect to symbology for landings in DVE, there are two major symbology sets, 2-D low speed symbology and 3-D conformal symbology display system.
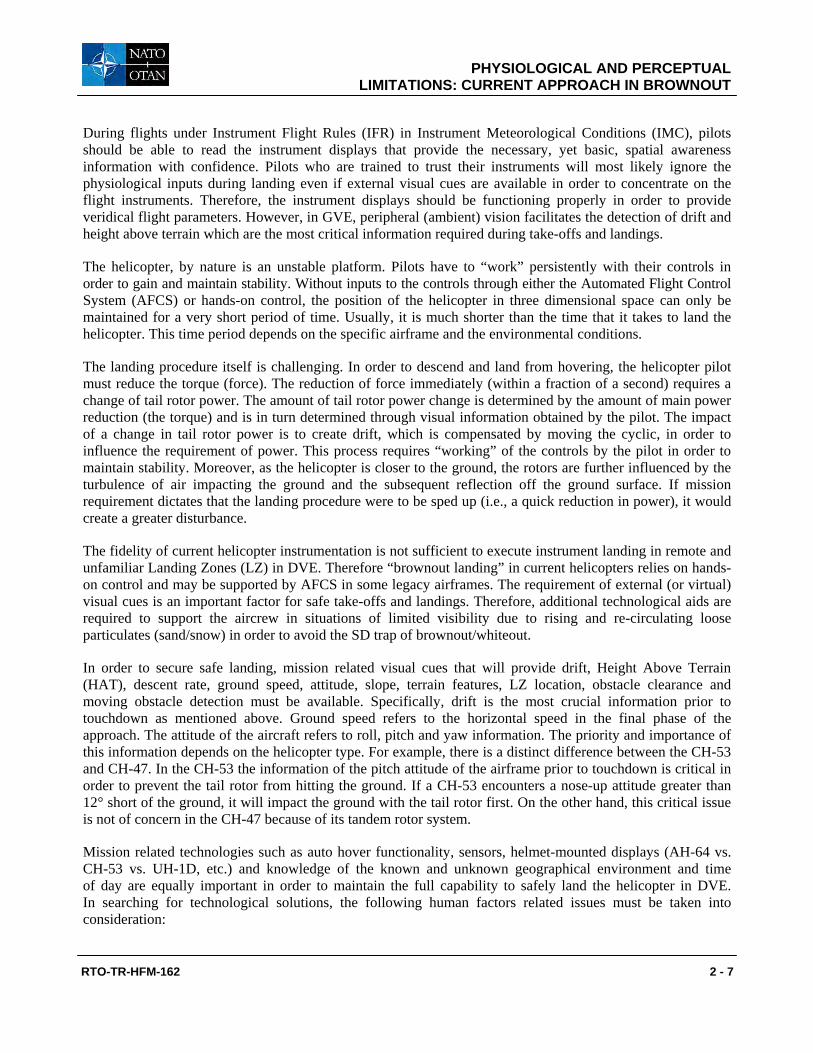
3.2.1 2-D Low Speed Symbology – Brownout Symbology System (BOSS) One of the low speed symbology systems is the Brownout Symbology System (BOSS) developed by the US Army AMRDEC (Aviation and Missile Research Development and Engineering Center). The BOSS symbol set was designed to be nearly identical for both the panel-mounted displays and head-mounted displays (such as NVG-HUD). In the case of panel-mounted displays, the BOSS display is designed to work with terrain imagery in the background from an imaging sensor (such as FLIR) or synthetic terrain imagery. The history, various phases of development, and evaluation of the BOSS symbology set is described in detail in Annex A and C.
The BOSS symbology set is illustrated in Figure 3-1 below. The latest version of BOSS symbology (2011) enables the entire approach to be accomplished on a single display page starting at any speed. The page used is called the Hover-Approach-Take-Off (HAT) page. A logarithmic scale is used for ground speed beyond 10 knots and for landing/hover point position beyond 100 ft. Therefore distracting scale changes, which are common on other 2-D displays, are not necessary with the BOSS symbology. The pitch ladder scale is fixed on the screen enabling the same scale marks to be used for pitch and horizontal speed. Therefore a horizon line and pitch scale are always available, in case of go-around during the approach.
COUNTERMEASURES: HUMAN MACHINE INTERFACES
3 - 2 RTO-TR-HFM-162
Figure 3-1a: Enroute Page of BOSS Symbology.

COUNTERMEASURES: HUMAN MACHINE INTERFACES
RTO-TR-HFM-162 3 - 3
Figure 3-1b: Hover-Approach-Take-Off (HAT) Page of BOSS Symbology.
The aircraft reference symbol in the center of the screen is the plan-view of the own-ship location. Key elements of the hover symbology for BOSS include the velocity vector and acceleration cue symbols. The target speed symbol is scaled in the same manner as the velocity vector. At 0.8 nm the target speed symbol is activated (turned on). The target speed algorithm always starts at the speed of the aircraft when it crosses the 0.8 nm distance boundary. As the aircraft approaches the landing point the horizontal speed guidance algorithm directs the pilot to slower speeds, while the vertical speed guidance algorithm indicates the correct descent rate. In addition to providing the desired speed, the target horizontal speed symbol also rotates about the own-ship symbol to provide target ground tracking to the landing point.
The horizontal speed guidance equations used in earlier simulation tests [1];[2] were determined to be too slow during AFRL (Air Force Research Laboratory) simulations. The linear speed versus distance equations were modified by AFRL to include a constant deceleration portion for most of the distance. At 500 ft, the constant deceleration equations transitioned to a linear speed versus distance guidance algorithm. The reason for keeping the linear speed vs. distance portion was to decrease the deceleration near the landing point, as compared to the constant deceleration algorithm. Therefore, there is a smaller attitude change required near the landing point when close to the ground.
The flight path marker symbol is useful in situations where the elevation of the landing point is not known ahead of time, nor can it be measured with a sensor. The flight path marker shows the current direction of

COUNTERMEASURES: HUMAN MACHINE INTERFACES
3 - 4 RTO-TR-HFM-162
travel with respect to the terrain imagery. The pilot can manipulate the controls to hold the flight path marker over the image of the landing point, indicating that the aircraft is on the correct descent angle to the landing point. The flight path marker is set to change to a “dashed” format below 20 knots ground speed, and to turn off below 10 knots ground speed. On a head-mounted display, the flight path marker symbol requires a head tracker.
Key milestones of the Brownout Symbology System development are described in Annex A of this document.
3.2.2 3-D Conformal Symbology Display System – FTL 3-D Conformal Symbology
One of the biggest challenges for any kind of technology used for DVE landing and take-offs is to provide intuitive displays and keeping the workload low while providing all the necessary cues for the pilots to perform the tasks safely and efficiently.
The generic design of helmet-mounted 3-D conformal symbology is based on the augmented reality principle, whereby symbols are placed accurately on the real world ahead of the aircraft. The concept attempts to mimic a real-world cueing mechanism by providing stationary cues from which relative movements (differential motion parallax) and closure rates and relative height can be extracted by the pilot in the same manner as real-world cues. Figure 3-2 presents the contrast between a traditional 2-D fixed symbology display which presents flight, navigation and helicopter systems data and a 3-D symbology display presents “real world” information such as landing point position, ground references, and pilot line of sight. The virtual reference symbols provide the overall intuitive impression of all necessary cues for landing and take-off such as height (altitude), drift, landing position, rate of closure (rate of decent and ground speed), and attitude. The intention is to provide a natural cueing environment to ensure conventional control by the pilot in DVE by providing the key orientation elements listed above.
2-D Symbology 3-D Symbology
Figure 3-2: A Comparison between 2-D and 3-D Symbology Displays.

COUNTERMEASURES: HUMAN MACHINE INTERFACES
RTO-TR-HFM-162 3 - 5
A 3-D conformal symbology system is designed to be installed on legacy and new helicopters, with no requirement to have a Digital Automatic Flight Control System (DAFCS) or Fly-By-Wire capability.
More detailed information of the 3-D symbology shows that a few key elements are used to provide an intuitive interpretation of the symbology as shown in the following diagram (Figure 3-3):
• Reference towers – Provide an approximate altitude. Used mainly when it is away from the LZ.
• Reference boxes – Replace the contrast object used for reference in visual hover. • Used on final approach stage – near the LZ. • Provide both drift and “gentle” altitude perception. • Scattered in several locations to allow pilots with different landing “habits” to look at the
reference box in the same manner as employed during normal visual flight.
• Landing grid – represents the ground level at the LZ. It provides drift and altitude perception, mainly during approach.
• Landing point – Allows the pilot (along with other cues) to determine the exact landing point. The pilot can look “into the cockpit” to view the landing point as if the cockpit is transparent.
• 2-D flight data are combined with the 3-D symbols (altitude, torque, heading, etc.).
They provide additional data that the 3-D symbols do not provide and allows the pilot to “calibrate” his perception of altitude and speed, etc. – see Figure 3-3 below.
Figure 3-3: 2-D Flight Data are Combined with the 3-D Symbols.

COUNTERMEASURES: HUMAN MACHINE INTERFACES
3 - 6 RTO-TR-HFM-162
Figure 3-4: Line of Sight Principle.
However, there are a few major requirements in order to generate an efficient 3-D conformal symbology:
• Helicopter sensors – To provide accurate, frequent and reliable data (including precise position, height and a digital terrain database).
• Display generator – Uses data from the helicopter to generate symbology.
• Head tracking and designation – To provide head position (Line of Sight) information to the display generator.
• Helmet-mounted Display HMD) – To present combined symbology to the aircrew.
• Integrated system – Optimizing system performance, in parameters that are crucial to the pilots such as latency (delay between gathering and displaying the information), real-world registration (how is the symbology displayed on the real world) and consistency of elements in the display.
• LOS (Line Of Sight) principles as depicted in the Figure 3-3.
3.2.2.1 Synthetic Vision
Synthetic vision is the construction of a three-dimensional image of the landing zone using a combination of flight dynamics information (position, height above ground, aircraft attitude) and a terrain database. Such systems are being introduced on civil airliners to aid situational awareness in poor weather. Synthetic

COUNTERMEASURES: HUMAN MACHINE INTERFACES
RTO-TR-HFM-162 3 - 7
vision provides a clear view of the landing zone during approach and landing in brownout and will improve situation awareness of the outside world. The imagery should be relatively intuitive and enable a visual flight control strategy to be maintained. The concept has application to improved Day Night All Environment capability assuming the sensors can gather all the information required and it can be processed and presented in a timely and readily interpretable form to enable safe flight.
3.3 ALTERNATIVE DISPLAYS
Traditionally pilots receive flight related information either visually or aurally. Cockpit instruments, flight displays, head-up displays, etc., present visual information. Auditory information comes from warning signals and from communication with crew-members, other aircraft in the mission and air/ground control. In mission scenarios under operational conditions (e.g., Afghanistan), pilots’ visual and auditory senses may be heavily involved, requiring high levels of concentration inducing considerable workload. Workload may be increased further because information is not necessarily presented in the most effective ways. In order to lower pilot workload and increase mission effectiveness, research has explored possibilities to present information in alternative, more intuitive modalities. The main developments include alternative visual displays as described above, 3-D audio, and tactile displays, or a combination thereof. In general, these displays are often referred to as multi-modal displays. Moreover, modern cockpit interfaces may use voice recognition (direct voice input or DVI) and speech synthesis, facilitating hands-off handling of flight parameters. The following section deals with some of these alternative displays.
3.3.1 3-D Audio Displays Overview Normal binaural hearing allows for 3-D sound localization. Determination of 2-D lateral direction (left or right) is based on the interaural time and differences in sound level. Sound from the left side of the listener reaches the left ear before the right ear, and with higher intensity due to the head shadow effect. Regular stereo audio systems are capable of presenting sound with lateral direction, and provide limited information about the distance of its origin. Discrimination of sounds in the median plane (above, below, front and back), as well as their distance, also depends on direction-selective reflections at the ears, head, shoulders and torso, causing spectral transformations. The 3-D audio systems or spatial audio systems can present 3-D directional sound through headphones. Spatial audio creates a natural sensation of sound as if they arise from the outside world. The technique is based on a set of real-time digital audio filters (HRTF, Head-Related Transfer Function) which recreate the spectral transformations caused by the shape of the ears, head, and torso.

COUNTERMEASURES: HUMAN MACHINE INTERFACES
3 - 8 RTO-TR-HFM-162
Figure 3-5: 3-D Audio.
To obtain optimal results, the HRTFs should be individualized so that they match the individual direction-sensitive reflections of the listener’s head and ears. Use of generic HRTFs increases the risk of mis-localization, in particular front-back reversals inherent to the perceptual ambiguity between sounds in the median plane. This ambiguity can be resolved by making small head movements, which requires head tracking. Nevertheless, generic filters generate directional information that is reasonable for most applications, but it may require training to adapt to these filters [3].
In general, directional sounds are detected and interpreted more easily among other sounds or against background noise. Flight simulator studies showed that fighter pilots can afford to pay more visual attention for additional tasks when warnings are presented on a 3-D audio display [4]. The investigated audio displays include threat warnings and Traffic Alert and Avoidance System (TCAS). With 3-D audio, the overall performance increased, indicating a reduced workload. Another simulator study with fighter pilots showed that 3-D audio may also be useful in communication and situation awareness, for example, presenting the location of the wingman relative to the own ship [11]. The main advantage of this is that directional information is readily available. Presently, 3-D audio systems are commercially available. The Danish Air Force has employed a 3-D audio system in their F-16s as has the US Air Force in their F-35s.
Although 3-D audio systems may be useful for some applications in rotary-wing aircraft, there are some perceptual and operational limitations that could prohibit their use during helicopter landing. These are:
• Possibility of front-back reversals. • Limited number of different auditory signals that a person can distinguish (no more than three
or four). • As in any auditory communication, virtual sounds or radio communication can mask other environmental
sound. (Similarly, virtual sounds can also interfere with speech of team members.) • The introduction of 3-D audio may require testing individual pilot for accurate binaural hearing. • Limited spatial resolution; even when the signals are well designed, it is impossible to improve
auditory resolution (which, in comparison with the visual system, is quite poor). • For virtual sound sources, resolution is often worse, especially if the sound source is not compensated
for head movements.

COUNTERMEASURES: HUMAN MACHINE INTERFACES
RTO-TR-HFM-162 3 - 9
• In certain situations it is problematic or even unsuitable to present auditory information such as in noisy environments (the case in many military environments), while in other situations there may be excessive auditory information.
3.3.2 Tactile Displays
Research has shown great potential of tactile displays for navigation and spatial orientation in military environments. Tactile displays make use of vibrating elements (‘tactors’) to relay information to the skin. A well-known example is the vibrating function of a cell phone or paging devices. The development of (military) tactile displays has been driven by the objective to reduce sensory and cognitive workload. In high-workload situations the pilot’s visual and auditory sensory channels are usually occupied by scanning cockpit instruments and communication, respectively. The skin provides an extra sensory channel, which works in parallel with the other sensory channels. The use of tactile displays has been successfully shown in several aviation situations, for instance as a countermeasure for spatial disorientation [5];[12], helicopter hovering [7]; [13];[9], and threat intercepts under high G-loads [10]. Hence, a tactile display can be considered a cockpit instrument with the possibility to present orientation information. In other words, it can be used as a multi-function display. The usefulness of tactile displays for military applications has been extensively reviewed in the final report of the RTO TG-122 “Tactile Displays for Orientation, Navigation and Communication in Air, Sea and Land Environments (2008)”.
Figure 3-6: Examples of Tactile Cueing Devices; Vest (left); Seat (right).
For several reasons, tactile displays offer a promising support tool for rotary-wing pilots in brownout conditions or DVE in general. The most significant advantage of tactile displays is that they do not require the pilot to look or listen: they are “eyes and hands free”. This is especially relevant in the final phase of landing, where pilots need their eyes to maintain visual contact with a reference point in the outside scene and require

COUNTERMEASURES: HUMAN MACHINE INTERFACES
3 - 10 RTO-TR-HFM-162
their ears to listen to the call-outs from the loadmaster and the non-flying pilot monitoring the descent. When non-visual information about the aircraft’s motion is available, the pilot does not need to look inside the cockpit. This advantage may be complementary to modern HUD symbology. However, by presenting aircraft motion in the HUD (e.g., acceleration) will help the pilot to remain head-up, there is still a requirement for him to allocate his visual attention to the HUD, rather than the outside scenery. Under stressful conditions it is questionable whether the pilot can look at the HUD and the outside landing reference at the same time.
Another advantage of a tactile display is that, with appropriate configuration of the tactors, it can provide three-dimensional spatial information in an intuitive manner. Consistent with the “tap-on-the-shoulder” principle, humans can easily externalize the direction of a tactile stimulus. For example, when a pilot feels a tactor on his right flank, he immediately knows that something happens on his right side. This ‘something’ can be a threat warning, or in case of brownout landing, intentional or unintentional drift. As with visual instruments, the information presented on a tactile display depends on the demands of the application. There have been a number of in-flight studies that have investigated the usefulness of tactile displays for DVE. They are described in Annex B.
3.3.3 Haptic Controls Haptic controls are sometimes referred to as “active controls”. The flight controls of helicopters configured with active controls begin to vibrate when the flying pilot nears an aircraft system or flight limitation (e.g., maximum power available, bank angle). Although not considered a “display” for landings or take-offs in DVE, haptic controls can relieve the pilot from having to visually monitor power settings and landing attitudes, thus, allowing the pilot to maintain his or her visual attention on those instruments critical for landing or on outside visual cues. In effect, its benefit is that it reduces the flying pilot’s visual workload in addition to providing non-visual information that will reduce the likelihood of exceeding aircraft operating limitations. The effectiveness of haptic controls has been successfully demonstrated in several simulations and flight campaigns.
3.3.4 Conclusion There has been intensive research and development in display systems; however, various sensor technologies are required to gather the information in order to create appropriate displays. The following chapter describes the various sensor technologies that are available. A detailed analysis of the various sensor technologies in terms of capability, strengths, limitations, system readiness, human factors and integration issues are described in the following chapter.
3.4 REFERENCES
[1] Szoboszlay Z., Albery, W.B., Turpin, T. and Neiswander, G.M. (2008). Brown-Out Symbology Simulation (BOSS) on the NASA Ames Vertical Motion Simulator, American Helicopter Society 64th Annual Forum.
[2] Szoboszlay Z., McKinley R. and Turpin T. (2009). Symbology for Brown-Out Landings: The First Simulation for the 3D-LZ Program. American Helicopter Society 65th Annual Forum.
[3] Carlander, O. and Eriksson, L. (2006) Uni- and Bimodal Threat Cueing with Vibrotactile and 3D Audio Technologies in a Combat Vehicle. In Proceedings of the HFES 50th Annual Meeting. San Francisco, CA, USA: Human Factors and Ergonomics Society.

COUNTERMEASURES: HUMAN MACHINE INTERFACES
RTO-TR-HFM-162 3 - 11
[4] Veltman, J.E. and Jansen, C. (2004). The adaptive operator. In: D.A. Vincenzi, M. Mouloua and P.A. Hancock (Eds.), Human Performance, Situation Awareness and Automation Technology (HSPAA II), March 22-25, 2004, Daytona Beach, FL, USA, Vol. II, pp. 7-10.
[5] Raj, A.K., Suri, N., Braithwaite, M.G. and Rupert, A.H. (1998). The tactile situation awareness system in rotary wing aircraft: Flight test results. In: Proceedings of the RTA/HFM Symposium on Current Aeromedical Issues in Rotary Wing Operations, pp. 16-1 – 16-7. Neuilly-sur-Seine, France: RTO NATO.
[6] *Van Erp, J.B.F., Bos, J.E., Groen, E. and Van Veen, H.A.H.C. (2003). A spatial disorientation suit as instrument to counteract spatial disorientation. Report TM-03-A. Soesterberg, the Netherlands: TNO Human Factors.
[7] Raj, A.K., Kass, S.J. and Perry, J.F. (2000). Vibrotactile displays for improving spatial awareness. In: Proceedings of the Human Factors and Ergonomics Society Annual Meeting. Santa Monica, CA, USA: Human Factors and Ergonomics Society.
[8] *Van Erp, J.B.F., Veltman, J.A., Van Veen, H.A.H.C. and Oving, A.B. (2003). Tactile torso display as countermeasure to reduce night vision goggles induced drift. In: Spatial disorientation in military vehicles: causes consequences and cues. RTO Meeting Proceedings 86, pp. 49-1 – 49-8. Neuilly-sur-Seine, France: NATO RTO.
[9] Schultz, K., McGrath, B., Cheung, B., Craig, G., Jennings, S. and Rupert, R. (2009). In flight evaluation of tactile situation awareness system during high hover and simulated shipboard landing. In: Proceeding of American Institute of Aeronautics and Astronautics conference on “Guidance, Navigation and Control”, Chicago, IL, USA. August 2009.
[10] Van Veen, H.A.H.C. and Van Erp, J.B.F. (2001). Tactile information presentation in the cockpit. In: S. Brewster, R. Murray-Smith (Eds.): Haptic Human-Computer Interaction. Lecture Notes in Computer Science, pp. 172-181. Springer Verlag.
[11] Groen, E., Cornelisse, E-J., Jansen C., Van der Hoorn, J. and De Graaf, B. (2009). Personalized intuitive displays enhance pilot performance. RTO-MP-HFM-181/27 presented at the RTO Human Factors and Medicine Panel Symposium, Sofia, Bulgaria, 5-7 October 2009.
[12] Van Erp, J.B.F., Groen, E.L., Bos, J.E., and Van Veen, H.A.H.C. (2006) A tactile cockpit instrument supports the control of self-motion during spatial disorientation. Human Factors 48 (2); 219-228.
[13] Van Erp, J.B.F., Veltman, J.A., Van Veen, H.A.H.C. and Oving, A.B. (2002). Tactile Torso Display as Countermeasure to Reduce Night Vision Goggle Induced Drift. NATO RTO HFM Panel Symposium “Spatial disorientation in military vehicles: causes, consequences and cures”, La Coruna, Spain, 15-19 April 2002.
* Supplemental Material.

COUNTERMEASURES: HUMAN MACHINE INTERFACES
3 - 12 RTO-TR-HFM-162

RTO-TR-HFM-162 4 - 1
Chapter 4 – TECHNOLOGY: SENSORS AND DATA PROCESSING
4.1 INTRODUCTION
This chapter investigates the application of technology to improve safety during landing in brownout. Our first objective is to define various assumptions that will shape the requirements for specific technology. A second objective is to provide a review of relevant generic technologies identified from both government and industry programmes that will provide potential brownout solutions. For each technology, key capabilities, strengths, limitations, system maturity level, system integration requirements, required sub-systems and human factors issues will be reviewed. This is followed by a discussion which will aim to identify the most realistic technologies that are suitable for short term or immediate brownout solutions and future technologies that could provide enhanced capability over a longer timescale, together with technical approaches which may have been abandoned by some countries. The discussion will also illustrate the impact of different platform capabilities and scenarios on technology selection. The section will close with recommendations on immediate and future technology strategies for DVE landing risk mitigation.
4.2 TECHNOLOGY ASSUMPTIONS
The requirement for additional technology to aid brownout landings is dependent on the capability of the helicopter type, its avionics and the way it is operated, together with the operational scenario which dictates the visual environment and the level of preparation at the intended landing zone. Furthermore, a minimal set of “pilotage information” is required by the aircrew to complete the landing task safely. Failure to provide different parts of the information set may contribute to different types of brownout accident.
4.2.1 The Helicopter For the purpose of our discussion, we will consider a generic, legacy helicopter operated by a Handling Pilot (HP), Non-Handling Pilot (NHP) and rear crewman. This generic platform will have a basic flight and navigation capability, for example, head-down primary flight instruments, simple GPS (Global Positioning System), Barometric and Radar Altitude, and a conventional rate command flight control system (essentially analogue avionics) to transit from level flight to the intended landing zone. A generic approach and landing procedure is also assumed that will cover helicopters of all configurations, i.e., skids/wheels/single/double main rotor. It should be noted that helicopters with digital avionics, may have been equipped with some advanced technologies which may provide additional information beyond the minimal requirement.
4.2.2 Mission Scenario The scenario in which the mission is conducted will affect the level of information available from the outside world and hence the onboard brownout capability required to support the crew during the landing. For the purpose of the scenario, no dust suppression techniques are employed and brownout is assumed to occur over all terrains during every landing. Our discussion is also limited to the brownout landing phase and does not include the navigation phase. Three scenarios have been defined as follows:
1) Day Scenario: Operations in day light only to a Landing Zone (LZ) of known characteristics (e.g., ATP49 – prepared by ground forces), secured, cleared of Improvised Explosive Devices (IEDs), provided with detailed pre-recce information of the LZ together with generous planning time. In addition, there are no hostile forces present and multiple landing attempts are possible;

TECHNOLOGY: SENSORS AND DATA PROCESSING
4 - 2 RTO-TR-HFM-162
2) Night Scenario: As above but including night operations with adequate illumination; and
3) Worst Case Scenario: Operations to an unprepared LZ of unknown characteristics, unsecured, with short planning time and no detailed pre-recce information (such as slope, surface, surrounds, size, shape, etc.). In addition, it is a hostile, combat environment where multiple landing attempts and go-arounds are highly undesirable. This applies to both day and night operations with low illumination and a high possibility of heavy brownout, for example, during Combat Search And Rescue (CSAR), Quick-Reaction Force (QRF) infill/exfill at night or Immediate Response Team (IRT).
4.2.3 Minimal Information Required for Safe Landing For each of the above scenarios, the minimal SA information required for safe landing can be broadly divided into:
1) Aircraft State Awareness:
• Drift (longitudinal and lateral speed below GPS velocity detection limit or visual sub-threshold detection level, down to 1 m/minute resolution and a 10 Hz update rate);
• Height Above Ground Level (AGL) and Rate Of Descent (ROD);
• Groundspeed (40 Knots Indicated Airspeed (KIAS) down to minimum velocity detection (note most aircraft have pitot tube systems which are only reliably down to 40 KIAS); and
• Attitude indication (must be available prior the onset of re-circulated particulates, and exceeding the pitch/roll limits of the aircraft).
2) LZ situation awareness:
• Size, shape, surface, slope, surrounds, obstacles and hazards.
In each scenario, the information requirement can be contributed from different sources, for example, from the HP’s unaided eye view or sensor view through NVG, “patter” from the NHP using head-down instruments or “talk down” from the rear crewman with awareness of the encroaching brownout cloud and ground surface. More complex presentations of the “outside world” can be generated from multiple sensors and databases, for example, synthetic vision. These different technological approaches offer different levels of capability and currently exist at different levels of technical maturity.
4.2.4 Types of Brownout Accident The causes of accidents have been described in earlier chapters and provide a focus for the application and prioritisation of potential technology solutions. In general terms, helicopter landing accidents in re-circulated dust can be divided into the following causes:
1) Spatial disorientation (lack of aircraft state awareness); and
2) Collision with surface hazards (lack of LZ situation awareness).
Different technologies may be used onboard to address each accident cause. Furthermore, off-board technology may be used to minimise the magnitude of re-circulated dust, for example, landing zone preparation techniques.

TECHNOLOGY: SENSORS AND DATA PROCESSING
RTO-TR-HFM-162 4 - 3
4.3 TECHNOLOGIES
4.3.1 Onboard Systems A range of technologies with different capabilities have been proposed to be of potential benefit in brownout landings. However, it is highly likely that any brownout solution intended to improve the pilot’s Situation Awareness (SA) will at minimum make use of a sensing component and a display component and therefore comprise a system. A modular systems approach has been employed to identify and categorize technologies as follows:
1) Sensors:
• Radar;
• Laser; and
• Passive Electro Optical.
2) Human Machine Interface (Displays):
• Symbology;
• Head-mounted Display;
• Synthetic Vision;
• Tactile; and
• Haptic.
3) Flight Control:
• Automatic Flight Control System with advanced flight control laws.
A minimal system will gather and present information effectively to provide the pilot with adequate SA, for example, relayed information from NHP or crewman. Systems which provide SA to the pilot directly may be more complex, for example, providing aircraft state cues in real time to allow safe stabilisation and control of the helicopter. The system may provide critical flight information and the eventual certification must be considered at all system levels as this will directly impact the release to service recommendations.
The accuracy with which the sensed, integrated and presented information represents the outside world, and the efficiency with which it is communicated to the designated crew-member (e.g., pilot or rear crewman), will depend on the capabilities of the different technologies within the system and how effectively they are integrated together. Some systems will be quite simple, for example, Low Light level TV (LLLTV) cameras mounted under the fuselage to give landing point surface information may be fed directly to a display for the NHP or crewman. Systems intended for the HP will need to at least provide the minimal information set described earlier and are likely to use a variety of sources combined together, forming an inherently more complex solution. It should be noted that on-going research and development in camera systems (e.g., IR cameras) will provide additional enhancement of the visual environment in the future.
Where a visual representation of the outside world is used for the HP, key system requirements will include the spatial and contrast resolution of the sensor, for example, the ability to detect and recognise fine features, surface texture, slope and obstacles in all light levels and through dust. The sensed data must then be processed into a readily interpretable picture and presented to the aircrew in a timely fashion without

TECHNOLOGY: SENSORS AND DATA PROCESSING
4 - 4 RTO-TR-HFM-162
excessive latency, for example, such that the picture responds correctly with aircraft movement. The display technology should at least match the sensor in terms of spatial and contrast resolution, field of view and dynamic response to minimise the loss of information in the presentation process. The human factors of the information presentation are critical to enable intuitive interpretation and prevent excessive workload, particularly in high stress environments.
4.4 ANALYSIS OF SENSOR SUB-SYSTEMS
4.4.1 Radar Current Terrain Following (TF) / Terrain Avoidance (TA) radar that has been used on helicopters for weather penetration capability operating at approximately 15 GHz does not see through dust. Research programmes have shown that radars operating at high frequencies (35 to 94 GHz) provide precise dust penetrating height and descent rate information or obstacle warning capability for enhanced situation awareness.
4.4.1.1 Active MMW Radar Altimeter Sensor
4.4.1.1.1 Capability
Active millimetre wave radar altimeters operating in the 77 GHz and 94 GHz frequency bands provide a see through dust capability with greater accuracy and consistency than conventional RadAlts (which typically operate in the 4 GHz frequency band). Specifically, they provide improved height above ground measurement for the final approach and landing phase.
4.4.1.1.2 Strengths
Active millimetre wave RadAlts are small in size and weight with compact, integrated antennas which is advantageous when integrating on an airframe. They offer centimetric resolution and more consistent operation over a range of different terrain surfaces. Testing at 77 GHz and 94 GHz has shown minimal attenuation due to dust. They have a low power consumption and use small transmission power (~10 mW) with low probability if intercept.
4.4.1.1.3 Limitations
Such RadAlts have short range capability at about 100 m.
4.4.1.1.4 System Maturity
Systems have been developed for Unmanned Air Vehicle applications and are being adapted to meet the release to service/flight certification requirements for manned helicopters. Technology has also been exploited from commercial, automotive cruise control radars. There are systems developed specifically for helicopters which are being implemented as part of the German brownout solution.
4.4.1.1.5 System Integration Issues
The reduced weight, size and power consumption ease the integration issues with helicopter airframes and give the potential to mount them in potentially unconventional and multiple locations on the airframe.

TECHNOLOGY: SENSORS AND DATA PROCESSING
RTO-TR-HFM-162 4 - 5
4.4.1.1.6 Required Sub-Systems
Power and interfacing to aircraft avionics.
4.4.1.1.7 Human Factors
No issues directly – radar altimeters are considered to be important sub-systems to provide accurate height above ground in the final approach and landing phase and will be used to support improved symbology.
4.4.1.2 MMW Electronic Bumper Sensor
4.4.1.2.1 Capability
Electronic bumper sensors are based on small active millimetre wave radars which provide obstacle detection (moving or static) and proximity warning to the pilot. Their see through dust capability promises improved situation awareness within the brownout cloud during landing and take-off. For example, the sensors could be used to pick up dynamic obstacles such as vehicles or people, which have moved into the landing zone during brownout.
4.4.1.2.2 Strengths
Small and light, multiple sensors can provide a wide field of regard around the airframe. Alternatively, the radar sensor can be mechanically scanned to provide 360 degree coverage. The radar sensors can be derived from commercial automotive applications, e.g., cruise control radar, and are cost effective.
4.4.1.2.3 Limitations
The sensors are generally short range, <300 m, and rely on returned signal strength (i.e., radar cross-section which may be independent of obstacle size) to detect obstacles. The capability may not allow obstacle recognition so an avoidance strategy may be based on incomplete information.
4.4.1.2.4 System Maturity
Electronic bumpers are being developed in different research programmes worldwide. Some have been flight tested on target platforms and sensor technology is between TRL 5 and 7 (Table 4-1). The system technology, i.e., sensor combined with processing and displays is less mature.
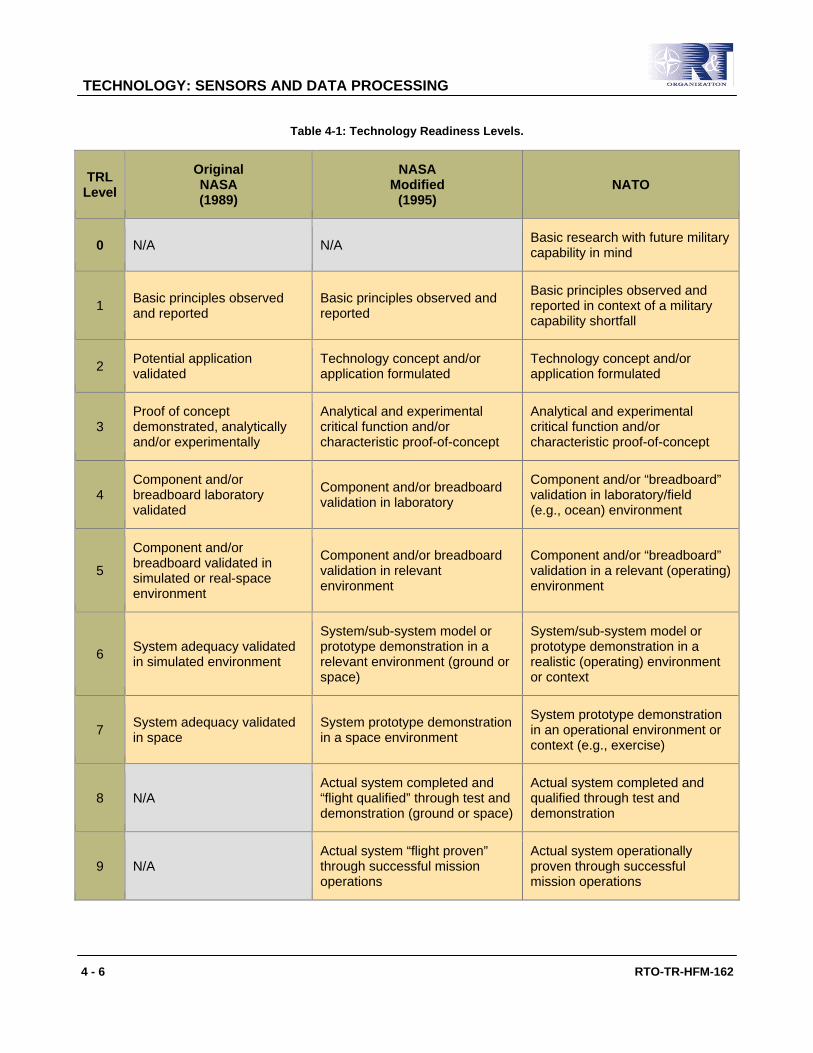
TECHNOLOGY: SENSORS AND DATA PROCESSING
4 - 6 RTO-TR-HFM-162
Table 4-1: Technology Readiness Levels.
TRL Level
Original NASA (1989)
NASA Modified
(1995) NATO
0 N/A N/A Basic research with future military capability in mind
1 Basic principles observed and reported
Basic principles observed and reported
Basic principles observed and reported in context of a military capability shortfall
2 Potential application validated
Technology concept and/or application formulated
Technology concept and/or application formulated
3 Proof of concept demonstrated, analytically and/or experimentally
Analytical and experimental critical function and/or characteristic proof-of-concept
Analytical and experimental critical function and/or characteristic proof-of-concept
4 Component and/or breadboard laboratory validated
Component and/or breadboard validation in laboratory
Component and/or “breadboard” validation in laboratory/field (e.g., ocean) environment
5
Component and/or breadboard validated in simulated or real-space environment
Component and/or breadboard validation in relevant environment
Component and/or “breadboard” validation in a relevant (operating) environment
6 System adequacy validated in simulated environment
System/sub-system model or prototype demonstration in a relevant environment (ground or space)
System/sub-system model or prototype demonstration in a realistic (operating) environment or context
7 System adequacy validated in space
System prototype demonstration in a space environment
System prototype demonstration in an operational environment or context (e.g., exercise)
8 N/A Actual system completed and “flight qualified” through test and demonstration (ground or space)
Actual system completed and qualified through test and demonstration
9 N/A Actual system “flight proven” through successful mission operations
Actual system operationally proven through successful mission operations

TECHNOLOGY: SENSORS AND DATA PROCESSING
RTO-TR-HFM-162 4 - 7
4.4.1.2.5 System Integration Issues
The radar requires a display system to convey proximity warning information to the pilot. This may be achieved through a dedicated additional display (requiring integration into the cockpit) or integration with existing head-down displays or head-mounted displays. Alternatively, a display could be provided to the rear crewman. Distributed sensors require suitable locations on the airframe, whereas a scanned sensor may consist of a single, but larger unit mounted underneath the airframe where there insufficient ground clearance. Integration with the aircraft navigation system may be required for aircraft attitude reference and geo-location.
4.4.1.2.6 Required Sub-Systems
Power and suitable display sub-systems.
4.4.1.2.7 Human Factors
Two human factors issues have been identified; how the information is displayed and how it is being used. A head-mounted display is desirable to reduce attention away from the outside world view and some symbology display concepts have been developed which integrate proximity warning with flight symbology. The second issue concerns the concept of operation whereby once a warning is received, what action should be taken.
4.4.1.3 Scanning Active Millimetre Wave (MMW) Radar Sensor
4.4.1.3.1 Capability
Active millimetre wave radar operating at the 77 GHz to 94 GHz range that has a “see through” dust capability and when combined with mechanical or electronic/phased array scanning promises the ability to survey a landing zone both before and during brownout. Radar technology has been researched for this role and adapted from existing applications such as missile seekers. The radar is capable of building up a 3-dimensional description of the surveyed terrain using time of flight ranging and angular measurements to objects which reflect the radar energy. The radar data can be used to update a terrain database, however, the data must be processed and displayed to the pilot in a suitable form and this area of technology is currently immature. It is however under development for synthetic vision systems (see later).
4.4.1.3.2 Strengths
Millimetre wave radars operating at around 94 GHz have been demonstrated to have negligible attenuation in dust. Radars derived from missile seekers can be small, lightweight with a compact antenna aperture which reduces the integration issues associated with mounting on the airframe. Mechanical scanning enables an area to be surveyed ahead of the aircraft. Range resolution is sub-metre whereas angular resolution may depend on the mode of operation. For example, a search mode could provide detections within the scanned beam without quantifying the elevation or azimuth angles to the target, whereas a track mode could measure the angular position of the radar beam. The angular resolution is determined by the beamwidth of the radar. To determine the target position within the beam a monopulse capability can be used which provides increased angular resolution to locate targets more precisely. Doppler tracking can also be used to locate targets more accurately. Trials have shown that millimetre wave radars are capable of detecting the majority of obstacles and features likely to be encountered during landing.

TECHNOLOGY: SENSORS AND DATA PROCESSING
4 - 8 RTO-TR-HFM-162
4.4.1.3.3 Limitations A number of system trade-offs exist which limit the ability for current Commercial Military Off-The-Shelf (CMOTS) millimetric wave radars to completely fulfil the brownout landing recce requirement. The radar should have a scan pattern which enables the complete LZ to be covered throughout the approach and have sufficient scan rate to provide real-time data for display. The apparent increase in the angular width of LZ as range reduces causes an increase in the area to be scanned. The resolution of the radar is limited by the beam width. The beam width can be reduced by increasing the aperture but this also reduces the scan time or the dwell time on target which reduces detection capability. Current beam widths may prevent detection of fine features such as poles and wires and wire detection at oblique angles can be very problematic. Improved resolution may require a mono pulse capability for both azimuth and elevation angles. The radar cross-section of the target is independent of physical size; hence, an apparently large detection may result from an object of unimportant size (e.g., metallic corner reflector) and vice versa. Radars are usually designed to detect manmade features by removing radar clutter caused by reflections from the ground, however, for brownout landing surface recce, many of the features of interest, for example, ditches, rocks and berns may fall within the ground clutter. Effective techniques to process radar data to extract relevant, naturally occurring features will be required. A major current limitation is the generation of a suitable pilot display from the gathered radar data. Pure imagery from radars is unsuitable and a 3-D reconstruction of the terrain will be required to support synthetic vision.
4.4.1.3.4 System Maturity Millimetre wave radars developed for existing applications such as missile seekers are mature, in-service and potentially available as CMOTS. However, their ability to meet the brownout landing requirements in terms of detection and scan capability is likely to be limited and require further development. Electronic scanning using phased array antennae is currently immature for this application. The Human Machine Interface (HMI) for radar derived pilotage displays is immature hence the sensor/display system TRL is low. Safety case arguments for radar derived synthetic vision systems are immature.
4.4.1.3.5 System Integration Issues The radar sensor may require turret mounting/gimballing if the mechanical scan cannot cover the LZ adequately or accommodate aircraft attitude changes during landing, e.g., pitch. A wider field of regard may be required for “see-through” hazard detection around the aircraft during or after landing the aircraft. Alternatively, the sensor may be hard mounted on the airframe in a fixed orientation. The radar data will be complemented by precise aircraft position and height to enable a 3-D perspective, synthetic view of the outside world to generated and stabilised with aircraft motion. Sensor controls will need to be integrated into the cockpit together with suitable displays if not already fitted. The radar sensor should provide data which complements existing sensor capability, for example, some level of integration between radar image and Forward-Looking Infrared (FLIR) image could be anticipated.
4.4.1.3.6 Required Sub-Systems Precision navigation system (e.g., an embedded GPS / Inertial Measurement Unit) together with precise height above ground level, display systems, head down or head up depending on CONOPS and certification level. The radar processor could be integrated within the sensor housing or a separate Line Replaceable Unit.
4.4.1.3.7 Human Factors The key human factors issue is the generation of a suitable display from the radar and terrain database which is readily interpretable and provides adequate situational awareness to the aircrew to complete the brownout

TECHNOLOGY: SENSORS AND DATA PROCESSING
RTO-TR-HFM-162 4 - 9
landing safely. Features should be readily recognisable and classified, for example, terrain surface, wires, poles, hazards. The display could be used primarily by the NHP or presented directly to the HP. HOCAS control of the sensor should be provided. In addition, it provides crucial information for synthetic vision system.
4.4.2 Laser
4.4.2.1 LADAR Sensor System
4.4.2.1.1 Capability
A 3-D LADAR sensor system (sometimes also called LIDAR instead of LADAR) is capable of measuring the 3-D space in front of the helicopter in real time. This is done by time of flight measurements of single laser pulses which are typically scanned over the field of view of the sensor1 . Each laser pulse results in a single distance measurement associated with the two scanning angles at that time. The rate for a complete scan over the field of view for typical systems is between 2 and 3 Hz. Therefore a highly accurate measurement of the landing zone and the elevated objects on the ground can be updated with a rate of 3 complete measurements per second. Due to the scanning nature, the short laser pulses, the enhanced beam aperture size and the selected wave length (typically 1.5 µm) most 3-D LADAR sensors are eye safe2. Typical detection ranges on real targets (like ground surface, houses, trees, etc.) are above 1000 m, typical detection ranges on wires (5 mm diameter as a reference) are above 600 m.
4.4.2.1.2 Strengths
3-D LADAR sensor systems have their strengths in generating a precise 3-D data set of the landing zone and the objects elevated above ground. This can be achieved by emitting a very well-defined focussed measurement beam. Beam divergence of typical systems is in the order of 1 mrad. In contrast to radar systems beam divergence can be altered by adapting the optical lenses without having a disadvantage in size or weight.
Accuracy of each distance measurement is typically between 10 cm and 60 cm. The limiting design factors are counter frequency for the time of flight measurement and beam divergence. The latter results in a finite footprint of the measuring spot which causes a blur of distance measurements on an inclined surface or object. The effect of beam divergence decreases the useful accuracy for targets further away and becomes the driving factor for a slanted measurement which is the case for a landing approach. 3-D LADAR sensors are currently the only available sensors which are capable to reliably detect wires in flight or in the landing zone. Due to the wavelength of the emitted electromagnetic energy (typically 1.5 µm) the backscatter from most objects including wires is mostly diffuse. Although detection range is reduced with reduced angle of incidence existing LADAR systems can detect wires down to almost parallel angles of incidents. Therefore the main advantage of 3-D LADAR systems is to serve as obstacle warning systems in flight phase while being in addition an accurate landing zone measuring device during final approach. Typical LADAR systems can reconstruct the ground surface in such a way that elevated objects like rocks can be reliably detected down to a size of 30 cm to 50 cm. The reconstructed ground surface has a very high accuracy in terms of inclination and local slope (better than 1°).
1 There are some upcoming systems which do all measurements at once using a single area qui laser pulse (flash) but they still do
have issues with detection range and eye safety and are therefore left out in this evaluation. 2 If a not completely eye safe LADAR is selected additional effort during integration and testing and for all maintenance tasks has to
be taken into account.

TECHNOLOGY: SENSORS AND DATA PROCESSING
4 - 10 RTO-TR-HFM-162
Due to the scanning nature and the small beam divergence 3-D LADAR systems have a low probability of detection and a negligible probability of interception. A typical LADAR system may trigger a distant laser warner statistically approx. every 8 seconds on a direct hit. The distance could be up to several kilometres. Due to this statistical nature of scanning and short pulse hits there is no known technology being able to lock onto this signal for interception purposes. LADAR performance in rain as well as in snow fall is only slightly reduced, mainly by effects of atmospheric absorption.
4.4.2.1.3 Limitations
Being optical systems 3-D LADAR systems have a limited performance in fog, clouds, dust and snow. There are two effects which have to be overcome by an operationally useful LADAR system: first it has to overcome effects of self blinding; second it has to have the capability to detect targets within a cloud of obscurant. The first effect can be overcome by design (optical design and receiver management). The second effect typically needs the capability to trigger at least two but better multiple reflexes by one laser pulse. This allows for a limited look through capability through fog or dust. Typical values for the maximum detection range in an obscured medium are twice the optical visibility. That is to say at optical visibilities of 20 m a LADAR can detect objects up to approximately 40 m apart. Operational LADAR systems have to be hardened against effects of direct solar illumination. An operationally useful LADAR system needs to have algorithms to suppress solar images as well as solar reflections on snow or on water. Each LADAR system has several specific design parameters which result in a very complex interdependency on the desired effect. Therefore the parameters and the resulting requirements combination as a whole have to be considered for each specific application. For example, requiring a high detection range on a certain target without a specified detection probability is leading to the desired result. Therefore the optimal combination of system parameters for the specific task is essential.
4.4.2.1.4 System Maturity
There are LADAR systems on the market which serve as obstacle warning sensors for civilian and police forces. The next generation of LADAR systems with higher scan rates, increased field of view and field of regard is currently in the final stages of formal flight testing and will be available as series products by the end of 2010. These systems are foreseen for the European NH90 helicopters or as test systems for US SOCOM. They combine a LADAR sensor with complete data processing in one housing. Their intended use is currently obstacle warning and CFIT warning but the sensor as well as the implemented algorithms can also be used for situation awareness systems. Several prototype systems have been developed to a certain stage with the main focus on situation awareness in brownout.
4.4.2.1.5 System Integration Issues
Typical LADARs are comparatively large (bigger than 30 cm by 30 cm cross-section) and heavy (> 20 kg) sensors that have to be fitted in the nose of the helicopter or under the fuselage. LADARs need a free field of view in flight direction.
The typical power consumption is above 250 W if the data processing is included in the sensor. For the integration of LADAR systems it has to be taken into account that they require a certain stiffness of helicopter mounting points to avoid erroneous measurements. For the usage of a LADAR system a navigation system which is aligned to the LADAR is also needed. Command and control is typically performed via a control panel and/or via helicopter input pages. Output media for processed LADAR data are MFDs and/or helmet-mounted sights.

TECHNOLOGY: SENSORS AND DATA PROCESSING
RTO-TR-HFM-162 4 - 11
4.4.2.1.6 Required Sub-Systems
A LADAR system requires a medium or better high end navigation unit (e.g., EGI) with errors of the helicopter axes below 0.2° in each axis and velocity accuracies of 20 cm/s.
4.4.2.1.7 Human Factors
When used as a source for landing zone and obstacle visualization great care has to be taken on the generation of synthetic views. The LADARs as such give data points with a specific spacing that are rather crude and therefore are not suitable to be used for direct visualization of the complete scenery. Therefore the ground surface, i.e., the landing zone should be visualized as a rendered closed surface. Objects elevated above the ground should be classified to reduce the amount of data points shown. These classified obstacles can then, e.g., be visualized as conformal obstacle symbols. Objects elevated above the ground which do not fit to an existing obstacle class can then be visualized as data voxels in the synthetic view.
4.4.3 Passive Electro-Optical For improved situational awareness in very low light, continuous low visibility and transient very low visibility such as brownout, imaging technology is driven towards longer wavelengths which are less attenuated by atmospheric obscurants. Further considerations are affordability of sensor technology and the necessity of a larger aperture size to achieve a useful spatial resolution. The size of the sensor together with the mounting system (e.g., turret) will impact the ability to mount it on the airframe in a suitable location.
All current imaging sensor technologies offer reduced resolution in comparison to the naked eye and this limits the ability to detect and recognise cues necessary for pilotage. Magnification optics can improve the ability to resolve fine features but results in reduced field of view, necessitating a steerable sensor system. The following passive electro-optic sensor systems are investigated:
• Visible Waveband or Low Light Camera sensor; • Thermal Imaging sensor; and • Passive MMW Imaging sensor.
4.4.3.1 Visible Waveband or Low Light Level TV Cameras
4.4.3.1.1 Capability
Visible waveband sensors cannot see through significant brownout but have been applied to look underneath the helicopter during the final stages of landing and touchdown. The dust is less dense here, giving the ability to detect hazards at the touchdown point and drift. Imagery from the cameras can be interpreted by a rear crewman and critical information relayed by voice to the aircrew.
4.4.3.1.2 Strengths
The system negates the requirement for a crewman to manually look under the fuselage during landing and improves safety. Visible wave band cameras are cost effective, small, lightweight, low power and straightforward to install. The imagery requires no additional processing to provide a readily interpretable image and does not create additional workload for the handling and non-handling pilot. The cameras view the aircraft undercarriage together with ground immediately below and enable the perception of drift and hazards such as rocks and ditches.

TECHNOLOGY: SENSORS AND DATA PROCESSING
4 - 12 RTO-TR-HFM-162
4.4.3.1.3 Limitations
The cameras cannot see through significant brownout and rely on a “doughnut effect” of downwash whereby dust is blown away from the aircraft leaving the area immediately below the fuselage relatively clear. This effect will be platform dependent. The cameras have limited resolution and ambient dust may reduce contrast such that fine details and micro texture are not easily detected. The look ahead angle of the camera provides a limited ability to recce ahead of the aircraft during approach, and its main use is for last segment of descent with minimal ground speed.
4.4.3.1.4 System Maturity
The technologies used in this system are very mature and available as Commercial Military Off-The-Shelf (CMOTS) and are being integrated as part of brownout solution (Germany).
4.4.3.1.5 System Integration Issues
The key integration issues are mounting the camera to the airframe with suitable power supply, and mounting a suitable NVG compatible display in the cockpit for the NHP or the rear cabin for operation by the rear crewman. In the latter case the display could be portable via umbilical cable.
4.4.3.1.6 Required Sub-Systems
A cockpit display sub-system is desirable to host the imagery for the NHP and avoid the mounting of additional displays in the cockpit. Power is also required.
4.4.3.1.7 Human Factors
The main issues are to ensure the NHP or rear crewman can operate and interpret the display system in all ambient light levels and communicate critical information to the pilot effectively.
4.4.3.2 Passive MMW Imaging Sensor
4.4.3.2.1 Capability
Passive Millimetre Wave (PMMW) imaging is a form of thermal imaging but operating at longer wavelengths, giving the ability to see through atmospheric obscurants such as cloud, fog and dust without active emission. Current technology operates at 94 GHz and exploits naturally reflected and emissive radiation to provide a readily interpretable image for the pilot, day or night.
4.4.3.2.2 Strengths
A PMMW camera can be combined with a simple display to provide a see through capability with imagery which can be easily interpreted and understood. The main source of contrast in a PMMW image is the sky, which has a very low radiometric temperature. Objects in the scene reflect this “cold sky” illumination to different extents, depending on their material composition and orientation. For example, fields, hedgerows, trees and manmade features are visible due to their different reflectivities in the MMW part of the spectrum. Grass tends to diffusely reflect the cold sky radiation, appearing cooler than ambient temperatures. Trees and hedgerows appear radiometrically warmer. Manmade features, particularly metallic objects such as vehicles, poles and cables have high contrast due to “cold sky” reflections.
TECHNOLOGY: SENSORS AND DATA PROCESSING
RTO-TR-HFM-162 4 - 13
4.4.3.2.3 Limitations
The wavelength of radiation at 94 GHz is 3.2 mm and this is orders of magnitude longer than used by infra-red (10 μm) or visible camera (0.5 μm) systems. The consequence of this is that, for a given camera size, the resolution of a PMMW sensor will be much lower than the resolution of an infra-red or visible camera. Increasing the optical aperture will increase the range at which an object can be detected by sharpening the beam width of the sensor. The limiting factor on this approach is typically the difficulty of deploying a large sensor. An aperture of 50 cm, gives an angular resolution is 0.45 degrees. In other words, at a range of 1 km, the spatial resolution of a sensor with a 50 cm aperture is approximately 8 metres; alternatively, the spatial resolution is approx 30 cm at 40 m range. Objects smaller than the spatial resolution can be detected if they have sufficient radiometric contrast with the background, however, they will appear as a single point, unless they have significant linear extent, for example cables. The large optical aperture results in a camera which cannot be integrated into existing turret systems and would require a bespoke mounting to the airframe.
4.4.3.2.4 System Maturity
Mechanically scanned PMMW systems have been flight demonstrated in a research and development environment and attained TRL 6. Significant further development would be required to improve the thermal sensitivity, spatial resolution and camera packaging to provide an exploitable system. In the longer term, the ultimate performance would probably offered by a staring array system, as with thermal imagers, or electronic scanning. In each case there are trade-offs in terms of cost and associated complexity.
4.4.3.2.5 System Integration Issues
The physical size of existing PMMW sensor systems presents an integration challenge on the airframe. The sensor could be hard mounted, assuming the field of view is large enough to preserve an adequate view of the ground during changes in aircraft attitude. Alternatively, the sensor could be mounted in a steerable turret. In both cases, there could be issues with nose mounting and ground clearance. The sensor packaging could be improved but a trade-off with aperture size and spatial resolution will remain. Integration with a cockpit displays systems and turret controls will be required, together with navigation systems if geo-pointing is required. The sensor requires an image processor unit which may be a separate LRU or integrated within the sensor itself.
4.4.3.2.6 Required Sub-Systems
A turreted PMMW camera system requires a suitable display sub-system and potentially information from a navigation sub-system.
4.4.3.2.7 Human Factors
A turreted PMMW system would be operated by the non-handling pilot who would conduct the recce and advise the pilot accordingly. Current imagery enables the interpretation of macro scale features with low workload, however, the limited spatial resolution makes it difficult to see fine features and micro scale surface texture. Greater workload is required to extract the detail need for landing, which may only be interpretable at very short range, if at all. Further sensor development is required to improve the clarity and fidelity of the imagery. The sensor has a large dynamic range which exceeds the dynamic range of most display systems. The imagery can be manipulated by the non-handling pilot to present the most readily interpretable form. The imagery could be displayed in a location visible by the handling pilot, however, any slew angle or magnification may make correlation with the outside world view (direct or via NVG) difficult and distracting.

TECHNOLOGY: SENSORS AND DATA PROCESSING
4 - 14 RTO-TR-HFM-162
4.4.3.3 Thermal Imaging Sensor
4.4.3.3.1 Capability
Thermal imaging sensors operating in the 3 – 5 µm and 8 – 12 µm Infra-red wavebands have effectively no see through dust capability. Some see through capability has been claimed in the very far IR (~ 20 µm) but only at very short range. The primary benefit of such sensors in brownout landings is to survey the intended landing zone during approach, prior to brownout, to ensure it is free of hazards and suitable for landing. Thermal imaging video cameras are commonly integrated within a turret system which can provide stabilisation and geo-pointing, together with switched optics or zoom magnification. Multiple sensors may also be distributed to provide a wide field of regard, fixed magnification for pilotage (Distributed Aperture System (DAS)). Sensor spatial resolution is improving with “High Definition” capability becoming commercially available. Turret imagery can be displayed on a head-down display and interpreted and manipulated by the non-handling pilot. DAS imagery would be displayed to the aircrew using Helmet-Mounted Displays (HMD).
4.4.3.3.2 Strengths
A turreted, high resolution, Gen 3 cooled IR video camera with magnification promises an improved day/night capability (compared to unaided eye and NVG) to survey an LZ before brownout occurs and before committing to land. DAS systems provide common IR imagery to both HP and NHP using lower performance but less expensive un-cooled technology.
4.4.3.3.3 Limitations
A turreted IR camera system requires a suitable mounting point, ideally on the nose of the airframe and integration with a suitable display and controls. Basic symbology is required to reduce the potential for disorientation at high magnifications. High resolution, turreted systems are expensive to procure and integrate. The concept of allowing the handling pilot to land from a head-down display will have certification/release to service issues. LWIR and MWIR cameras provide a “see-and-remember” capability and cannot detect dynamic hazards on the LZ. DAS systems cannot currently match the resolution of NVGs for night vision and rely on a complex visually coupled system with an integrated HMD. Furthermore, Thermal imaging is also limited by atmospheric moisture and performance can be severely limited by rain, cloud and damp terrain with little thermal contrast.
4.4.3.3.4 System Maturity
Turreted systems with high resolution IR cameras are available as CMOTS at TRL9. DAS systems are still in development and not available as CMOTS.
4.4.3.3.5 System Integration Issues
A turreted IR camera system requires integration with the airframe and a suitable display in the cockpit. Turret controls (e.g., pan, tilt, magnification, gain and offset) are also required. The turret may require integration with onboard navigation systems for stabilisation and geo-pointing, and with display systems if additional symbology overlays are required. The display system should be matched in terms of resolution, contrast and area to optimise the presentation of high resolution imagery. DAS requires a powerful image processor together with an integrated HMD and head tracker. An array of sensors, usually three, is hard mounted on the nose of the aircraft.

TECHNOLOGY: SENSORS AND DATA PROCESSING
RTO-TR-HFM-162 4 - 15
4.4.3.3.6 Required Sub-Systems
A turreted IR camera system requires a suitable display sub-system and potentially information from a navigation sub-system.
4.4.3.3.7 Human Factors
A turreted IR camera system would be operated by the non-handling pilot who would conduct the recce and advise the pilot accordingly. The imagery could be displayed in a location visible by the handling pilot, however, any slew angle or magnification may make correlation with the outside world view (direct or via NVG) difficult and distracting. Boresighting the camera with a fixed field of view close to 1:1 scaling would enable the display to be used by the pilot more easily. DAS systems using HMD provide a more immersive environment in which additional flight symbology is essential to reduce the likelihood of spatial disorientation.
4.5 HUMAN MACHINE INTERFACE/DISPLAY SUB-SYSTEMS
4.5.1 Head-Mounted Display
4.5.1.1 Capability
Head-mounted displays enable information to be presented in front of the pilot’s eyes, reducing the need to look down at cockpit displays. HMDs can be modular, mounted to a conventional pilot’s helmet, or fully integrated into a bespoke helmet system. It should be noted that there are existing helmets in use (e.g., NH90, Tiger) that have an advanced flight symbology system in place as well as some of the perquisite sensor system and have the potential to accommodate symbology system that are specific for brownout landing.
Unlike a fixed Head-Up Display (HUD) which is mounted in the cockpit, a head-mounted display enables information to be seen over a wide field of regard, which is important for maintaining all round situation awareness in helicopter flight. The addition of a head tracker enables further functionality, for example, a head-steered weapon sight, gun, recce sight, or earth referenced symbolic displays (conformal symbology).
4.5.1.2 Strengths
The major benefit is the availability of flight information whilst maintaining visual contact with the outside world, especially during critical manoeuvres close to the ground such as landing. The requirement to divert attention to head-down instruments is reduced significantly and as a result SA is improved. Modular HMDs provide a simple, lightweight, monocular, daylight readable display mechanism usually attached to a conventional flight helmet using the NVG bracket and projecting across and down in front of the pilot’s eye. Night capability is provided by a different display module which is integrated with conventional NVG, producing the Display Night Vision Goggle (DNVG). This replaces the Day display module. The displays are monochrome with a field of view of approximately 25 degrees and enables flight instrument information to be presented head up using symbology similar to the fixed-wing HUD format. Integrated HMDs promise a wider field of view, colour and bi-occular or binocular capability using folded optics or visor projection optics integrated with a specialised helmet. For both types of HMD, different pages of symbology can be selected which are optimised to different tasks, for example, navigation, transit and low speed. Symbology is referenced to the head, i.e., it always appears in front of the pilot, wherever he/she looks. The addition of a head tracker which provides head-pointing angles and displacements allows symbology to be referenced to the aircraft and to the outside world. For example, aircraft referenced symbology could mimic a fixed HUD and
TECHNOLOGY: SENSORS AND DATA PROCESSING
4 - 16 RTO-TR-HFM-162
would only be visible when the pilot looked straight ahead. World referenced symbology allows symbols to be placed on the ground over a location of interest and would only be visible when the pilot looked in the direction of the feature. This opens up the possibility of increased SA of ground-based features, for example, friendly and enemy force locations, tactical exclusion zones and landing zones. A line of sight function also allows the HP and NHP to know in which direction the other is looking and aids crew communication.
4.5.1.3 Limitations
Modular HMDs provide separate day and night capabilities rather than a seamless day into night capability. The displays have to be manually changed over and performance may be sub-optimal during dawn/dusk transition periods. The narrow field of view and pixel resolution impact the quality and legibility of the symbology. Regular brightness adjustment is required to maintain contrast between the symbology and the outside world view. Current night display modules clip onto the objective lens of the NVG and symbology is projected through the image intensifier and viewed on the phosphor screen. This can be detrimental to the performance and longevity of the intensifier tube. The night display module adds about 60 g to the end of the NVG furthest from the head and requires additional counterbalance mass to maintain comfort and fit. Integrated HMDs can be expensive, heavy and require precise fitting to the head to maintain the exit pupil consistently and precisely. Night capability can be compromised compared to NVG due to inadequate display/sensor resolution and integration issues. For example, night vision capability has been provided on Integrated HMDs by using image intensifier tubes attached to the sides of the helmet with the imagery relayed optically or electronically to the display surface. However, the extended tube separation compared to inter-pupilliary distance causes hyperstereopsis which impairs judgement of height and distance. Head-up symbology can clutter the outside world view and obscure critical features, for example, wires or ditches. Poorly designed symbology can require excessive workload to interpret.
4.5.1.4 System Maturity
Modular HMDs are mature technology and currently in-service and deployed across many platforms operated by different Nations. One unique modular concept is still in development and uses holographic wave guide technology to provide a light weight day display with physical packaging that may enable NVG to be used in combination. This promises a single, colour display which provides a day into night capability, compatible with conventional aircrew helmets. Integrated HMDs continue to be developed. Some early versions are in-service but the capability is being transformed by the emerging availability of miniature, high resolution, flat panel displays and LED backlighting. Composite materials also enable weight reduction without compromising impact protection. Physical issues remain with the integration of image intensifiers although alternative night vision capability is becoming possible using imagery from aircraft-mounted sensors, for example, turreted or distributed aperture Infra Red or Low Light Level Cameras. In the past, display and sensor resolution were unable to match NVG but recent developments in High Definition sensors and displays promise significant improvements in image quality making it suitable for low altitude night flying and landing.
4.5.1.5 System Integration Issues
Head-mounted displays require integration with the helmet and sufficient mechanical adjustment to achieve alignment with the eye and exit pupil. A separate display processor is used to generate the symbology and must be integrated with aircraft systems to provide, for example, barometric height, radar height, heading, airspeed, ground speed, torque and sideslip. Low speed symbology will require drift information which may not be available from legacy aircraft avionics. In this case additional sensors, such as an Inertial Measurement Unit (IMU) will be needed. Symbology will be continually manipulated by the pilot, for example, symbology
TECHNOLOGY: SENSORS AND DATA PROCESSING
RTO-TR-HFM-162 4 - 17
pages, de-clutter and brightness, which requires Hands On Collective and Stick (HOCAS) control. Additional controls such as built in test may be console mounted. Head-mounted displays will be provided to both aircrew and require quick release connectors in the cabling to enable rapid egress in emergencies. The current most mature head-tracker technology uses alternating electromagnetic fields and requires a detailed survey and mapping of the cockpit environment. A Boresight Reticule Unit (BRU) is mounted in the cockpit (usually on the combing or window frame) and used by the pilot to align the head tracker. Low speed symbology such as the velocity vector, indicating aircraft drift, are only as good as the data the sensor provides. Doppler velocity has been found to be inherently latent and cannot provide sufficient update rate to enable a usable velocity vector for landing. Data from an IMU should be used for low speed symbology where possible. The usability of conformal symbology is highly dependent on a precise navigation solution (horizontal position and height) and optimal integration to reduce system latency.
4.5.1.6 Required Sub-Systems
HMDs require a display processor, HOCAS and console controls together with integration with aircraft sub-systems to provide the information to be displayed. These may include the navigation system, airdata computer, Radar Altimeter, engine management system and IMU. On helicopters with modern avionics much of this information will be available on a data bus.
4.5.1.7 Human Factors
Mechanical adjustment of the head-mounted display is essential to ensure correct alignment with the eye. The head-mounted display should not cause excessive head-borne mass and when integrated with the helmet should not impair the balance, comfort and fit. Symbology should be carefully designed to minimise workload associated with its interpretation. Due to the cognitive effort and instrument scan required by some symbology designs, an instrument flying control strategy can be induced which draws attention to the symbols at the expense of the outside world leading to reduced situational awareness. Conformal symbology attempts to put the symbols in the outside world and encourage the pilot to use natural and artificial cues together to preserve a visual flying control strategy.
4.5.2 Symbology Symbology for approach to landing, hover, and take-off can be presented on a panel-mounted or head-mounted display and provides additional information which may help to reduce spatial disorientation during zero speed landings. The symbology can be divided into 3 different formats:
• 2-Dimensional Low Speed Symbology: Graphical information provided in plan view with a central aircraft reference, a dynamic velocity vector giving explicit fore/aft and lateral drift velocity, acceleration ball and a dog house symbol indicating the intended landing point on the ground. The velocity vector/acceleration cue is of primary interest for LVL as it provides ground speed and drift information.
• 3-Dimensional Conformal Landing Symbology: Perspective graphical symbology provides conformal (earth referenced) cues for the landing position together with the ability to extract aircraft fore/aft, lateral and vertical closure rate from the differential motion between the cues. This cueing mechanism is analogous to the use of real-world features to judge relative position and motion of the helicopter. 3-D symbology is presented on a HMD and requires a head-tracking system to allow the symbology to be drawn in the correct location on the earth and hence de-coupled from the pilots viewing direction. An additional conformal symbol is the Flight Path Marker (or Vector) which provides a look ahead of the aircraft’s future position against the outside world view based on an

TECHNOLOGY: SENSORS AND DATA PROCESSING
4 - 18 RTO-TR-HFM-162
instantaneous extrapolation of aircraft state. Conformal symbology can provide an explicit landing point reference, on the ground, to aid navigation and approach path.
• Combination of 2-Dimensional and 3-Dimensional Symbology.
4.5.2.1 Two-Dimensional Symbology
4.5.2.1.1 Capability
Low speed symbology has been specifically developed to aid helicopter landing and consists of additional 2-D graphical elements which provide scaled indication of acceleration, drift, ground speed, rate of descent and rate of closure towards a pre-planned landing point. The symbols, which may include the velocity vector, acceleration cue, vertical speed indicator, “rising deck” height above ground and landing point are added to the conventional flight symbology and tailored to the dynamic handling qualities of the platform. For a visual approach a frequent switch between head-out and head-in must be avoided and multiple simulator trials have shown the most effective presentation from a flight safety perspective is through a head-mounted display to the handling pilot. Therefore a head-mounted display, for example using a Display Night Vision Goggle or Helmet-Mounted Day display module is the preferred solution. (Newer helicopters may be equipped with more sophisticated integrated helmet-mounted displays which only require the addition of the low speed symbology, e.g., TopOwl helmet or JedEye Helmet). The head-mounted display enables the symbology to be used continuously during the final approach whilst maintaining visual contact with the landing point on the ground and allows any available visual outside world cues to be used when the brownout envelopes the aircraft. Note that if the outside world becomes obscured this leads to an Instrument Flight Rules (IFR) landing which is not the preferred procedure with 2-D symbology.
4.5.2.1.2 Strengths
Low speed symbology can be implemented by enhancing existing flight symbology that is already in service on several helicopters in several Nations3 on both head-down and HMDs. The symbology has minimal additional processing demands and consists primarily of rescaled existing symbols with few additional, new symbols. Improved aircraft data sources may be required, for example, an IMU. A number of research programmes have investigated the adaptation of flight symbology to the low speed landing task and demonstrated the resulting capability in simulator and flight trials in DVE.
4.5.2.1.3 Limitations
The low speed horizontal acceleration cue symbol is used as a predictor for the horizontal velocity vector symbology. The acceleration cue symbol requires careful scaling to the platform flight dynamics and control system. In other words, how much the symbol moves on the screen per unit of horizontal acceleration must be tailored to each type airframe. Vibration noise on the acceleration signals must also be filter out, without over-filtering and causing excessive delay. Flight control damping or augmentation will improve pilot performance and decrease workload when using 2-D low speed symbology. However, when such symbology is implemented on legacy helicopters with conventional flight control systems, the 2-D velocity vector/ acceleration cue symbology requires additional training4, induces increased workload and limited task precision until the pilots are fully accustomed with it. Current low speed symbology may cause “cognitive
3 For example, the AH-64, MK-41. 4 Most Nations give their pilots 8 to 15 hours for the primary training then about 15 additional hours to fully acclimate.
TECHNOLOGY: SENSORS AND DATA PROCESSING
RTO-TR-HFM-162 4 - 19
capture” where attention is drawn away from the background because the instrument scan necessitates significant interpretation. There is also the possibility of “coning of attention” where the pilot becomes concentrated on one specific indicator to the detriment of other symbols and general SA. This may also lead to a modified control strategy similar to instrument flying.
4.5.2.1.4 System Maturity
The maturity of 2-D low speed symbology is high with one configuration already in service, for example, Pilot Night Vision System (PNVS) and DNVG on AH 64D. Low speed symbology optimised for legacy platforms is less mature and currently the subject of several research programmes.
4.5.2.1.5 System Integration Issues
The symbology requires a minimum update rate and accuracy to work well; implementations of the velocity vector using Doppler velocity have proven to be ineffective due to a long latency/update delay. Symbology driven from GPS/IMU is preferred where possible. Modern cockpit displays, such as MFDs, with primary flight symbology may be modified to accommodate low speed symbology. If the cockpit is based on analogue avionic an additional head-down, digital display will be required. Preferably, the symbology is presented head up through a HMD. The low speed symbology system uses different modes or “pages” which can be manipulated by the pilot to adapt the symbology to the level of visual degradation, for example, de-clutter. The method of switching between different modes should minimise any possible distractions and the need to remove the hands from the control levers. The velocity vector and acceleration cue symbology should be harmonised with the aircraft flight dynamics to provide a usable response without the risk of Pilot-Induced-Oscillation (PIO). The minimum requirement of using low speed symbology system in the helicopter is a flight control systems with a good rate damping. However, flight control systems with high levels of augmentation such as attitude command/attitude hold together with height, heading and position holds are additionally preferred.
4.5.2.1.6 Required Sub-Systems
Low speed symbology can be driven from conventional avionics (if digital data are available – often legacy aircraft provide only analogue data), for example, air data, gyros, barometric height, radar height, Doppler velocity can be presented on existing head-down or head-up displays. However, the usability of the symbology may be compromised by slow update rates and excessive latency as mentioned earlier. These limitations can be resolved by sourcing data, particularly for the velocity vector and acceleration cue, from a GPS/IMU, and precision navigation system.
4.5.2.1.7 Human Factors
The use of low speed symbology for landing requires introductory training to develop an effective instrument scan. This is because key elements such as horizontal position/velocity and vertical position/velocity are separate entities on the display and must be interpreted together with the view of the outside world. It may require a great deal of attention and workload to visualize and interpret the symbology, particularly if the helicopter has no additional stability augmentation. For example, controlling the horizontal position/velocity may leave insufficient resources to attend to the vertical position/velocity leading to loss of situation awareness and task precision. The potential for loss of SA can be lessened when the symbology is presented using a head-up display controlled with HOCAS. Low speed symbology often results in an instrument flying style of control strategy.

TECHNOLOGY: SENSORS AND DATA PROCESSING
4 - 20 RTO-TR-HFM-162
4.5.2.2 Conformal Landing Symbology
4.5.2.2.1 Capability
Conformal, or earth referenced symbology consists of three-Dimensional graphical symbols which provide perspective cues, anchored over the outside world view and presented on a head-tracked, head-mounted display. The concept attempts to mimic real-world cueing mechanism by providing stationary cues from which relative movements (differential motion parallax) and closure rates and relative height can be extracted by the pilot in the same manner as real-world cues.
4.5.2.2.2 Strengths
Conformal symbology allows the pilot to retain a conventional, visual flight, control strategy. Such a system provides an intuitive cueing mechanism. In one study in the UK the conformal symbology and has been demonstrated to reduce workload and increase task consistency as compared to low speed, 2-D symbology displays (comparing Ferranti-LVL to the AVS-7 symbol set). However in another study in the US, the opposite was recorded (comparing BOSS to the BAE-LVL). The concept may be more suitable for legacy platforms with conventional flight control systems. The symbology can be utilized continuously when brownout appears.
4.5.2.2.3 Limitations
The usefulness of the symbology is dependent on the accuracy and consistency of the registration against the real world. For example, symbols representing the ground versus real-world ground must be congruent if you have to land on a heightened LZ in order not to have multiple lines and misleading information. This demands a minimum performance and optimal integration of specific, additional avionics systems including GPS/INS, head-tracker and precision radar altimeter. For landing, the use of conformal symbology may change the conventional instrument scanning strategy as the symbology is displayed virtually, ahead of the aircraft. The concept of operation for conformal symbology is relatively immature. As the symbology will be relied upon during brownout it is likely to require certification as a primary flight display or shown to have a risk benefit ratio analysis based on As Low As Reasonably Practical (ALARP) with acceptable operational benefit. Controllability of the aircraft as compared to a modern (non-AVS-7) two dimensional low speed symbology set remains to be tested. In the case of the pure conformal symbology set, the pilot must see multiple frames of video to perceive horizontal or vertical velocity adding delay compared to 2-D symbols which present the information in each video frame. Horizontal acceleration information is difficult to perceive directly from viewing multiple frames of video of conformal symbology, whereas it is shown directly in each video frame on modern 2-D symbol sets (such as AH-64 and BOSS, and missing on AVS-7). The conformal symbology position information is therefore two derivatives behind the acceleration information directly viewed with 2-D symbology. However, the comparison is more complex. The brain interprets the rate of change of position information in the conformal set quickly and more naturally compared to 2-D symbology. In addition, aircraft attitude seen in each frame of the conformal symbology set is a rough predictor of horizontal acceleration. Controllability of symbology sets is a complex issue that must be further tested. Another issue with conformal symbology is that the layout of the conformal symbology must be done with care. If important symbols appear behind the instrument panel or other aircraft structure, the direction of view of the conformal symbols may drive the pilot to look inside the cockpit more often than with 2-D, non-conformal symbology. A further issue is what occurs with conformal symbology when the aircraft makes a hover-turn maneuver, for example to point the nose into the prevailing wind. Conformal symbols that were once in front on the aircraft may end up off to one side, or even behind the aircraft.

TECHNOLOGY: SENSORS AND DATA PROCESSING
RTO-TR-HFM-162 4 - 21
4.5.2.2.4 System Maturity
Based on recent research activities the technology readiness level of the conformal symbology system has been demonstrated in flight and simulation at about TRL 7. Additional risk reduction will be required to integrate the system with target platform avionics, for example, the head tracker requires mapping into each platform type.
4.5.2.2.5 System Integration Issues
Conformal symbology is more complex to generate and requires optimal integration between the display generator, head-tracker, display module, precision navigation system and dust penetrating radar altimeter to minimise system latency. Although the data may be available on existing aircraft data buses, the update rate may be insufficient and discrete, high speed serial data links (e.g., Arinc 429) may be required for effective data transport. The conformal symbology system latency is the delay between movement of the aircraft or pilot’s head and the corresponding movement of the symbology to maintain it on the ground correctly. Excessive latency can manifest as unwanted movement in the symbology, for example, symbols being dragged across the ground rendering them unusable. Conformal symbology system flight trials and previous research has determined a preliminary key system requirement for acceptable system latency. Excessive mis-registration of the symbology due to position or height errors will reduce confidence in the system and also render it unusable. A boresight reticule unit is required to enable alignment of the head tracker with the aircraft axis and navigation system reference frames. The effects of aircraft and head vibration must be managed to allow the symbology to be displayed clearly without jitter. Conformal symbology should be presented to both HP and NHP to enable effective crew communication.
4.5.2.2.6 Required Sub-Systems
A conformal symbology system makes use of a head-tracker, helmet-mounted display (e.g., DNVG or day display module or an integrated helmet system), display generator (with terrain database), precision, dust penetrating radar altimeter (e.g., millimetric wave) and precision navigation system such as GPS/INS. A bore sight reticule unit is required to align the display system. A precision height sensor is required for the latter stages of final approach. HOCAS is preferred in order for the pilot to alternate between the display modes, declutter and adjust the symbology brightness with minimal distraction.
4.5.2.2.7 Human Factors
Recent flight and simulator trials have proven the viability of the concept and indicated conformal symbology appears to be relatively easy to learn, could be intuitive to use, provides increased task performance and consistency with reduced workload compared to 2-D low speed symbology. The format of the conformal symbology is key to providing sufficient cueing throughout the approach and landing without cluttering the display. The ability to dim the symbology is also important to reduce the potential obscuration of real-world cues.
4.5.2.3 Synthetic Vision
4.5.2.3.1 Capability
Synthetic vision is the construction of a 3-D image of the landing zone using a combination of flight dynamics information (position, height above ground, aircraft attitude) and a terrain database. Such systems are being introduced on civil airliners to aid situational awareness in poor weather. Terrain databases are inherently

TECHNOLOGY: SENSORS AND DATA PROCESSING
4 - 22 RTO-TR-HFM-162
inaccurate and incomplete, hence, SV systems are not reliable for low altitude operations such as landing. To overcome this deficiency, research programmes have investigated the use of sensor information to update the database in real time and enable a more accurate 3-D image to be generated. Active ranging sensors such as millimetric wave radar or LADAR can provide a higher resolution terrain surface, features and hazards which when combined with the underlying terrain database may be used to generate a 3-D scene with sufficient fidelity and accuracy to be used for landing. If non-dust penetrating sensors are used the capability will be “see and remember” with no new data being added once brownout envelopes the helicopter. The 3-D scene will continue to reflect aircraft movement but will be based on historical data and not include, for example, dynamic hazards. If dust penetrating sensors are used the capability will be “see through” and the 3-D scene continually updated during brownout. Two concepts of operation have been proposed for SV assisted brownout landings; the 3-D scene is presented on a head-down display to the NHP who relays information to the HP; the 3-D scene is presented directly to the HP using a HMD.
Infra Red still cameras have also been used to generate SV (Photographic Landing Augmentation System for Helicopters (PhLASH)) whereby multiple auto-focus high resolution cameras are situated around the platform and the outputs processed to produce a 3-D perspective image of the scene which is updated using aircraft position. The scene is continually updated until brownout obscures the camera view, whereupon the last good scene is adjusted for aircraft movement and used by handling pilot to land the aircraft. The scene was presented on a head-down display.
4.5.2.3.2 Strengths
Synthetic vision provides a clear view of the landing zone during approach and landing in brownout and will improve situation awareness of the outside world. The imagery should be relatively intuitive and enable a visual flight control strategy to be maintained. The concept has application to improved Day Night All Environment capability assuming the sensors can gather all the information required and it can be processed and presented in a timely and readily interpretable form to enable safe flight.
The still IR camera technique promises the production of an image which provides sufficient pilotage cues to land the aircraft in brownout.
4.5.2.3.3 Limitations
Synthetic vision systems are formed from the integration of sensors, database and display generator and the capability of each technology will determine the overall effectiveness of the system. Millimetre wave radar (77 – 94 GHz) has a “see through” capability but limited resolution and is unlikely to detect fine features such as poles and wires. Furthermore, extracting some features such as ditches from general radar clutter from the ground may be problematic. LADAR has much greater resolution and mapping performance but cannot penetrate dust reliably, hence, provides a “see and remember” capability. Data from either sensor must be combined with the terrain database and processed to provide a 3-D scene which can be rendered by the display generator with minimal latency. Updates from the sensors should provide a smooth transition into the 3-D scene without unpredictable jumps which reduce pilot confidence. The render must provide a readily interpretable image with cues such as texture which support visual flying. Sensing, processing and presenting suitable imagery with sufficient update rate to support pilotage may be challenging with current technology. Certification of SV technology as an aid or as a primary flight system has not yet been investigated.
The still camera approach requires the scene to be observed from a number of directions (e.g., to circle the landing point) prior to the onset of the brownout, before attempting the landing. The technology is currently novel and in the development phase.

TECHNOLOGY: SENSORS AND DATA PROCESSING
RTO-TR-HFM-162 4 - 23
4.5.2.3.4 System Maturity
Simple SV systems based solely on a terrain database are mature technology as SA aids for civil aviation but are unable to support low altitude and landing tasks in austere environments. SV systems using active sensors are in the development stage with some sub-systems having been flight tested. Radar and LADAR technology has been adapted from existing applications, for example, missile seekers or obstacle warning systems in order to investigate the ground mapping/recce capability required by an SV system. An SV system capable of aiding brownout landing is considered to be at least 3 – 5 years away.
The still IR camera approach has been demonstrated in a flight trial, but there remain significant tactical issues with this concept. The concept has been assessed as being TRL 5 but is no longer being pursued by the US government.
4.5.2.3.5 System Integration Issues
The main integration issue is how to extract and manipulate active ranging sensor data into a form that is readily understood by a pilot in a high workload environment. System latency, for example, the delay between detecting a feature and its subsequent display to the pilot will be a key challenge. A greater latency may be acceptable for a NHP display than a HP display. The SV system will require a precision navigation solution including accurate height above ground; the data may be accessible on a standard data bus but in order to guarantee an acceptable update rate may require high speed serial data links. It is unlikely the 3-D scene will provide all the cues required by the pilot for the landing task and should be compatible with low speed or conformal symbology. The forward looking radar or LADAR sensors should be mounted on the nose of the airframe and may compete with other sensors such as turreted FLIR. Depending on the field of view the sensor may need to be gimballed to allow the entirety of the LZ to be surveyed and to accommodate changes in helicopter pitch attitude during landing. If the 3-D scene is presented to the HP on an HMD, the imagery will need to be stabilised and de-coupled from head movement, necessitating a head tracker. The SV system should also be compatible with existing head-borne equipment such as NVG unless the 3-D scene is of sufficient quality and integrity to meet all night vision requirements currently met by NVG.
A still IR camera system requires multiple cameras to be mounted around the airframe and connected to a central processor which generates the 3-D scene. The processor will be integrated with a cockpit display system, which provides a suitable display and controls to the handling pilot. The processor is also integrated with the aircraft navigation system and will require data with specific update rates, accuracy and resolution to ensure the 3-D scene moves smoothly with aircraft movement.
4.5.2.3.6 Required Sub-Systems
A SV system will require a powerful display generator for image rendering, precision navigation system including RadAlt and terrain database, together with display sub-systems including head-down or HMDs. SV control will require HOCAS. If the system is to be relied upon then dual or triple redundant systems may be required. A still IR camera system requires support from a precision navigation system (e.g., Embedded GPS/Inertial system (EGI)).
4.5.2.3.7 Human Factors
The key HF issue is the interpretability of the synthetic image presented to the aircrew. In simple terms, the synthetic image should replicate the characteristics of the naked eye or imaging sensor view of the outside world already familiar to aircrew, i.e., readily interpretable and intuitive. The dynamics of the display should
TECHNOLOGY: SENSORS AND DATA PROCESSING
4 - 24 RTO-TR-HFM-162
reflect aircraft motion smoothly and accurately but be insensitive to sensor noise or sporadic detections. The display may have to accommodate late detection of obstacles which are only resolved by the sensor at close range. The closure rate to the terrain and obstacles should appear realistic, believable and predictable. The render used to cover the terrain database should include texture cueing to provide attitude and closure rate cues with levels of detail increasing as range reduces, such that rate of descent and drift can be easily perceived and understood. The SV image should be compatible with existing night vision equipment.
During brownout the still IR camera techniques will present frozen imagery of the LZ corrected for aircraft movement and is unlikely to be perceived as real imagery. The image manipulation may reduce the spatial resolution and degrade the cues available for pilotage.
4.5.3 Tactile
4.5.3.1 Capability
Tactile displays make use of vibrating elements (‘tactors’) to relay information to the skin (a well-known example is the vibrating function of a mobile phone). The development of (military) tactile displays has aimed to reduce sensory and cognitive workload. In high-workload situations the pilot’s visual and auditory sensory channels are usually occupied by scanning cockpit instruments and communication, respectively. The skin provides an extra sensory channel, which works in parallel to the other channels. Research has been undertaken primarily by the Unites States Army Aeromedical Research Laboratory (USAARL) and TNO Netherlands to investigate the use of tactile displays as a countermeasure for spatial disorientation and to aid drift awareness during landings in DVE.
4.5.3.2 Strengths
The technology is “eyes and hands free” and requires negligible workload to interpret. Recent research has explored the use of tactile displays to aid approach to hover in DVE with encouraging results: flight trials have shown significantly less drift errors during the hover together with subjective improvements in perception of drift, situational awareness and mental stress. Approach to hover tasks in DVE were achieved quicker and with improved handling qualities ratings when using tactile cueing compared to using flight instruments. Actual landings (touch down) and zero speed landings were not completed.
4.5.3.3 Limitations
Tactile cueing provides no indication of the outside world or explicit indication of the landing point hence additional visual cues may still be necessary. Tactile cueing technology is limited primarily by system maturity, system integration and human factors issues. Tactors are typically implemented in a vest or additional layer of clothing the pilot wears which can add to their heat load in arid climates. This additional heat load outweighs the benefit of the tactors and some pilots prefer a cooler ensemble to additional SA.
4.5.3.4 System Maturity
Several systems have been developed primarily for research purposes. US AAFRL, Ft Rucker have developed a tactile vest, TSAS (Tactile Situation Awareness System) which has been simplified to form TSAS Lite, consisting of a single belt which provides simple drift cues to the pilot. The system has been evaluated in a UH-60 simulator and on a UH-60 flight trial. The ruggedized trials fit is not considered production ready. TNO Netherlands have independently developed a tactile torso display vest and a simplified version called

TECHNOLOGY: SENSORS AND DATA PROCESSING
RTO-TR-HFM-162 4 - 25
“Flytact” which uses a single belt and single vertical line of tactors up the back. The Flytact system currently remains in prototype form.
4.5.3.5 System Integration Issues
Further research is required to understand how tactors should be integrated into (existing) flight suits and/or the pilot’s seat, and how it should be consistently aligned to the aircraft axis. Potential discomfort induced by additional tactile clothing, for example heat stress, requires further investigation. Tactile cues rely on accurate drift and height information from suitable sensors which it is assumed the aircraft is already equipped with. Additional avionics, for example a dust penetrating RadAlt and Inertial Measurement Unit may be required.
4.5.3.6 Required Sub-Systems
The tactile display uses data from aircraft systems, for example, RadAlt, Doppler Velocity or Inertial velocity.
4.5.3.7 Human Factors
Further research is required to understand how well pilots perceive tactile cues under heat stress, helicopter vibrations (whole body vibration), severe workload or stress and over long periods of flight time (desensitisation). The optimal configuration (numbers, spacing, frequency, amplitude) of tactile cues for landings requires further development. The training burden is not well understood and the complementary use of tactile displays with existing aircraft visual and audio displays requires further investigation.
4.6 FLIGHT CONTROL
4.6.1 Automatic Flight Control Systems (AFCS) with Advanced Flight Control Laws
4.6.1.1 Capability
Most legacy helicopters are equipped with analogue AFCS with conventional flight control laws based on rate command or attitude command/hold, both of which rely on the pilot’s ability to perceive and use visual cues to stabilise and control the aircraft. AFCS with advanced control laws provide additional handling qualities, compared to visual landing aids, which improve the precision and ease of control of the aircraft by the pilot. This releases attentional resources which may enable more effective interpretation of visual displays and available visual cues, thereby increasing situational awareness. Improved aircraft handling results from improved flight control laws implemented in a digital architecture, for example, attitude command attitude hold, translational rate command, hold functions for heading, height, speed and hover together with the ability to “beep trim” height reductions slowly in the hover down to landing. Ultimately, advanced control laws coupled to a precision navigation system and suitable sensors, may provide a “hands free” automatic transition to hover and landing capability.
4.6.1.2 Strengths
Advanced control laws may reduce the likelihood of the aircraft entering into a brownout situation by providing increased control and ability to consistently achieve the approach gate parameters and execute an accurate zero speed landing, staying ahead of the dust cloud until touch-down. The potential for spatial disorientation may be reduced through greater platform stability; the aircraft should not drift significantly and attitude maintained more easily.

TECHNOLOGY: SENSORS AND DATA PROCESSING
4 - 26 RTO-TR-HFM-162
4.6.1.3 Limitations
Unless coupled to a navigation and display system, advanced control laws do not improve the guidance cueing so the pilot still needs to see where the aircraft is going, i.e., the LZ and LP. Once in brownout, a pilot could still succumb to spatial disorientation. Advanced control law functionality may support landings from a high hover using the height trim. However, a descending hover in sustained brownout will reduce situation awareness and increase erosion of airframe and engines. The functionality is also dependent on the accurate and reliable function of key sensors such as radar altitude and may not be certified for operations in sustained brownout. There is currently insufficient evidence to quantify the operational benefit of advanced control laws during brownout landings.
4.6.1.4 System Maturity
Advanced flight control laws are entering service in a digital implementation of the AFCS on the Chinook CH-47F and are therefore available for new buy platforms. Upgrading legacy platforms is more challenging due to complex system integration issues.
4.6.1.5 System Integration Issues
Advanced flight control laws form part of the primary flighty control system and are designed to safety critical software standards, are platform specific, and are deeply integrated into the rotorcraft AFCS. Full authority systems may require modification of the control actuators and will be integrated with the cockpit display system to enable monitoring and control of the AFCS functionality. Further integration with a precision navigation system provides coupled capability, for example, to automatically fly to pre-planned waypoints. Upgrading legacy aircraft with advanced flight control laws is therefore a significant integration task; a new buy of platforms may be a more cost effective and timely method of achieving this capability, for example, Chinook Ch-47F Digital AFCS (DAFCS).
4.6.1.6 Required Sub-Systems
Advanced control laws will be integrated with the AFCS processor, mechanical flight control systems, precision navigation system including height, cockpit display systems and HOCAS.
4.6.1.7 Human Factors
Advanced flight control laws provide additional stability to the platform and reduce the reliance on visual cues by the pilot to maintain stability and control of the helicopter. Workload should therefore be reduced. Advanced flight control laws provide different modes of operations and an additional training burden will be required to ensure the pilot is familiar with the functionality of the system. HOCAS should be used to manipulate the system together with visual displays to confirm mode entry. The functionality does not increase situational awareness directly but may reduce the workload associated with aircraft control sufficiently to allow greater attention on the interpretation of the displays and visual cues available. A method of identifying the LZ and LP.
4.6.2 Haptic Cueing with Active Sidesticks for Helicopter Operation Today’s state-of-the-art pilot assistance systems in helicopters are a combination of advanced visual information provided through head-down and helmet-mounted displays with intelligent flight control augmentation up to autopilot functions, and limited oral warnings. The advanced active flight controls, made

TECHNOLOGY: SENSORS AND DATA PROCESSING
RTO-TR-HFM-162 4 - 27
possible by full authority fly-by-wire technology, allow tuning the helicopter handling characteristics according to the pilot’s needs and abilities in the specific operational situation. Complex display symbology enhances situational awareness and guides the pilot when outside references are insufficient.
This classical approach can be extended to the haptic information channel by the use of active inceptors. While the visual channel is loaded with information to the maximum, and experience has shown that oral warnings are the first information to be ignored by the pilot in high stress situation, it has been observed that information provided through the haptic channel is easily detected by the pilot, even in high stress situations. In addition a great advantage is that the pilot can keep his head up to look out of the cockpit. The force-displacement characteristics of active inceptors can be dynamically varied, allowing the optimization of the flight control mechanical characteristics depending on the underlying response-type (Rate Command, Attitude Command, etc.) and flight regime (hover/low speed against forward flight). It is known from first flight tests that the adaptation is highly recommended to get optimal results with respect to pilot workload and handling qualities. Another possibility of active inceptors is to indicate aircraft system limits to the pilot. These can either be soft boundaries, where the pilot feels a limit on the stick but has the possibility to overrun the cue (soft-stops), hard stops that equal a hard limit of the control input, or a more general warning function such as a stick shaker.
Every critical limit that will be reached when increasing a control input can be indicated. Possible applications are a torque limit indicator (1st limit indicated through soft-stop on collective inceptor) or mast moment protection (soft-/hard-stop on cyclic stick). Monitoring the mast moment is especially important when performing slope landings. Increasing the safety of flight can be achieved by flight condition indications, such as a descent rate indicator (soft-stop on collective inceptor), a horizontal drift indicator (force on the cyclic stick) or a flight path guidance function (guidance by motion of the sticks). It is also possible to indicate the violation of a safety distance around an obstacle. Reduced structural weight and improved component life can be achieved by indicating through a soft-stop that peak loads are reached, especially interesting during maneuvering flight.
The active inceptors can either be an active classical long pole collective and center-stick, or two active short pole side-sticks for both the collective and cyclic control, mounted on the right and left side of the pilot’s seat. One advantage of sidesticks is a much more ergonomic seating position leading to reduced fatigue. And since there is no control stick in front of the pilot, the probability of abdomen and thorax injuries in case of a ground impact (CFIT, etc.) is significantly reduced.
The U.S. Army and the DLR both operate experimental helicopters equipped with active inceptors. The U.S. Army AMRDEC RASCAL helicopter features an active collective and active center-stick, the DLR EC 135 FHS has two active sidesticks. Both organizations commonly work on the active inceptor technology within an U.S.-German MoU on Helicopter Aeromechanics. In the USA, the UH-60M upgrade will be equipped with active long pole collective and center-stick, for the CH-53K it is still in discussion which combination to implement. Most probably it will get an active long pole collective and an active short pole side-stick for cyclic control. First flight tests with the DLR FHS indicate that yaw control can also be performed by lateral movement of the left hand sidestick, making it possible to eliminate the pedals. The left hand sidestick would than combine collective and yaw control.
4.6.2.1 Capability Haptic cueing exploits the human sense of touch by applying forces, vibrations and/or movements to, for example, controls held by the pilot’s hands. An example is the control shake experienced directly from the control surfaces during the stall in non-servoed, fixed-wing flight control systems. In larger, served controls

TECHNOLOGY: SENSORS AND DATA PROCESSING
4 - 28 RTO-TR-HFM-162
systems, this important haptic cue cannot be felt directly so is simulated using a mechanical stick shaker using sensor data such as angle of attack and airspeed. Haptic technology has been applied to sidestick controllers used with digital fly-by-wire flight control systems, for example, in the Airbus A380. The technology is mature in commercial applications such as mobile phone vibrators and virtual reality games to complement visual displays. In the context of helicopters, research has investigated the use of haptic technology with advanced flight control systems to improve perception of, for example, torque limits (e.g., collective “soft stops” and “force feedback” used with care free handling systems) and flight path guidance. The cues can be generated electromechanically, for example, vibratory motors with an offset mass or piezoelectric actuators.
4.6.2.2 Strengths The technology is very similar to tactile technology covered in Chapter 4 and is “eyes free” with negligible workload needed to interpret the cues.
4.6.2.3 Limitations The technology requires integration with the control levers together with relevant sensors and processing to provide information to be displayed. Early actuator technology had a limited range of sensations but emerging techniques, such as piezoelectric, offer a wider range of effects and more rapid response times. The technology may be best suited to aircraft state information such as speed, height and drift, and may not be able to represent more sophisticated information such as obstacle proximity or recognition.
4.6.2.4 System Maturity Haptic technology is mature for existing applications but as an aid to brownout landings, the system maturity is considered low. The actuator technology maturity is high but the strategy to present height and drift cues for helicopter landings is immature and the overall effectiveness for the task not understood.
4.6.2.5 System Integration Issues The actuator technology must be integrated with the control sticks and driven from a central processor unit which is integrated with the navigation system.
4.6.2.6 Required Sub-Systems Navigation system.
4.6.2.7 Human Factors The cueing strategy, i.e., nature of the cue in terms of frequency, amplitude or movement and how this represents flight information such as drift magnitude, direction and rate of change must be designed to be readily interpretable. Although more modern actuator technology can provide a greater range of cues, more complex cues will require greater interpretation, training and workload to use effectively. The technology is ideally suited to HOCAS systems.
4.6.3 Dimensional Audio
4.6.3.1 Capability Sound can be manipulated so that when played through stereo headphones it can be made to appear to emit from a controllable direction. The ability to spatially locate sound cues around the pilots head in both azimuth

TECHNOLOGY: SENSORS AND DATA PROCESSING
RTO-TR-HFM-162 4 - 29
and elevation can be used to improve speech intelligibility and enhance situation awareness, for example, spatial separation of radio communications channels. The addition of a head-tracking system enables audio cues to be placed in the world independent of head and aircraft movement. With the suitable additional sensors, audio cues can be used to provide the bearing to the real-world features such as obstacles or friendly/ enemy force locations.
4.6.3.2 Strengths
Audio cueing may lessen the load on the visual channel and provide an intuitive mechanism to relay spatial information, for example, direction of drift or proximity of obstacles around the aircraft. 3-D audio can complement visual displays by providing an initial cue to the direction in which to look, which has been shown to reduce target acquisition time in weapon aiming studies. Range information can be portrayed by changing the frequency or pulse repetition rate of the audio cue.
4.6.3.3 Limitations
3-dimensional audio provides a display system only and additional sub-systems are required to provide relevant information to be displayed. The audio cues do not provide recognition of features. Multiple, simultaneous cues may lead to confusion. Certification issues yet to be determined.
4.6.3.4 System Maturity
3-D audio systems have been developed and demonstrated in various research programmes but is not established as a mature avionics technology. The application to brownout landings, for example, height and drift indication, is immature.
4.6.3.5 System Integration Issues
The audio system requires integration with head-tracking, navigation and obstacle detection systems. The audio cues must be compatible and integrated with existing cockpit audio warnings.
4.6.3.6 Required Sub-Systems
Head-tracking, navigation (aircraft ground speed, height and drift), obstacle detection systems.
4.3.6.7 Human Factors
The cueing strategy must be optimised to ensure minimal workload associated with the interpretation of cues. Audio cues may be missed during periods of high workload/stress in the cockpit. The accuracy and resolution of the cue spatial separation depends on producing a Head-Related Transfer Function (HRTF) by measurement of individual pilots. The effectiveness of generic HRTF is subject to ongoing research. There is likely to be a maximum number of audio cues which can be interpreted simultaneously.
4.6.4 Head-Up Displays
4.6.4.1 Capability
Head-up displays were originally developed as gun sights for fixed-wing aircraft and provide an electro-optical display, boresighted to the aircraft with weapon aiming and basic flight information symbols super

TECHNOLOGY: SENSORS AND DATA PROCESSING
4 - 30 RTO-TR-HFM-162
imposed on the view of the world. The symbology is generated cursively by a CRT display and relayed onto a combining glass in front of the pilot. Raster imagery from a Forward-Looking Infrared (FLIR) sensor can also be overlaid. HUDs are rarely used in helicopters but are becoming more prevalent on commercial airliners and business jets.
4.6.4.2 Strengths
The HUD alleviates the need for the pilot to look down and accommodate to about half a metre to read panel-mounted instruments and then re-accommodate when returning to the distant external world. The HUD can provide information conformal with the external outside world view, e.g., horizon line. Symbology optimised for landing, for example, drift and height, could be displayed on a HUD.
4.6.4.3 Limitations
HUDs are boresighted to the aircraft and provide a narrow field of view of between 20° and 30° which, during fixed-wing flight, is mostly aligned to the direction of flight. The HUD has a very limited headbox which constrains how far away from the design eye point the full field of view is visible, i.e., the pilot’s head movement must be limited when using the HUD. Helicopter pilots require good SA to operate at low altitude which demands a wide range of head movement. This is exaggerated by the low speed manoeuvrability of helicopters, including forward, backward and sideways flight together with large pitch angles during landing. This necessitates a display with a wide field of view and/or field of regard to maintain adequate situation awareness. The usefulness of a conventional HUD is therefore limited – velocity vector forms of symbology would not be aligned to the direction of travel, causing increased interpretative workload. The view through the HUD may not be in the direction of travel during critical manoeuvres close to the ground. The HUD requires a significant space to be integrated into the cockpit. For these reasons, HUDs are not commonly integrated into helicopters. The latest generation of jet fighter, i.e., the Joint Strike Fighter, has moved away from HUDs in favour of a helmet-mounted primary-flight display, which provides a greater field of view and field of regard and frees up cockpit real estate for a much larger and more capable head-down display.
4.6.4.4 System Maturity
HUD technology has been continually developed since the 1950s and is mature. Lightweight, compact HUDs have been developed for civil, commercial airline applications.
4.6.4.5 System Integration Issues
HUDs must be accurately aligned with the aircraft datum and rely on sub-systems to provide data to be displayed. The brightness of the symbology must be adjustable to cater for very bright day light environments and night time operations. The HUD symbology must also be NVG compatible to allow the external view and /or thermal imagery to be viewed through NVG. Alignment of conformal symbology must take account of the refraction of the optical combiner. Conformal symbology must be updated at sufficient rate to avoid mis-registration during aircraft manoeuvring.
4.6.4.6 Required Sub-Systems
Navigation system, FLIR, weapon systems.

TECHNOLOGY: SENSORS AND DATA PROCESSING
RTO-TR-HFM-162 4 - 31
4.6.4.7 Human Factors
The boresighted display, small field of view and small headbox provide only limited use, for example, for helicopter transit flight profiles (yaw/sideslip permitting). Mis-registration of conformal symbology will increase interpretive workload and reduce pilot’s confidence.
4.6.5 Helmet-Mounted Sight and Display (HMSD)
4.6.5.1 Capability
The HMSD was originally developed to aid weapon aiming for short range missiles. A head-tracking system combined with a simple, monocular, reticule sight were integrated with the weapon control system. The pilot could designate an external target by moving his head to superimpose the reticule over the target, enabling off-boresight weapon aiming. This significantly improved the weapon release time compared to the conventional technique of extreme aircraft manoeuvring to bring the target into the small field of view of the HUD. Night capable HMSD have been developed in which a simple display module is integrated with an NVG.
4.6.5.2 Strengths
The HMSD is a relatively simple display system which affords a significant improvement in weapon aiming capability.
4.6.5.3 Limitations
The display capability has been developed specifically for the weapon aiming requirement, often using fixed LEDs as pointing arrows, which offer no flexibility for other requirements such as landing. More capable raster displays (e.g., CRT or LCD) have been developed which are discussed under the Day Display and Display NVG technologies. HMSD has very narrow field of view, usually < 20°.
4.6.5.4 System Maturity
The system is mature and off-the-shelf but rapidly being superseded with more capable helmet-mounted display systems which incorporate weapon aiming symbology with flight instrument information. As a brownout landing aid the HMSD has little application although the underpinning technology principle of presenting information using a more capable display mounted on the helmet does, i.e., Display Modules and DNVG technologies are covered in other sections of Chapter 4.
4.6.5.5 System Integration Issues
The display is integrated with existing flight helmets and NVG. Day capable HMSD may use a miniature optics and visor coatings to project the sight information onto the visor. A head-tracking sub-system is required. Night capable systems require the display module to be integrated with NVG.
4.6.5.6 Required Sub-Systems
Head-tracking system, weapon control system, navigation system.

TECHNOLOGY: SENSORS AND DATA PROCESSING
4 - 32 RTO-TR-HFM-162
4.6.5.7 Human Factors
The HMSD provides a simple, intuitive display, tailored to a specific requirement. Additional audio cues (via the weapon control system) are used to notify the pilot of weapon lock. The miniature display adds negligible weight to existing helmets.
4.6.6 Summary on Capabilities and Limitations Sensor and display technology capabilities and limitations are summarized in Tables 4-3 and 4-4. The generic technologies have been chosen to be representative of known programmes that exist or are being applied and developed as potential brownout solutions. The system maturity levels illustrated in these five tables have been assessed by combining two key criteria:
1) If the technology is likely to deliver a system solution within the short term (18 months); and
2) If the technology significantly contributes to a complete solution, i.e., aircraft state awareness or LZ awareness or both.
Table 4-2: System Maturity Level Key.
Category Technology Level Label
Achievable in the Short Term (within 18 months)
Significant contribution to an overall system solution
GREEN
Achievable in the Short Term (within 18 months)
Partial contribution to overall system solution
YELLOW
Medium to Long term solution (18 months to 5 years)
Promises significant contribution to an overall system solution
RED

TECHNOLOGY: SENSORS AND DATA PROCESSING
RTO-TR-HFM-162 4 - 33
Table 4-3: Sensor Technologies, Limitations, and System Maturity Levels.
Category Technology Types Capability Technical Principle Strengths Limitations System Maturity
Level Systems
Integration Issues
Required Sub-System Human Factors Examples
SENSOR
RADAR
Active MMW Radar Altimeter sensor
Dust penetrating, precise height above ground level
Active 35 – 94 GHz
Dust penetration with centimetre accuracy
Limited range (the current range is up to 125 M), useful below helicopter
YELLOW
Above operational range would require conventional Rad Alt information
Source for display system
Inability to apply high resolution information to practical use
Part of German brownout solution
MMW Electronic Bumper sensor
Moving obstacle detection and collision avoidance
Active 94 GHz see through dust
See through dust, 360°, low cost, light weight,
Low resolution, limited to motion only
RED
Latency in system integration, resolution requires further data analysis
GPS/INS, height above ground
Human machine interface for intuitive interpretation at acceptable workload, method in displaying the information
DEU, USA R&D projects
Scanning Active Millimeter Wave (MMW) Radar sensor and display system
3-D image containing obstacles and terrain profile/surface
Scanning active 94 GHz
See through dust, can be small/compact, light-weight (few kilos)
Discrimination between manmade structure and moving obstacles
YELLOW
Latency in system integration, discrimination, further data analysis is required
GPS/INS, height above ground, terrain database
Method of presentation, completeness of information, interpretability
USA, CAN, DEU R&D projects
LASER
Laser Altimeter sensor
Precise height above ground level
Active, Eye Safe 1.5 micron
Low cost, light weight, high accuracy
No dust penetrating capability, needs attitude correction
YELLOW It requires other altimeters to provide useful information
Attitude and altimeters
Method of presentation, completeness of information, interpretability
3-D LADAR sensor
3-D image containing obstacles and terrain profile/surface
Scanning active, combination of Radar and Laser, Eye Safe 1.5 micron
High resolution, detailed 3-D image of LZ
Laser has no dust penetration RED
Latency in system integration, discrimination, further data analysis is required
GPS/INS, height above ground, terrain database
Method of presentation, completeness of information, interpretability
USA, CAN, DEU R&D projects
PASSIVE ELECTRO-OPTICAL
Visible Waveband or Low Light Level TV Camera sensor
2-D image containing obstacles and terrain profile/surface
Passive Visible Waveband
Detailed intuitive image of LZ
No dust penetration, limited depth/height information
YELLOW
Specific mounting on aircraft platform is required, resolution, completeness of information
Source for display system
Human interpretation is required
Part of German brownout solution

TECHNOLOGY: SENSORS AND DATA PROCESSING
4 - 34 RTO-TR-HFM-162
Category Technology Types Capability Technical Principle Strengths Limitations System Maturity
Level Systems
Integration Issues
Required Sub-System Human Factors Examples
Passive MMW Imaging sensor
2-D image containing obstacles and terrain profile/ surface
Passive 94 GHz see through dust
Dust penetration, intuitive image
Low resolution, large aperture at 94 GHz (50 cm), needs additional development to reduce size
RED
Difficult to implement onto operational airframe, low resolution, completeness of information
Require turret mounting with manual control
Quality/resolution of image/ completeness of information needs to be considered
GBR R&D project
Thermal Imaging sensor
2-D image containing obstacles and terrain profile/surface
Passive MW or LW Infra Red
Detailed intuitive image of LZ in low ambient light level, Gen 3 High resolution
No dust penetration, requires turret and magnification/ zoom
GREEN Mounting on aircraft platform, update rate, resolution
Source for display system, require GPS/INS
Manual control of sensor and pointing, require training to facilitate interpretation of information
USA R&D project
Table 4-4: HMI / Display Hardware Technologies, Limitations, and System Maturity Levels.
Category Technology Types Capability Technical Principle Strengths Limitations System Maturity
Level Systems
Integration Issues
Required Sub-System Human Factors Examples
HMI / Display Hardware
HMSD Monocular, Non-Head Tracked
Night display through NVD / Day display / visor; LCD/OLED or other helmet display
Flight Symbology and video projected to head-up / head-out Pilot
Symbology / image projected on monocular display (day and night)
Wide spread, simple installation, mature (legacy product) battle proven, improves flight safety
Lack of conformal display capability (video and symbology)
GREEN Integrated to legacy helicopter sensors, analog/digital
Helicopter sensors (e.g., attitude, GPS) according to customer requirements
Reduces workload compared to no HMSD
FRA, USA, ISR
HMSD Monocular,
Head Tracked
Electro-magnetic / Inertial / electro-optic / hybrid
Conformal (real-world projected) Symbology such as LOS, LZ, EW C4I, Sensor video projected on PF HMD according to LOS, mark new
System measures and calculates pilots head direction compared to helicopter, conformal symbology, video is displayed to match LZ by look and mark
Improves crew-coordination, reduces workload compared to non-tracked systems, improves mission efficiency and SA, option for “real world”
Video display – limited SA (monocular) Option for Add-on to existing HMSD
GREEN
LOS integration in cockpit and on helmet. There are head-tracked systems with no integration needed (all on helmet)
With basic capabilities same as non-tracked HMSD
More intuitive display, reduced training required
FRA, USA, GBR
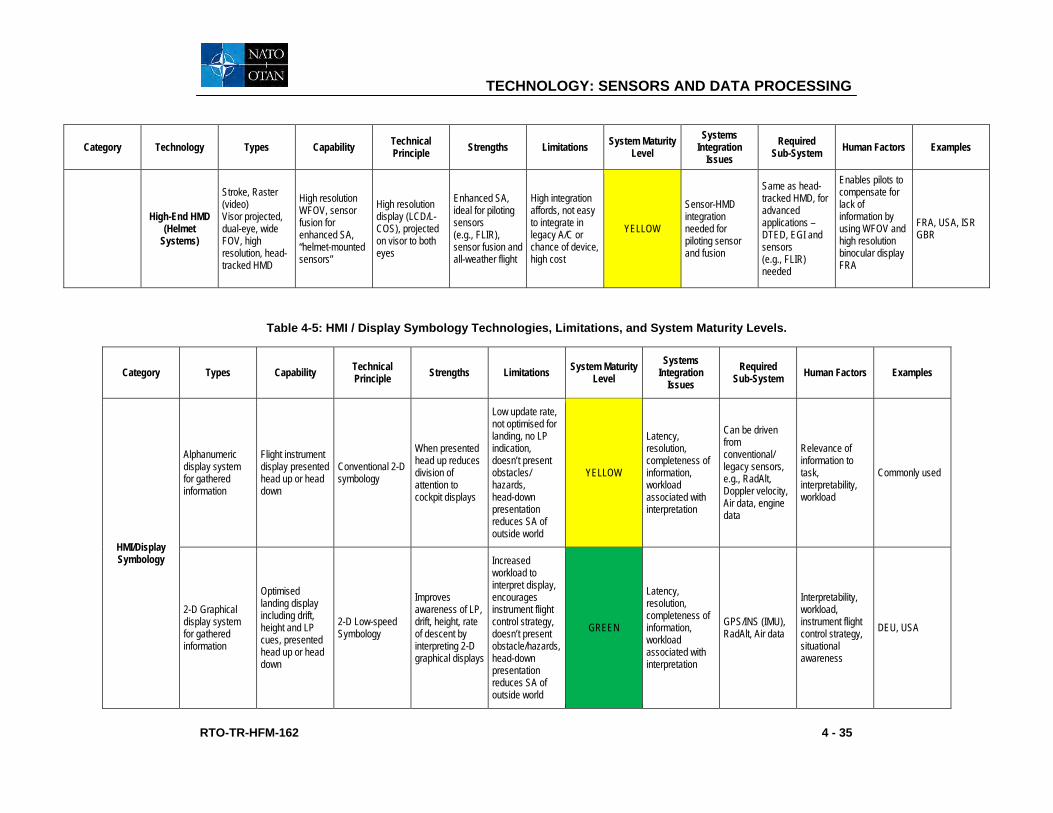
TECHNOLOGY: SENSORS AND DATA PROCESSING
RTO-TR-HFM-162 4 - 35
Category Technology Types Capability Technical Principle Strengths Limitations System Maturity
Level Systems
Integration Issues
Required Sub-System Human Factors Examples
High-End HMD (Helmet
Systems)
Stroke, Raster (video) Visor projected, dual-eye, wide FOV, high resolution, head-tracked HMD
High resolution WFOV, sensor fusion for enhanced SA, “helmet-mounted sensors”
High resolution display (LCD/L-COS), projected on visor to both eyes
Enhanced SA, ideal for piloting sensors (e.g., FLIR), sensor fusion and all-weather flight
High integration affords, not easy to integrate in legacy A/C or chance of device, high cost
YELLOW
Sensor-HMD integration needed for piloting sensor and fusion
Same as head-tracked HMD, for advanced applications – DTED, EGI and sensors (e.g., FLIR) needed
Enables pilots to compensate for lack of information by using WFOV and high resolution binocular display FRA
FRA, USA, ISR GBR
Table 4-5: HMI / Display Symbology Technologies, Limitations, and System Maturity Levels.
Category Types Capability Technical Principle Strengths Limitations System Maturity
Level Systems
Integration Issues
Required Sub-System Human Factors Examples
HMI/Display Symbology
Alphanumeric display system for gathered information
Flight instrument display presented head up or head down
Conventional 2-D symbology
When presented head up reduces division of attention to cockpit displays
Low update rate, not optimised for landing, no LP indication, doesn’t present obstacles/ hazards, head-down presentation reduces SA of outside world
YELLOW
Latency, resolution, completeness of information, workload associated with interpretation
Can be driven from conventional/ legacy sensors, e.g., RadAlt, Doppler velocity, Air data, engine data
Relevance of information to task, interpretability, workload
Commonly used
2-D Graphical display system for gathered information
Optimised landing display including drift, height and LP cues, presented head up or head down
2-D Low-speed Symbology
Improves awareness of LP, drift, height, rate of descent by interpreting 2-D graphical displays
Increased workload to interpret display, encourages instrument flight control strategy, doesn’t present obstacle/hazards, head-down presentation reduces SA of outside world
GREEN
Latency, resolution, completeness of information, workload associated with interpretation
GPS/INS (IMU), RadAlt, Air data
Interpretability, workload, instrument flight control strategy, situational awareness
DEU, USA

TECHNOLOGY: SENSORS AND DATA PROCESSING
4 - 36 RTO-TR-HFM-162
Category Types Capability Technical Principle Strengths Limitations System Maturity
Level Systems
Integration Issues
Required Sub-System Human Factors Examples
3-D perspective graphical display system for gathered information
Optimised landing display including drift, height and LP perspective cues
3-D Conformal landing symbology
Improves awareness of LZ and LP, drift, height, rate of descent by interpreting intuitive 3-D graphical displays, visual flight control strategy
Requires HMD, head-tracker and precise navigation solution, doesn’t present obstacles/ hazards
GREEN
Latency, requires optimal integration of head-tracker display, display generator and navigation system
GPS/INS, terrain database, precise altitude, head tracker, HMD
Configuration of conformal cues, latency, registration, usability, workload
GBR
Computer generated imagery display system for gathered information from passive and active sensors
Synthesised, perspective image of outside world containing obstacles and terrain profile/surface
Architecture to process sensor and terrain database information and generate a synthetic view of world
Continuous image presented before and after brownout, multi-spectral capability
Processing with adequate update rate, presentation to pilots, dependent on sensor performance, certification
YELLOW
Latency, resolution, completeness of information, registration, navigation accuracy, human machine interface for intuitive interpretation at acceptable workload
GPS/INS, height above ground, terrain database, image processing/ feature extraction/fusion algorithms
Method of presentation, completeness of information, interpretability
USA, CAN
Table 4-6: HMI / Display Technologies, Limitations, and System Maturity Levels.
Category Technology Types Capability Technical Principle Strengths Limitations System Maturity
Level Systems
Integration Issues
Required Sub-System Human Factors Examples
HMI/DISPLAY TACTILE Display system for gathered information
Drift and height / ROD display
Tactile stimulus to pilot for cueing
Highly alerting, intuitive cue, non-visual, minimal increase in workload
Adds a garment layer, optimal information and cue presentation to be established, certification
RED
Mounting on human, rapid disconnect for egress, integration with sensors, cue strategy
GPS/INS or Doppler velocity, RadAlt
Drive algorithm, tactile symbology (directional command vs. avoidance), desensitisation, integration with clothing
USA, NLD
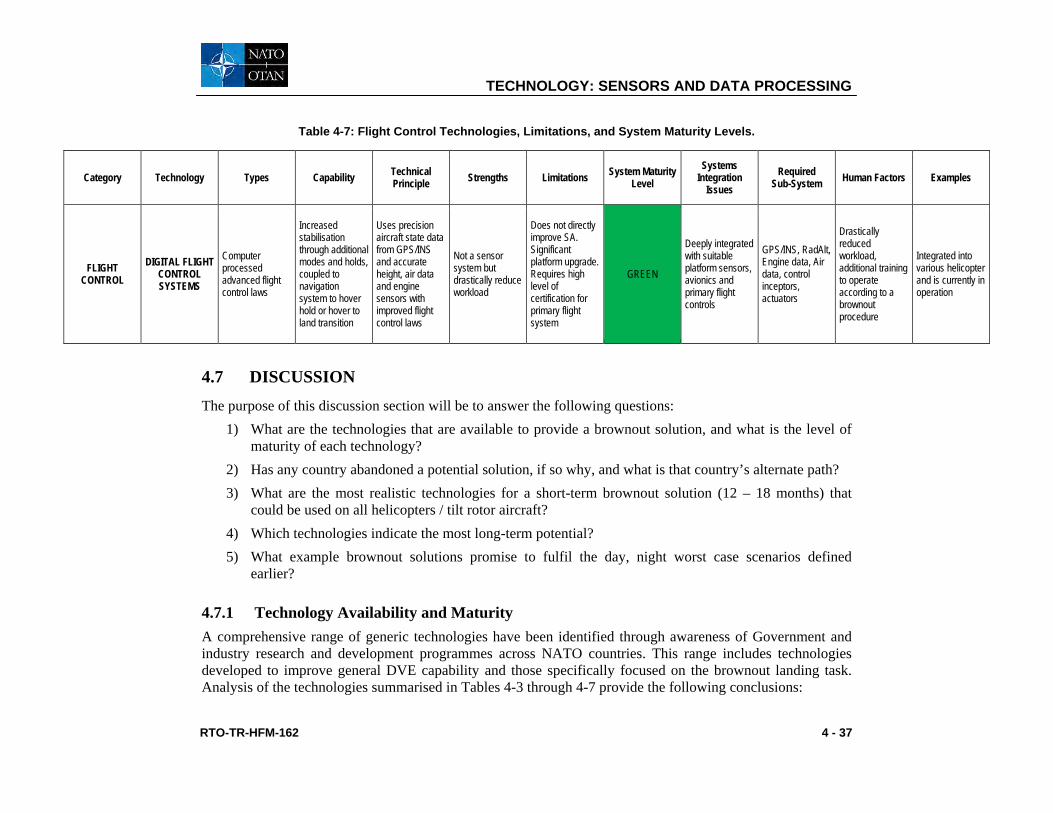
TECHNOLOGY: SENSORS AND DATA PROCESSING
RTO-TR-HFM-162 4 - 37
Table 4-7: Flight Control Technologies, Limitations, and System Maturity Levels.
Category Technology Types Capability Technical Principle Strengths Limitations System Maturity
Level Systems
Integration Issues
Required Sub-System Human Factors Examples
FLIGHT CONTROL
DIGITAL FLIGHT CONTROL SYSTEMS
Computer processed advanced flight control laws
Increased stabilisation through additional modes and holds, coupled to navigation system to hover hold or hover to land transition
Uses precision aircraft state data from GPS/INS and accurate height, air data and engine sensors with improved flight control laws
Not a sensor system but drastically reduce workload
Does not directly improve SA. Significant platform upgrade. Requires high level of certification for primary flight system
GREEN
Deeply integrated with suitable platform sensors, avionics and primary flight controls
GPS/INS, RadAlt, Engine data, Air data, control inceptors, actuators
Drastically reduced workload, additional training to operate according to a brownout procedure
Integrated into various helicopter and is currently in operation
4.7 DISCUSSION The purpose of this discussion section will be to answer the following questions:
1) What are the technologies that are available to provide a brownout solution, and what is the level of maturity of each technology?
2) Has any country abandoned a potential solution, if so why, and what is that country’s alternate path? 3) What are the most realistic technologies for a short-term brownout solution (12 – 18 months) that
could be used on all helicopters / tilt rotor aircraft? 4) Which technologies indicate the most long-term potential? 5) What example brownout solutions promise to fulfil the day, night worst case scenarios defined
earlier?
4.7.1 Technology Availability and Maturity A comprehensive range of generic technologies have been identified through awareness of Government and industry research and development programmes across NATO countries. This range includes technologies developed to improve general DVE capability and those specifically focused on the brownout landing task. Analysis of the technologies summarised in Tables 4-3 through 4-7 provide the following conclusions:

TECHNOLOGY: SENSORS AND DATA PROCESSING
4 - 38 RTO-TR-HFM-162
1) Specific brownout solutions are immature and there is currently no solution available off the shelf.
2) The most mature technologies are those already developed for existing flight applications, namely, TV cameras, thermal imaging, head-mounted display modules (day display and DNVG) and conventional flight instrument symbology. These technologies are already in service in some countries and provide enhanced SA and improved workload in current helicopter operations. However, their effectiveness in brownout is limited.
3) Head-mounted displays are considered essential to host symbology, reduce division of attention and preserve SA of the outside world. Modular HMDs are available in the short term whereas fully integrated HMDs are less mature.
4) Conventional flight symbology is not optimised for the landing task, for example, lacking sufficient drift and height cueing.
5) Low speed symbology, optimised for landing, is being developed and promises a quick solution to reduce spatial disorientation, albeit with an instrument flying style of flight.
6) Conformal symbology is being developed and also promises a quick solution to reduce spatial disorientation whilst preserving a visual flying style of flight and providing awareness of the LZ and LP location.
7) Conformal symbology is more complex to integrate than low speed symbology.
8) Thermal imaging provides the ability to recce the intended LZ prior to brownout but will not see through dust.
9) Day time and Low Light TV cameras cannot see through brownout. However, their low cost and compact size offer the potential to be easily mounted on the airframe to look into areas which are not significantly obscured by dust. For example, multiple LLTV cameras could be used to monitor the landing gear and touch-down area immediately under the helicopter.
10) To improve LP/LZ awareness in brownout, see-and-remember and see-through sensor technologies both require significant development.
11) Whilst in some cases see-and-remember and see-through sensors (LADAR and Active MMW Radar respectively) appear mature in their original application, e.g., obstacle warners and missile seekers, their integration into a useful brownout landing system is very immature and may require modification to the sensor itself.
12) See-and-remember and see-through sensor systems require further development in terms of resolution, sensitivity, processing, display/HMI and physical packaging.
13) Synthetic vision system techniques promise an effective HMI for see-and-remember and see-through sensors but SV technology and the certification/safety arguments are immature.
14) Passive MMW imaging provides a see through capability with imagery in an interpretable form, however, the sensor technology is immature.
15) Tactile cueing technology promises an alternative form of presentation of simple drift and rate of descent cues but is not production ready and issues remain concerning human factors, integration with the aircrew clothing and certification.

TECHNOLOGY: SENSORS AND DATA PROCESSING
RTO-TR-HFM-162 4 - 39
4.7.2 Short-Term Brownout Solutions The most promising short-term mitigation strategy is to augment current landing procedures, e.g., zero speed with improved aircraft state cues. The development and optimisation of symbology offers a promising short-term, partial solution. Improved awareness of drift and rate of descent presented in a form that can be used to control the helicopter should increase safety. Current development programmes of 2-D head-up and head-down, low speed symbology and 3-D head-up, conformal symbology both promise early exploitation. The UK is pursuing a short-term solution based on thermal imaging for recce and recognition of surface hazards in the LZ prior to the recirculation of dust, complemented by head-up, conformal symbology which can be relied upon within brownout. Germany is pursuing a short-term solution based on downward looking LLTV cameras complemented by head-up, 2-D low speed symbology. The US continues to develop the BOSS 2-D low speed symbology on head-mounted and panel-mounted displays. Canada is commencing a comparative study between the HMD 3-D conformal landing symbology and the 2-D BOSS symbology system.
4.7.3 Promising Long-Term Solutions Medium-term mitigation strategies aim to provide a “see-in-the-dust” capability either using see-through or see-and-remember, integrated sensing systems. In the long term a more comprehensive solution may be based on a fully certified, synthetic vision, primary flight display. Currently, see-through and see-and-remember system capability (i.e., imaging and display) is considered immature. Several R&D programmes are developing these technologies, based on active sensors (AMMW RADAR or LIDAR) combined with image processing techniques and terrain databases to present a synthetic view of the LZ. The challenges will be to ensure the sensor gathers sufficient information including terrain features and obstacles and to present the information in a readily interpretable way. The presentation relies on effective processing of the sensed data and presentation using synthetic vision techniques, both of which are immature technologies. The CONOPS of such a system have yet to be developed and are likely to impact the development timescale, particularly from a certification perspective, for example, should the display be presented to the NHP as an aid or to the HP as a primary flight display. Obstacle warners with a see-through capability using AMMW radar may mature in the medium term and the challenge will be to provide a sufficiently useful capability to justify the installation footprint on the platform (i.e., the sensor may only help a small part of the overall brownout problem space). The integration of the sensor output with existing displays must also be resolved. Tactile display technology may also mature in the medium term once integration issues with aircrew clothing and certification issues have been understood.
4.7.4 Abandoned Potential Solutions Many technologies continue to be developed in pursuit of a brownout solution, indeed, all the generic technologies in Table 4-3 continue to be investigated. The maturity level of brownout systems is currently low and very few potential solutions have been abandoned. The US used a Blackhawk helicopter to flight demonstrate a head-down display with 2-D low speed symbology driven from an inertial measurement unit (Brownout Situation Awareness Unit – BSAU) but the solution did not proceed to the service implementation phase. The US also pursued the PhLASH concept using multiple 16 Mpixel IR cameras to present a perspective view to the pilot on a head-down display. The last good 3-D view before brownout was corrected for aircraft motion and continued to be presented as the IR sensors became obscured. This concept has also been discontinued. One significant limitation is if a vehicle enters the PhLASH area after its last frame has been digitized it cannot be displayed and thus becomes an unanticipated obstacle in LZ. A number of R&D programmes have been completed without delivering an exploitable solution, hence work continues. The UK prioritised 3-D conformal symbology and thermal imaging technologies following assessment and down

TECHNOLOGY: SENSORS AND DATA PROCESSING
4 - 40 RTO-TR-HFM-162
selection of typical, generic technologies illustrated in Table 4-3. This was primarily on the grounds of the technical maturity required for a short-term solution.
4.7.5 Example Brownout Solutions Despite the low maturity level of current brownout solutions, the application of technologies can be illustrated using the scenarios defined earlier in Section 4.2.2. In each case, technologies have been selected using best experience to date, tailored to fulfil the defined information requirement and provide the pilot with improved SA for the brownout landing task.
4.7.5.1 Day Scenario
During day operations with good visibility for transit flight and knowledge of the LZ characteristics, the following additional information and supporting technology to complete the brownout landing task more safely is recommended:
1) Drift:
• Provide an aircraft Standard/Spec Inertial Measurement Unit (IMU) coupled to GPS (e.g., EGI) for adequate resolution and update rate.
2) Height Above Terrain / Rate of Descent:
• Provide continuous, dust penetrating Radar Altimeter (RadAlt) information from the onset of re-circulated particulates). Most known RadAlts have problems with dust which can depend on the airframe shape. It is very important to integrate a dust penetrating RadAlt to provide accurate height information throughout the landing phase.
3) Groundspeed:
• Provide GPS or IMU velocity (due to unreliability of pitot tube system below 40 Kts IAS).
4) Attitude Indication:
• Provide a vertical Gyro or IMU.
5) LZ situation awareness:
• Not all the required information can be obtained by pre-recce, LZ preparation, and naked eye view prior to brownout. Some obstacles like metal poles or rocks might be hidden under loose sand and will be blown free through the downwash. Uneven terrain may not be detected early with the naked eye because of the colour scheme and the surface condition. Therefore, the condition of the LP (touchdown point) must be determined. This has been achieved using a dedicated crewman, for example, looking under the aircraft at the surface, however, this is also dangerous. Additional technology could be used, for example, one or two downwards looking TV cameras on fixed mountings on the airframe.
6) Presentation:
• The flight information, drift, HAT/ROD, ground speed and attitude should be clearly presented to the pilot in a form that requires minimal interpretation, minimal increase in workload and minimal division of their attention from the outside world view. It is essential to present the

TECHNOLOGY: SENSORS AND DATA PROCESSING
RTO-TR-HFM-162 4 - 41
information within the Field-Of-View (FOV) of the handling pilot, i.e., a head-up, helmet-mounted display with overlaid low speed or conformal symbology. The current practice of using aircrew patter, in which NHP talks down the HP, whilst not providing a complete solution in itself, should be continued to add flight safety.
• The TV camera imagery could be presented on a head-down display to a crewman or NHP.
The technologies described for the day scenario are mature or maturing rapidly and will be available as a short-term solution.
4.7.5.2 Night Scenario In addition to those technologies stated in the Day Scenario, further improvements in SA are required for the night scenario. With good LZ preparation, adequate night visibility for transit flight and awareness of the LZ characteristics together with an artificial light source (such as cyalumes or Tactical Area Lighting System (TALS)) marking the touch-down point, the following additional SA information and supporting technology is recommended:
1) LZ situation awareness:
• Enhanced Night Vision.
• NVG with Head-up Information Display Capability, i.e., DNVG.
• Prior to brownout, an enhanced surface assessment will be required to compensate for the narrow FOV and the poor spatial resolution of NVG. This could be conducted by the NHP using an Electro Optical Sighting System (EOSS).
• EOSS equipped with a Low Light Level TV Camera and/or Infra Red camera.
2) Presentation:
• DNVG provides a head-up night vision and low speed or conformal symbology display capability.
• The Low Light TV and/or IR camera imagery should be presented on a head-down display to the NHP.
The additional technologies described for the night scenario are mature or maturing rapidly and will be available for a short-term solution.
4.7.5.3 Worst Case Scenario
Due to the severe operational and environmental conditions that a worst case scenario can impose, (DVE together with an unprepared or unrecced LZ), there is a need for a self-contained landing capability which enables controlled/autonomous flight within highly degraded visual conditions, including within the dust cloud, using a high integrity, primary flight display. Improved platform stabilisation and control will be essential to reduce the pilot’s dependence on visual cues. The technologies which aim to facilitate this capability are as follows:
1) Drift:
• Digital Automatic Flight Control System (DAFCS equipped with advanced flight control laws)/ Coupled to the Navigation system – Automatic Hover to Land.

TECHNOLOGY: SENSORS AND DATA PROCESSING
4 - 42 RTO-TR-HFM-162
2) Height Above Terrain / Rate of Descent:
• DAFCS/Automatic Hover to Land.
3) Groundspeed:
• DAFCS/Automatic Hover to Land.
4) Attitude Indication:
• DAFCS/Automatic Hover to Land.
5) LZ situation awareness:
• There is a need for surface recce (including terrain surface, obstacles and other hazards). Emerging technologies include:
• Third Generation High Resolution Thermal camera (turreted and/or Distributed Aperture Sensors(DAS));
• Terrain database;
• Imaging LIDAR/LADAR;
• Active MMW imaging radar;
• Passive MMW imaging;
• Moving obstacle detection systems, e.g., E-Bumper using AMMW radar; and
• Image fusion.
6) Presentation:
• In comparison to the day and night scenarios, the HP may use imagery from onboard sensors, for example DAS, as a primary reference of the outside world. To achieve an adequate field of view this will require an integrated HMD. To maintain awareness of the LZ and LP locations, conformal symbology will complement the improved handling qualities resulting from DAFCS.
• The NHP should also be equipped with an HMD linked to the DAS to provide the view of the outside world.
• Additional imaging sensors (AMMW/PMMW/LADAR/E-bumper) may be used to provide a see through dust/weather capability, presented using a digital cockpit architecture using SV techniques.
• SV could be presented on a large area head-down display visible to the NHP (and HP as an aid).
• If the SV system is sufficiently mature it may be relied upon and presented to both aircrew on the HMD. In this case it is likely the SV imagery will include passive sensor imagery using image fusion techniques.
To safely achieve the worst case scenario, many technologies will need to be further developed, integrated and safety cases to be addressed in order to provide reliable situation awareness. DAFCS is seen as a key enabler and is available in the short term for specific platform types, i.e., Chinook CH47-F. However, DAFCS alone will not improve SA and additional technologies will be required. Conformal symbology will also be available in the short term and provides improved awareness of LZ and LP locations together with cues to complete the landing. However, effective surface recce in DVE will depend on the maturation of see-through sensor and

TECHNOLOGY: SENSORS AND DATA PROCESSING
RTO-TR-HFM-162 4 - 43
display systems (including SV) and associated safety arguments, hence, is considered to be a medium to long-term solution. An additional benefit of the worst case scenario capability is that conventional hover landings could be conducted safely within brownout; the more difficult zero speed technique, keeping ahead of the dust cloud to delay loss of visual cues, would no longer be required (albeit incurring greater erosion of the aircraft). It is anticipated that achieving a capability to enable operations in the worst case scenario will provide a significant step towards a future helicopter Day, Night All Environment capability.
4.8 CONCLUSIONS A variety of technologies have been reviewed as potential solutions to improve safety during brownout landings. To understand how technologies may contribute it is important to understand the information that is required by the pilot during the zero speed landing task. This information has been broadly divided into:
• Aircraft state awareness – drift, ground speed, height above ground, rate of decent and attitude, for aircraft control and stabilisation; and
• LZ awareness – recognise surface, slope, surrounds, size, shape, obstacles and hazards through dust.
Technologies which improve aircraft state awareness are currently more mature than those which provide a see-through dust capability for LZ awareness.
In the short term, improved symbology driven from precise information sources such as an IMU promises the best method of improving aircraft state awareness. Symbology should be presented on a head-mounted display to reduce the pilot’s division of attention away from the outside world cues. 2-dimensional low speed symbology or 3-dimensional conformal symbology for landing are both in development.
Improved aircraft stabilisation can also be achieved using advanced flight control laws in a Digital Automatic Flight Control System (DAFCS), for example, hover hold, controlled vertical descent and, when coupled to the navigation system, automatic transition to hover and landing. DAFCS will be available in the short term on limited platform types (i.e., Chinook CH-47F) but may not have all the functionality cleared for use in brownout. DAFCS is expected to become more widespread on new platforms in the medium term. DAFCS does not increase SA and technologies which provide increased LZ awareness will still be required.
LZ awareness may only be improved in the short term by non-dust penetrating sensors such as TV, Low light TV and infra red cameras. These enable recce of the LZ prior to brownout and/or a short range view of the touch-down point under the aircraft if this area remains clear of re-circulated dust (platform dependent). Conformal symbology also improves awareness of the LZ and LP locations.
In the longer term, LZ awareness may be achieved using see-through active and passive imaging sensors with appropriate data processing to provide a synthetic view of the outside world. Once the technical, safety and certification issues have been resolved, this see-all-the-time approach may negate the need for the zero speed landing technique in favour of a safer, conventional hover landing in dust. In the future, the combination of synthetic vision and DAFCS is anticipated to provide a true Day Night All Environment rotorcraft capability.
4.9 REFERENCES
[1] Ball, A. NATO HFM-162 Rotary-wing brownout working group meeting minutes: NASA Ames September 2007, IMASSA April 2008, ESG Munich, September 2008, USAARL Ft. Rucker April 2009, DRDC Toronto September 2009, ONR London June 2010.

TECHNOLOGY: SENSORS AND DATA PROCESSING
4 - 44 RTO-TR-HFM-162
[2] Finlay, B. (2009). International Technology Research into Helicopter Brownout, DSTL/CR33398 V1.0, 12 January 2009.
[3] Wikner, D. Milli-metre-wave Propagation through a Controlled Dust Environment, Sensors and Electronic Devices Directorate, Army Research Laboratory, Adelphi, Maryland 20783.
[4] Appleby, R., Anderton, R.N., Price, S., Salmon, N.A., Sinclair, G.N., Borrill, J.R., Coward, P.R., Papakosta, P., Lettington, A.H. and Robertson, D.A. (2000). Compact real-time (video rate) passive milli-metre-wave imager, 4th Joint Int Military Sensing Symposium, Paris, September 2000.
[5] Popular Mechanics (2006). Flying Blind in Iraq: US Helicopters Navigate Real Desert Storms, 3 October 2006.
[6] Curry, I.P., Estrada, A., Grandizio, C.M. and Erickson, B.S. (2008). Drift cues from a tactile belt to augment standard helicopter instruments. International Journal of Applied Aviation Studies, 8(1), 74-87.
[7] Curry, I.P., Estrada, A., Webb, C.M. and Erickson, B.S. (2008). Efficacy of tactile cues from a limited belt-area system in orienting well-rested and fatigued pilots in a complex flight environment (USAARL Report No.2008-12). Fort Rucker, AL, USA: Unites States Army Aeromedical Research Laboratory.
[8] Jansen, C., Wennemers, A., Vos, W. and Groen, E.L. (2008). FlyTact: A Tactile Display Improves a Helicopter Pilot’s Landing Performance in Degraded Visual Environments. Lecture Notes in Computer Science 5024, pp. 867-875.
[9] Van Erp, J.B.F., Veltman, J.A., Van Veen, H.A.H.C. and Oving, A.B. (2002). Tactile Torso Display as Countermeasure to Reduce Night Vision Goggle Induced Drift. NATO RTO HFM Panel Symposium “Spatial disorientation in military vehicles: causes, consequences and cures”, La Coruna, Spain, 15-19 April 2002.
[10] Schultz, K., McGrath, B., Cheung, B., Craig, G., Jennings, S. and Rupert, A. (2009) “In flight evaluation of tactile situation awareness system during high hover and simulated shipboard landing”. In: Proceeding of American Institute of Aeronautics and Astronautics conference on “Guidance, Navigation and Control”, Chicago, IL, USA. August 2009.
[11] Operator’s Manual for Head-Up Display AN/AVS-7, TM 11-5855-300-10, NAVAIR 16-35HUD-2 Departments of the Army and Navy, 1997.
[12] Eshow, M. and Schroeder, J. (1993). Improvements in Hover Display Dynamics for a Combat Helicopter, Journal of the American Helicopter Society, January 1993.
[13] Keller, M., Neiswander, G., Schnell, T. and Szoboszlay, Z. (2008) Rotorcraft Hover Symbology Study for Operation in Poor Visibility Conditions, The University of Iowa, February 15, 2008.
[14] Szoboszlay, Z., Albery, W., Turpin, T. and Neiswander, G. (2008). Brown-Out Symbology Simulation (BOSS) on the NASA Ames Vertical Motion Simulator, American Helicopter Society 64th Annual Forum.
[15] Szoboszlay, Z., Jennings, S. and Carignan, S. (2009). Results and Comments for the Loon Symbology Study, National Research Council of Canada Flight Test Report FTR-FRL-2009-0024.

TECHNOLOGY: SENSORS AND DATA PROCESSING
RTO-TR-HFM-162 4 - 45
[16] Thorndycraft, D., Marsden, D. and Jennings, S. (2008). Flight assessment of an integrated DNAW helicopter pilotage display system; flight trial ‘HAWKOWL’, SPIE Conference.
[17] Goff, C.P., Ball, A.N., Yapp, J.L., Pearce, S.J. and Crawford, F.L., (2010). Developing a 3-D Landing Symbology Solution for Brownout, , American Helicopter Society Forum 66, Phoenix, Arizona.
[18] Szoboszlay, Z., McKinley R. and Turpin, T. (2009). Symbology for Brown-Out Landings: The First Simulation for the 3-D-LZ Program, American Helicopter Society 65th Annual Forum.
[19] Einthoven, P., Bender, J., Blanken, C. and Lawler, M. (2006). Development of Control Laws for the Chinook Digital AFCS Program, Presented at the American Helicopter Society 62nd Annual Forum, Phoenix, Arizona, May 9-11, 2006.
[20] Irwin III, J., Sherman, D. and Crispino, J. (2008). The CH-47F CAAS-DAFCS Coupled Flight Director, Presented at the American Helicopter Society 64th Annual Forum, Montreal, Canada, April 29th – May 1st, 2008.
[21] Priot, A.E., Hourlier, S., Barbarat, E. and Roumes, C. (2007). Adaptation to increased interocular distance: survey of Tiger pilots training Human factors and medical aspects of day/night all weather operations: current issues and future challenges. Meeting Proceedings RTO-MP-HFM-141, Paper 30 (pp. 30-31 – 30-12). Neuilly-sur-Seine, France: RTO.
[22] Irwin, J., Einthoven, P., Miller, D. and Blanken, C. (2007). ADS-33E Predicted and Assigned Low-speed Handling Qualities of the CH-47F with Digital AFCS, Presented at the American Helicopter Society 63rd Annual Forum, Virginia Beach, VA, USA, May 1-3, 2007.
[23] Jarret, D.N., (2005). Cockpit Engineering, Ashgate Publishing.
TECHNOLOGY: SENSORS AND DATA PROCESSING
4 - 46 RTO-TR-HFM-162

RTO-TR-HFM-162 5 - 1
Chapter 5 – RISK MANAGEMENT STRATEGIES TO COUNTER BROWNOUT
5.1 INTRODUCTION
Hardware (airframe) and technological improvements that deal with DVE (especially brownout and whiteout) will require considerable research and development and considerable resources to implement and are a relatively distant goal. In the short term, Nations should aim to enhance their DVE procedures and training without delay. Unsurprisingly, training strategies and techniques for brownout/whiteout take-offs and landings vary considerably between Nations and are difficult to standardize. This is largely due to the availability of resources and subtleties in individual countries’ training doctrines and their operational requirement. However the broad principles should concur and thus merit further examination. This chapter outlines the general risk management strategies in DVE operations, but will specifically focus upon the procedural controls necessary for safe flight in DVE.
5.2 PRINCIPLES OF RISK MANAGEMENT
As mentioned in previous chapters, transitions in reduced visibility pose a significant risk to aviation, crews and passengers; the maneuvers should thus be subjected to a hierarchy of control. A hierarchy provides a principled approach to risk management, prioritizing risk reduction before risk protection, i.e., measures listed earlier should be scoped and implemented (where possible) in preference to later measures. The hierarchy is listed below with examples of aviation control measures:
• Hazard elimination, e.g., use of hardened or sealed LZs only.
• Risk reduction (frequency and severity), e.g., reduce the need to undertake DVE transitions; avoid areas with poor surfaces; use surveyed sites only.
• Procedural controls, e.g., use procedures to minimize time within the obscurant cloud; enhance aircrew performance through quality training; implement strategies to manage workload, Crew Resource Management (CRM) and fatigue.
• Introduce technical enablers, e.g., automation, drift indication, head-up symbology, see-through technology.
• Provide collective and personal protection, e.g., aircraft survivability, aircrew equipment assemblies, Survive Evade Resist and Extract (SERE) training.
• Provide rapid emergency response capability.
5.3 CONTRIBUTORY FACTORS
The ability to maneuver the aircraft safely in DVE will depend upon several factors:
• Aircraft Factors:
• Undercarriage configuration and tolerance.
• Rotor configuration – tandem, tilt, tail rotor.
• Stability and Centre of Gravity (CG).

RISK MANAGEMENT STRATEGIES TO COUNTER BROWNOUT
5 - 2 RTO-TR-HFM-162
• All Up Mass (AUM).
• Power available – influenced by density altitude, engine air particle separators, demist.
• Technological enablers including the human interface.
• Aircrew Factors:
• Training, experience and currency.
• Crew coordination, use of rear crew, use of constituted crews, division of tasks.
• Aircrew performance – alertness, workload, physiological effects (e.g., heat).
• Environmental Factors:
• Density altitude.
• Weather – cloud cover, wind, precipitation. Consider effect on Thermal Imagery (TI) and Night Vision Devices (NVD).
• Light levels – glare especially when combined with dust haze, heat shimmer and minimal shadow can make assessment of the LZ very difficult; conversely low light levels and poor contrast make night operations difficult.
• Terrain/structure (natural or man-made).
• Nature of surface – sealed, loose, water content. Small stones may cause windscreen damage.
• Size of LZ.
• Notable with multi-ship operations.
• Surrounding obstructions. Consider the difficulty in visualizing wires.
• Slope.
• Operational Factors:
• Operational imperative – risk/benefit ratio.
• Recce – the ability to survey the LZ prior to touchdown.
• Threat level.
• Multi-ship operations.
• LZ lighting.
In general, aircraft factors (esp. technological enablers) will determine the range of potential transitions; aircrew are then trained to meet the operational requirement; environmental and operational factors will then determine which transition is actually used.
5.4 LANDING TECHNIQUES
Landing is the most hazardous of all transitions in DVE particularly within low light conditions and a non-permissive environment. The mission commander should risk assess the sortie prior to departure, and balance

RISK MANAGEMENT STRATEGIES TO COUNTER BROWNOUT
RTO-TR-HFM-162 5 - 3
the tactical, environmental, aircrew and platform risks against the operational imperative. Appropriately constituted crews, systematic planning and thorough preparation are essential prerequisites. A marked and surveyed LZ should be used wherever possible. Over-flight, noting obstructions, surface material, Hover Reference Markers (HRM), overshoot options, actual LZ height (RadAlt – BarAlt comparison) and wind direction is desirable in all cases, although the tactical situation may be a constraining factor. Approaches are always conducted into wind where possible; if the wind is oblique; consider using the upwind pilot as the Handling Pilot (HP) as HRM are likely to remain outside the recirculation cloud for longer. The aircraft must always have sufficient power to initiate an overshoot should the crew become disorientated or lose essential references. Finally, crews should be alert to potential illusions of scale (e.g., stunted trees) and ground aberrations (e.g., irregular sand ridges).
Potential techniques for landing in DVE are as follows:
• Zero speed landing – the most commonly used approach, balancing the time in recirculation against the risks of unseen obstructions or an unknown surface.
• Short running landing – aircrew must be confident about the surface but can expect reduced exposure to recirculation and improved aircraft stability. If the surface is known to be smooth (e.g., dirt landing strip) then a faster run-on landing may be used thus avoiding all recirculation until after touchdown.
• Low hover and land – whilst this enables a final survey of the LZ, aircrew must expect significant recirculation.
• High hover and vertical descent – this technique requires Hover Out of Ground Effect (HOGE) power. It is the preferred option in benign conditions especially if the aircrew are uncertain of surface conditions or obstructions; the technique is ideally supported by automation and/or synthetic orientation cues, unless the LZ has only a thin layer of dust or snow.
5.4.1 Zero Speed Landing A typical procedure starts at the run-in or approach phase with the aircraft trimmed and steady at a pre-determined height Above Ground Level (AGL) and pre-determined ground speed. A height hold may be used to reduce workload. During this run-in, or as part of an over-flight reconnaissance, the Handling Pilot (HP) aims to select initial ground reference markers against which he can monitor the angle of approach and latterly, any drift. At the same time, the Non-Handling Pilot (NHP) will scan the landing site (with observation aids or TI if available), carry out pre-landing checks, establish an overshoot track (set on the heading bug) and close vents, windows and cockpit curtains. At a predefined “Gate”, in order to enter into the approach, the HP will initiate a constant angle, slow descent (typically 200 – 300 fpm, 61 – 91 mpm) with a decelerative attitude “held against the springs”. The approach angle is commonly slightly steeper than a standard visual approach to reduce the build-up of the recirculation cloud (crews must also be alert to the risk of vortex ring / settling in power). During the constant angle approach the NHP or the middle seat crew will monitor and call out height, ground speed and Rate Of Descent (ROD) information. The HP will continue to monitor the sight angle approach picture and monitor ground speed using a lateral visual scan. At an intermediate point, perhaps initiated by the RadAlt alarm, the HP may then refine reference marker selection and the aircraft pitch to ensure a zero speed landing. Height indicators and the advancement of the recirculation cloud are provided by the rear crew from this point on. The crew “talk down” allows the HP to maintain “eyes out” visual scan throughout and concentrate on basic attitude, yaw and power control. Just prior to landing it is probable that reference markers will be lost as the advancing recirculation cloud engulfs the cockpit. At this point it may still be acceptable to continue onto aircraft touchdown provided the

RISK MANAGEMENT STRATEGIES TO COUNTER BROWNOUT
5 - 4 RTO-TR-HFM-162
imperative to land remains and the aircraft remains in a safe configuration, i.e., stabilized, in a safe attitude, without drift or yaw and the LZ has been visually assessed as suitable. If these parameters are not met the crew should initiate an overshoot or go-around. At touchdown, and prior to lowering the collective, the HP should then check that the reference markers are below blade path, the aircraft is not yawing and the slope is within limits. At touchdown the aircraft should have no lateral drift and no forward ground speed. A small run on could be accepted if circumstances allowed. Touchdown should be firm to ensure the aircraft passes quickly through the ground effect. The workload throughout the approach is high, but if it is controlled and precise, the workload remains manageable and severe attitude changes at the point of touchdown are avoided. See Figure 5-1.
Figure 5-1: Zero Speed Landing.
Notable Risks: Excessive pitch up attitude at the point of touchdown may result in a tail (-rotor) or ramp strike. There is a potential to succumb to drift and spatial disorientation, especially if the aircraft fails to pass through ground effect and remains in a low hover.
5.4.2 Short Running Landing This procedure is similar to the zero speed but culminates in a short run-on landing. At the “Gate”, the pilot either adopts a lesser decelerative attitude or delays the full decelerative attitude until the RadAlt alarms at the intermediate point. The aircraft will then touchdown with a small amount of forward speed. The faster approach speed allows less time for the recirculation cloud to develop and keeps the cloud further aft of the

RISK MANAGEMENT STRATEGIES TO COUNTER BROWNOUT
RTO-TR-HFM-162 5 - 5
cockpit. The aircraft attitude at touchdown may vary: a level attitude is used for aircraft susceptible to tail strike (e.g., nose wheel or skids) or for faster run-on speeds (to keep the recirculation clear of the cockpit); a flared attitude may be held if the aircraft is less susceptible to tail damage (e.g., tandem rotor or tail wheel) or where the run-out must be contained. See Figure 5-2.
Figure 5-2: Short Running Landing.
Notable Risks: Unseen LZ obstructions, unseen slope, surface unevenness or a surface that gives way (e.g., crust or deep and soft) may cause sudden deceleration and undercarriage damage. Sudden deceleration also causes the disc to flap forward, which in turn may cause stones to be whipped up by the downdraft and induce windscreen damage. Excessive pitch up attitude may result in a tail or ramp strike.
5.4.3 Low Hover and Land This approach is identical to the zero speed but culminates in a low hover over the intended landing point. The aircraft is then lowered under the guidance of rear crew directly visualizing the LZ. The selected hover height must be low enough to enable direct visualization of the ground but high enough to avoid a tail or ramp strike in the final flare. See Figure 5-3.

RISK MANAGEMENT STRATEGIES TO COUNTER BROWNOUT
5 - 6 RTO-TR-HFM-162
Figure 5-3: Low Hover and Land.
Notable Risks: Loss of HRM and ground contact with disorientation in the low hover.
5.4.4 High Hover and Vertical Descent The approach to the high hover and vertical descent is best conducted using additional orientation cues or automation as HRM may be obscured or the aircraft may be engulfed within the recirculation cloud for significant periods of time. The HOGE normally starts at the upper limits of the recirculation – the height will vary between aircraft with different AUM. Once a stable hover has been established, height and position holds may be engaged prior to a stepwise descent to ground level. At each pause check for drift and allow the recirculation to moderate. The ROD is principally determined by the rate at which the obscurant is blown clear of the intended LZ. Any significant drift at the point of landing may induce aircraft roll-over and thus drift indication (usually in head-up symbology) is recommended. The procedure is ideally suited to hard surfaces where recirculation is anticipated to be slight. In this case one hover marker at 45 degrees to the HP may be sufficient for orientation throughout the controlled descent. The procedure may also be used for confined areas when constant angle approaches are impractical. See Figure 5-4.

RISK MANAGEMENT STRATEGIES TO COUNTER BROWNOUT
RTO-TR-HFM-162 5 - 7
Figure 5-4: High Hover and Vertical Descent.
Notable Risks: Loss of HRM and disorientation in the hover and descent.
5.5 COMPARISON OF LANDING TECHNIQUES
Table 5-1 provides a summary and comparison of approach techniques, highlighting specific advantages/ disadvantages and factors that might influence the commander’s selection.

RISK MANAGEMENT STRATEGIES TO COUNTER BROWNOUT
5 - 8 RTO-TR-HFM-162
Table 5-1: Comparison of Landing Techniques.
Approach Advantages Disadvantages Requirements Most Suited for
Zero Speed
↓ recirculation exposure.
↓ time in threat zone.
No run on.
Nose up attitude.
Risk of tail strike.
High workload.
Accurate and controlled approach.
Improved handling capability, needs adequate training.
LZ in high threat level environment.
Precision LZ (e.g., FARP1).
Tandem rotor or aircraft with good tail clearance.
Short Run-On
↓↓ recirculation exposure.
↑ stability in final approach.
↓ time in threat zone.
↑ risk from unseen obstructions, slope and poor surface.
Risk of undercarriage damage.
Risk of tail strike.
High workload.
Surveyed LZ.
Strong undercarriage.
Hostile LZ.
LZ with few ground references.
Tandem rotor or good tail clearance.
Low CG.
Low Hover
Can visualize LZ.
↓ risk of tail strike.
Significant recirculation.
Loss of HRM and drift.
Good HRM. Indistinct surface.
Poor tail clearance.
High Hover
Can visualize LZ.
↓ risk of tail strike.
Prolonged recirculation.
Not suitable in threat environment.
Loss of HRM and drift.
Benign tactical environment.
Hover holds or orientation aids or good HRM.
Light recirculation.
Confined areas.
Prepared areas.
Poor tail clearance.
5.6 CREW COORDINATION
Each crew-member has clearly demarcated responsibilities, uses standardized language and adheres to strict intercom discipline to reduce cognitive workload. An example of a height only talk down is illustrated below; this could be supplemented with ground speed information. Note the use of a call and response system using standardized phrases, and rotational patter to avoid the crew over-talking each other. The patter should be unhurried, although cadence can be used to express urgency when required. As the cloud approaches the tail of the aircraft, the crewmen’s patter generally takes priority over that of the NHP.
NHP: “IN THE GATE, BUGGING ** FEET”(for RadAlt audio warning) and state direction of landing
1 Forward Arming and Refuel Point.

RISK MANAGEMENT STRATEGIES TO COUNTER BROWNOUT
RTO-TR-HFM-162 5 - 9
HP: “COMMENCING APPROACH”
NHP: (height call)
HP: “GOOD (references)”
**************** RadAlt Audio Warning *****************
No 1 C’MAN: “DUST CLOUD FORMING”
No 2 C’MAN: (height call)
HP: “GOOD (references)”
No 1 C’MAN: “RAMP”
No 2 C’MAN: (height call)
HP: “GOOD (references)”
No 1 C’MAN: “CENTRE”
No 2 C’MAN: (height call)
HP: “GOOD (references)”
No 1 C’MAN: “DOOR”
No 2 C’MAN: (height call)
No 1 C’MAN: “COCKPIT”
No 2 C’MAN: “AFT WHEELS ON”
No 2 C’MAN: “FRONT WHEELS ON”
No 2 C’MAN: “GOOD LINE” (if there is a run-on and the ground is suitable)
If the patter order breaks down, or a call is missed, a crew-member should prompt the appropriate crew position, e.g., “PILOT”, who should then reply with the appropriate response. If the necessary information is still not forthcoming, an overshoot is mandatory. A silent pilot is likely to have exceeded his cognitive capacity and thereafter will be unable to devote sufficient attention to safe flight – hence the requirement for a mandatory overshoot.
Where HMD symbology is available to both pilots (day and night), critical flight data is continuously displayed, allowing both pilots to remain “eyes out”. In these circumstances a briefer verbal talk-down may be utilized, thereby reducing the workload in the cockpit whilst maintaining a high level of crew-coordination. This method is particularly relevant for low-hover-and-land approaches. Crewmen are not as involved as with the previous concept (the windows and ramp may be closed, so visibility is limited in the dust).
HP: “COMMENCING APPROACH”
**************** RadAlt Audio Warning *****************
NHP: “DUST CLOUD FORMING. HEAVY/MEDIUM CLOUD”
HP: “STOPPING AT…..landing point” (including description of any obstacles around the LP.

RISK MANAGEMENT STRATEGIES TO COUNTER BROWNOUT
5 - 10 RTO-TR-HFM-162
NHP: “EYE CONTACT” (meaning, I can take controls, if needed)
HP: “EYE CONTACT”
HP: “GOING DOWN” (HP must not descend below hover height before this call)
No 1 C’MAN: “RIGHT CLEAR” (if visibility allows)
No 2 C’MAN: “TAIL CLEAR” (if visibility allows)
If one of the pilots does not have sufficient ground references, a call out like “DON’T HAVE” is done. The NHP may take control at this stage, but must maintain a minimum of hover height, whilst the HP acquires sufficient visual references. Both pilots must have good ground visual references to descend below the predetermined hover height.
Operational experience has shown that pilots using this brief talk down patter are able to maintain high quality calls, with fewer omissions, whilst preserving reasonable workload levels.
5.6.1 Overshoot An overshoot may be called by any member of the crew. It is usually executed by the HP immediately and unconditionally. When an overshoot is called the HP should:
• Transfer to instruments.
• Adopt a wings level, hover attitude and initiate a collective-led vertical climb.
• Transition into forward flight on the preselected overshoot track, but only once a positive rate of climb has been established.
5.7 TACTICAL CONSTRAINTS/VARIATIONS
There may be occasions when the approach must be conducted in difficult circumstances (e.g., low light or poor visibility) and perhaps without the benefit of an aerial inspection of the LZ. In these cases the operational imperative must justify the increased risk to the passengers and crew. Advance planning, including access to direct imagery of the LZ or a thermal scan of the LZ on the run-in, may offset some risk. Troops on the ground may have been able to survey the ground and mark out a standardized LZ; inter-operability between aviation crews and ground troops is vital to ensure the necessary standardization and trust. HRM may be ill defined as the approach starts; alternatively, the HRM that was deemed suitable at the start of the descent may transpire to be inappropriate. In these cases it is entirely appropriate to make fine adjustments during the descent provided the change in intent is conveyed to all the crew. If the approach is part of a multi-ship approach, the effect on other aircraft must also be considered. Occasionally no suitable HRM are present at all. Absence of clear visual cues considerably raises the risk of disorientation particularly where synthetic orientation cues are not available either. The aircraft commander must again balance risk against operational imperative and be prepared to modify the approach to match the environmental conditions, tactical situation and the competency of the crew.

RISK MANAGEMENT STRATEGIES TO COUNTER BROWNOUT
RTO-TR-HFM-162 5 - 11
5.8 TAKE-OFF TECHNIQUES
The technique used for take-off is primarily determined by power available and the characteristics of the LZ. There are three commonly used techniques:
• Towering take-off – a maximum power, vertical climb to break out of the recirculation cloud as quickly as possible.
• Rotation about the nose – the simultaneous application of power with forward transition allows the aircraft to clear the cloud earlier; the crew must be confident that the path ahead is clear and this should only be conducted into wind.
• Rolling take-off – the aircraft is accelerated along the ground for a normal rolling take-off once clear of the recirculation cloud; this technique is suitable for wheeled aircraft only, from areas with a suitable surface and length.
In the first two techniques the HP should expect to convert to an instrument scan once visual reference markers are lost and should utilize all additional orientation aids and stability systems where possible (e.g., hover meter, heading hold, symbology drift information). The NHP “bugs up” the RadAlt warning alert progressively, calls “CLEAR OF CLOUD” once the aircraft exits the cloud and monitors torque, especially when power margins are slight. The rolling take-off enables the pilots to retain visual contact with the ground throughout but is heavily dependent upon the LZ characteristics. It may also be useful for a power limited departure. If the surface is covered by only a light layer of dust, sand or snow, the pilot may elect to apply a limited amount of collective prior to take-off to disperse any loose material which in turn may enable a normal departure.
5.9 GROUND AND HOVER TAXI MANEUVERS
It is important to retain good ground definition throughout any taxi maneuvers. If the surface is suitable and a wheeled aircraft is used, ground taxiing may be appropriate. Ideally the speed is adjusted to keep the recirculation cloud aft of the cockpit. When moving short distances downwind it may be safer to transition out of the recirculation and conduct an into-wind approach to the new position. However, HOGE reduces available ground references and may increase the possibility of disorientation. Crews should also be alert to relative motion illusions (vection illusion) when operating close to the ground. Finally automation (e.g., UH-60M, CH-47D, Apache D model) or hover symbology may be used to augment orientation cues and stabilize the aircraft whilst maneuvering. The necessity of a take-off and go-around due to loss of orientation should always be considered.
5.10 NIGHT OPERATIONS
Night flying techniques are an extension of daylight procedures, but with the following considerations: • Selection of good hover references with strong background contrast is highly desirable. • Landing aids should be used where possible, e.g., a NATO T or Y, crossed vehicle headlights, cyalumes
(light sticks dropped in the over-flight recce or deployed by ground troops). • Slope and ground texture are very difficult to establish, particularly in low light conditions.
Night approaches are usually the last part of any environmental training syllabus, requiring sufficient competence in daylight transitions first. Most countries opt to restrict training and non-essential flight to

RISK MANAGEMENT STRATEGIES TO COUNTER BROWNOUT
5 - 12 RTO-TR-HFM-162
conditions above set minima (e.g., 10-20mLux). Whilst it may be necessary to operate at levels below set minima, these occasions should be confined to those crews with the necessary skill set and only when the operational imperative dictates. Some formations may have night enhancement packages to facilitate low light operations, e.g., TI, symbology, moving map displays.
5.11 SNOW OPERATIONS
Operations in cold and snowy environments are subject to some variations in the techniques discussed above due to differing environmental and aircraft performance factors:
• The cold air reduces the density altitude. Whilst this will increase aircraft performance, this may be partly offset by heavier troop loads and the use of demist.
• Snow provides a uniform and bright surface, often with few textural cues to aid the perception of height and speed. • Note: Doppler/INS and RadAlt are particularly important in transitions for their assessment of
GROUND SPEED and height. • Note: A smoke canister may be useful as a high-contrast HRM as well as indicating wind direction.
• It is difficult to assess the surface snow condition from the air (e.g., hard packed/crusted or deep powder); it is also not possible to assess the surface conditions below the snow cover. Whilst the approach pattern may vary, only one landing configuration is deemed safe.
• Skis may be used on skids or wheels to reduce the depth the aircraft will sink in to the snow.
5.12 APPROACH TO LAND
Using a HRM the pilot typically flies a constant angle approach to a 10 ft stabilized hover. The hover reference marker is then held in the lateral chin bubble/quarter light whilst the HP lowers the aircraft to conduct a sloping ground landing. If there are no convenient HRM at the LZ or it is not possible to make a normal approach due to obstructions, then the high hover technique may be used. In this case the aircraft is brought to a hover outside of the recirculation and then descended in stages to allow recirculating snow to dissipate. Forward and lateral markers are essential to prevent drift in the hover. At the point of landing the aircraft may be rocked slightly as it settles into the snow to prevent any sudden lurches should the snow give way unevenly beneath the undercarriage.
Characteristic hazards associated with snow approaches:
• Wires and masts may be very difficult to see. Ensure the recce is meticulous.
• Flat, open areas devoid of shrubs and trees are probably frozen lakes so do not fully lower the lever once landed.
• Areas of tree felling will usually contain hidden stumps and therefore are not appropriate LZs.
• Use of the landing light at night causes dramatic reflection from recirculating snow and is not recommended (this includes taxiing manoeuvres). If light is used, the light beam should be aimed away from the pilot’s direct field of view to minimise reflections.

RISK MANAGEMENT STRATEGIES TO COUNTER BROWNOUT
RTO-TR-HFM-162 5 - 13
5.13 TAKE OFF
The technique for whiteout conditions is not materially different from that used in other forms of recirculation. However crews should be aware that the skids, skis or wheels may be frozen to the surface and thus when initiating lift or any ground taxi, pressure and counter-pressure on the yaw pedals will help break any bond prior to movement.
5.14 UNDER SLUNG LOADS
The difficulties and hazards associated with Under Slung Load (USL) operations in recirculation are exacerbated by the need to operate in the hover for extended periods. However it is usually possible to continue to operate in all but the heaviest of recirculation, provided ground reference markers remain visible. The use of a longer strop may be considered as this enables a higher hover and in part ameliorates the severity of the recirculation; however HRM may be harder to determine and load control is affected. Careful planning with ground support troops enables a standardized operating template and the provision of suitable and robust HRM. Direct vision and feedback from the rear-crew considerably enhances orientation information when handling USL.
5.14.1 USL Techniques
Pre-mission planning is essential in predicting helicopter performance. When the load is first lifted the crew must accurately note the height at which the load first clears the ground. This information will enable the RadAlt to be accurately set (not below the “load clear” height) for the subsequent drop off. Drop off is normally conducted using the low hover approach technique (see above). A hovermeter, if available, provides additional orientation information and should be brought into the HP scan prior to the envelopment of the recirculation cloud. Once a stable hover is established over the drop-off point the load may be lowered under the guidance of the crewmen. The NHP’s duties are similar to those in normal transition but should also include monitoring the hovermeter.
5.15 FORMATION PROCEDURES
Formation landings onto a LZ with potential recirculation will raise more particulates and may create additional hazard for adjacent or successive aircraft. Careful consideration should be made of the composition of the crews, LZ size, prevailing wind and the likely conditions. The various options for the formation approaches, in order of ease of use, are as follows:
• Use individual, widely dispersed, LZs (at least 6 rotor spans separation, dependent upon the wind conditions).
• Stream for landing, allowing sufficient time between successive aircraft for the recirculation to disperse.
• Simultaneous arrivals with subordinate elements landing first (zero-speed landings) and in the downwind position. Careful assessment of the wind is essential. Run-on landings are not recommended for formation approaches due to the additional risk of collision with other aircraft. If space permits, aircraft may land on slightly divergent headings to aid avoidance of the recirculation generated by adjacent aircraft. If any aircraft overshoots, then all following aircraft must overshoot on predetermined vectors.

RISK MANAGEMENT STRATEGIES TO COUNTER BROWNOUT
5 - 14 RTO-TR-HFM-162
Formation departures should be well briefed and if necessary rehearsed. Aircraft should lift in sequence and following aircraft should only lift once the previous aircraft has called “CLEAR”. Once airborne, lead should fly a pre-briefed heading at a slower speed to allow the remainder to catch up.
5.16 PLATFORM SPECIFICS
5.16.1 Tilt Rotor The highly loaded Prop Rotors of the CV-22 produce high downwash velocities that can result in partial or complete loss of visual references in recirculation, particularly in the forward quadrant as the aircraft slows; some visibility in the lateral quadrant and directly below is usually maintained throughout. Approaches are essentially a slower more methodical adaptation of the normal approaches. Two approaches are typically used: No-Hover Land (constant angle approach with a run on speed <5 kts ground speed) and the High Hover (for extreme conditions or where obstacles prohibit a constant angle approach).
5.16.2 Tandem Rotor The tandem rotor as shown by the CH-47 Chinook has a specific downwash characteristic. Because of its stable and not retractable gear and the possibilities to tolerate high pitch positions during landing (there is no low tail) it is possible to maintain the high speed until it is close to the ground. This allows the aircrew to perform a thorough last minute check of the landing area and afford a good opportunity for a preferred low speed rolling landing to stay ahead of the dust cloud. When a zero speed landing is required the Pilot floor bulb and the first LM position (right hand side door) keep a relative good vision of the ground. This is because of the specific shape of the dust cloud (donut) and the position of the hole in the donut in relation of the position of the pilot and LM.
5.16.3 Single Main Rotor It is difficult to provide a generic description about single main rotor aircraft. Most of them have a low vulnerable tail rotor. This defines the limits of forward speed reduction. This limitation in combination with an unstable landing gear (for example, the narrow wheel based tri landing gear of the super puma) makes it a very challenging situation.
The position of the pilot and the crew-member according to the blade position on the aircraft and the specific dust donut created by that blade configuration dictates if the pilot or crew-member keeps outside view during the last phase of landing and its type specific.
The No-Hover Land is not discernibly different from traditional rotary-wing platforms; the approach is orientated around a ground reference marker, which should end up abeam the pilot. There is a tendency to induce some lateral drift as the reference marker closes, particularly once the obscurant cloud passes the cockpit and the visual scan becomes more laterally orientated, but this effect is generally overcome with training. The HP has Head-Down Display (HDD) hover symbology for additional orientation cues although at night this cueing information may be displayed on the NVG HUD for reduced outside-inside scanning.
The High Hover approach is usually initiated outside the recirculation cloud (50 – 75 ft, 15 – 23 m) and the aircraft let-down in stages whilst utilizing groundspeed and position holds on the Hover Coupler. Again precise orientation symbology is available from the HDD or NVG HUD.

RISK MANAGEMENT STRATEGIES TO COUNTER BROWNOUT
RTO-TR-HFM-162 5 - 15
Visual references are temporarily lost in both approaches, particularly in close proximity to the ground; in this instance (dependent upon aircraft power margins) it may be safer to continue the approach to the ground rather than initiating an overshoot; pilots are taught to inform the crew when this point is passed. Crew roles are similar to conventional RW platforms with a high emphasis on a clear division of responsibility and concise communication (although typically less proscriptive than that described in the Crew Coordination section). The normal position of the cabin aircrew is on the ramp, whilst the flight engineer remains in the seat with the cockpit door closed (due to heavy ingress of particulates). The areas beneath the ramp and below the engine nacelles offer the best quarters for maintaining visual contact with the ground.
5.16.4 Undercarriage Factors Aircraft with a narrow wheelbase, especially when coupled with a high CG are particularly vulnerable to roll-over should the aircraft land either with lateral drift or on an uneven surface. Thus running landings, unrecced LZs and approaches with limited orientation cues (natural or synthetic) present particular risk. A single tail wheel is particularly vulnerable on rough and uneven surfaces and thus a zero speed landing is preferred for tail wheel, tricycle aircraft. Wheeled undercarriages are generally more susceptible to damage when compared with skids. Front wheels in particular may bury on soft or uneven surfaces and thus a level or nose up attitude at the point of touchdown is important to reducing undercarriage stress and the development of dynamic roll-over.
5.17 TRAINING FOR TRANSITIONS IN DEGRADED VISUAL ENVIRONMENT
Undertaking transitions within reduced visual conditions, especially when close to the ground, requires a high level of skill and experience. This is a responsibility for not just pilots but for the whole aircrew. Training traditionally consists of a logical and progressive program that allows the whole aircrew to gain experience and develop skills, which maintain good situational awareness in safe flight configurations.
A progressive training structure normally consists of: • Development of the procedure; • Theoretical training; • Synthetic training (simulator); and • Actual flying.
5.17.1 Development of the Procedure The procedures developed must allow for the efficient utilization of relevant visual and sensor information to the whole crew for each specific flight phase. The presentation of RELIABLE information is clearly crucial to this process. Information sources not only include the pilot’s outside view and avionic data, but may also include information from the non-handling pilot and other aircrew (e.g., loadmasters). This clearly requires an efficient and effective CRM procedure for each DVE transition.
It is important that the workload of the entire crew and specifically the handling pilot is a concern during procedure development. There have been many reports illustrating reduced performance and decision making at times of cognitive overload. Thus a realistic distribution of workload (limited display information, prioritization of tasks and realistic task distribution) is important to ensure each crew-member is provided with relevant information only during each phase of the transition procedure. Information should be presented in a

RISK MANAGEMENT STRATEGIES TO COUNTER BROWNOUT
5 - 16 RTO-TR-HFM-162
standardized manner having eliminated as many variables from each situation to make scenarios instantly recognizable, thus allowing quick decisions on whether to continue the transition or abort.
5.17.2 Theoretical Training
Developed procedures must be grounded in Standard Operating Procedures (SOPs) to ensure intra-operability of all fleet crew-members. SOPs will require review whenever there are changes to aircraft configurations. For example if Head-Up Displays (HUDs) are installed, the availability of height information changes and the co-pilot may no longer need to call out periodic RadAlt information, but rather confine his calls to safety altitude calls only.
5.17.3 Synthetic Training
Simulators (fixed base and motion) are most commonly used for synthetic training and are capable of high quality training transfer particularly in developing the skills for risky procedures. Whilst simulators are capable of producing convincing DVE scenarios they lack some aspects of the real situation.
5.17.3.1 Vision
In most situations a brownout module is nothing more than a visual display that turns progressively brown, sometimes with additional effects (e.g., swirling of the dust cloud). However the vection illusion, conveying an incorrect assessment of motion and responsible for strong influences on crew behavior, is not usually part of the brownout representation. Many companies are now working on the development of more realistic visual representations for simulators, which will further enhance the synthetic experience; this development phase will require further integration prior to full implementation in training simulators.
5.17.3.2 Motion
Most motion simulators are of a hexapod design, while capable of some motion sensation cannot match reality. For example, sub-threshold acceleration and lateral drift, one of the most common errors for transitions in DVE, are poorly represented – this aspect is currently best demonstrated in actual flight. However we can expect some developments in the future as there are simulators with multiple axes of motion and with greater degrees of freedom (for example: device available to RNLAF).
5.17.3.3 Crew Concept
Most simulators allow for training of cockpit crews only as an attached crewman module is relatively uncommon. As a consequence, the synthetic training fails to mirror the standard informational inputs and SOPs of the actual flying task thus altering the patter of actual transitions.
5.17.3.4 Synthetic Training Conclusions
Synthetic training is rarely designed to wholly replicate the real environment but rather deliver a training effect in a safe and transferable manner. There are obvious shortfalls in realism some of which may not be apparent to aircrew. Trainers, however, must be aware of the gap between synthetic training and flight in actual DVE to ensure that the synthetic training has not engendered a false sense of security.
RISK MANAGEMENT STRATEGIES TO COUNTER BROWNOUT
RTO-TR-HFM-162 5 - 17
5.17.4 Actual Flying Actual flying is the most realistic way of training in DVE but it is also the most hazardous and exerts additional wear and tear upon scant resources. Actual flying may be done in a progressive manner by choosing different landing areas with differing snow and dust characteristics thereby changing the severity of the obscuration. This allows aircrew to develop their performance and confidence in a controlled manner. However it is not always possible to find perfect environmental conditions and thus the benefits of well-constructed synthetic training prior to in flight training cannot be underestimated. If DVE conditions are not routinely experienced within national boundaries then the training may be done in supportive countries or within the actual operational theatre. A theatre qualification is normally awarded to verify the training. Finally it should be noted that there is no substitute for having undertaken transitions in real and demanding environmental conditions and thus some form of progressive actual training is necessary for confidence and competence prior to moving onto operational circumstances.
5.17.5 Continuation Training The conduct of DVE transitions is a perishable skill and thus aircrew require a currency program to maintain competency. This may be achieved by conducting a minimum number of transitions over a period of time or by mandating periodic refresher training, or with a mix of the two; the operational experiences of differing countries and the frequency of DVE exposures will likely determine which modality is selected. A mandated and benchmarked standard is necessary to ensure competence across the fleet.
5.17.6 Training Conclusions In the future we can expect new developments in simulators, which will make it easier to prepare our aircrew for operations in DVE. Until then it is important to recognize potential threats such as information overload and sub-threshold drift. This is initially managed by making the procedure as safe as possible by developing standardized procedures which are repeatable across a range of conditions and with manageable operator workload. Training exposure is thereafter incremental using a range of procedural synthetic trainers and actual flight. Ultimately aircrew should be confident in their collective ability developed through a system of progressive and maintenance training. Transitions in DVE are not without risk but can be made relatively safe through well-developed training programs.
5.18 CONCLUSIONS
Transitions in DVE are inherently dangerous maneuvers and therefore should only be carried out where operationally necessary. A range of procedures have been developed through operational experience; procedure selection is determined by the tactical and environmental conditions, platform capabilities, and aircrew experience and training. Workload, especially during DVE approaches, is high, hence the importance of using well rehearsed, standardized techniques and sharing the workload across the whole crew. The implementation of technical enablers in future aircraft will likely enhance situation awareness but the value of high quality procedures and aircrew training will remain paramount.

RISK MANAGEMENT STRATEGIES TO COUNTER BROWNOUT
5 - 18 RTO-TR-HFM-162

RTO-TR-HFM-162 6 - 1
Chapter 6 – CONCLUSION
Blinding snow, sand, and dust clouds churned up by helicopter rotors still cost NATO lives and aircraft in ongoing conflicts. All of the countries participating in this Task Group (TG) have lost helicopters due to either brownout or whiteout landings. The US services have lost the most aircraft and personnel due to brownout mishaps in the arid environments of Iraq and Afghanistan.
Better crew training and improved cockpit symbology and flight controls have provided some help in addressing the common threat of brownout. Several of the NATO partners, singly and in partnership, are pursuing advanced see-through, see-and-remember and combination technologies for safe landings in desert dust as well as improved flight symbology and automatic flight control systems. This TG met and visited six different sites during its three-year existence and evaluated the current state of the technology in the nine member countries that participated in the TG. Technology Readiness Levels of sensor, display symbology, alternative cueing techniques and automatic flight control systems were developed.
In the US, the DARPA Sandblaster initiative culminated in 2009 in a clear-air demonstration using Millimeter Wave (MMW) radar to update a stored terrain database and synthetic vision display of the upcoming landing zone. Phase II tests of the Helicopter Autonomous Landing System (HALS II) sponsored by the US Army Aviation Applied Technology Directorate (AATD) used MMW radar to see through Yuma Arizona (AZ) dust clouds and generate obstacle symbology. In September 2009, the 3D-LZ system integrated by the Army Aeroflightdynamics Directorate (AFDD) at NASA Ames and the US Air Force Research Laboratory (AFRL) used Laser Radar (LADAR) to build and update a dynamic database and cue pilots with a Brownout Symbology System (BOSS). The 3D-LZ Black Hawk made actual landings in Yuma dust clouds.
The US Army formally recognized brownout as a major safety hazard in 2003, and Degraded Visual Environments (DVE) are a core focus of the new US Naval Aviation Center for Rotorcraft Advancement at Patuxent River, Md. Once inside the brownout cloud, helicopter crews denied situational awareness are vulnerable to excessive sink rates, lateral drift and obstacle collisions. Early in Operation Enduring Freedom, an Army CH-47D was destroyed and 16 soldiers injured when the Chinook set a landing gear in an Afghan irrigation ditch. Germany and the Netherlands have also suffered losses in Afghanistan due to brownout landings.
Helicopters and tilt rotors with high-set rotors, engines and transmissions are also prone to catastrophic roll-overs. The MV-22 and CV-22 tilt rotor aircraft can generate significant brownout conditions. Low-speed flight symbology can help prevent crashing descents and dangerous drift in dust. US Army Apache pilots use AH-64 hover symbology to make brownout landings, and similar cockpit cues have migrated to US Air Force cockpits. The Rockwell Collins Common Avionics Architecture System (CAAS) in new Chinooks incorporates symbology developed for the AATD Brownout Situational Awareness Upgrade (BSAU). BSAU velocity vector, acceleration cuing, radar altitude and vertical speed symbology helped test pilots make brownout landings at Yuma AZ in 2004 and appear on the CAAS displays in the operational CH-47F and MH-47G. CAAS derivative displays will go into the aging US Marine CH-53E and new fly-by-wire CH-53K.
To provide motion cues to pilots in brownout, the Dutch National Aerospace Laboratory is investigating helmet displays, and the Dutch contract research organization TNO has experimented with vibrating belts. TNO’s “Fly Tact” is a vest and belt with “tactors”, vibrating elements like those used in mobile phones. The US Army Aerospace Medical Research Laboratory (USAARL) has also evaluated tactile cueing technology to provide orientation cues to helicopter pilots.

CONCLUSION
6 - 2 RTO-TR-HFM-162
Cuing symbology also works with integrated flight controls to enhance stability in brownout. The US Air Force Special Operations Command upgraded MH-53M Pave Low and HH-60G Pave Hawk helicopters with an Altitude Hold Hover Stabilization system and improved cockpit symbology. Marine MV-22 and Air Force CV-22 tilt rotors have flight path vector displays that let crews make brownout landings manually with cues on the hover indicator or automatically using the fly-by-wire hover-hold function.
The baseline UH-60M Black Hawk now in production has a coupled autopilot, and the UH-60M Upgrade in test introduces fly-by-wire to better stabilize DVE approaches and landings. Boeing Chinook engineers, meanwhile, claim the BAE Digital Automatic Flight Control System in the CH-47F achieves nearly the same results at a lower cost. With an automatic departure mode, DAFCS is already credited with saving lives when pilots lost spatial orientation in brownout.
Hover symbology and enhanced flight controls nevertheless do nothing to avoid landing zone obstacles hidden by dust clouds. In 2006, the AFRL tested the Photographic Landing Augmentation System for Helicopters (PhLASH) on a Pave Low MH-53M. A 16 Mpixel camera with an infrared strobe and laser rangefinder were employed to image the landing zone before entering the cloud. The pilot saw a clear picture of the LZ as it was 20 to 30 seconds before landing, geo-registered on the real world with a GPS receiver and inertial measurement unit. The see-and-remember PhLASH had the resolution to spot small obstacles but could not show hazards entering the LZ after brownout occurred. AFRL has initiated “electronic bumper” research to develop an array of obstacle sensing emitters around the helicopter, technology similar to that in some automobiles, in order to detect obstacles during landing in DVE.
The Task Group found that brownout initiatives in several countries are now looking to integrate see-through sensors with synthetic vision displays. Though US AFRL tests showed mid- to long-wave Forward Looking Infrared (FLIR) sensors had twice the dust-penetrating performance of electro-optical cameras, the 3-to-5 micron or 8-to-12 micron targeting and navigation FLIRs on combat helicopters are essentially blind in brownout. Successful brownout tests have used millimeter wave radar and LADAR to paint a landing picture.
6.1 SENSOR DEVELOPMENT Clear-air Phase II tests of the Sandblaster brownout system in January 2009 showed synthetic vision integrated with millimeter wave radar and fly-by-wire flight controls could indeed bring pilots to safe brownout landings. Limited by safety rules on the AFDD Black Hawk, the Sandblaster system took the helicopter to a 25-foot hands-off hover in simulated brownout at Moffett Field, Calif., and showed landing zone obstacles on a head-down display. Merging stored data and real-time returns generate a cartoon-like synthetic vision display including obstacles. The 360-degree presentation gives pilots all-round situational awareness in approach and hover. Spotting an obstacle on approach, pilots could “beep” the radar elsewhere and move their landing to a safe area. A wire detection test at the end of the demonstration also showed the see-through sensor could reveal power lines. The 94 GHz band gave the Sandblaster radar an antenna about a third as large as a 35 GHz alternative.
Under a Cooperative Research And Development Agreement, the US Army AATD and Sikorsky evaluated a 94 GHz see-through Helicopter Autonomous Landing System. In March 2009, the BSAU test Black Hawk with Sierra Nevada Corp. HALS II radar flew into Yuma landing zones alone or behind a UH-1 helicopter to test the ability of the radar to penetrate brownout dust. While Sandblaster used a fixed-angle, fixed-azimuth radar to update its SLEEK database, HALS II provided two scanning angles to spot obstacles on landing or enroute. Obstacles appeared as generic shapes, but their presence was clear. The HALS II see-through radar painted the LZ from 6,000 feet to touchdown.

CONCLUSION
RTO-TR-HFM-162 6 - 3
Image quality of mechanically scanned radars is generally limited by how fast the antenna can scan. The rolling drum technology in both the HALS II and Sandblaster radars supports fast scans without blurring. Sierra Nevada Corp. is also working on electronically scanned arrays, and a more advanced HALS III radar may fly on a production Black Hawk in 2011.
6.2 HIGH-RESOLUTION LADAR
The US AFRL brownout Task Group members concluded that laser radar could provide far better spatial resolution than MMW radar to spot landing zone obstacles. The 3D-LZ collaboration by the AFRL and AFDD integrated LADAR with an intuitive Brownout Symbology System. The LADAR updated a dynamic navigation database that showed pilots color-enhanced obstacles. BOSS cues developed by AFDD consolidated and improved elements of BSAU symbology to give pilots essential flight parameters with reduced workload. The 3D-LZ landings touched down at 0 to 1 knots, with descent rates less than 50 feet per minute. The demonstration system leveraged commercial EBAIR (Eye-safe Burns Active Infra-Red) survey LADAR technology from H.N. Burns Engineering Corp., of Orlando, Fla. The 3D-LZ LADAR was about 30 percent smaller than the commercial version, and when mounted on the AFDD Black Hawk could gimbal 30 degrees down for landings or from 5 degrees up to 55 degrees down for sling-load simulations. Compared to MMW radars, the narrow beam LADAR provided 50 times higher resolution with a single pulse. Small LADAR scanning steps, meanwhile, provided 20 times higher resolution in a full frame of data. Maximum range of the LADAR was 2,000 feet.
The 3D-LZ LADAR populated and updated a dynamic navigation database for real-time vertical and horizontal situation displays through approach, landing and departure. Though LADARs in dust are more prone to signal attenuation and backscatter than radars, the system used a dust pre-processor to keep false returns from cluttering collected navigation data. Depending on size and distance, the 3D-LZ system selectively enhanced obstacles with false color on natural color terrain. Pilots were able to detect obstacles 18 inches high.
The AFRL was to award critical Small Business Innovative Research contracts in February to demonstrate multi-function LADAR for brownout landings, cable warning and obstacle avoidance. Under a separate Navy contract, Burns Engineering and Areté Associates, of Northridge, CA, USA, are developing signal-processing techniques for see-through LADARs. Rockwell Collins previously licensed commercial-off-the-shelf fiber optic laser technology from Optical Air Data Systems, based in Manassas, VA, USA, for the LandSafe air data system tested on a Marine CH-53E. EADS Deutschland is likewise applying scanning LADAR to the see-and-remember HELLAS-Awareness System for brownout and obstacle detection.
To provide a true multi-purpose helicopter sensor, the TG members envision 3D-LZ laser technology integrated with navigation FLIR. Intuitive hovering and landing symbology, such as the BOSS, must also be an integral part of an effective system for DVE landings. The NATO members of this Task Group encourage the transition the technology described in this report to a production brownout aid for the forces.

CONCLUSION
6 - 4 RTO-TR-HFM-162

RTO-TR-HFM-162 7 - 1
Chapter 7 – SUPPLEMENTAL MATERIAL
Curry, I.P., Estrada, A., Grandizio, C.M. and Erickson, B.S. “Drift cues from a tactile belt to augment standard helicopter instruments”, International Journal of Applied Aviation Studies, 8(1), 74-87, 2008.
Eshow, M. and Schroeder, J., “Improvements in Hover Display Dynamics for a Combat Helicopter,” Journal of the American Helicopter Society, January 1993.
Franklin, J., Stortz, M., Borchers, P. and Moralez, E., “Flight Evaluation and Advanced Controls and Displays for Transition and Landing on the NASA V/STOL Systems Research Aircraft”, NASA TP-3607, 1996.
Franklin, J., “Dynamics, Control, and Flying Qualities of V/STOL Aircraft”, American Institute of Aeronautics and Astronautics, Reston, VA, USA, 2002.
Gilliland, K. and Schlegel, R.E., “Tactile stimulation of the human head for information display”, Human Factors, 36 (4), 700-717, 1994.
Keller, M., Neiswander, G., Schnell, T. and Szoboszlay, Z., “Rotorcraft Hover Symbology Study for Operation in Poor Visibility Conditions”, The University of Iowa, February 15, 2008.
Merrick, V., “Some VTOL Head-Up Display Drive-Law Problems and Solutions”, NASA TM 104027, 1993.
Merrick, V., Farris, G. and Vanags, A., “A Head-up Display for Application to V/STOL Aircraft Approach and Landing”, NASA TM 102216, 1990.
Szoboszlay, Z., Albery, W., Turpin, T. and Neiswander, G., “Brown-Out Symbology Simulation (BOSS) on the NASA Ames Vertical Motion Simulator”, American Helicopter Society 64th Annual Forum, 2008.
Szoboszlay, Z., McKinley, R. and Turpin, T., “Symbology for Brown-Out Landings: The First Simulation for the 3D-LZ Program”, American Helicopter Society 65th Annual Forum, 2009.
Van Erp, J.B.F., “Tactile navigation display”, In: S. Brewster, R. Murray-Smith (Eds.): Haptic Human-Computer Interaction. Lecture notes in computer science, Vol. 2058, pp. 165-173, Berlin Heidelberg: Springer Verlag, 2001.
Van Veen, H.A.H.C. and Van Erp, J.B.F., “Tactile information-presentation in the cockpit” Lecture Notes in ComputerScience, Vol. 2058, pp. 174-181, Berlin Heidelberg: Springer Verlag, 2001.
Veltman, J.A. and Gaillard, A.W.K., “Physiological indices of workload in a simulated flight task”, Biological Psychology, 42, pp. 323-342, 1996.
Veltman, J.A. and Gaillard, A.W.K., “Physiological workload reactions to increasing levels of task difficulty”, Ergonomics, 5, 656-669, 1998.
Wood, D., “Editorial: Tactile displays: present and future” Displays, 18 (3), 125-128, 1998.
SUPPLEMENTAL MATERIAL
7 - 2 RTO-TR-HFM-162

RTO-TR-HFM-162 A - 1
Annex A – TTPC-AER-TP2-2011 TASK OUTCOME REPORT FOR ENHANCED/SYNTHETIC VISION PILOTAGE SYSTEMS
TASK OUTCOME REPORT
TTCP Sub-element: AER TTCP Reference No: CP 2C.1 Task Title Enhanced/Synthetic Vision Pilotage Systems
A.1 TASK DESCRIPTION
Most of the Nations are investigating the use of enhanced and synthetic vision systems in degraded visual environments. Numerous aircrew and aircraft have been lost in Afghanistan due to the pilot’s loss of out-the-window visual cues in fog and dust conditions. During landing, the helicopter’s own downwash creates a recirculating dust cloud, which both limits visibility to the ground, and produces false motion cues. Aircraft have also collided with terrain and obstacles while flying in-route at low levels, typically at night. Enhanced and synthetic vision systems offer the potential of greater situational awareness in degraded visual environments, increasing safety. The goals (and measures of effectiveness) are reduced accidents and an increase in the weather conditions available for operations. The specific objectives of this CP are:
• Develop guidelines for enhanced/synthetic vision systems for low level flight.
• Design and test terrain and obstacle avoidance and aircraft limiting cuing for contour flight through haptic, tactile feedback and visual displays.
• Design and test displays for approach and landing to non-surveyed sites in degraded visual conditions including brownout and whiteout.
A.2 ACHIEVEMENT OF TASK OBJECTIVES
Trial Hawkowl was conducted by the UK MoD and QinetiQ to provide a flight demonstration of an integrated day/night all weather system. The primary goal was to assess the benefits and limitations of the system during the execution of operationally realistic tasks in degrade visual environments. A MoD SeaKing Mark IV helicopter was modified with terrain imaging sensors (image intensifier, infrared, and passive mm-wave) and pilot displays (NVG-HUD, Panoramic NVGs with symbology, and a panel-mounted display). Sub-systems were integrated to provide the pilot with navigation information during low level flight enroute to the landing point. The primary symbols for navigation were a pathway-in-the-sky symbol and a flight path marker symbol showing the current direction of travel as shown in Figure A-1. Once near the landing point the pathway in the sky directed the pilot on the proper approach path to the landing point. A separate set of symbols then aided the pilot to a hover and landing. There was substantial participation by Canada under the TTCP agreement in this test, and the preceding tests (listed under a prior CP).
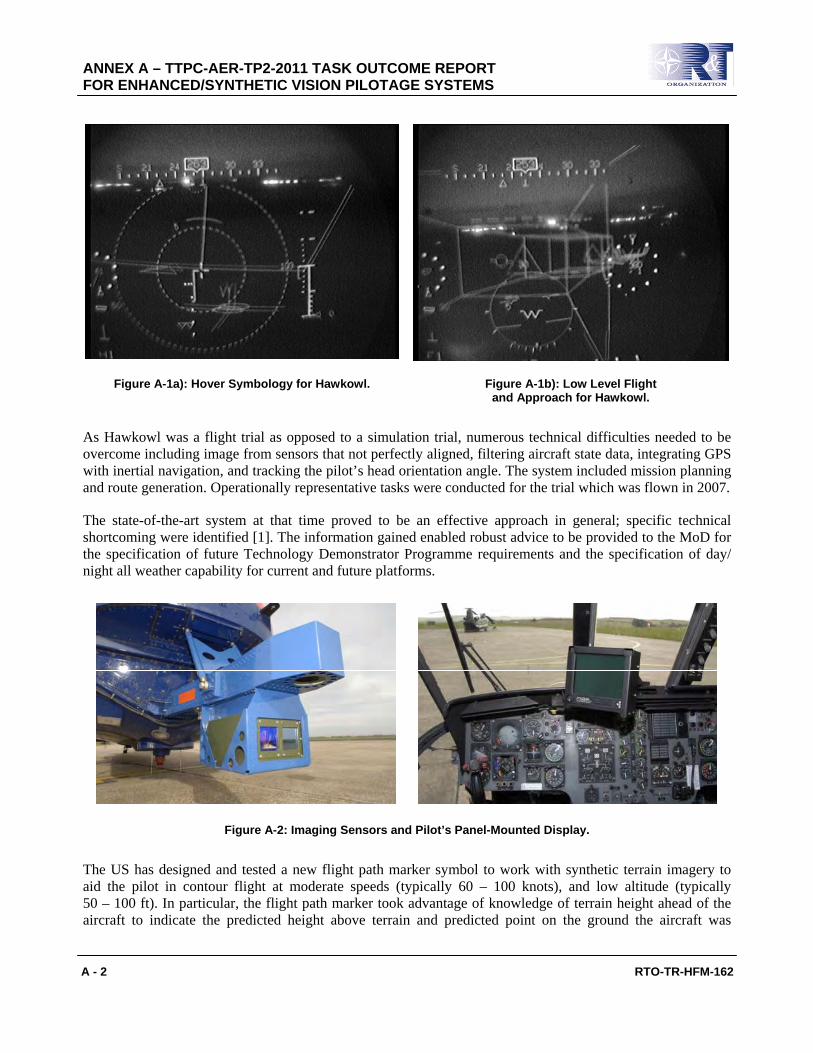
ANNEX A – TTPC-AER-TP2-2011 TASK OUTCOME REPORT FOR ENHANCED/SYNTHETIC VISION PILOTAGE SYSTEMS
A - 2 RTO-TR-HFM-162
Figure A-1a): Hover Symbology for Hawkowl. Figure A-1b): Low Level Flight and Approach for Hawkowl.
As Hawkowl was a flight trial as opposed to a simulation trial, numerous technical difficulties needed to be overcome including image from sensors that not perfectly aligned, filtering aircraft state data, integrating GPS with inertial navigation, and tracking the pilot’s head orientation angle. The system included mission planning and route generation. Operationally representative tasks were conducted for the trial which was flown in 2007.
The state-of-the-art system at that time proved to be an effective approach in general; specific technical shortcoming were identified [1]. The information gained enabled robust advice to be provided to the MoD for the specification of future Technology Demonstrator Programme requirements and the specification of day/ night all weather capability for current and future platforms.
Figure A-2: Imaging Sensors and Pilot’s Panel-Mounted Display.
The US has designed and tested a new flight path marker symbol to work with synthetic terrain imagery to aid the pilot in contour flight at moderate speeds (typically 60 – 100 knots), and low altitude (typically 50 – 100 ft). In particular, the flight path marker took advantage of knowledge of terrain height ahead of the aircraft to indicate the predicted height above terrain and predicted point on the ground the aircraft was

ANNEX A – TTPC-AER-TP2-2011 TASK OUTCOME REPORT FOR ENHANCED/SYNTHETIC VISION PILOTAGE SYSTEMS
RTO-TR-HFM-162 A - 3
expected to fly over a fixed distance in front of the helicopter. The symbol worked both with and without a predetermined route. This display was tested in simulation first, and later in flight test on the US Army RASCAL fly-by-wire UH-60 ([2]-[4], Figure A-3).
Figure A-3: New Flight Path Marker Symbol (ATP-FPM) Used with Synthetic Terrain Imagery as Flown on the US Army Fly-by-Wire RASCAL UH-60.
Average altitude error below the target altitude of 50 ft was reduced by 1/3 in flight test as compared to the traditional flight path marker symbol as shown in Figure A-4. Ground track error was reduced by 1/2 compared to the traditional flight path marker symbol as shown in Figure A-5.
Maximum Low Altitude Error(Mean of 6 pilots, no repetition)
-29.20 -18.97
-45-40-35-30-25-20-15-10-50
Q-FPM ATP-FPM
Alti
tude
Err
or [f
t]
Figure A-4: Flight Test Result – Maximum Low Altitude Error.

ANNEX A – TTPC-AER-TP2-2011 TASK OUTCOME REPORT FOR ENHANCED/SYNTHETIC VISION PILOTAGE SYSTEMS
A - 4 RTO-TR-HFM-162
Max. Ground Track Error(Mean of 6 pilots, no repetition)
143.58 74.520
50
100
150
200
250
Q-FPM ATP-FPM
Dis
tanc
e Er
ror [
ft]
Figure A-5: Flight Test Result – Max. Ground Track Error.
Concentrating on the generation of the synthetic terrain image, the US Army AMRDEC issued a Small Business Innovative Research (SBIR) contract to Monterey Technologies Inc. with sub-contractors Aireyes and Nav3D. The synthetic terrain image started out as being from a preloaded terrain elevation database. However, the system had a simulated radar, which would morph the database in real time (Figure A-6). Three dimensional fusion occurred when the simulated radar was within range of terrain features, and within the sensor’s field-of-view. Another 2-D fusion occurred when simulated infrared imagery was available. The pilot could see the infrared imagery through the synthetic terrain grid. Grids were highlighted when they were scanned by the radar so the pilot could see if upcoming terrain was scanned yet [5].
Figure A-6: Pilot’s Display for the Integrated Multi-Sensor Synthetic Imaging System (IMSIS) Used in Simulation by the US Army AFDD.

ANNEX A – TTPC-AER-TP2-2011 TASK OUTCOME REPORT FOR ENHANCED/SYNTHETIC VISION PILOTAGE SYSTEMS
RTO-TR-HFM-162 A - 5
Eleven US military rotorcraft pilots participated in the simulation. The radar validated synthetic terrain was considered by the evaluation pilots to be almost as useful as a good infrared image (which is not always available due to clouds and fog). The combination of infrared imagery and radar validated synthetic terrain was considered by the pilot group to be the most effective navigation aid.
The US has been developing a guideline for the design of displays for terrain and obstacle avoidance. The guideline itself is currently a US-Israel MOA task, but it contains many examples done outside the MOA by a number of different Nations and industry. This guideline is currently in draft form. When completed, at approx. end of 2013, this guideline will be released to the public. TTCP Nations have the desire to monitor progress and receive the design document, under a new focus area FA 2C.4 “Visual Cueing for Rotorcraft Pilots”.
Progress has been made in the Canada and the US in the area of haptic (body motion) feedback through the collective stick. In both cases this feedback was done with an electrically driven fly-by-wire collective stick. Information type was both limit cueing (felt as bumps) and desired stick position (felt as detents). TTCP Nations have the desire to monitor progress under a new focus area FA 2C.5 “Audio, Tactile, and Haptic Cueing”.
Australia has provided audio advisory/caution/warning files which were implemented at NRC Canada in the fly-by-wire Bell 412, the US Army AFDD synthetic vision simulator, and the US Air Force Research Lab helicopter brownout simulator. One audio file provides advisory information that the pilot’s guidance to landing has started. Caution and warning files informed the pilot of excessive vertical speed close to the ground. In simulation these two areas were identified as needing a non-visual information channel due to the pilot’s very limited area of attention on the display at any given time. Several iterations were completed between the US and Australia to refine the syntax. TTCP Nations have the desire to monitor progress and possibly work toward collaboration in the future under a new focus area FA 2C.5 “Audio, Tactile, and Haptic Cueing”.
The Sandblaster program was funded by DARPA and used the US Army AFDD RASCAL Blackhawk aircraft (2009). This program combined a radar sensor from Sierra Nevada Corp., a Honeywell computer to fuse radar and pre-stored terrain elevation data, aircraft state symbology developed by Honeywell and Sikorsky, and a fly-wire-wire flight control system with Sikorsky control laws for automated approach and hover. Sikorsky was the prime contractor. An example pilot’s display is shown in Figure A-7.

ANNEX A – TTPC-AER-TP2-2011 TASK OUTCOME REPORT FOR ENHANCED/SYNTHETIC VISION PILOTAGE SYSTEMS
A - 6 RTO-TR-HFM-162
Figure A-7: Sandblaster Display Includes Radar Data (Close) and Pre-Stored Terrain Elevation Data (Far) and Symbology.
The Sandblaster system worked as designed in actual flight conditions. Pilots noted that the radar resolution was lower than desired, and it took longer than desired to scan the landing area. The benefit of this sensor was the ability to see through dust (tested separately from the RASCAL flight test). A vehicle was driven onto the landing area and this was seen on the display by the pilots. Curtains were used to block the pilot’s out-the-window view. The auto-approach flight control system worked well, reducing workload and thus enabling the pilot to scan for obstacles and move the desired landing point if necessary.
The UK has been working over the last three years to develop a Low Visibility Landing (LVL) solution for brownout [6]. This research programme was concluded in March 2011. It matured a 3-Dimensional (3-D), head-mounted conformal symbology system in conjunction with AgustaWestland and Ferranti Technologies Limited (FTL). It was an accelerated technology development program designed to reduce accidents and incidents caused by spatial disorientation in brownout. It is a pragmatic approach, balancing effectiveness, time and cost. The UK MoD has undertaken flight trials on an Army Lynx and conducted simulation trials in a Merlin Simulator. The simulation demonstrated that a viable 3-D conformal symbology system could significantly reduce unacceptable landings in brownout.
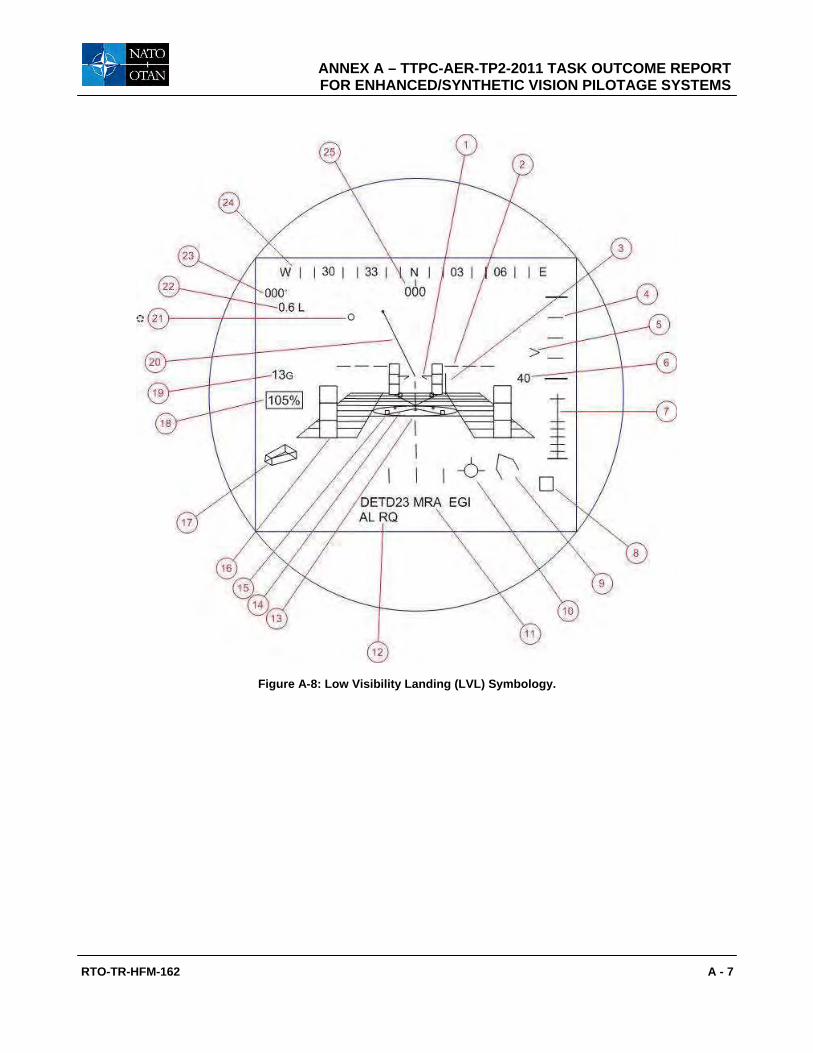
ANNEX A – TTPC-AER-TP2-2011 TASK OUTCOME REPORT FOR ENHANCED/SYNTHETIC VISION PILOTAGE SYSTEMS
RTO-TR-HFM-162 A - 7
Figure A-8: Low Visibility Landing (LVL) Symbology.
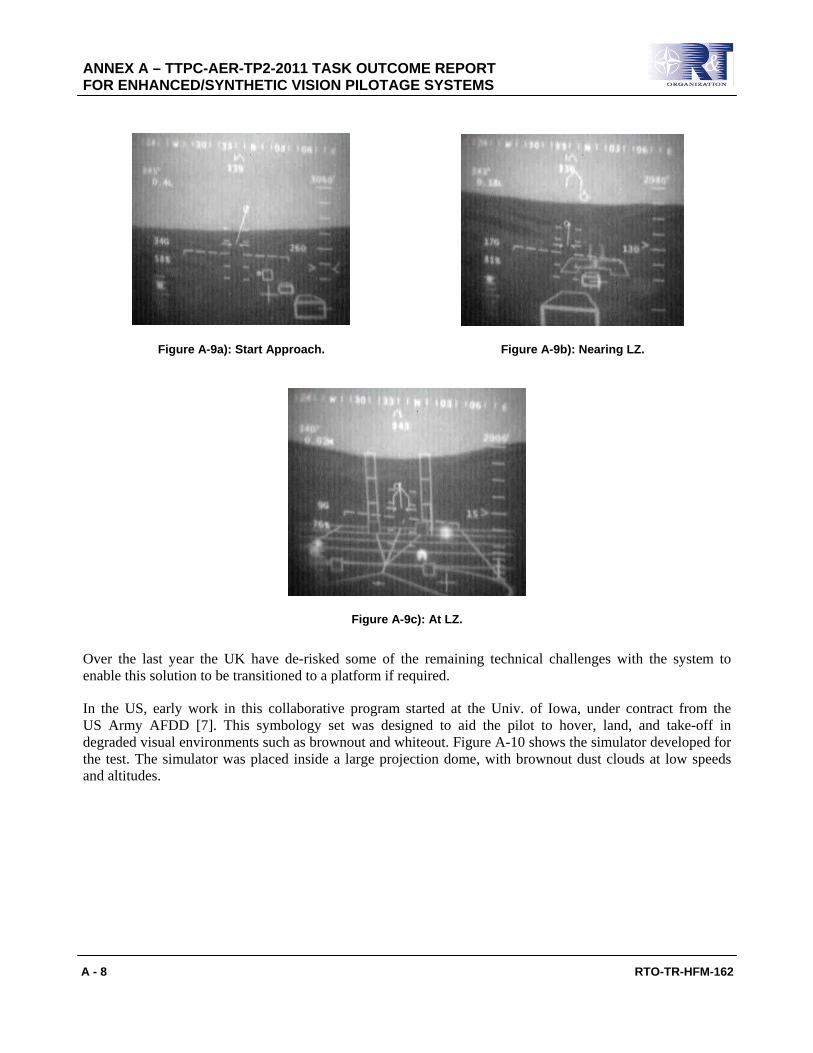
ANNEX A – TTPC-AER-TP2-2011 TASK OUTCOME REPORT FOR ENHANCED/SYNTHETIC VISION PILOTAGE SYSTEMS
A - 8 RTO-TR-HFM-162
Figure A-9a): Start Approach. Figure A-9b): Nearing LZ.
Figure A-9c): At LZ.
Over the last year the UK have de-risked some of the remaining technical challenges with the system to enable this solution to be transitioned to a platform if required.
In the US, early work in this collaborative program started at the Univ. of Iowa, under contract from the US Army AFDD [7]. This symbology set was designed to aid the pilot to hover, land, and take-off in degraded visual environments such as brownout and whiteout. Figure A-10 shows the simulator developed for the test. The simulator was placed inside a large projection dome, with brownout dust clouds at low speeds and altitudes.

ANNEX A – TTPC-AER-TP2-2011 TASK OUTCOME REPORT FOR ENHANCED/SYNTHETIC VISION PILOTAGE SYSTEMS
RTO-TR-HFM-162 A - 9
Figure A-10: University of Iowa Simulator for Brownout Landing.
Figure A-11 shows two of several displays tested. On the left is the Common Avionics Architecture System (CAAS) display, versions of which are used on the CH-47F, and MH-60 helicopters. The left pane shows a new integrated scrolling radar altimeter and vertical speed indicator, replacing the CAAS dials. This simulator had the first implementation of the integrated altitude and vertical speed indicators, which are important elements to what is now called the BOSS symbology set. On the right, synthetic vision terrain imagery has been added as well.
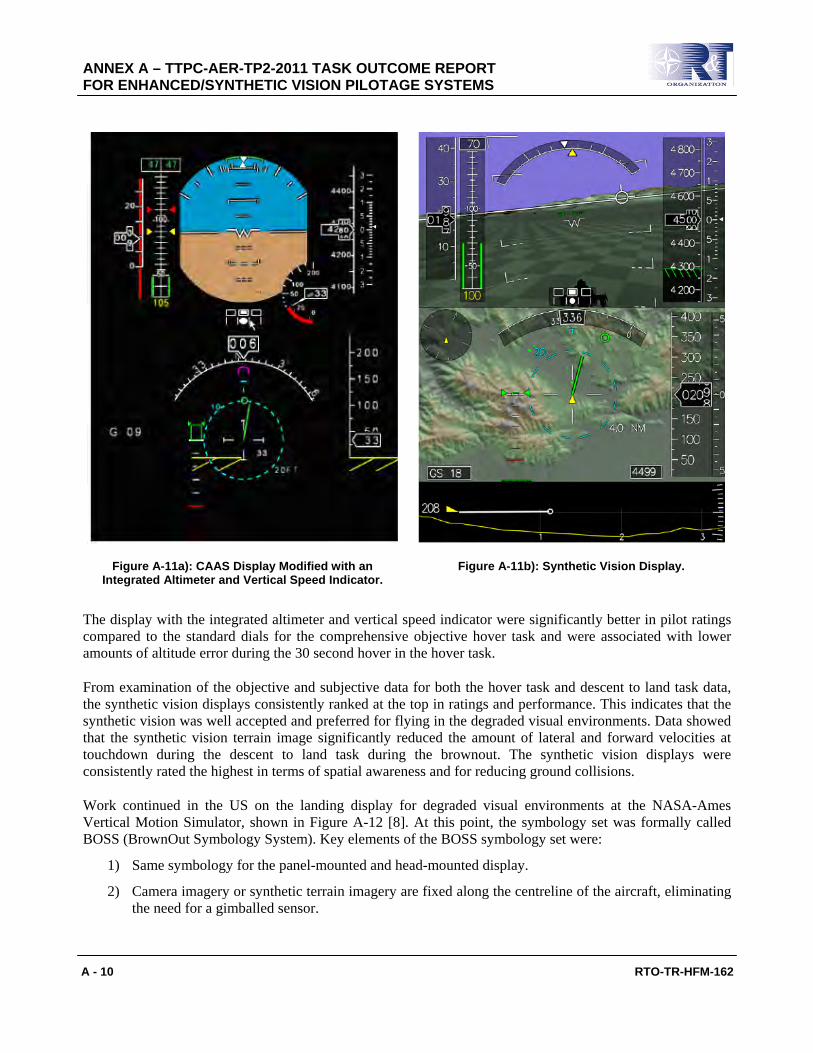
ANNEX A – TTPC-AER-TP2-2011 TASK OUTCOME REPORT FOR ENHANCED/SYNTHETIC VISION PILOTAGE SYSTEMS
A - 10 RTO-TR-HFM-162
Figure A-11a): CAAS Display Modified with an Integrated Altimeter and Vertical Speed Indicator.
Figure A-11b): Synthetic Vision Display.
The display with the integrated altimeter and vertical speed indicator were significantly better in pilot ratings compared to the standard dials for the comprehensive objective hover task and were associated with lower amounts of altitude error during the 30 second hover in the hover task.
From examination of the objective and subjective data for both the hover task and descent to land task data, the synthetic vision displays consistently ranked at the top in ratings and performance. This indicates that the synthetic vision was well accepted and preferred for flying in the degraded visual environments. Data showed that the synthetic vision terrain image significantly reduced the amount of lateral and forward velocities at touchdown during the descent to land task during the brownout. The synthetic vision displays were consistently rated the highest in terms of spatial awareness and for reducing ground collisions.
Work continued in the US on the landing display for degraded visual environments at the NASA-Ames Vertical Motion Simulator, shown in Figure A-12 [8]. At this point, the symbology set was formally called BOSS (BrownOut Symbology System). Key elements of the BOSS symbology set were:
1) Same symbology for the panel-mounted and head-mounted display.
2) Camera imagery or synthetic terrain imagery are fixed along the centreline of the aircraft, eliminating the need for a gimballed sensor.

ANNEX A – TTPC-AER-TP2-2011 TASK OUTCOME REPORT FOR ENHANCED/SYNTHETIC VISION PILOTAGE SYSTEMS
RTO-TR-HFM-162 A - 11
3) Symbology set is designed to overlay and enhance terrain imagery in the background (earth referenced flight path marker and horizon line).
4) Integrated altimeter and vertical speed indicator.
5) Horizontal speed guidance from cruise speeds to near hover.
Figure A-12: NASA-Ames Vertical Motion Simulator with Panel-Mounted Displays and NVG-HUD.
-500
111%
4544G
340320 040
000 020
593 B
2D Plan-View Speed and Ground Track Guidance
Combined Rising Ground Altimeter and Vertical Speed Tape
Typical “BOSS” NVG-HUD Display
Figure A-13: BOSS Display as Flown on the NASA-Ames Vertical Motion Simulator.

ANNEX A – TTPC-AER-TP2-2011 TASK OUTCOME REPORT FOR ENHANCED/SYNTHETIC VISION PILOTAGE SYSTEMS
A - 12 RTO-TR-HFM-162
Figure A-14 shows the main test matrix for the BOSS simulation on the NASA-Ames Vertical Motion Simulator. As shown in the figure, a baseline AVS-7 symbology set was flown, which is the current US standard NVG-HUD. Figure A-15 shows significantly worse vertical speed performance with the AVS-7 symbology set compared to all the variants of BOSS tested (each having the integrated altimeter and vertical speed indicator). Some of the results were believed to be due to the greater sensitivity that the BOSS vertical speed indicator had.
Test Matrix
Figure A-14: Test Matrix for NASA-Ames Simulation.
Vertical Speed at TouchdownAverage of 12 pilots x 3 landings +/- 1 std. dev.
0
100
200
300
400
500
600
#1 BOSSPMD 3D
#2 BOSSPMD 2D
#3 BOSSPMD N.G.
#4 AVS-7N.G.
#5 BOSSHUD 2D
#6 BOSSHUD N.G.
Display Condition (N.G. = No Guidance)
Vert
ical
Spe
ed [f
t/min
] Landing gear limit for a light Blackhawk < 16,825 lbs. on flat terrain
Landing gear limit for a heavy Blackhawk > 16,825 lbs. on flat terrain
For all conditions comparedagainst condition 4:
F(1,11) ≥ 19.34, p<0.01
Figure A-15: Vertical Speed at Touchdown, BOSS Study in the NASA-Ames Simulator.

ANNEX A – TTPC-AER-TP2-2011 TASK OUTCOME REPORT FOR ENHANCED/SYNTHETIC VISION PILOTAGE SYSTEMS
RTO-TR-HFM-162 A - 13
One comparison in the test matrix was BOSS symbology on the NVG-HUD vs. BOSS symbology on the Panel-Mounted Display. No significant differences were seen in pilot performance between display types; both could be used effectively. Another comparison in the test matrix was whether the BOSS system knew the 3-D, or 2-D coordinates of the landing point, or lacked the coordinates entirely. Figure A-16 shows that distance errors significantly increased between knowing the coordinates in 2-D, and not knowing the coordinates at all. However, errors increased by only 1.4 to 1.7 times. Therefore the BOSS symbology set was still used effectively even without knowledge of the landing coordinates. Distance errors were significantly worse for the AVS-7 set compared to all variants of the BOSS set. Also, there was no significant difference in landing position error or any other parameter between the use of 2-D and 3-D coordinates, meaning a simpler system could be used. For all display conditions, lateral speeds averaged between 0.5 and 1.5 knots at touchdown, with one standard deviation as high as 2.7 knots. Data showed that lateral speed at touchdown was higher than desired.
3D 2D None
BOSS Panel DisplayBOSS NVG-HUD
AVS-7 NVG-HUD0
20406080
100120140
Dis
tanc
e [ft
]
Speed and Position Guidance
Display Config.
Distance from Landing Site at TouchdownAverage of 12 pilots x 3 landings
Figure A-16: Distance from Landing Point, NASA-Ames Simulator.
In comparing pilot ranking between BOSS and AVS-7, all thirteen pilots chose a variant of the BOSS symbology (with speed and position guidance) as their first choice. None of pilots ranked the AVS-7 as first choice and ten of them listed it as their last choice.
In addition to the NASA-Ames simulation, the US Army AFDD and BAE Systems conducted a simulation of symbology over background terrain imagery [9]. The Valley View software (developed under the Monterey Technologies SBIR contract) morphed pre-stored terrain elevation data in accordance with simulated 94 GHz radar data. BOSS symbology was overlaid on top of the terrain imagery in one case (Figure A-17). In another case, the BAE LVL symbology was display on a head-mounted display (Figure A-18), and terrain-only imagery was presented on the panel-mounted display.

ANNEX A – TTPC-AER-TP2-2011 TASK OUTCOME REPORT FOR ENHANCED/SYNTHETIC VISION PILOTAGE SYSTEMS
A - 14 RTO-TR-HFM-162
Figure A-17: BAE Terrain Elevation Data Morphed with Simulated Radar Data.
Figure A-18: BAE LVL Symbology.
Results indicate that the BOSS display formats (both Dual PMD and Single PMD) were preferred by pilots and were also associated with higher levels of flight performance in comparison to the HMD symbology display. Results from the display rankings showed that pilots preferred having the radar as opposed to not having it as it added to situational awareness of obstacles and increased confidence in the rendered terrain being accurate.

ANNEX A – TTPC-AER-TP2-2011 TASK OUTCOME REPORT FOR ENHANCED/SYNTHETIC VISION PILOTAGE SYSTEMS
RTO-TR-HFM-162 A - 15
The US Army Applied Aviation Technology Directorate (AATD) initiated a program to develop a radar and associated pilot’s display for terrain following and landing in degraded visual environments. The radar and display system was called HALS. A novel 94 GHz radar built by Sierra Nevada Corp. was mounted on the nose of a UH-60, which was very similar to the Sandblaster radar. Radar data morphed the pre-stored terrain elevation database. BOSS symbology was superimposed on the terrain image. This system was flight tested in 2010 (no ref, Figure A-19). A re-packaged radar that is more streamline and the latest version of the BOSS symbology is expected to be flight tested in late 2011.
Figure A-19: HALS Enroute Page with BOSS Symbology.
Under this TTCP collaborative program, the National Research Council (NRC) Canada test flew two new versions of the US provided BOSS symbology set (Figure A-20). This flight test was named Loon [8]. Variations of displaying target speed, landing position, vertical speed, and radar altitude were implemented. Pilots from Canada, UK, and US flew the variations in the Bell 412 aircraft at the Ottawa airport. Pilot comments were incorporated into the next version of the BOSS display. Most importantly, pilots demonstrated for the first time that they could perform approaches to landing without outside visuals in a real helicopter. This test would not have been conducted without the TTCP agreement in place. NRC continues to fly the BOSS symbology set for demonstrations to visiting student test pilots and other demonstrations.

ANNEX A – TTPC-AER-TP2-2011 TASK OUTCOME REPORT FOR ENHANCED/SYNTHETIC VISION PILOTAGE SYSTEMS
A - 16 RTO-TR-HFM-162
Figure A-20a): National Research Council Canada Bell 412 Research Helicopter.
Figure A-20b): Pilot Flying Approach Using BOSS Display with Hood to Obscure the Out-the-Window View.
Separate from the Loon test, CAE Corporation developed the Augmented Visionics System in coordination with NRC Canada [10]. A Neptec LADAR was used to update a pre-stored terrain elevation database. The US designed BOSS symbology was then overlaid on top of the terrain and obstacle imagery (Figure A-21). This system was flight tested in 2010 at Yuma Proving Ground on the fly-by-wire Bell 412 operated by NRC Canada. Most of the terrain shown on the pilot’s display was from a pre-stored terrain elevation database. New obstacles, detected by the LADAR, were shown as added blocks on the terrain, of approx. the same size as the obstacles. The system worked as designed, in actual flight conditions, and using real sensors.
Figure A-21: CAE Corporation Augmented Visionics System (AVS) with BOSS Symbology Superimposed.

ANNEX A – TTPC-AER-TP2-2011 TASK OUTCOME REPORT FOR ENHANCED/SYNTHETIC VISION PILOTAGE SYSTEMS
RTO-TR-HFM-162 A - 17
US efforts to further develop BOSS and couple it to a LADAR were implemented in the 3D-LZ program. The H.N. Burns Engineering Corp. LADAR system would provide the background image of the terrain and obstacles, with BOSS symbology superimposed to enable the safe control of the aircraft. Simulations were conducted at the US Army AFDD and the US Air Force Research Lab (AFRL) in 2008-9 [11]. Modifications included matching the switching linear scale of the velocity vector and target landing point symbol to the switching linear scale of the plan view LADAR imagery. As shown in Figure A-22, lateral speed at touchdown was improved to be less than 0.5 knots on average and even out to one standard deviation, except when the landing point is relocated by the pilot during the approach. The number on the x-axis in Figure A-22 is the distance to the top of the screen on the finest scale. Pilots were asked not to move the landing point until this finest scale was active. As shown, moving the landing point during the approach had negative effects on lateral speed at touchdown. The landing point was not moved during an approach in the actual flight test, but was moved during hover manoeuvres.
Lateral Speed at TouchdownDirect Landing Maneuver
Average of 8 Pilots +/- 1 Std. Dev.
0.0
0.2
0.4
0.6
0.8
1.0
1.2
1.4
1.6
250 ft 500 ft 1000 ft
Min. Scale for Horizontal Situation Display
Late
ral S
peed
[kno
ts]
No Relocation of Landing PointPilot Relocated Landing Point
Desired
Adequate
Adequate
Outside Adequate
Figure A-22: Lateral Speed at Touchdown for BOSS Symbology (distance scale to top of screen shown on axis, speed scale was 1/10 the distance scale).
Check-out flights for the 3D-LZ system were conducted at Moffett Field with curtains installed on the windows. Finally, actual brown landings were conducted at the US Army Proving Ground near Yuma, Arizona in 2009 [12];[13]. Figure A-23 shows screen shots of four time-synchronized video streams, one before the brownout and one during the brownout. The LADAR had a dust rejection filter which had nearly 100% accuracy in rejecting dust returns. The LADAR was never turned off during the entire approach, landing, and take-off sequence and the 3-D database had imperceptible small amounts of points due to dust. As can be seen in Figure A-23, the pilot’s vertical and horizontal situation displays looked nearly the same, before and after the dust; pilots were able to see obstacles during the entire manoeuvre.

ANNEX A – TTPC-AER-TP2-2011 TASK OUTCOME REPORT FOR ENHANCED/SYNTHETIC VISION PILOTAGE SYSTEMS
A - 18 RTO-TR-HFM-162
Figure A-23: 3D-LZ Display Screen Captures during Actual Brownout Landings in an EH-60L Aircraft.
Pilot data showed that vertical speed and longitudinal speed were within desired on average. Lateral speed was adequate on average, as opposed to desired (1/2 knot < lat. Speed < 1 knot). The flight control system was a standard rate-command UH-60L mechanical system with some stability augmentation, and heading hold. Improved handling qualities through better flight controls are expected to improve the lateral speed parameter. Of particular note during the flight test were two comments:
1) Pilots wanted to keep their eyes on a single display, with forward-view terrain and obstacle imagery.
2) Pilot workload was so high, pilots commented that they no extra capacity to look for obstacles in the terrain image near the landing point.
Pilots focused exclusively on the symbology near touchdown as that was required for safe control of the aircraft. Also, pilots were able to verify the landing site was clear of obstacles earlier in the approach.
Figure A-24 and Figure A-25 show the vertical and lateral speed parameters for each landing. The “switched display” is a single display that switches between a Vertical Situation Display (VSD) and a Horizontal Situation Display (HSD) at 40 knots. The “dual display” is two displays, one being a VSD and the other being an HSD the entire time. The single display condition was a baseline single display (combination of VSD and HSD), with infrared imagery in the background.

ANNEX A – TTPC-AER-TP2-2011 TASK OUTCOME REPORT FOR ENHANCED/SYNTHETIC VISION PILOTAGE SYSTEMS
RTO-TR-HFM-162 A - 19
Vertical Speed(maximum vertical speed down between
+2 ft and -1 ft radar altitude)
100.0 97.6 Ave = 95.2
0
50
100
150
200
250
300
350
Vert
ical
Spe
ed D
own
[ft/m
in]
Desired
Adequate
Outside Adequate
Switched(10 pts)
Dual(11 pts)
Single(3 pts)
Lateral Speed(maximum lateral speed between
+2 ft and -1 ft radar altitude)
0.65
0.75
Ave = 0.57
0
0.25
0.5
0.75
1
1.25
1.5
Late
ral S
peed
[kno
ts]
Switched
Desired
Adequate
OutsideAdequate
Dual Single
Figure A-24: Vertical Speed Recorded During All Brownout Landings.
Figure A-25: Lateral Speed Recorded During All Brownout Landings.
Handing Qualities RatingAverage of 4 Pilots
(+/- 1 Std. Error of the Mean, n=4)
4.81 4.29
5.50
1
2
3
4
5
6
7
8
9
10
Switched Dual Single
Rat
ing
(1-1
0)Be
tter
Leve
l 1Le
vel 2
Leve
l 3
Most Preferred DisplaysHistogram of the 4 evaluation pilots
0
1
2
3
Switched Dual Single
Cou
nt
Figure A-26: HQR Rating for 3D-LZ. Figure A-27: Display Preference for 3D-LZ.

ANNEX A – TTPC-AER-TP2-2011 TASK OUTCOME REPORT FOR ENHANCED/SYNTHETIC VISION PILOTAGE SYSTEMS
A - 20 RTO-TR-HFM-162
Two more simulations were conducted in the US at the US Army AFDD with eight pilots each. The first was to improve the guidance algorithms to make them more aggressive [14] to reduce the time in a brownout. The second simulation was to test a new logarithmic scale for current velocity, target velocity, and hover/ landing position [15]. Pilots from the US, Canada, and Australia participated in the second simulation. The logarithmic scale allows the entire approach from 80 knots to be performed without a scale change on any parameter, and represents a major step forward in display design. The most recent version of BOSS symbology is shown in Figure A-28, which represents several years of development as outlined in this report.
Figure A-28a): Final Configuration BOSS Enroute Page.
Figure A-28b): Final Configuration BOSS Hover-Approach-Take-Off Page.
The Australian Army has been operating the Aviator Night Vision Imaging System (ANVIS) Head-Up Display (HUD) with its Night Vision Goggles (NVGs) for a number of years. To assist the Royal Australian Navy as it heads towards NVG operations, AS conducted a simulation trial to evaluate the ANVIS HUD symbology for shipboard landings.

ANNEX A – TTPC-AER-TP2-2011 TASK OUTCOME REPORT FOR ENHANCED/SYNTHETIC VISION PILOTAGE SYSTEMS
RTO-TR-HFM-162 A - 21
Figure A-29: ANVIS HUD Symbology Set.
Trials were held in DSTO’s fixed-base simulator. The objectives of the trial were to assess the standard ANVIS-HUD for maritime operations and compare it with the Seahawk Head-Down Display (HDD). Three tasks were selected to evaluate the symbology set: launch and recovery of a Seahawk helicopter to a FFG frigate, along with a three-leg over land task flying over a diverse terrain database. Two highly experienced Navy pilots, both with in excess of 3000 rotary wing hours and over 1000 deck landings, participated in the trial. The NVG experience was 25 hours for one pilot and 200 hours for the other pilot. Neither pilot had any symbology experience however an experienced Army QFI presented a course on the symbology set prior to the trial and was available for discussions during the trial.
Figure A-30: Seahawk Operating to Frigate at Night.

ANNEX A – TTPC-AER-TP2-2011 TASK OUTCOME REPORT FOR ENHANCED/SYNTHETIC VISION PILOTAGE SYSTEMS
A - 22 RTO-TR-HFM-162
Figure A-31: AS Simulation of Seahawk Operating to FFG Frigate with NVGs and HUD.
A qualitative evaluation via questionnaires took place and included the following parameters: Clutter, Display effectiveness, Individual symbology effectiveness, Attention capture and Display usage for the HUD, and Display usage and Display effectiveness for the HDD. A quantitative evaluation also occurred with over 100 variables being logged. Ship-based parameters during recovery included glideslope maintenance and closure rate, and during launch included helicopter pitch variation and launch time.
Although the sample size was small, qualitative results indicated that for certain tasks the HUD provided better flight path assessment, better control, less errors, and improved flight safety due to more head out time. Quantitative results indicated that the HUD led to reduced launch time and less pitch correction required on launch compared to the HDD.
Very effective
Not at all effective
Very effective
Not at all effective
Figure A-32: HUD Effectiveness Ratings – Ship Recovery.

ANNEX A – TTPC-AER-TP2-2011 TASK OUTCOME REPORT FOR ENHANCED/SYNTHETIC VISION PILOTAGE SYSTEMS
RTO-TR-HFM-162 A - 23
As a result of the simulation trial, some modifications to the ANVIS-HUD were proposed for further testing. Results were documented in [16].
A.3 CONCLUSIONS
A complete system to aid the pilot in brownout hover, landing and take-off should include symbology (for aircraft state), sensor information (for obstacles and terrain slope), and advanced flight controls (for improved handling qualities). A minimal system would have symbology only, to improve the pilot’s ability to control the aircraft and avoid spatial disorientation. Symbology, by itself, does not improve the pilot’s situational awareness of the landing zone slope and obstacles, but through procedure this can be managed to some extent. Simulation tools were used effectively prior to flight test by all four participating Nations. Canada, US and UK have demonstrated simulated brownout hover and landings in real aircraft, using symbology solutions overlaid on top of terrain imagery. In addition the US has demonstrated real brownout landings using symbology and LADAR imagery. There is full expectation that these systems will reduce brownout accidents if installed into the fleet.
A.4 RECOMMENDATIONS
Two different approaches to the symbology were developed. The UK developed the Low Visibility Landing (LVL) symbology. The US developed the BrownOut Symbology System (BOSS). A comparison of these two approaches is the next logical step, and is proposed under SA 2C.7 (DVEST).
A.5 REFERENCES
[1] Clarkson, G., Moore, D. and Thorndycraft, D. (2007). The Helicopter Day/Night, All-Environment Challenge, RUSI Defense Systems, October 2007.
[2] Szoboszlay, Z., Hardy, G. and Welsh, T. (2004). Improving the Flight Path Marker Symbol on Rotorcraft Synthetic Vision Displays, American Helicopter Society 60th Annual Forum.
[3] Szoboszlay, Z. and Moralez, E., III (2006). Altitude and Ground Track Predicting Flight Path Marker Symbol for Rotorcraft Synthetic Vision Displays, American Helicopter Society 62nd Annual Forum.
[4] Rozovski, D. (2007). Testing of New Terrain Following Guidance Algorithms for Rotorcraft Displays, American Helicopter Society 63rd Annual Forum.
[5] Tiana, C., Hennessy, R., Alter, K. and Jennings, C. (2007). Fused Enhanced and Synthetic Vision System (E-SVS), SPIE Orlando FL, USA.
[6] Goff, C., Ball, A., Yapp, J., Pearce, S. and Crawford, F. (2010). Developing a 3-D Landing Symbology Solution for Brownout, American Helicopter Society 66th Annual Forum.
[7] Keller, M., Neiswander, G. and Schnell, T. (2008). Rotorcraft Hover Symbology Study for Operation in Poor Visibility Conditions, The University of Iowa Operator Performance Laboratory, NASA Grant Award NNA04CL16G and NNA06CB40G.

ANNEX A – TTPC-AER-TP2-2011 TASK OUTCOME REPORT FOR ENHANCED/SYNTHETIC VISION PILOTAGE SYSTEMS
A - 24 RTO-TR-HFM-162
[8] Szoboszlay, Z., Albery, W., Turpin, T. and Neiswander, G. (2008). Brown-Out Symbology Simulation (BOSS) on the NASA Ames Vertical Motion Simulator, American Helicopter Society 64th Annual Forum.
[9] Turpin, T., Sykora, B., Neiswander, G. and Szoboszlay, Z. (2010). Brownout Landing Aid System Technology (BLAST) American Helicopter Society 66th Annual Forum.
[10] Link, N., Brown, D., Trickey, E. and Jennings, S. (2010). Development of an Augmented Visionics System to Aid Flight Operations in Degraded Visual Environments American Helicopter Society 66th Annual Forum.
[11] Szoboszlay, Z., Turpin, T., McKinley, R.A. (2009). Symbology for Brown-Out Landings: The First Simulation for the 3D-LZ Program, American Helicopter Society 65th Annual Forum, Grapevine, Texas, May 27-29, 2009.
[12] Szoboszlay, Z., McKinley R.A., Braddom, S., Harrington, W., Burns, H.N.B. and Savage, J. (2010). Landing an H-60 Helicopter in Brownout Conditions Using 3D-LZ Displays, American Helicopter Society 66th Annual Forum.
[13] Harrington, W., Braddom, S., Savage, J., Szoboszlay, Z., McKinley, R.A. and Burns H.N.B. (2010). 3D-LZ Brownout Landing Solution, American Helicopter Society 66th Annual Forum.
[14] Neiswander, G. (2011). Improving Deceleration Guidance for Rotorcraft Brownout Landing American Helicopter Society 67th Annual Forum.
[15] Szoboszlay, Z. (2011). BOSS2: Single Primary Flight Display Page from Cruise to Hover/Landing in Brownout, European Rotorcraft Forum.
[16] Blanchonette, P., Fagan, T., MacPherson, B., Manso, S. and Tartaggia, S. (2007). An Evaluation of ANVIS-HUD for Maritime Helicopter Operations: Qualitative Measures, DSTO-CR-2007-0240.
A.6 ANNEX A – PERSONNEL AND ORGANIZATIONS INVOLVED
Zoltan Szoboszlay +1-650-604-5164, [email protected]
Chris Goff, +44 23 9253 2615, [email protected].
Peter Holst, +1-613-996-3526, [email protected].
Jeremy Blackwell, +61-3-9626-7285, [email protected].
Further information can be obtained by contacting any of the national POCs.

RTO-TR-HFM-162 B - 1
Annex B – IN-FLIGHT STUDIES WITH TACTILE DISPLAYS
B.1 FLIGHT TESTS USING TSAS
The US Navy developed a Tactile Situation Awareness System (TSAS) consisting of a vest with a 3-D matrix of tactors, providing the pilot with attitude information of the aircraft [1];[2].
Under a formal ASIC (Air and Space Interoperability Council, formerly ASCC) Test Project Agreement (TPA) an in-flight study was conducted in Uplands airfield, Ottawa, Ontario between July-August 2003, to evaluate the effect of TSAS in maintaining high hover and in simulated ship-borne landing in a Bell 205 helicopter. The collaborative study is a joint effort between DRDC Toronto, the Naval Aerospace Medical Research Laboratory (NAMRL) of the US Navy, and the Flight Research Laboratory (FRL) of the National Research Council (NRC) of Canada. The methodology and significant findings are summarised below.
It has been proposed that providing position information to pilots with TSAS may significantly improve performance in situations where precise hovering over a spot is required, i.e., search and rescue, troop insertion. A series of studies was conducted to investigate the usefulness of the TSAS in maintaining High Hover (HH, 150 feet above ground) and a simulated ship-borne landing – Maritime Hover (MH). Eleven experienced pilots from Canada and the United States participated in the study. The pilots’ background experience includes tactical, search and rescue, special operations and test pilots. The TSAS flight prototype employed a 24 pneumatic tactor array (8 columns and 3 rows around the torso) and 4 electromagnetic tactors (2 on the shoulder and 2 on the ventral thigh area). The system receives data from current aircraft systems, and relays horizontal position data via the pneumatic tactors and vertical position data via the electro-magnetic shoulder and thigh tactors. Night vision goggles fitted with a light filter were used to create a Degraded Visual Environment (DVE) as compared to Good Visual Environment (GVE) without night vision goggles. Longitudinal, lateral and vertical deviations from the designated position with and without TSAS were measured. The China Lake Situational Awareness scale and the Modified Cooper Harper Workload Rating scale were solicited in-flight. Subjective performance self-evaluation, workload assessment (Subjective Word Dominance), and perceptual cueing responses (modified from visual cue rating) were solicited from the subject post flight. From the high hover trials, flight performance data suggested that in a degraded visual environment, TSAS lessened horizontal and height deviations. Analysis of subjective responses revealed that TSAS appears to significantly improve Situation Awareness (SA) but did not significantly decrease workload in both manoeuvres. Subjective performance and perceptual cueing indicated general improvement with TSAS.
During simulated ship-borne landing trials, the task required the pilot to track a vertically moving target that simulates ship-borne movements, in two separate sea states; Sea State 3 (SS3) and Sea State 5 (SS5). Once established in a stable hover, the pilots tracked a moving target in the vertical direction by adjusting the height of the aircraft, while attempting to maintain the same position over the ground. TSAS provided horizontal displacement information via the tactors. Displacements in the horizontal plane from the original hover position, and subjective measures of SA and workload were recorded in-flight. Post-flight measures included workload assessment, perceptual cue ratings and subjective self-assessment. Our data indicated that TSAS was effective in reducing the average longitudinal and lateral deviations in GVE and DVE during sea states 3 and 5. Our results also revealed that TSAS improved situation awareness in DVE, with a significant result recorded for SS5 (p = 0.012). Perceptual Cue Rating scale results revealed that in SS5 and DVE, the horizontal translational rate cue was rated significantly better with TSAS (p = 0.025). Workload assessment ratings showed that TSAS appeared to play a role in decreasing workload. We conclude that TSAS

ANNEX B – IN-FLIGHT STUDIES WITH TACTILE DISPLAYS
B - 2 RTO-TR-HFM-162
is an effective tool for improving pilot performance and SA and has the potential to increase safety during maritime helicopter operations. The increase in performance due to TSAS appeared to be especially beneficial during poor visual conditions and high sea states without the penalty of increased workload. Subjective self-evaluation by the pilots showed a correlation to actual performance, indicating improved confidence in their ability to perform the task. Details of this study has been reported by [3].
B.2 TSAS LITE
Recently, Curry, Estrada, Webb and Erickson (2008) [4] demonstrated the efficacy of tactile stimulation as a drift cue in a flight environment. Rather than the full TSAS version, consisting of an extensive vest of tactors, a belt consisting of 8 electromagnetic tactors placed every 45 degrees was evaluated by U.S. Army UH-60 rated pilots in a UH-60A aircraft. The prototype Tactile Situation Awareness System; TSAS-Lite tactile display system uses the sense of touch to provide drift to aircraft operators. The TSAS-Lite system accepted data from the aircraft via the ASN-128D-Doppler Global Navigation System to obtain the aircraft position, velocity, and vector. Drift information was then displayed via the electromagnetic tactors located on the belt (Figure B-1).
Figure B-1: TSAS-Lite Belt.
The system consisted of a Commercial-Off-The-Shelf (COTS) PC-104 Central Processing Unit (CPU) (Real-Time Devices CMC6686GX233HR-128), a custom 8-channel tactor driver board and eight electromechanical tactors (Engineering Acoustics, Inc.). The tactors provided a vibrating stimulus at 90 Hertz (Hz) +/- 20% with three rates of firing depending on pre-set ground speeds (0 – 15 knots (kts): 200 ms, 15 – 30 kts: 600 ms, 30 – 45 kts:1000 ms). The sensation was similar in intensity to a standard electric toothbrush. The prototype belt was made of flexible neoprene with Velcro fastenings and was worn sufficiently tight around the belt area to provide tactor contact while still being comfortable. The CPU and tactor drive electronics were housed in a water resistant sealed housing, with data, tactor and operator switch interfaces. For operational use, the system could interface to existing military GPS units or COTS sensors. The system required only digital data from position or direction sensors.
The pilots received an hour training flight in a simulator to demonstrate the use of the tactile belt. The experimental flights consisted of landings, take-off and hover maneuvers while utilizing frosted goggles to limit the pilots’ vision to the instrument panel. During take-off, hover flight, and approach to landing,

ANNEX B – IN-FLIGHT STUDIES WITH TACTILE DISPLAYS
RTO-TR-HFM-162 B - 3
location of the tactor on belt-line was used to indicate direction of helicopter motion, and tactor activation pulse pattern was used to indicate the velocity of helicopter drift. The belt was tested in rested and sleep-deprived conditions. The objective flight performance data revealed significantly less drift errors during the hover while wearing the tactile belt. Figure B-2 contains an example of hover performance with and without the TSAS-Lite belt. In addition, pilots reported the TSAS-Lite belt significantly improved their perception of drift, increased their SA, and reduced their mental stress. The study demonstrated that a limited tactile display can provide increased mission effectiveness and safety in the critical areas of low speed maneuver near the ground in degraded visual conditions.
Hover Performance – Belt Active Hover Performance- Belt Inactive
60.0040.0020.000.00-20.00-40.00-60.00
Lateral (ft)
100.00
50.00
0.00
-50.00
-100.00
Long
itudi
nal (
ft)
60.0040.0020.000.00-20.00-40.00-60.00
Lateral (ft)
100.00
50.00
0.00
-50.00
-100.00
Long
itudi
nal (
ft)
Figure B-2: Ground Track During Hover Performance. Note: These graphs illustrate the performance of the same participant under sleep-deprived conditions [4].
B.3 FLIGHT TEST WITH TNO TACTILE TORSO DISPLAY
The Dutch research organization TNO built up extensive experience with a tactile torso display consisting of a vest with 64 tactors, arranged in 12 columns and five horizontal rings. The tactors used so far are custom-built, based on DC pager motors (i.e., a rotating eccentric mass) which are housed in a PVC block with a contact area of 1.5 by 2.0 cm. Typically, these tactors vibrate at 150 Hz.
TNO performed various studies in flight simulators as well as in an actual helicopter showing that pilots effectively use tactile feedback for control tasks (altitude, hover), navigation tasks (waypoint navigation), and recovery from spatial disorientation [5];[6];[7].
In a recent flight test with a Eurocopter AS 532U2 Cougar MkII an adapted version of the TNO tactile torso display (Figure B-3 and Figure B-4) was evaluated in supporting helicopter pilots during Brownout landings [8]. Based on a series of simulator trials with RNLAF rated test pilots ground speed and height-above-terrain were identified as the essential flight parameters for the operational procedure used in Brownout landings. The configuration of the tactile torso display was modified so as to present these flight parameters with higher spatial resolution. The direction of horizontal helicopter motion (i.e., the direction of the groundspeed vector) was presented on a horizontal array of 31 tactors, covering the frontal 180 deg. This yielded inter-tactor intervals of 6 deg. Tactors were activated in 200 ms on / 200 ms off-bursts. In one experimental condition the magnitude of groundspeed (i.e., the length of the ground speed vector) was indicated by increasing the on/off

ANNEX B – IN-FLIGHT STUDIES WITH TACTILE DISPLAYS
B - 4 RTO-TR-HFM-162
rhythm proportionally to groundspeed. Height-above-terrain was indicated on a vertical strip of 21 tactors on the pilot’s back. The lowest tactor indicated ground level by a continuous 200 ms on/off pattern. The actual altitude was presented by one of the other tactors, activated in anti-phase with the ground reference tactor. This caused the sensation during the descent that a vibration was ‘walking’ down on the back towards to lowest tactor representing ground level. If altitude was below 5 ft, current altitude and ground level were presented by the same tactor, resulting in a continuous activation of the lower tactor. The other inter-tactor intervals were 7 ft.
Figure B-3: TNO Tactile Torso Display (Left) and Inside View of a Tactor (Right).
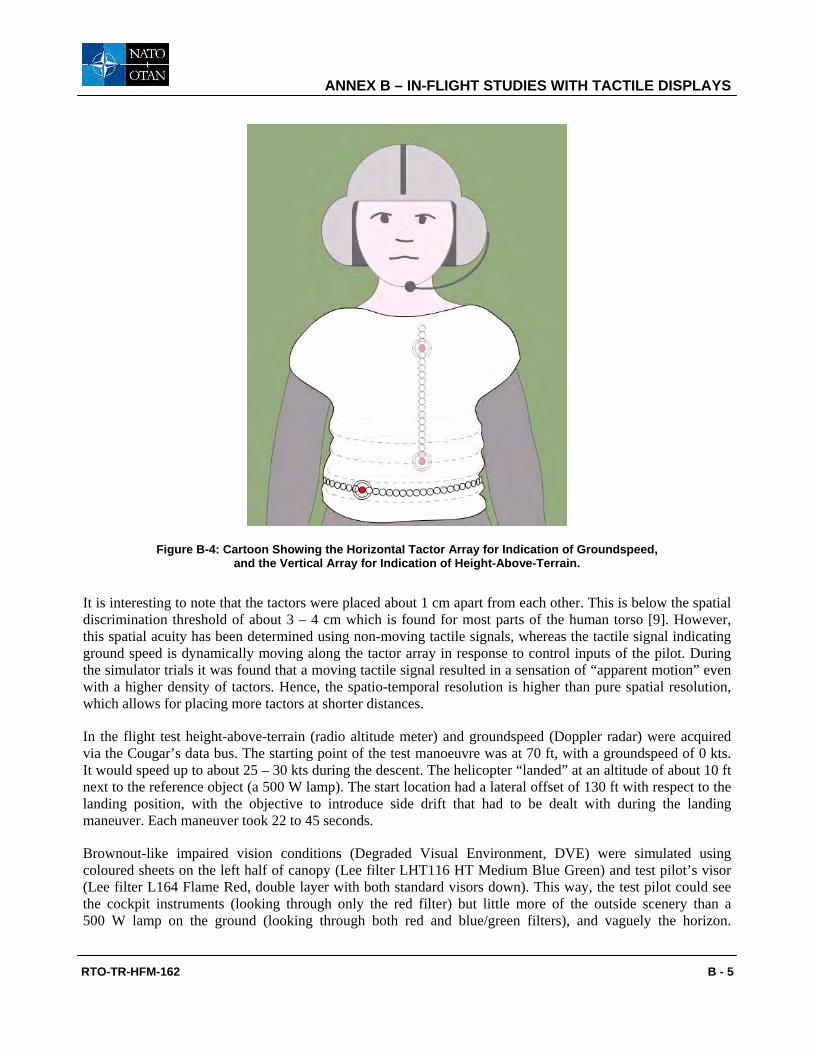
ANNEX B – IN-FLIGHT STUDIES WITH TACTILE DISPLAYS
RTO-TR-HFM-162 B - 5
Figure B-4: Cartoon Showing the Horizontal Tactor Array for Indication of Groundspeed, and the Vertical Array for Indication of Height-Above-Terrain.
It is interesting to note that the tactors were placed about 1 cm apart from each other. This is below the spatial discrimination threshold of about 3 – 4 cm which is found for most parts of the human torso [9]. However, this spatial acuity has been determined using non-moving tactile signals, whereas the tactile signal indicating ground speed is dynamically moving along the tactor array in response to control inputs of the pilot. During the simulator trials it was found that a moving tactile signal resulted in a sensation of “apparent motion” even with a higher density of tactors. Hence, the spatio-temporal resolution is higher than pure spatial resolution, which allows for placing more tactors at shorter distances.
In the flight test height-above-terrain (radio altitude meter) and groundspeed (Doppler radar) were acquired via the Cougar’s data bus. The starting point of the test manoeuvre was at 70 ft, with a groundspeed of 0 kts. It would speed up to about 25 – 30 kts during the descent. The helicopter “landed” at an altitude of about 10 ft next to the reference object (a 500 W lamp). The start location had a lateral offset of 130 ft with respect to the landing position, with the objective to introduce side drift that had to be dealt with during the landing maneuver. Each maneuver took 22 to 45 seconds.
Brownout-like impaired vision conditions (Degraded Visual Environment, DVE) were simulated using coloured sheets on the left half of canopy (Lee filter LHT116 HT Medium Blue Green) and test pilot’s visor (Lee filter L164 Flame Red, double layer with both standard visors down). This way, the test pilot could see the cockpit instruments (looking through only the red filter) but little more of the outside scenery than a 500 W lamp on the ground (looking through both red and blue/green filters), and vaguely the horizon.

ANNEX B – IN-FLIGHT STUDIES WITH TACTILE DISPLAYS
B - 6 RTO-TR-HFM-162
The safety pilot’s view was only slightly restricted by the blue/green filter on the left half of the canopy. In control conditions in Good Visual Environment (GVE) condition, the pilot put up his visor, thereby having the same clear view as the safety pilot on the outside scenery.
All trials were performed by a Cougar test pilot. In total we tested seven conditions: GVE without tactile information; DVE without tactile information, and DVE with five different combinations of tactile information (bearing, height-above-terrain, bearing plus height-above-terrain, bearing plus speed, bearing plus speed plus height-above-terrain). Each condition was tested three times, and the total test flight lasted about 90 minutes. The recorded flight parameters showed that in the GVE condition, the maneuver was performed in about 23 s with an average groundspeed of 17 kts. Angular deviation averaged over the entire run amounted to one deg. In the DVE condition without tactile support average speed amounted to 11 kts, resulting in a mean duration of 36 s. Angular deviation was 13 deg. In all five DVE conditions with tactile support, performance improved compared to the DVE without tactile support: average speed varied closely around 14 kts, so that the maneuver was performed in substantially shorter time. Angular deviation remained below 3 deg. See references showing time histories of height-above terrain, forward and lateral speed for three conditions; Bearing and Altitude (i.e., tactile information on direction and height), Clear Vision (i.e., GVE), and no tactile support (i.e., DVE). See Figure B-5.

ANNEX B – IN-FLIGHT STUDIES WITH TACTILE DISPLAYS
RTO-TR-HFM-162 B - 7
Figure B-5: Recorded Height-Above Terrain (Upper Plot), Forward Speed (Middle), and Lateral Speed (Bottom) Recorded During the Last Landing Maneuver in Three Conditions (Bearing and Altitude
Information Presented on Tactile Display, Clear Vision, and No Tactile Support).
The pilot commented afterwards that the tactile information on height-above-terrain and bearing was very useful. This was reflected in the Handling Qualities Rating (HQR) data (Figure B-6. In the GVE condition the HQR was 3, indicating that the pilot could achieve the desired performance. In the DVE trials without tactile support the HQR was 7 on average (inadequate performance, pilot compensation needed), whereas in the

ANNEX B – IN-FLIGHT STUDIES WITH TACTILE DISPLAYS
B - 8 RTO-TR-HFM-162
DVE trials with tactile support the HQR amounted to 5 which means that adequate performance levels were met, although requiring some pilot effort. According to the pilot, the tactile coding of the magnitude of the groundspeed vector (i.e., where tactile rhythm was proportional to speed) required too much mental effort to interpret. Indication of the direction of helicopter drift was already sufficient.
Figure B-6: Handling Qualities Rating Scale.
B.4 CONCLUDING REMARKS
The described flight tests show that tactile displays support manoeuvring helicopter DVE landings. The improved performance (less drift, higher landing speeds) show that tactile information increases mission effectiveness. In particular the finding that with tactile support the landing manoeuvre was performed at higher speed, and thus in less time, implies that the pilot has better chance to stay ahead of the dust cloud.
Interestingly, the studies performed by USAARL and TNO used different tactile configurations, showing that the design of the tactile display depends on the airframe, flight task, and landing procedure.

ANNEX B – IN-FLIGHT STUDIES WITH TACTILE DISPLAYS
RTO-TR-HFM-162 B - 9
B.4.1 Open Issues Despite the promising results of these studies, it should be noted that the tactile technology has not yet been certified for operational use. The tactile displays used should be considered prototypes. Additional research is needed to determine the optimal configuration for a certain landing procedure. Several other questions, both concerning hardware and the use, should also be answered before applying tactile technology in a cockpit. The most important questions concern:
• How well do pilots perceive tactile cues under heat stress?
• Perception under helicopter vibrations (whole body vibration).
• Will tactile cues still be addressed to while under severe workload or stress? It is known that auditory cues may be neglected under stressful conditions. We do not know yet whether this may also be the case with tactile cues.
• How to connect the tactile display to the helicopter power supply and data bus? Or should the tactile display be self-supporting?
• How can we integrate tactors in (existing) flight suit or in pilot seat?
• The integration of information regarding tactile display with other dust penetrating technologies requires investigation.
B.5 REFERENCES
[1] Raj, A.K., Suri, N., Braithwaite, M.G. and Rupert, A.H. (1998). The tactile situation awareness system in rotary wing aircraft: Flight test results. In: Proceedings of the RTA/HFM Symposium on Current Aeromedical Issues in Rotary Wing Operations, pp. 16-1 – 16.7. Neuilly-sur-Seine, France: RTO NATO.
[2] Raj, A.K., Kass, S.J. and Perry, J.F. (2000). Vibrotactile displays for improving spatial awareness. In: Proceedings of the Human Factors and Ergonomics Society Annual Meeting, pp. 181-184. Santa Monica, CA, USA: The Human Factors and Ergonomics Society.
[3] Schultz, K., McGrath, B., Cheung, B., Craig, G., Jennings, S. and Rupert, A. (2009). In flight evaluation of tactile situation awareness system during high hover and simulated shipboard landing. In: Proceeding of American Institute of Aeronautics and Astronautics conference on Guidance, Navigation and Control, Chicago, IL, USA. August 2009.
[4] Curry, I.P., Estrada, A., Webb, C.M. and Erickson, B.S. (2008). Efficacy of tactile cues from a limited belt-area system in orienting well-rested and fatigued pilots in a complex flight environment (USAARL Report No. 2008-12). Fort Rucker, AL, USA: Unites States Army Aeromedical Research Laboratory.
[5] Van Erp, J.B.F., Veltman, J.A. and Van Veen, H.A.H.C. (2003). A tactile cockpit instrument to support altitude control. Proceedings of the human factors and ergonomics society 47th annual meeting 2003. pp. 114-118.
[6] Van Erp, J.B.F., Veltman, J.A., Van Veen, H.A.H.C. and Oving, A.B. (2002). Tactile Torso Display as Countermeasure to Reduce Night Vision Goggle Induced Drift. NATO RTO HFM Panel Symposium Spatial disorientation in military vehicles: causes, consequences and cures, La Coruna, Spain, 15-19 April 2002.

ANNEX B – IN-FLIGHT STUDIES WITH TACTILE DISPLAYS
B - 10 RTO-TR-HFM-162
[7] Van Erp, J.B.F., Groen, E.L., Bos, J.E. and Van Veen, H.A.H.C. (2006). A tactile cockpit instrument supports the control of self-motion during spatial disorientation. Human Factors 48 (2); 219-228.
[8] Jansen, C., Wennemers, A., Vos, W. and Groen, E.L. (2008). FlyTact: A Tactile Display Improves a Helicopter Pilot’s Landing Performance in Degraded Visual Environments. Lecture Notes in Computer Science 5024, pp. 867-875.
[9] Van Erp, J.B.F. (2005). Vibrotactile spatial acuity on the torso: effects of location and timing parameters. Proceedings of World Haptics, pp. 80-85. Los Alamitos, CA, USA: IEEE Computer Society.

RTO-TR-HFM-162 C - 1
Annex C – COMBINATION OF VISUAL DISPLAY SYSTEM WITH SENSOR TECHNOLOGIES
C.1 3D-LZ LADAR SYSTEM
In response to a request from the Air Force Special Operations Commander in developing and fielding a solution (November 2005), the Air Force Research Laboratory (AFRL) began a program to develop a high-performance imaging LADAR (Laser Radar) system capable of rendering high-resolution images of the landing site prior to brownout landings. This program was entitled “3D-LZ”. AFRL selected the H.N. Burns Engineering Corporation to develop the first 3D-LZ prototype based on their Eye-safe Burns Engineering Active Infra-Red (EBAIR) sensor currently in use for commercial precision surveying applications. The LADAR sensor package weighed 100 lbs (not including the aircraft mount) and included a self-contained Applanix POS AV 510 inertial navigation system with a Honeywell LN200 gyro to geo-reference the laser returns (Figure C-1). A GPS/GLONASS receiver and inertial processor were included in the LADAR Graphics Generator located in the aircraft cabin. The GPS receiver was connected to an antenna mounted to the upper surface of the aircraft tail (outside of the main rotor disc). The LADAR was set for a maximum range of 2,000 ft. The sensor had a 60 degree horizontal field of view and was vertically gimballed to allow for a variable vertical field of view of up to 120 degrees. For brownout landing testing, the vertical field-of-view was set from the aircraft waterline to 30 degrees below the aircraft waterline, while for external load operations the field-of-view was set from 5 degrees above to 55 degrees below the waterline. With a 30 degree vertical field-of-view, the LADAR required approximately 3.3 seconds to complete a full scan. The system used an H. N. Burns Engineering Corporation proprietary technique for determining whether LADAR returns were hard-target returns or returns from blowing sand and then passed only hard-target return information into the dynamic navigation database. The dynamic database maintained two million data points and purged older data only when required to make room for newer data. Therefore, in heavy dust conditions where almost no hard-target LADAR data was being added to the database, the database retained the LADAR information gathered prior to entering the dust. Due to the dust rejection algorithm, there was no need to turn off the LADAR to prevent contamination of the database by dust returns. The LADAR continued to sample throughout all segments of the flight to include approach, landing and take-off. Additional technical detail on the 3D-LZ Prototype I LADAR is provided in an International Society for Optical Engineering paper.
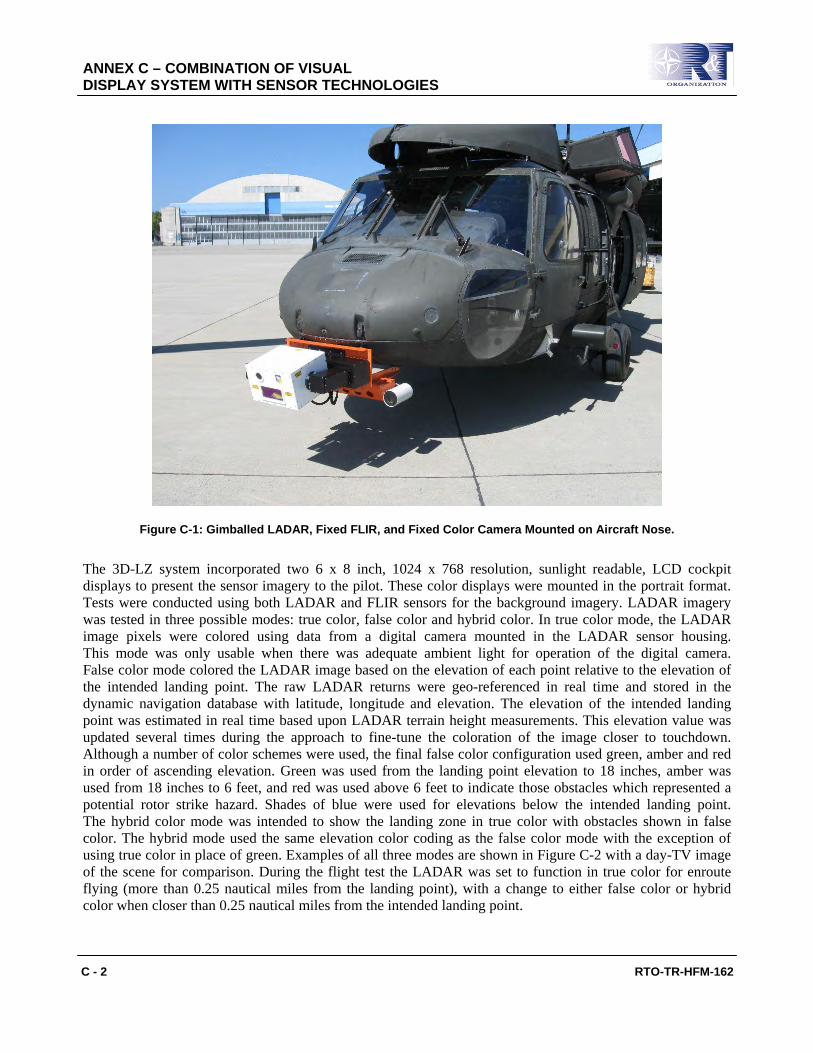
ANNEX C – COMBINATION OF VISUAL DISPLAY SYSTEM WITH SENSOR TECHNOLOGIES
C - 2 RTO-TR-HFM-162
Figure C-1: Gimballed LADAR, Fixed FLIR, and Fixed Color Camera Mounted on Aircraft Nose.
The 3D-LZ system incorporated two 6 x 8 inch, 1024 x 768 resolution, sunlight readable, LCD cockpit displays to present the sensor imagery to the pilot. These color displays were mounted in the portrait format. Tests were conducted using both LADAR and FLIR sensors for the background imagery. LADAR imagery was tested in three possible modes: true color, false color and hybrid color. In true color mode, the LADAR image pixels were colored using data from a digital camera mounted in the LADAR sensor housing. This mode was only usable when there was adequate ambient light for operation of the digital camera. False color mode colored the LADAR image based on the elevation of each point relative to the elevation of the intended landing point. The raw LADAR returns were geo-referenced in real time and stored in the dynamic navigation database with latitude, longitude and elevation. The elevation of the intended landing point was estimated in real time based upon LADAR terrain height measurements. This elevation value was updated several times during the approach to fine-tune the coloration of the image closer to touchdown. Although a number of color schemes were used, the final false color configuration used green, amber and red in order of ascending elevation. Green was used from the landing point elevation to 18 inches, amber was used from 18 inches to 6 feet, and red was used above 6 feet to indicate those obstacles which represented a potential rotor strike hazard. Shades of blue were used for elevations below the intended landing point. The hybrid color mode was intended to show the landing zone in true color with obstacles shown in false color. The hybrid mode used the same elevation color coding as the false color mode with the exception of using true color in place of green. Examples of all three modes are shown in Figure C-2 with a day-TV image of the scene for comparison. During the flight test the LADAR was set to function in true color for enroute flying (more than 0.25 nautical miles from the landing point), with a change to either false color or hybrid color when closer than 0.25 nautical miles from the intended landing point.

ANNEX C – COMBINATION OF VISUAL DISPLAY SYSTEM WITH SENSOR TECHNOLOGIES
RTO-TR-HFM-162 C - 3
Figure C-2: LADAR Display Modes.
C.1.1 Integration of Symbology and Sensor-Based Imagery AFDD SV Simulator. After the flight test at NRC, the BOSS symbology was selected as a candidate symbol sets for the 3D-LZ program. The HH-60 Block Change Order BCO005 symbology was selected as the baseline set for comparison. The BOSS symbology set was redesigned to incorporate lessons learned from previous tests, and to implement scale changes on the Horizontal Situation Display to integrate with the 3D-LZ LADAR display. In particular, four scales were implemented for the landing point position symbol and the background downward-view LADAR imagery. The 2000 ft scale was set to match the maximum range of LADAR, and this was the distance represented from the own-ship symbol to the top of the screen. The 1000 ft, 500 ft, and 250 ft scales were added to show finer details of the terrain and obstacles as the aircraft approached the landing point. A method was implemented by which the pilot could move the target landing point symbol during the approach, using a two-axis switch on the collective.
The 3D-LZ version of the BOSS symbology was implemented in the Synthetic Vision (SV) simulation cab at AFDD in early 2009 (Figure C-3, [1]). The LADAR simulation was not yet available, so the systems were not yet integrated. Results from this simulation showed that changing scales on the Horizontal Situation Display (HSD) were not desirable, but it was otherwise flyable with one exception. That exception was that for the direct landing maneuver, the approach-to-landing task was difficult to complete with desired performance if the landing point was moved while on the 250 ft scale; the aircraft was too close to the landing point to make changes. Another maneuver was also tested, which was an approach to 50 ft hover, reposition, and descent.

ANNEX C – COMBINATION OF VISUAL DISPLAY SYSTEM WITH SENSOR TECHNOLOGIES
C - 4 RTO-TR-HFM-162
This maneuver was rated as easier than the direct approach to landing. The helicopter model was the Enhanced Stability Derivative (ESD) model, commented as easier to fly than an actual aircraft by the pilots [2].
Figure C-3: AFDD Synthetic Vision Cab.
After the AFDD simulation with the 3D-LZ version of BOSS, a higher fidelity simulation was conducted in the Synthetic Immersive Research Environment (SIRE) facility at AFRL (Figure C-4). A LADAR simulation was added, which used pre-sampled LADAR data from the Yuma test site. A large dome projection system (160° horizontal x 80° vertical FOV) was used, with improved brownout visualization, and a high resolution terrain database that modelled three landing sites located at Yuma Proving Grounds, AZ. The helicopter model was upgraded to the high fidelity GENHEL model [3].
Figure C-4: AFRL SIRE Helicopter Simulator.

ANNEX C – COMBINATION OF VISUAL DISPLAY SYSTEM WITH SENSOR TECHNOLOGIES
RTO-TR-HFM-162 C - 5
The experiment utilized a 2 x 2 x 2 within-subjects, repeated measures full factorial design. The first factor was sensor type with two levels: LADAR and Forward-Looking Infrared (FLIR). The second factor was symbology type with two levels: HH-60G Block Change Order 5 and BOSS. Finally, the third factor was approach type: direct and offset (where the landing point needed to be moved). A total of eleven US military trained helicopter pilots completed the simulation. All training and data collection was performed at the Synthetic Immersive Research Environment (SIRE) HH-60 helicopter simulator located at Wright-Patterson AFB, OH. The simulator includes a 40-ft diameter dome out-the-window visual display (160° horizontal x 80° vertical FOV) with a simulated HH-60 cab. The visual database modelled three landing sites located at Yuma Proving Grounds, AZ. The GenHel model developed by NASA and the US Army was employed as the flight model.
Distance between the intended and actual landing points were significantly lower with the BOSS symbology (38 ft) when compared to the HH-60G BC005 (55 ft) (p = 0.006). Longitudinal speed at touchdown was significantly lower for the BOSS symbology (1.5 ft/sec) when compared to the HH-60G (2.7 ft/sec) (p = 0.000). The BOSS symbology also produced a significantly lower HQR (4.18) when compared to the HH-60G (5.08) (p = 0.010). See Figure C-5,Figure C-6 and Figure C-7.
0
2
4
6
8
10
BOSS/HH60
HQR
p=0.010
Figure C-5: Average Handling Quality Rating.

ANNEX C – COMBINATION OF VISUAL DISPLAY SYSTEM WITH SENSOR TECHNOLOGIES
C - 6 RTO-TR-HFM-162
0
1
2
3
4
5
BOSS/HH‐60
Visual Cue Rating ‐ Horizontal Translational Rate
p=0.012
Figure C-6: Average Horizontal Translation Rate Rating.
0
1
2
3
4
5
BOSS/HH‐60
Visual Cue Rating ‐ Vertical Translational Rate
p=0.009
Figure C-7: Average Vertical Translation Rate Rating.
HQR 4: Minor but annoying deficiencies. Desired performance requires moderate pilot compensation.
HQR 5: Moderately objectionable deficiencies. Adequate performance requires considerable pilot compensation.

ANNEX C – COMBINATION OF VISUAL DISPLAY SYSTEM WITH SENSOR TECHNOLOGIES
RTO-TR-HFM-162 C - 7
Horizontal rate Visual Cue Ratings (VCR) were significantly lower for the BOSS symbology and LADAR when compared to the HH-60G symbology (p = 0.012). Likewise, vertical VCRs were significantly lower with the BOSS symbology (p = 0.009).
Within the NASA TLX workload assessment, mental load was significantly lower for the BOSS symbology when compared to the HH-60G and also for the direct approach (p = 0.012) when compared to offset (p = 0.003). Physical demand, temporal demand, effort, performance, and frustration were all significantly lower with the BOSS symbology when compared to the HH-60G (p <0.05). Subjectively, pilots felt the BOSS symbology had less clutter, a preferred pitch ladder, and better performance than the HH-60G. In addition, the pilots preferred the LADAR sensor to the FLIR for brownout landings and landing zone assessment. When asked to rank the test configurations from easiest to most difficult, the BOSS symbology with the LADAR imagery in the background during the direct approach was selected as the easiest while the HH-60 symbology with the FLIR imagery with the offset approach was selected as most difficult. See Figure C-8.
012345678
HH-60/DirectHH-60/Offset
BOSS/DirectBOSS/Offset
Aver
age
Ran
king FLIR
FC LADAR
Figure C-8: Average Preference Ranking.
There were six major outcomes of the simulation:
1) The decision was made that only the BOSS symbology would be used in the flight test.
2.) The LADAR display was recommended for the flight test, as implemented in the simulation.
3.) The offset landing was dropped from the proposed flight test.
4) Pilots requested a single display, and AFRL developed the “switched” display, which switched between a Vertical Situation Display (VSD) and a HSD at 30 knots.
5) The horizontal speed guidance algorithm, which was a linear speed vs. distance relationship, was debriefed as too slow. AFRL altered the algorithm to have two sections; pilots started with a constant deceleration which later blended into the linear speed vs. distance algorithm at 1000 ft distance from the landing point.
6) AFRL responded to pilot comments indicating that they wanted to follow a target vertical speed symbol to control descent angle rather than follow the flight path marker symbol (detailed later in this
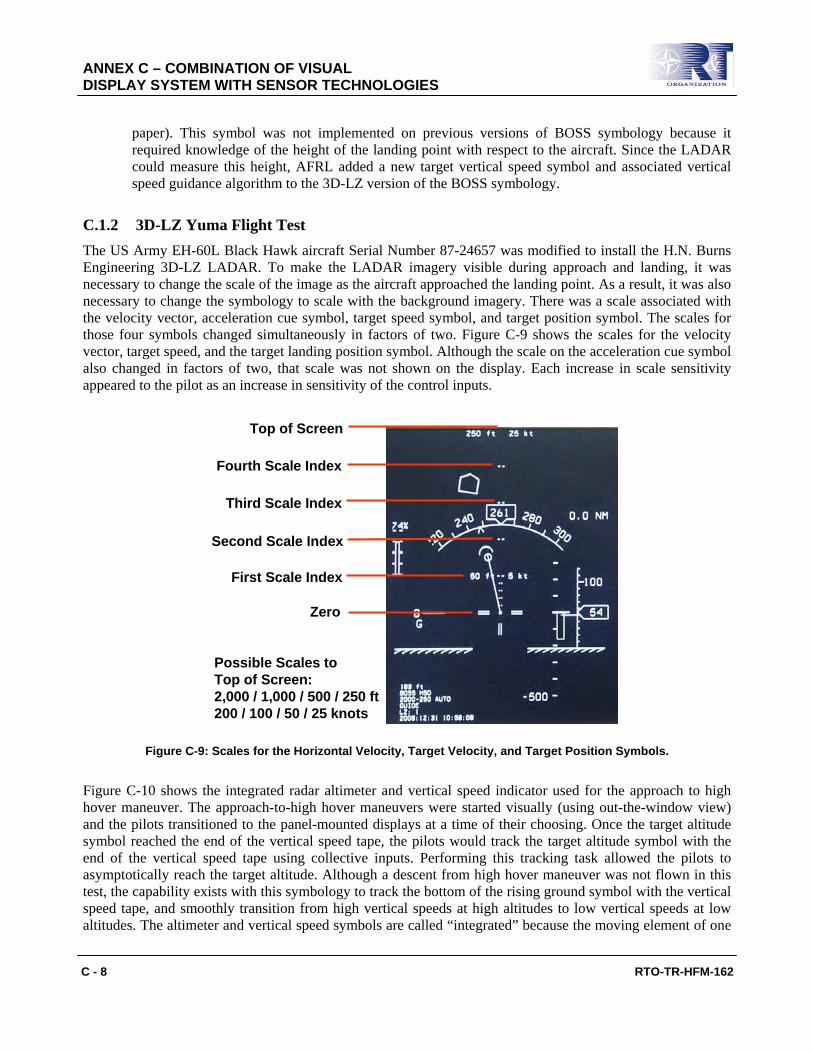
ANNEX C – COMBINATION OF VISUAL DISPLAY SYSTEM WITH SENSOR TECHNOLOGIES
C - 8 RTO-TR-HFM-162
paper). This symbol was not implemented on previous versions of BOSS symbology because it required knowledge of the height of the landing point with respect to the aircraft. Since the LADAR could measure this height, AFRL added a new target vertical speed symbol and associated vertical speed guidance algorithm to the 3D-LZ version of the BOSS symbology.
C.1.2 3D-LZ Yuma Flight Test The US Army EH-60L Black Hawk aircraft Serial Number 87-24657 was modified to install the H.N. Burns Engineering 3D-LZ LADAR. To make the LADAR imagery visible during approach and landing, it was necessary to change the scale of the image as the aircraft approached the landing point. As a result, it was also necessary to change the symbology to scale with the background imagery. There was a scale associated with the velocity vector, acceleration cue symbol, target speed symbol, and target position symbol. The scales for those four symbols changed simultaneously in factors of two. Figure C-9 shows the scales for the velocity vector, target speed, and the target landing position symbol. Although the scale on the acceleration cue symbol also changed in factors of two, that scale was not shown on the display. Each increase in scale sensitivity appeared to the pilot as an increase in sensitivity of the control inputs.
Zero
First Scale Index
Second Scale Index
Third Scale Index
Fourth Scale Index
Top of Screen
Possible Scales to Top of Screen:2,000 / 1,000 / 500 / 250 ft200 / 100 / 50 / 25 knots
Figure C-9: Scales for the Horizontal Velocity, Target Velocity, and Target Position Symbols.
Figure C-10 shows the integrated radar altimeter and vertical speed indicator used for the approach to high hover maneuver. The approach-to-high hover maneuvers were started visually (using out-the-window view) and the pilots transitioned to the panel-mounted displays at a time of their choosing. Once the target altitude symbol reached the end of the vertical speed tape, the pilots would track the target altitude symbol with the end of the vertical speed tape using collective inputs. Performing this tracking task allowed the pilots to asymptotically reach the target altitude. Although a descent from high hover maneuver was not flown in this test, the capability exists with this symbology to track the bottom of the rising ground symbol with the vertical speed tape, and smoothly transition from high vertical speeds at high altitudes to low vertical speeds at low altitudes. The altimeter and vertical speed symbols are called “integrated” because the moving element of one

ANNEX C – COMBINATION OF VISUAL DISPLAY SYSTEM WITH SENSOR TECHNOLOGIES
RTO-TR-HFM-162 C - 9
indicator (end of the vertical speed tape) is controlled by the pilot to be positioned next to the moving element of the other indicator (target radar altitude) to achieve the desired descent profile.
Figure C-10: Combined Altimeter and Vertical Speed Indicator with Target Altitude Symbol Used for the Approach to High Hover Maneuver.
Figure C-11 shows the altimeter and vertical speed indicator used for the landing maneuver. In this case, the target altitude symbol was replaced with the target vertical speed symbol. To stay on the vertical guidance profile, the pilot manipulated the collective control to place the end of the vertical speed tape inside the target altitude symbol. The vertical speed guidance symbol guided the pilot on a specific profile shown in Figure C-12. The vertical profile started as a constant descent. At 1,000 ft range from the landing point, the algorithm transitioned to target altitude (in feet) being twice the ground speed (in knots). The vertical speed guidance symbol also turned off below a horizontal ground speed of 5 knots.
Figure C-11: Combined Altimeter and Vertical Speed Indicator with Target Vertical Speed Symbol Used for the Landing Maneuver.

ANNEX C – COMBINATION OF VISUAL DISPLAY SYSTEM WITH SENSOR TECHNOLOGIES
C - 10 RTO-TR-HFM-162
Altitude Profile if Vertical Speed Guidance is Followed
0
50
100
150
200
250
0 1000 2000 3000 4000 5000
Distance to Landing Point (ft)
Rad
ar A
ltitu
de (f
t)
Figure C-12: Vertical Profile for the Vertical Speed Guidance Algorithm.
A total of three display configurations were evaluated in the flight test. One of the three symbol sets is called “dual” in this annex and is comprised of a VSD with forward-view terrain imagery, and a HSD with downward-view terrain imagery as shown in Figure C-13. The downward-view terrain image was actually drawn in perspective view, as opposed to plan-view, from an eye-point far above the helicopter. The eye-point height changed with the HSD scale. Though similar to a true-plan view, the downward-view perspective image showed the sides and top of vertical obstacles like wire poles (unless directly under the aircraft), while a true plan-view would have shown only the tops of obstacles. The VSD had a forward-view, earth referenced pitch ladder and flight path marker symbol not shown on the HSD, and it was intended to be used in high-speed flight. The HSD had a plan-view velocity vector, acceleration cue, target speed symbol, and target position symbol not shown on the VSD, and it was intended to be used in low-speed flight. Two Air Force pilots flew the HSD on the left display, while the Navy and USMC pilots flew the HSD on the right display to put the HSD directly in front of the pilot.

ANNEX C – COMBINATION OF VISUAL DISPLAY SYSTEM WITH SENSOR TECHNOLOGIES
RTO-TR-HFM-162 C - 11
Figure C-13: Dual Display with VSD (Right) and HSD (Left).
The second of the three symbol sets was developed by AFRL and is called “switched” in this paper (Figure C-14). For all pilots, the right display switched between a VSD and an HSD display at 30 knots ground speed. The intent of the switched display set was to enable the pilot to keep his eyes on a single display. The left display was an HSD display at all speeds for this display set, and it was redundant with the right display below 30 knots. Pilots commented that they did not use the left display for landing the aircraft.
Figure C-14: Right: Switched Display on Low-Speed Page; Left: Display Stays as an HSD.

ANNEX C – COMBINATION OF VISUAL DISPLAY SYSTEM WITH SENSOR TECHNOLOGIES
C - 12 RTO-TR-HFM-162
The third variant of the BOSS symbol set was used only with FLIR terrain imagery in the background. This variant is called “single” in this paper, since only a single display was used. In the single display, both the forward-view flight path marker, and the plan view hover symbols were shown simultaneously above 20 knots. Below 20 knots the flight path marker symbol disappeared. With the single display, the pitch ladder was absent, but the horizon line remained on at all speeds. Only five landings were attempted with the single display configuration due to limited flight time, and the priority was the LADAR conditions over the FLIR conditions.
Landings at the YPG test site were all performed at prepared sites. All but three landings were conducted at the Oasis site, shown in Figure C-15, which was 500 ft long and 200 ft wide. The target landing point was deliberately offset 50 ft to the north (right on photo) to increase the distance from the telephone poles, wires, and other ground obstacles. Three landings were conducted at an alternate prepared site due to lingering dust clouds at the Oasis site. Both sites were plowed to increase the quantity of dust during landing (Figure C-16).
Lane 7200x500 ft
34 ft Polesand Wires
GroundObstacles
Figure C-15: Landings were Conducted Primarily in Lane 7 at the Yuma Proving Ground Dust Course.
Figure C-16: Lanes were Plowed to Increase Quantity of Dust (EH-60L shown).

ANNEX C – COMBINATION OF VISUAL DISPLAY SYSTEM WITH SENSOR TECHNOLOGIES
RTO-TR-HFM-162 C - 13
Landing maneuvers were started at approximately 250 ft altitude, 80 knots ground speed, and 1 – 2 nautical miles from the landing point. Speed guidance started at 0.8 nm, at which point the pilot both started the deceleration and started the descent. All landings were conducted with the pilot’s feet off the pedals, using the heading hold function of the aircraft to maintain heading. The two developmental pilots thought that the original 25 knot scale (to the top of the screen) on the plan-view velocity vector caused too much workload. Therefore, the evaluation pilots all flew the 50 knot velocity vector scale for the landing maneuver.
C.1.2.1 Objective Results
Safe landings were accomplished on 77% of the attempts with the LADAR (20 out of 26). Safe go-around maneuvers by the evaluation pilot were demonstrated on the remaining 23% of the attempted landings. Safe landings were accomplished on 3 of the five attempts with the FLIR sensor and single display symbol set. Five out of the eight go-around maneuvers were called for by the safety pilot. The cause of the go-around was lateral drift (4 times), aft drift (2 times) excessive forward speed (one time), and one case of a large collective input close to the ground.
Figure C-17 through Figure C-23 show the objective data measured during landing. With only four evaluation pilots, an Analysis of Variance (ANOVA) was not practical to implement. For the landing maneuver, the exact time of touchdown could not be determined from the aircraft state data in post-flight analysis. This was due to the soft soil at the landing site, shock absorbers on the wheels, vibration noise in the acceleration signals, as well as drift and noise in the aircraft radar altimeter. In the data analysis, there is an assumption that the values of vertical speed, lateral speed, and longitudinal speed reduce in absolute value once the first wheel touches the ground. Rather than take a single point in time, maximum values of speed in all three axis were determined for a range of radar altitudes. The lower end of the range was determined by finding the lowest common radar altimeter reading for all landings, which was -1 ft. The upper limit was set at 3 ft above the lower the limit, which was +2 ft. The selected range might not capture the wheel-touch event for some of the landings; it was better to err on the high side (entire range may be before touchdown) than err on the low side (entire range may be after touchdown).
Figure C-17 shows the highest vertical speed (in the down direction), for the aircraft between +2 and -1 ft radar altitude. First occurrences of +2 ft and -1 ft were used to define the range. The desired boundary of 150 ft/min and the adequate boundary of 300 ft/min are shown. The actual landing gear limit for the Black Hawk in the weight range of the test aircraft is 540 ft/min for flat terrain and 360 ft/min for sloped terrain. As shown in Figure C-17, the aircraft was within desired tolerances (or borderline) for most of the landings. Only two landings were slightly into the adequate range; the highest vertical speed was 176 ft/min. There is a trend toward more consistent vertical speeds between landings with the dual display, as shown in Figure C-17.

ANNEX C – COMBINATION OF VISUAL DISPLAY SYSTEM WITH SENSOR TECHNOLOGIES
C - 14 RTO-TR-HFM-162
Vertical Speed(maximum vertical speed down between
+2 ft and -1 ft radar altitude)
100.0 97.6 Ave = 95.2
0
50
100
150
200
250
300
350
Vert
ical
Spe
ed D
own
[ft/m
in]
Desired
Adequate
Outside Adequate
Switched(10 pts)
Dual(11 pts)
Single(3 pts)
Figure C-17: Vertical Speed.
Figure C-18 shows the data for the highest lateral speed between +2 ft and -1 ft radar altitude. Tolerances for lateral speed were very tight: 0.5 knot desired, and 1.0 knot for adequate. Eight of the landings were within the desired range, eleven were within the adequate range, and four of the landings were slightly outside the adequate range. The highest lateral speed measured was 1.16 knots, which is slightly outside of adequate. At no time did the safety pilot feel the aircraft was close to a roll-over. The reduction in lateral speed caused by the aft gear touching before the forward main gears (the standard UH-60 landing) is not seen in the data, since worst case speeds were recorded before touchdown. In retrospect, video recording of the landing gears would have enabled the analysis of lateral speed to be broken up into speeds before the aft wheel touchdown event, and speeds before the main wheel touchdown event.

ANNEX C – COMBINATION OF VISUAL DISPLAY SYSTEM WITH SENSOR TECHNOLOGIES
RTO-TR-HFM-162 C - 15
Lateral Speed(maximum lateral speed between
+2 ft and -1 ft radar altitude)
0.65
0.75
Ave = 0.57
0
0.25
0.5
0.75
1
1.25
1.5
Late
ral S
peed
[kno
ts]
Switched
Desired
Adequate
OutsideAdequate
Dual Single
Figure C-18: Lateral Speed.
Figure C-19 shows the highest forward speed between +2 ft and -1 ft radar altitude. Twenty landings were within the desired tolerance (or borderline), which was less than 5 knots ground speed; three landings were in the adequate range, which was less than 10 knots ground speed. The highest forward speed was 8.4 knots, with the single display condition.

ANNEX C – COMBINATION OF VISUAL DISPLAY SYSTEM WITH SENSOR TECHNOLOGIES
C - 16 RTO-TR-HFM-162
Forward Speed(maximum forward speed between
+2 ft and -1 ft radar altitude)
2.192.31
Ave = 6.29
0
2
4
6
8
10
12
14
16Fo
rwar
d Sp
eed
[kno
ts]
Switched
Desired
Adequate
Outside Adequate
Dual Single
Figure C-19: Forward Speed.
Figure C-20 shows the maximum speed in the aft direction between +2 ft and -1 ft radar altitude. For 14 of the 23 landings, the aft speed was zero. In nine cases, the aircraft came to a hover near the ground, and then began drifting aft slowly between +2 and -1 ft radar altitude. Nineteen landings had aft speed in the desired range, three landings had aft speed in the adequate range, and one was borderline between adequate and outside of adequate at 0.97 knots.

ANNEX C – COMBINATION OF VISUAL DISPLAY SYSTEM WITH SENSOR TECHNOLOGIES
RTO-TR-HFM-162 C - 17
Aft Speed(maximum aft speed between+2 ft and -1 ft radar altitude)
0.160.11
Ave = 0.55
0
0.25
0.5
0.75
1
1.25
Aft
Spee
d [k
nots
]
Switched
Desired
Adequate
Outside Adequate
Dual Single
Figure C-20: Aft Speed.
Figure C-21 shows the position of the aircraft at the first occurrence of the radar altimeter going through -1 ft, as measured by the aircraft Embedded GPS/Inertial navigation system (EGI) which drove the symbols. This diagram does not include errors in the measurement of aircraft position, but rather it shows of how close pilots were able to put the aircraft own-ship symbol onto the target landing point symbol. The position data charts do not include three landings which were conducted at a different site due to lingering dust at the primary test site. The previous speed charts do include data from the alternate site.

ANNEX C – COMBINATION OF VISUAL DISPLAY SYSTEM WITH SENSOR TECHNOLOGIES
C - 18 RTO-TR-HFM-162
Aircraft Landing PointRelative to Target Landing Point Symbol
-200
-150
-100
-50
0
50
100
150
200
-150 -100 -50 0 50 100 150 200 250
Distance East-West [ft]
Dis
tanc
e N
orth
-Sou
th [f
t]
Switched DisplayDual DisplaySingle Display
50 foot Radius Desired Region
100 foot Radius Adequate Region
North
East
ApproachDirection273 deg
Figure C-21: Landing Position (at -1 ft Radar Altitude) Relative to Target Landing Point as Measured by EGI and Displayed to the Pilot.
Figure C-22 shows the lateral position error for a 273 degree true heading desired ground track. All but two landings were within the desired 50 ft error. The two largest errors were 61.6 feet with the switched display and 64.5 feet with the dual displays.
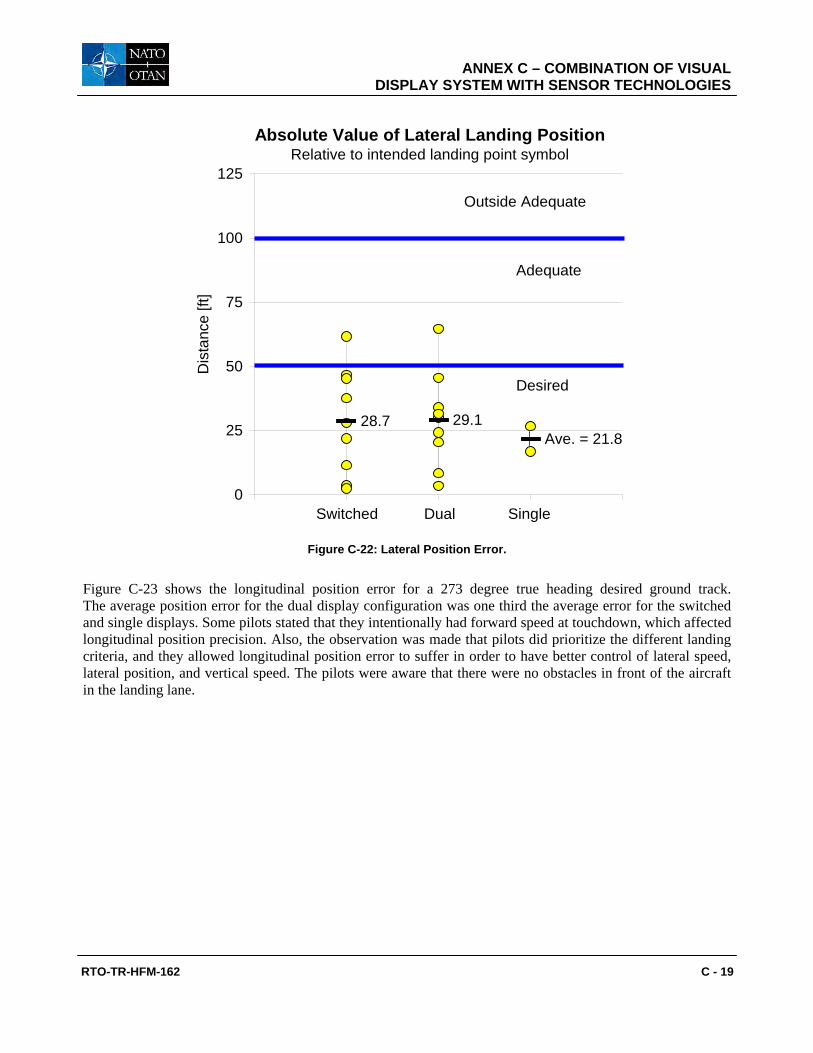
ANNEX C – COMBINATION OF VISUAL DISPLAY SYSTEM WITH SENSOR TECHNOLOGIES
RTO-TR-HFM-162 C - 19
Absolute Value of Lateral Landing PositionRelative to intended landing point symbol
28.7 29.1Ave. = 21.8
0
25
50
75
100
125
Dis
tanc
e [ft
]
DualSwitched Single
Desired
Adequate
Outside Adequate
Figure C-22: Lateral Position Error.
Figure C-23 shows the longitudinal position error for a 273 degree true heading desired ground track. The average position error for the dual display configuration was one third the average error for the switched and single displays. Some pilots stated that they intentionally had forward speed at touchdown, which affected longitudinal position precision. Also, the observation was made that pilots did prioritize the different landing criteria, and they allowed longitudinal position error to suffer in order to have better control of lateral speed, lateral position, and vertical speed. The pilots were aware that there were no obstacles in front of the aircraft in the landing lane.

ANNEX C – COMBINATION OF VISUAL DISPLAY SYSTEM WITH SENSOR TECHNOLOGIES
C - 20 RTO-TR-HFM-162
Absolute Value of Longitudinal Landing PositionRelative to intended landing point symbol
90.8
28.3
Ave = 93.2
0
50
100
150
200
250
Dis
tanc
e [ft
]
Switched Dual Single
Desired
Adequate
Outside Adequate
Figure C-23: Longitudinal Position Error.
C.1.2.2 Subjective Results
Figure C-24 shows the histogram of how the four evaluation pilots ranked their most preferred display. Only one condition was rated as most desired by two pilots. That condition was the single display.
Most Preferred DisplaysHistogram of the 4 evaluation pilots
0
1
2
3
Switched Dual Single
Cou
nt
Figure C-24: Display Preference for the Four Evaluation Pilots.

ANNEX C – COMBINATION OF VISUAL DISPLAY SYSTEM WITH SENSOR TECHNOLOGIES
RTO-TR-HFM-162 C - 21
Figure C-25 shows the average HQR ratings for the three displays, which ranged between a rating of 4.3 (dual display) and 5.5 (single display). A lower score indicates better handling qualities. Each pilot’s individual scores were averaged before the four pilot’s scores were averaged, so that each pilot had equal weight. Note that the best HQR rating was for the dual display configuration. One of the purposes of Figure C-25 is to establish the handling quality level for the task. For all display configurations, the HQR ratings were in the level 2 handling quality range.
Handing Qualities RatingAverage of 4 Pilots
(+/- 1 Std. Error of the Mean, n=4)
4.81 4.29
5.50
1
2
3
4
5
6
7
8
9
10
Switched Dual Single
Rat
ing
(1-1
0)B
ette
r
Leve
l 1Le
vel 2
Leve
l 3
Figure C-25: Average HQR.
HQR 4: Minor but annoying deficiencies. Desired performance requires moderate pilot compensation.
HQR 5: Moderately objectionable deficiencies. Adequate performance requires considerable pilot compensation.
Figure C-26 shows the average score for each of the six dimensions of the TLX questionnaire. Since there was little difference in TLX scores between display conditions, the scores in Figure C-26 were averaged across display conditions, and each pilot was given equal weight. The three worst scores were: mental demand, temporal demand, and effort. The three best scores were physical demand, performance, and frustration. The interpretation of the component scores is that a reduction in workload can best be achieved through a reduction in mental demand and temporal demand as opposed to a reduction in physical demand, improvement in performance or a reduction of the frustration of the task.

ANNEX C – COMBINATION OF VISUAL DISPLAY SYSTEM WITH SENSOR TECHNOLOGIES
C - 22 RTO-TR-HFM-162
TLX DimensionsAverage of Four Pilots
(+/- 1 standard error of the mean for n=4)
48.98
76.85
35.99
65.4755.36
75.52
0102030405060708090
100
Men
tal
Phy
sica
l
Tem
pora
l
Per
form
ance
Effo
rt
Frus
tratio
n
Scor
e (o
ut o
f 100
)B
ette
r
Figure C-26: Average Scores for the TLX Dimensions.
Specific quotations from the pilots are provided below:
“I really like the system and quickly gained confidence in my ability to operate at low speed and land without visual references. Due to the controllability from the symbology and the SA (situational awareness) afforded by the LADAR picture, I found that I could confidently land in proximity to obstacles, such that I would not attempt with blindly coupled landing systems. The symbology was far more comfortable to fly than what I am used to in the CV-22. The vertical speed guidance, rising terrain (symbol), and cup/ball (horizontal) speed cues were key components that greatly reduced pilot workload and enabled a very controlled approach. The false coloring was intuitive and effectively alerted the pilot to the presence of and proximity to tall hazards such as the phone poles and wires in Oasis. Fine tuning of the LADAR picture is still needed to display small obstacles in false color.”
“LADAR imagery and symbology sets were very impressive and allowed a better level of control and situational awareness (during degraded visual conditions) than I have experienced before. The workload to fly an approach into brownout and successfully land is very high. In my opinion, I would want to see some changes in symbology before I would recommend this for employment by an “average” pilot to execute DVE (degraded visual environment) approaches to a spot.” (Meaning a point whose coordinate was not entered into the guidance system).
“Recommend the approach profile be modified to more closely reflect current Navy tac-no hover profile, for increased controllability, decreased power requirements, decreased aircraft wear (reduction

ANNEX C – COMBINATION OF VISUAL DISPLAY SYSTEM WITH SENSOR TECHNOLOGIES
RTO-TR-HFM-162 C - 23
of time in full brownout). Recommend symbology set 8 (single) be modified with the above profile, and the flight path marker and ‘speed worm’ be removed. In my opinion, this would be the best symbology set.”
“Observation: Flying a precise head-down approach AND crosschecking the landing zone may be an excessive workload for a single pilot.
Recommendation: Assess options to divide imagery analysis (e.g., obstacle detection and landing point selection) and aircraft control between two pilots.”
“Observation: It is difficult to crosscheck altitude cues (AGL and VSI) during the terminal phase of the approach.
Recommendations:
1) Add an intuitive reference to the aircraft symbol to give some perspective of height above touchdown when below 10’.
2) Add radar altitude digits next to the aircraft symbol when below 40 kts.
3) Move VSI cue next to the aircraft symbol.”
“Observation: The most difficult aircraft control occurs at very low speed (<3 kts) and low altitude (<20’). This is also when you lose the “cup” velocity target.
Recommendation: As the recommended velocity approaches 3 kts, move and anchor the cup at 3 kts straight forward (regardless of desired landing point location). Hold the forward / 3 kt cue until touchdown.”
Most pilots commented in the debriefing that swirling dust in the FLIR display created a relative motion illusion giving the pilot an incorrect cue of movement.
C.1.2.3 Conclusions
1) The combination of the 3D-LZ LADAR and BOSS symbology set enabled safe brownout landings on 77% of the attempts. Safe go-around maneuvers were demonstrated by the evaluation pilot on the remaining 23% of the attempted landings. Five out of the eight go-around maneuvers were called for by the safety pilot. Pilots rated the Handling Qualities as Level 2.
2) For the combination of the 3D-LZ LADAR and BOSS symbology, the following parameters with within desired limits on average: vertical speed < 150 ft/min, forward speed < 5 knots, aft speed < 0.5 knots, and lateral position < 50 ft. The lateral speed was on average in the adequate range. The worst case lateral speed was 1.16 knots (desired < 0.5 knots, adequate <1.0 knots). Longitudinal position was on average within desired for the dual display (< 50 ft) and within adequate with the switched display (< 100 ft).
3) Workload was rated and debriefed as very high for the landing maneuver. Pilots said that they did not have the capacity to look for obstacles near the touchdown event, or while in a hover near the load.
4) As expected, there was generally little difference in pilot performance, HQR ratings, and TLX ratings between symbol sets; they were all variants of the BOSS symbol set. The only large difference was that the average longitudinal position error for the dual display condition was 1/3 that of the switched and single displays conditions.

ANNEX C – COMBINATION OF VISUAL DISPLAY SYSTEM WITH SENSOR TECHNOLOGIES
C - 24 RTO-TR-HFM-162
5) Pilots said that the swirling dust clouds in the FLIR image created a relative motion illusion giving the pilot an incorrect cue of movement. In contrast, the LADAR image remained stable and clear of false returns throughout the landing and hover maneuvers. Pilots saw the location of obstacles throughout the landing maneuvers.
C.1.2.4 Future Suggested Improvements
A possible method to reduce workload is to split the obstacle detection task and the flying task split between the two pilots. If the pilot-on-the-controls had a head-mounted display with symbology, then that pilot could keep looking out the window, while the pilot-not-on-the-controls could concentrate on searching for obstacles from the sensor imagery on the panel-mounted displays.
Pilots suggested moving the altitude and vertical speed information closer to the center of the screen. One pilot suggested keeping the speed guidance on all the time during the approach, and to lock it at 3 knots along the aircraft centerline direction at speeds slower than 3 knots.
Small obstacles were displayed as small objects on the screen. They were difficult to see, particularly in a cluttered field. Real-time processing of the LADAR imagery and visual enhancement of the representation of obstacles would aid the pilot in avoiding small obstacles. Reference the companion paper (Ref. 1).
Pilots suggested modifying the horizontal speed guidance algorithm to reduce the time in the brownout. This work is currently being conducted at AFDD in simulation.
One pilot noted that the system should be expanded to provide horizontal speed guidance and vertical descent rate guidance for situations where there is no pre-stored landing point coordinate.
In the future two types of landings should be tested. In one case the pilots should try to land with some forward speed, and in this case the longitudinal position boundary should be larger than the lateral boundary. In another case pilots should try to land with zero forward speed, with equal longitudinal and lateral position boundaries.
Video instrumentation of the distance between the ground and the wheels would aid in post-flight analysis of data.
C.2 REFERENCES
[1] Szoboszlay, Z., Jennings, S. and Carignan, S., Results and Comments for the Loon Symbology Study (2009), National Research Council of Canada Flight Test Report, FTR-FRL-2009-0024.
[2] Whalley, M. (1994). Effects of Longitudinal and Normal Load Factor Envelopes on Combat Helicopter Handling Qualities, NASA TM 4558.
[3] Ballin, M. (1987). Validation of a Real-Time Engineering Simulation of the UH-60A Helicopter, NASA TM-88360.

RTO-TR-HFM-162
REPORT DOCUMENTATION PAGE
1. Recipient’s Reference 2. Originator’s References 3. Further Reference
4. Security Classificationof Document
RTO-TR-HFM-162 AC/323(HFM-162)TP/400
ISBN 978-92-837-0149-1
UNCLASSIFIED/ UNLIMITED
5. Originator Research and Technology Organisation North Atlantic Treaty Organisation BP 25, F-92201 Neuilly-sur-Seine Cedex, France
6. Title Rotary-Wing Brownout Mitigation: Technologies and Training
7. Presented at/Sponsored by
This Report documents the findings of Task Group HFM-162 (2008 – 2011) that investigated the training and technologies employed by member NATO Nations to mitigate the impact of brownout on rotary-winged operations.
8. Author(s)/Editor(s) 9. Date
Multiple January 2012
10. Author’s/Editor’s Address 11. Pages
Multiple 182
12. Distribution Statement There are no restrictions on the distribution of this document. Information about the availability of this and other RTO unclassified publications is given on the back cover.
13. Keywords/Descriptors
3-D audio display 3-D conformal display Brownout landing Brownout mitigation Brownout symbology
Degraded visual environment Haptic control Helicopter flight training Rotary-wing aircraft
Spatial disorientation Synthetic display Tactile display White-out
14. Abstract
The RTO HFM-162 Rotary-Wing Brownout Mitigation Task Group was formed to examine the effects of Rotary-Wing Brownout (RWB) and whiteout on pilots during operations. Brownout is the condition developed by recirculating rotor downwash as a helicopter lands or takes off in an arid or a snowy (whiteout) environment. The dust, dirt, or snow that is developed by the downwash renders out-the-cockpit visibility severely degraded or non-existent. The resultant mishaps due to the Degraded Visual Environment (DVE) are a serious problem and partner nations report losses of aircraft and personnel. This study was undertaken to investigate the incidence and severity of the problem in partner nations, to examine and document current and planned technology developments, and to evaluate and document the brownout training procedures within NATO. To provide a true, multi-purpose helicopter sensor, the TG members envision laser radar technology integrated with a navigation forward looking infrared radar. Intuitive hovering and landing cockpit display symbology, such as that described in this report, must also be an integral part of an effective system for DVE landings.

RTO-TR-HFM-162

NORTH ATLANTIC TREATY ORGANISATION RESEARCH AND TECHNOLOGY ORGANISATION
BP 25
F-92201 NEUILLY-SUR-SEINE CEDEX • FRANCE Télécopie 0(1)55.61.22.99 • E-mail [email protected]
DIFFUSION DES PUBLICATIONS
RTO NON CLASSIFIEES
Les publications de l’AGARD et de la RTO peuvent parfois être obtenues auprès des centres nationaux de distribution indiqués ci-dessous. Si vous souhaitez recevoir toutes les publications de la RTO, ou simplement celles qui concernent certains Panels, vous pouvez demander d’être inclus soit à titre personnel, soit au nom de votre organisation, sur la liste d’envoi. Les publications de la RTO et de l’AGARD sont également en vente auprès des agences de vente indiquées ci-dessous. Les demandes de documents RTO ou AGARD doivent comporter la dénomination « RTO » ou « AGARD » selon le cas, suivi du numéro de série. Des informations analogues, telles que le titre est la date de publication sont souhaitables. Si vous souhaitez recevoir une notification électronique de la disponibilité des rapports de la RTO au fur et à mesure de leur publication, vous pouvez consulter notre site Web (www.rto.nato.int) et vous abonner à ce service.
CENTRES DE DIFFUSION NATIONAUX ALLEMAGNE GRECE (Correspondant) REPUBLIQUE TCHEQUE
Streitkräfteamt / Abteilung III Defence Industry & Research General LOM PRAHA s. p. Fachinformationszentrum der Bundeswehr (FIZBw) Directorate, Research Directorate o. z. VTÚLaPVO Gorch-Fock-Straße 7, D-53229 Bonn Fakinos Base Camp, S.T.G. 1020 Mladoboleslavská 944 Holargos, Athens PO Box 18
BELGIQUE 197 21 Praha 9 Royal High Institute for Defence – KHID/IRSD/RHID HONGRIE Management of Scientific & Technological Research Hungarian Ministry of Defence ROUMANIE
for Defence, National RTO Coordinator Development and Logistics Agency Romanian National Distribution Royal Military Academy – Campus Renaissance P.O.B. 25, H-1885 Budapest Centre Renaissancelaan 30, 1000 Bruxelles Armaments Department ITALIE 9-11, Drumul Taberei Street
CANADA General Secretariat of Defence and Sector 6 DSIGRD2 – Bibliothécaire des ressources du savoir National Armaments Directorate 061353, Bucharest R et D pour la défense Canada 5th Department – Technological Ministère de la Défense nationale Research ROYAUME-UNI 305, rue Rideau, 9e étage Via XX Settembre 123, 00187 Roma Dstl Knowledge and Information Ottawa, Ontario K1A 0K2 Services
LUXEMBOURG Building 247 DANEMARK Voir Belgique Porton Down
Danish Acquisition and Logistics Organization (DALO) Salisbury SP4 0JQ Lautrupbjerg 1-5, 2750 Ballerup NORVEGE Norwegian Defence Research SLOVAQUIE
ESPAGNE Establishment, Attn: Biblioteket Akadémia ozbrojených síl gen. SDG TECIN / DGAM P.O. Box 25 M.R. Štefánika, Distribučné a C/ Arturo Soria 289 NO-2007 Kjeller informačné stredisko RTO Madrid 28033 Demänová 393, Liptovský Mikuláš 6
PAYS-BAS 031 06 ESTONIE Royal Netherlands Military
Estonian Ministry of Defence Academy Library SLOVENIE Estonian National Coordinator for NATO RTO P.O. Box 90.002 Ministry of Defence Sakala 1, Tallinn 15094 4800 PA Breda Central Registry for EU and NATO
ETATS-UNIS POLOGNE Vojkova 55 NASA Center for AeroSpace Information (CASI) Centralna Biblioteka Wojskowa 1000 Ljubljana 7115 Standard Drive ul. Ostrobramska 109 Hanover, MD 21076-1320 04-041 Warszawa TURQUIE Milli Savunma Bakanlığı (MSB)
FRANCE PORTUGAL ARGE ve Teknoloji Dairesi O.N.E.R.A. (ISP) Estado Maior da Força Aérea Başkanlığı 29, Avenue de la Division Leclerc SDFA – Centro de Documentação 06650 Bakanliklar BP 72, 92322 Châtillon Cedex Alfragide, P-2720 Amadora Ankara
AGENCES DE VENTE NASA Center for AeroSpace The British Library Document Canada Institute for Scientific and
Information (CASI) Supply Centre Technical Information (CISTI) 7115 Standard Drive Boston Spa, Wetherby National Research Council AcquisitionsHanover, MD 21076-1320 West Yorkshire LS23 7BQ Montreal Road, Building M-55ETATS-UNIS ROYAUME-UNI Ottawa K1A 0S2, CANADALes demandes de documents RTO ou AGARD doivent comporter la dénomination « RTO » ou « AGARD » selon le cas, suivie du numéro de série (par exemple AGARD-AG-315). Des informations analogues, telles que le titre et la date de publication sont souhaitables. Des références bibliographiquescomplètes ainsi que des résumés des publications RTO et AGARD figurent dans les journaux suivants :
Scientific and Technical Aerospace Reports (STAR) Government Reports Announcements & Index (GRA&I) STAR peut être consulté en ligne au localisateur de ressources publié par le National Technical Information Serviceuniformes (URL) suivant: http://ntrs.nasa.gov/search.jsp SpringfieldSTAR est édité par CASI dans le cadre du programme Virginia 2216 NASA d’information scientifique et technique (STI) ETATS-UNISNASA Langley Research Center, STI Program Office, MS 157A (accessible également en mode interactif dans la base deHampton, Virginia 23681-0001 données bibliographiques en ligne du NTIS, et sur CD-ROM) ETATS-UNIS

NORTH ATLANTIC TREATY ORGANISATION RESEARCH AND TECHNOLOGY ORGANISATION
BP 25
F-92201 NEUILLY-SUR-SEINE CEDEX • FRANCE Télécopie 0(1)55.61.22.99 • E-mail [email protected]
DISTRIBUTION OF UNCLASSIFIED RTO PUBLICATIONS
AGARD & RTO publications are sometimes available from the National Distribution Centres listed below. If you wish to receive all RTO reports, or just those relating to one or more specific RTO Panels, they may be willing to include you (or your Organisation) in their distribution. RTO and AGARD reports may also be purchased from the Sales Agencies listed below. Requests for RTO or AGARD documents should include the word ‘RTO’ or ‘AGARD’, as appropriate, followed by the serial number. Collateral information such as title and publication date is desirable. If you wish to receive electronic notification of RTO reports as they are published, please visit our website (www.rto.nato.int) from where you can register for this service.
NATIONAL DISTRIBUTION CENTRES BELGIUM GREECE (Point of Contact) ROMANIA
Royal High Institute for Defence – KHID/IRSD/RHID Defence Industry & Research General Romanian National Distribution Management of Scientific & Technological Research Directorate, Research Directorate Centre
for Defence, National RTO Coordinator Fakinos Base Camp, S.T.G. 1020 Armaments Department Royal Military Academy – Campus Renaissance Holargos, Athens 9-11, Drumul Taberei Street Renaissancelaan 30 Sector 6, 061353, Bucharest 1000 Brussels HUNGARY
Hungarian Ministry of Defence SLOVAKIA CANADA Development and Logistics Agency Akadémia ozbrojených síl gen.
DRDKIM2 – Knowledge Resources Librarian P.O.B. 25, H-1885 Budapest M.R. Štefánika, Distribučné a Defence R&D Canada informačné stredisko RTO Department of National Defence ITALY Demänová 393, Liptovský Mikuláš 6305 Rideau Street, 9th Floor General Secretariat of Defence and 031 06 Ottawa, Ontario K1A 0K2 National Armaments Directorate
5th Department – Technological SLOVENIA CZECH REPUBLIC Research Ministry of Defence
LOM PRAHA s. p. Via XX Settembre 123, 00187 Roma Central Registry for EU & NATO o. z. VTÚLaPVO Vojkova 55 Mladoboleslavská 944 LUXEMBOURG 1000 Ljubljana PO Box 18 See Belgium 197 21 Praha 9 SPAIN
NETHERLANDS SDG TECIN / DGAM DENMARK Royal Netherlands Military C/ Arturo Soria 289
Danish Acquisition and Logistics Organization Academy Library Madrid 28033 (DALO) P.O. Box 90.002
Lautrupbjerg 1-5 4800 PA Breda TURKEY 2750 Ballerup Milli Savunma Bakanlığı (MSB)
NORWAY ARGE ve Teknoloji Dairesi ESTONIA Norwegian Defence Research Başkanlığı
Estonian Ministry of Defence Establishment, Attn: Biblioteket 06650 Bakanliklar – Ankara Estonian National Coordinator for NATO RTO P.O. Box 25 Sakala 1, Tallinn 15094 NO-2007 Kjeller UNITED KINGDOM
Dstl Knowledge and Information FRANCE POLAND Services
O.N.E.R.A. (ISP) Centralna Biblioteka Wojskowa Building 247 29, Avenue de la Division Leclerc ul. Ostrobramska 109 Porton Down BP 72, 92322 Châtillon Cedex 04-041 Warszawa Salisbury SP4 0JQ
GERMANY PORTUGAL UNITED STATES Streitkräfteamt / Abteilung III Estado Maior da Força Aérea NASA Center for AeroSpace Fachinformationszentrum der Bundeswehr (FIZBw) SDFA – Centro de Documentação Information (CASI) Gorch-Fock-Straße 7 Alfragide, P-2720 Amadora 7115 Standard Drive D-53229 Bonn Hanover, MD 21076-1320
SALES AGENCIES
NASA Center for AeroSpace The British Library Document Canada Institute for Scientific and Information (CASI) Supply Centre Technical Information (CISTI)
7115 Standard Drive Boston Spa, Wetherby National Research Council AcquisitionsHanover, MD 21076-1320 West Yorkshire LS23 7BQ Montreal Road, Building M-55UNITED STATES UNITED KINGDOM Ottawa K1A 0S2, CANADA
Requests for RTO or AGARD documents should include the word ‘RTO’ or ‘AGARD’, as appropriate, followed by the serial number (for example AGARD-AG-315). Collateral information such as title and publication date is desirable. Full bibliographical references and abstracts of RTO and AGARD publications are given in the following journals: Scientific and Technical Aerospace Reports (STAR) Government Reports Announcements & Index (GRA&I) STAR is available on-line at the following uniform resource published by the National Technical Information Servicelocator: http://ntrs.nasa.gov/search.jsp SpringfieldSTAR is published by CASI for the NASA Scientific Virginia 2216 and Technical Information (STI) Program UNITED STATESNASA Langley Research Center, STI Program Office, MS 157A (also available online in the NTIS Bibliographic DatabaseHampton, Virginia 23681-0001 or on CD-ROM) UNITED STATES
ISBN 978-92-837-0149-1