roscas and savings behavior - econ-jobs.com · the economics of roscas and intra-household resource...
TRANSCRIPT

ROSCAs and Savings
Behavior A Woman's Individual Motives for Grouped
Participation in a Kenyan Slum
Justin Chin

1
Table of Contents
The Critical Review .................................................................................................................................... 2
What is a Rotating Saving and Credit Association? ................................................................................ 3
Origin ........................................................................................................................................................... 4
Introduction ................................................................................................................................................. 5
Theory and Hypotheses .............................................................................................................................. 5
Models, Empirical Predictions and Data Analysis ................................................................................... 6
Models ...................................................................................................................................................... 6
Empirical Predictions ........................................................................................................................... 11
Data Analysis ......................................................................................................................................... 13
Gauss Markov Assumptions: A1 through A6 ......................................................................................... 18
Biasedness and Unbiasedness ................................................................................................................... 19
Inferences ................................................................................................................................................... 20
Conclusion ................................................................................................................................................. 21
Works Cited ................................................................................................................................................ 22

2
The Critical Review
This is a critical review about a micro-financing institution (MFIs), which were
established to help empower poverty stricken villages in rural areas. They empower them by
instilling them with the skills and techniques needed in order to drastically improve their
methods of saving money and consumption so that they can better the lives of each other and
their families. The rural villages that these families live in generally lack the benefits of
industrialized banks, so MFIs are there to compensate for these shortcomings.
An MFI in particular called, Rotating Savings and Credit Associations (ROSCAs), has a
very interesting and successful method in doing so, as it promotes it's members to work as a
group and to partake in various teamwork related activities which when done with efficiency and
timely, it can benefit everybody involved. Everyone being the individual member, their
household and the entire village as a whole and in due time, hopefully, the entire country they
occupy. One way to think about ROSCAs is that it can be a trust game concerning tangible
currency and mental rewards.
The critical review in question is based on a study of ROSCAs in a slum village called
Kianda, which is located in Nairobi, Kenya. Siwan Anderson and Jean-Marie Baland are the
authors that conducted the case study, the title of their scholarly article is, "The Economics of
ROSCAs and Intra-household Resource Allocation," which in particular is about male and
female couples, with or without children, and their savings behavior among each other. The
focus is mainly on the woman or wife and their tendency to be predominant and proactive in
being a member of a ROSCA.
The critical review is going to consist of four segments pertaining to different topics that
will all in some way be connected. First, an introduction as to how a ROSCA operates and a brief
description about its origin in order to get a better understanding of where it came from. Second,
an introduction and overall review of the theories and data within the literature used to conduct
their observations. Third, the theories, empirical predictions and data that can and cannot be tied
into the world of econometrics with topics such as the hypothesis and alternative hypothesis, the
relation to the Gauss Markov Assumptions - A1 through A6 and how there could be violations,
biasedness and unbiasedness of the data, and inferences. Fourth, the summary and conclusion of
the critical review and article.

3
What is a Rotating Saving and Credit Association?
ROSCAs are an informal method of micro-financing and since it requires a group of
people, it has to be based on some kind of trust system, wherein there are many factors that can
benefit and hurt the outcome of that group. Mainly due to the fact that there are instances where
everybody knows each other in the group or they don't. There's also the instance that everybody
or grouped individuals within in a group knows each other and their personality or financial
behavior and that would be a deciding factor into whether or not those individuals decide to
participate in the ROSCA.
In these groups, people that would generally live in the same village gather on a set dates
throughout the year. During these gathering each member would contribute to a set amount of
money called a "pot" that is given as a lump sum to one of the contributors. The person
receiving the "pot" would subsequently be obligated to contribute to future pots. The process is
continued until everyone in the ROSCA received a "pot." The groups usually have various
methods in determining the amount of gatherings, contributions, group size and how the winner
is selected. For instance, they can draw lots where a winner is randomly selected or they can use
an auction method where the highest bidder would receive the "pot." Refer to Figure 1. below
for visualizations to how a ROSCA works.
Figure 1.
1
1 Simone Baldassarri. "Rotating Saving Groups" (2011). http://www.collaborativefinance.org/rosca/social-saving/
4
In Figure 1., John is the leader or the "winner" of the pot, since everyone, including himself
contribute $10, he would receive the sum of the $40. Continuing the cycle, Mark becomes the
leader and wins the pot, the cycle continues up until Carol (the last person) receives the pot. As
mentioned, if they decide to continue the group, how they determine who starts the cycle and
how much the contribution should be is up to them.
Origin
As mentioned earlier, a ROSCA is one institution among many in a network of MFIs.
Originally, the ROSCAs method of micro-financing was spun off from something called the
Grameen Model, which was established by the Grameen Bank, a bank establishment in India that
started from practically nothing. Its’ founder, Professor Muhammad Yunus created the Grameen
Bank in 1976 with just $27 to his name. Today, the Grameen Bank caters to 7 million
impoverished families by means of loans, savings, and insurance along with additional
services.2ROSCAs employ most of their methods from the Grameen Model, which is also based
on trust.
In the Grameen Model, the members are in a group, along with the inclusion of the bank
itself, as opposed to the ROSCA that doesn't use the bank, but a treasurer. First, potential
members living in rural villages for the group are screened by the bank, typically in groups of
five. Second, after the group has been selected, two potential predetermined members are
selected to borrow money from the bank, they are then observed for a month. Third, if the
potential members follow the guidelines set by the bank for the loan and pay their debt with
interest within 50 weeks, the bank then allows the remaining three members to borrow funds, of
course with adherence to their guidelines.3
However, there is also collateral involved within the Grameen Model. It comes from the
"collective responsibility" of the group, which happens from the two potential members of the
group that initiate the model. If one of them fails on their responsibilities the bank could disband
the entire group.4 When compared to ROSCAs, is that the initial "pot" comprises of each
2"Grameen Heritage" Grameen Foundation. Trademarks & Copyright © 1998 Grameen Communications., 23 Aug.
2011. Web. 18 May 2012. <http://www.grameenfoundation.org/who-we-are/grameen-heritage>. 3"Credit Lending Models."Grameen Bank. Trademarks & Copyright © 1998 Grameen Communications., 23 Aug.
2011. Web. 18 May 2012. <http://www.grameen-info.org/index.php?option=com_content>. 4"Credit Lending Models."Grameen Bank. Trademarks & Copyright © 1998 Grameen Communications., 23 Aug.
2011. Web. 18 May 2012. <http://www.grameen-info.org/index.php?option=com_content>.

5
individual member without the fear of the collateral, due to the fact that if a member defaults on
their contribution, the ROSCAs treasurer will make up for their default and consider it debt
among the remaining members until they can find a replacement.
Introduction
The Economics of ROSCAs and Intra-household Resource Allocation by Siwan
Anderson and Jean-Marie Baland, as mentioned earlier, is a study that was conducted in the slum
village of Kianda, from a rural area in Nairobi, Kenya. The focus of their study was to observe
the spending behaviors of the women in ROSCAs and whether or not they were in a civil union
with a male counterpart or not. They wanted to investigate into the reasoning as to why the
women were predominant in participating in a ROSCA. Their level of consumption and the
spending behaviors became their main focus for both men and women.
The authors cited a case study that was conducted by Hoddinott and Hadadd (1995, pg 5),
where men in African households would use more of their income on goods such as alcohol and
cigarettes. Contrary to men, the women would spend a majority of their income to satisfy the
needs of their children and household necessities.5They also cited a different case study where
"gender-based differences are most explicit in Africa, where it is commonly believed that men
have a right to personal spending money, which they are perceived to need or deserve, while
women's income is used for collective purposes."6The reasoning behind these behaviors is that
the men’s level of consumption is instant and is used recklessly or for personal gain, as opposed
to women who used their savings more beneficial to the family, which is the main study
conducted by the authors.
Theory and Hypotheses
In the article they state that their theory they give predicts "Income earning women are
more likely to save in ROSCAs if they are married." In other words, the wife in a marriage,
earning her own income is less likely to oppose her husband who also earns his own income
5Hoddinott, J., and L. Haddad. "Does Female Income Share Influence Household Expenditure? Evidence from Cote
D'Ivoire." Abstract. Oxford Bulletin of Economics and Statistics 57.1 (1995): 77-97. Online Journal. 6 Bruce, J. "Homes Divided." Abstract. World Development 17.7 (1989): 979-91. Online Journal.
6
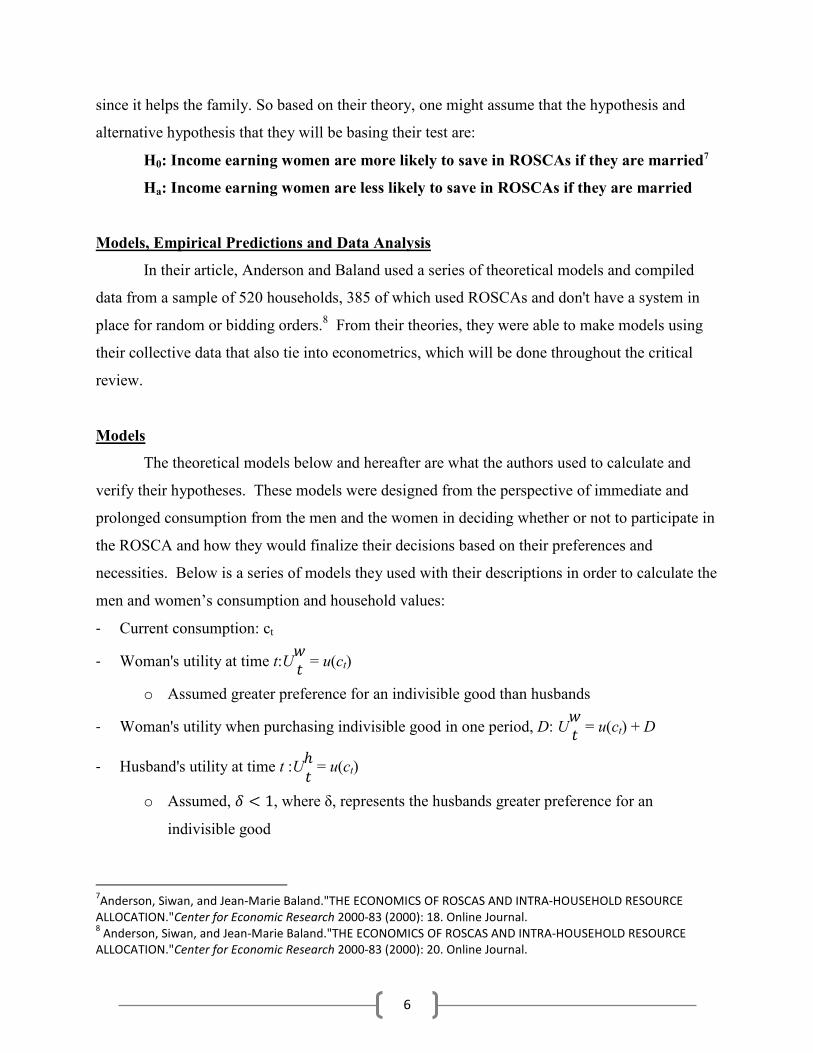
since it helps the family. So based on their theory, one might assume that the hypothesis and
alternative hypothesis that they will be basing their test are:
H0: Income earning women are more likely to save in ROSCAs if they are married7
Ha: Income earning women are less likely to save in ROSCAs if they are married
Models, Empirical Predictions and Data Analysis
In their article, Anderson and Baland used a series of theoretical models and compiled
data from a sample of 520 households, 385 of which used ROSCAs and don't have a system in
place for random or bidding orders.8 From their theories, they were able to make models using
their collective data that also tie into econometrics, which will be done throughout the critical
review.
Models
The theoretical models below and hereafter are what the authors used to calculate and
verify their hypotheses. These models were designed from the perspective of immediate and
prolonged consumption from the men and the women in deciding whether or not to participate in
the ROSCA and how they would finalize their decisions based on their preferences and
necessities. Below is a series of models they used with their descriptions in order to calculate the
men and women’s consumption and household values:
- Current consumption: ct
- Woman's utility at time t:U�
� = u(ct)
o Assumed greater preference for an indivisible good than husbands
- Woman's utility when purchasing indivisible good in one period, D: U�
� = u(ct) + D
- Husband's utility at time t :Uℎ
� = u(ct)
o Assumed, � < 1, where δ, represents the husbands greater preference for an
indivisible good
7Anderson, Siwan, and Jean-Marie Baland."THE ECONOMICS OF ROSCAS AND INTRA-HOUSEHOLD RESOURCE
ALLOCATION."Center for Economic Research 2000-83 (2000): 18. Online Journal. 8 Anderson, Siwan, and Jean-Marie Baland."THE ECONOMICS OF ROSCAS AND INTRA-HOUSEHOLD RESOURCE
ALLOCATION."Center for Economic Research 2000-83 (2000): 20. Online Journal.
7
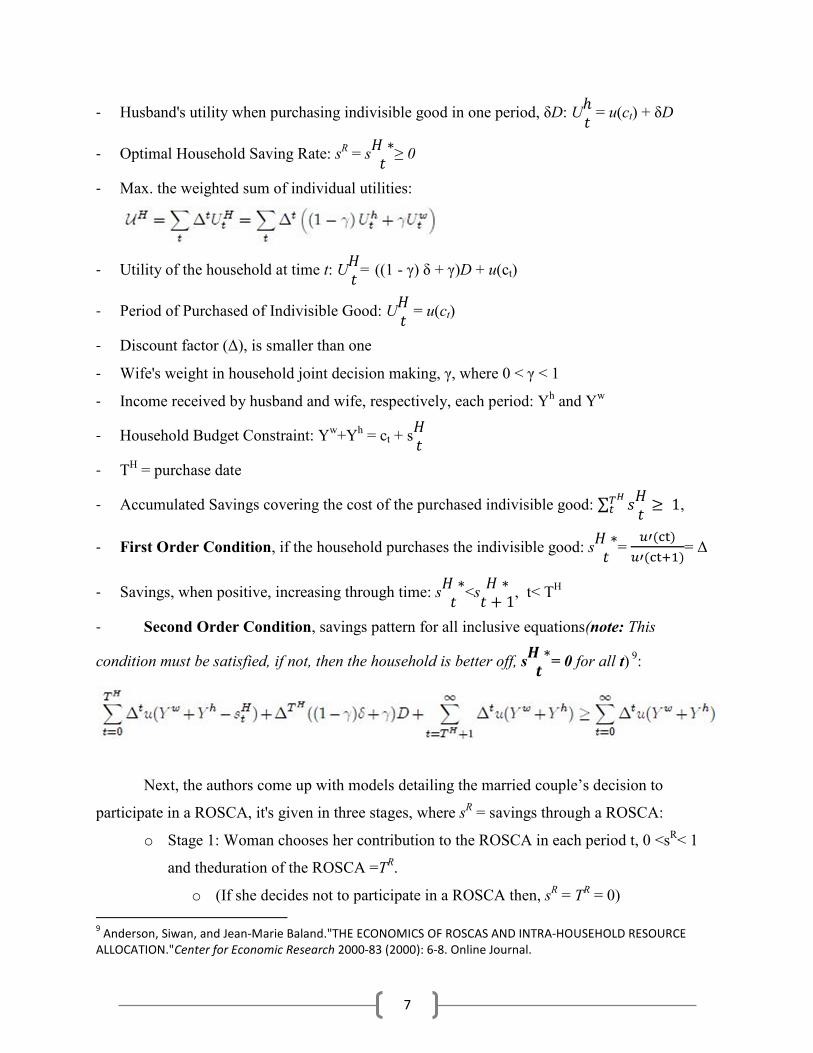
- Husband's utility when purchasing indivisible good in one period, δD: Uℎ
� = u(ct) + δD
- Optimal Household Saving Rate: sR = s� ∗
�≥ 0
- Max. the weighted sum of individual utilities:
- Utility of the household at time t: U�
�= ((1 - γ) δ + γ)D + u(ct)
- Period of Purchased of Indivisible Good: U�
� = u(ct)
- Discount factor (∆), is smaller than one
- Wife's weight in household joint decision making, γ, where 0 < γ < 1
- Income received by husband and wife, respectively, each period: Yh and Yw
- Household Budget Constraint: Yw+Yh = ct + s�
�
- TH = purchase date
- Accumulated Savings covering the cost of the purchased indivisible good: ∑ �
�� 1 �
� ,
- First Order Condition, if the household purchases the indivisible good: s� ∗
�=
������
��������= ∆
- Savings, when positive, increasing through time: s� ∗
�<s� ∗
� � 1, t< TH
- Second Order Condition, savings pattern for all inclusive equations(note: This
condition must be satisfied, if not, then the household is better off, s� ∗
�= 0 for all t) 9:
Next, the authors come up with models detailing the married couple’s decision to
participate in a ROSCA, it's given in three stages, where sR = savings through a ROSCA:
o Stage 1: Woman chooses her contribution to the ROSCA in each period t, 0 <sR< 1
and theduration of the ROSCA =TR.
o (If she decides not to participate in a ROSCA then, sR = TR = 0)
9 Anderson, Siwan, and Jean-Marie Baland."THE ECONOMICS OF ROSCAS AND INTRA-HOUSEHOLD RESOURCE
ALLOCATION."Center for Economic Research 2000-83 (2000): 6-8. Online Journal.

8
o Stage 2: the husband and wife jointly choose household savings in each period t,
o s�
�≥ 0.
o Stage 3: when t = TR, the women receives the pot and the household decides its use.
Stage 1, is the Optimal Household Savings Rate equal to the First Order Conditions and stage 2,
is where the Second Order Conditions need to be satisfied. Stage 3, represents the time of the
cycle to end so the ROSCA earnings can be given to another member in the group10.
Holding the second order condition constant, they were able to come up with an Optimal
Sequence in which, "the woman necessarily has an incentive to save, where she has a higher
preference for the durable good," such as food, clothing, and school supplies for the children.
Below are the models they used and descriptions:
- Woman's incentive to save: {s�
�}
- Optimal Sequence:
The authors then brings up a moral dilemma, in which the household decides not to "increase
present and future consumption" by saving up without a ROSCA and still consuming. However,
when the woman decides to jointly enter a ROSCA with the household, the dilemma then arises
as to how much their optimal contribution should be when they've already saved up to consume.
The model they then use is as follows11:
- Amount Saved: sR ≥ 0
- Add Extra Savings (to the ROSCA): σ�
� ≥ 0
- Household Dilemma:
o such that 1 = ∑ �� � σ�
� �
��� �
10
Anderson, Siwan, and Jean-Marie Baland."THE ECONOMICS OF ROSCAS AND INTRA-HOUSEHOLD RESOURCE
ALLOCATION."Center for Economic Research 2000-83 (2000): 8. Online Journal. 11
Anderson, Siwan, and Jean-Marie Baland."THE ECONOMICS OF ROSCAS AND INTRA-HOUSEHOLD RESOURCE
ALLOCATION."Center for Economic Research 2000-83 (2000): 9. Online Journal.

9
Thus, the authors state, that the woman ultimately solves the Household Dilemma by choosing
the Amount Saved (sR), thus giving the following model:
-
- Where σ� ∗
�, solves the household dilemma
Following the solution to the household dilemma, the authors come up with two
"propositions." The first is where the woman alwaysparticipates in a ROSCA, if the Optimal
Sequence (mentioned above) is satisfied12:
- Proposition 1: s� ∗
0<s
R< s
� ∗
!"
o Where the ROSCA contributions are constant over time, s� ∗
0
o Woman's Optimal Saving Pattern: s� ∗
!"
Therefore, a woman will always participate in a ROSCA if the amount saved (sR) is greater than
the expected contribution and less than her optimal saving pattern. They also provided a diagram
representing the propositionwith the wife and husband’s optimal savings schedule, sW for the
wife, and sH for the husband. Optimal Savings is represented by the sR line, which represents the
household total savings schedule (sR+ σ�
�), as noted earlier from the solution of the household
dilemma. The contribution of the extra household savings (σ�
�) is upward sloping.
12
Anderson, Siwan, and Jean-Marie Baland."THE ECONOMICS OF ROSCAS AND INTRA-HOUSEHOLD RESOURCE
ALLOCATION."Center for Economic Research 2000-83 (2000): 10. Online Journal.

10
Figure 2.: ROSCA Contributions and Optimal Saving Schedule13
The second proposal where the household decides to save, thus makes her ROSCA
contribution constant on the lower values, represented by gamma (γ), of her weight in the
household decision making and decreasing for higher values of γ. Recall that the joint household
savings is {s�
�}, from that the authors introduce the idea of "stock of savings," Sk. Where Sk is
greater than zero, but less than 1(0 <Sk< 1), and household savings are greater than 1,
represented as {s�
�}> 1. Thus, creating the following model for proposition 214:
- Proposition 2:
o m∗
� is part of the "optimal dissaving pattern", therefore
o Sk+ ∑ �# �
��� = 1 and∑$�∗ = Sk
The authors state that due to proposition 2, "given sufficient accumulated ROSCA savings, the
household will decide to save to buy the durable goods, instead of consuming it through an
13
Anderson, Siwan, and Jean-Marie Baland."THE ECONOMICS OF ROSCAS AND INTRA-HOUSEHOLD RESOURCE
ALLOCATION."Center for Economic Research 2000-83 (2000): 11. Online Journal. 14
Anderson, Siwan, and Jean-Marie Baland."THE ECONOMICS OF ROSCAS AND INTRA-HOUSEHOLD RESOURCE
ALLOCATION."Center for Economic Research 2000-83 (2000): 12. Online Journal.

11
optimal dis-saving pattern $�∗ . It may even decide to contribute additional extra savings to the
amounts thus accumulated."
They also give an alternative to equation to proposition 2, in the event that accumulated
savings exceeds one, the household could elect to buy the durable goods and use the excess
savings for consumption. Therefore, Sk> 1 and %�∗ ≥ 0, where15:
and
∑%�∗ = Sk - 1 and ∑$�
∗ = Sk
Empirical Predictions
The empirical predictions presented by Anderson and Balandpositions around the idea
that women strategically participate in ROSCAs in order to protect their income from immediate
consumption by their husbands.
Before the authors get into what their predictions are, they give "relevant considerations"
as to how participating in a ROSCA would be worthwhile if the benefits outweigh the certain
cost, such as, her "weight in household decision making being positively related to her individual
income, or more precisely, to her share in household income, α, where α = &'
&'�&(," with
households under consideration, "women only have access to their own income," and that by
participating in a ROSCA it "implies some fixed cost in terms of meeting attendance and other
social obligations towards the other members of the group." From that, they were able to create
two "conjectures," in other words inferences, which will be discussed in the later in the segment.
The two conjectures are16:
1. Conjecture 1.: The relationship between the probability of joining a ROSCA and female
relative income share, α, is an inverted-U shape
2. Conjecture 2.: ROSCA contributions are non-increasing in α [income share], and even
strictly decreasing for α [income share] high enough.
15
Anderson, Siwan, and Jean-Marie Baland."THE ECONOMICS OF ROSCAS AND INTRA-HOUSEHOLD RESOURCE
ALLOCATION."Center for Economic Research 2000-83 (2000): 13. Online Journal. 16
Anderson, Siwan, and Jean-Marie Baland."THE ECONOMICS OF ROSCAS AND INTRA-HOUSEHOLD RESOURCE
ALLOCATION."Center for Economic Research 2000-83 (2000): 15. Online Journal.
12
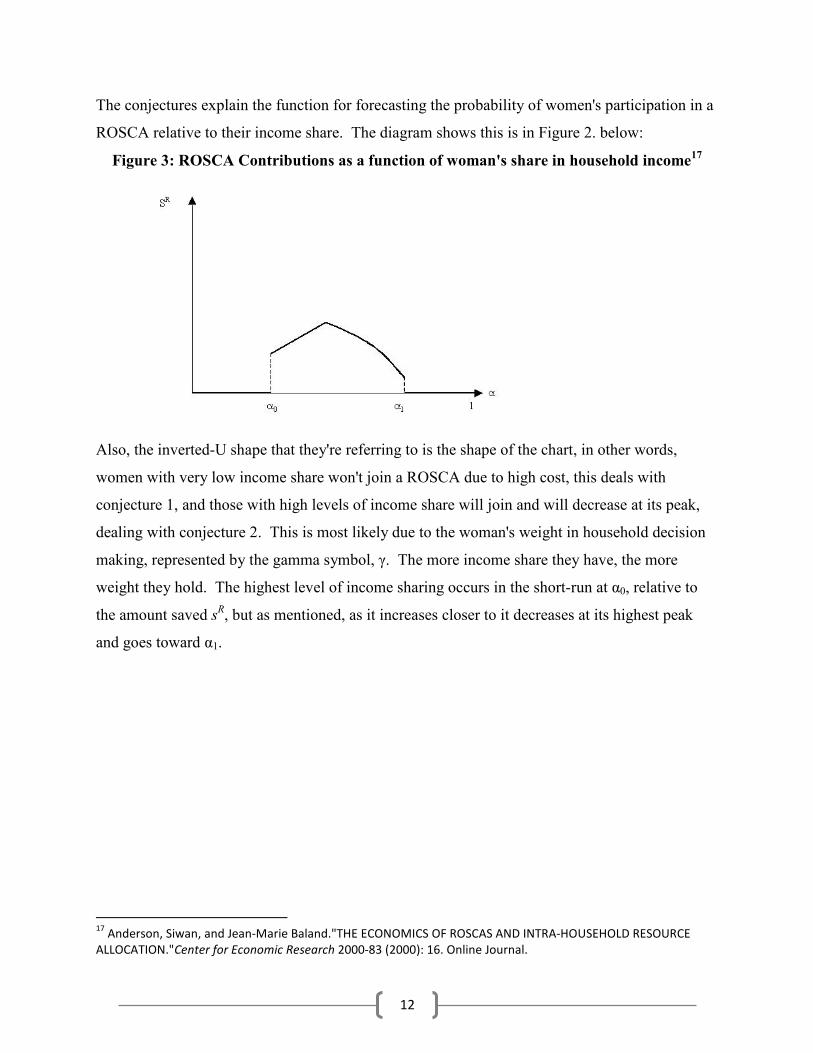
The conjectures explain the function for forecasting the probability of women's participation in a
ROSCA relative to their income share. The diagram shows this is in Figure 2. below:
Figure 3: ROSCA Contributions as a function of woman's share in household income17
Also, the inverted-U shape that they're referring to is the shape of the chart, in other words,
women with very low income share won't join a ROSCA due to high cost, this deals with
conjecture 1, and those with high levels of income share will join and will decrease at its peak,
dealing with conjecture 2. This is most likely due to the woman's weight in household decision
making, represented by the gamma symbol, γ. The more income share they have, the more
weight they hold. The highest level of income sharing occurs in the short-run at α0, relative to
the amount saved sR, but as mentioned, as it increases closer to it decreases at its highest peak
and goes toward α1.
17
Anderson, Siwan, and Jean-Marie Baland."THE ECONOMICS OF ROSCAS AND INTRA-HOUSEHOLD RESOURCE
ALLOCATION."Center for Economic Research 2000-83 (2000): 16. Online Journal.
13
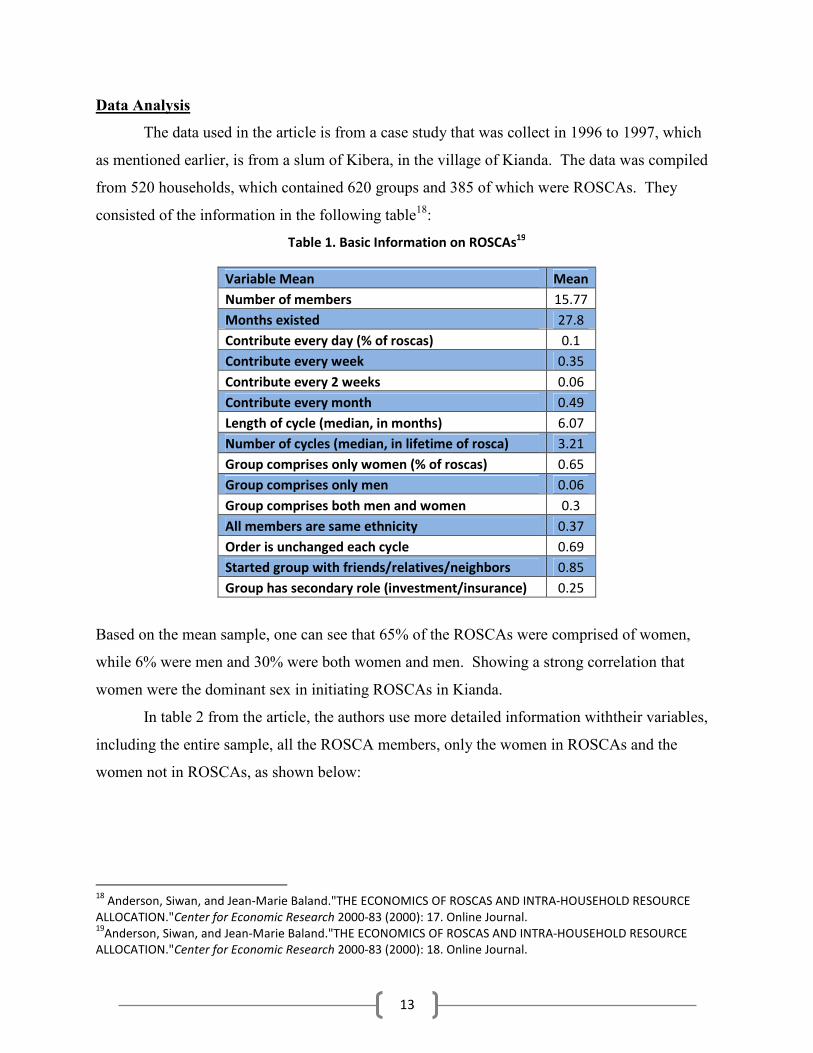
Data Analysis
The data used in the article is from a case study that was collect in 1996 to 1997, which
as mentioned earlier, is from a slum of Kibera, in the village of Kianda. The data was compiled
from 520 households, which contained 620 groups and 385 of which were ROSCAs. They
consisted of the information in the following table18:
Table 1. Basic Information on ROSCAs19
Variable Mean Mean
Number of members 15.77
Months existed 27.8
Contribute every day (% of roscas) 0.1
Contribute every week 0.35
Contribute every 2 weeks 0.06
Contribute every month 0.49
Length of cycle (median, in months) 6.07
Number of cycles (median, in lifetime of rosca) 3.21
Group comprises only women (% of roscas) 0.65
Group comprises only men 0.06
Group comprises both men and women 0.3
All members are same ethnicity 0.37
Order is unchanged each cycle 0.69
Started group with friends/relatives/neighbors 0.85
Group has secondary role (investment/insurance) 0.25
Based on the mean sample, one can see that 65% of the ROSCAs were comprised of women,
while 6% were men and 30% were both women and men. Showing a strong correlation that
women were the dominant sex in initiating ROSCAs in Kianda.
In table 2 from the article, the authors use more detailed information withtheir variables,
including the entire sample, all the ROSCA members, only the women in ROSCAs and the
women not in ROSCAs, as shown below:
18
Anderson, Siwan, and Jean-Marie Baland."THE ECONOMICS OF ROSCAS AND INTRA-HOUSEHOLD RESOURCE
ALLOCATION."Center for Economic Research 2000-83 (2000): 17. Online Journal. 19
Anderson, Siwan, and Jean-Marie Baland."THE ECONOMICS OF ROSCAS AND INTRA-HOUSEHOLD RESOURCE
ALLOCATION."Center for Economic Research 2000-83 (2000): 18. Online Journal.

14
Table 2: Characteristics of the population, rosca participants, female rosca participants and non-
participants20
All Sample
ROSCA
Members
Women in
ROSCAS
Women Not In
ROSCAS
Variable Mean
Std.
Error Mean
Std.
Error Mean
Std.
Error Mean
Std.
Error
Participation in ROSCA 0.25 0.44 1 1 0
Total Monthly ROSCA
Contribution 0 702 821 686 835 0
Female 0.53 0.5 0.84 0.37 1 1
Age 29.4 9.6 32.5 8.4 32.16 8.32 25.05 8.96
Married 0.59 0.49 0.71 0.46 0.7 0.46 0.42 0.49
Earns Labor Income 0.58 0.49 0.76 0.43 0.73 0.45 0.3 0.46
Has at least primary school 0.57 0.49 0.47 0.5 0.44 0.5 0.49 0.5
Monthly individual income
if work 5389 5406 5290 6714 5019 7115 3182 3546
Household monthly income 8009 9207 8370 9456 8998 9330 8030 9337
Monthly food expenditures 5250 3031 4976 2761 5030 2787 5377 3038
Monthly luxury
expenditures 368 723 367 700 324 670 307 665
Monthly children
expenditures 1761 2550 1862 2902 1892 2778 1867 2598
Household size 5.05 2.14 4.8 2.1 4.96 2.01 5.2 2.12
Number of Children 2.21 1.63 2.3 1.6 2.41 1.55 2.24 1.57
Years in Kibera 7.6 6.19 7.96 5.84 10.01 7.07 8.77 7.63
Native Language: Kikuyu 0.23 0.42 0.24 0.43 0.26 0.44 0.26 0.44
Native Language: Luhya 0.18 0.39 0.17 0.38 0.17 0.37 0.19 0.39
Native Language: Luo 0.4 0.49 0.38 0.49 0.4 0.49 0.35 0.48
Native Language: Kamba 0.06 0.23 0.07 0.26 0.05 0.22 0.05 0.22
Native Language: Kisii 0.1 0.3 0.1 0.29 0.08 0.27 0.09 0.29
Number of Observations 1269 324 271 406
In this table, the sample of the 520 households represented 2300 individuals, but in order to be
consistent with the study those that were younger than 16 years old were excluded, thus
decreasing the overall sample size and number of individuals to 1300. Excluding people
younger than 16 was done to account for biasedness in the study, as the youngest age for
marriage in Kenya is 16, thus excluding couples which are most likely not in a binding marriage
20
Anderson, Siwan, and Jean-Marie Baland."THE ECONOMICS OF ROSCAS AND INTRA-HOUSEHOLD RESOURCE
ALLOCATION."Center for Economic Research 2000-83 (2000): 20. Online Journal.

15
younger than that age. In creating the biasedness, what they did is effectively separate the people
that are able to get married from those that can't by law and in doing so they increased the
efficiency of the study.
Furthermore, based on the table they were able to confirm that school fees were the
largest expenditure, which accounted for 36%, while rent 22%, clothing 18% and medical costs
12%. Also noted by the authors, was that in ROSCAs, people that are "females, working, and
married" have a higher proportion rate in a ROSCA when compared to the "average individual."
Thus, married women earning an individual income have the higher savings rate, holding the
average number of children and income level constant within the two groups, ceteris paribus.21
Table 3: Probit Estimation of ROSCA Participation22
Variable δF/δX S. E. δF/δX S. E.
Female 0.222 0.04 0.223 0.04
Couple -0.123 0.05 -0.123 0.05
Female x Couple 0.18 0.073 0.176 0.073
Food Expenses 8.95E-06 1.20E-05 -8.93E-06 1.25E-05
(Food Expenses)2 1.75E-10 7.65E-10 1.73E-10 7.65E-10
Female Share of Couple Income 1.038 0.199
(Female Share of Couple Income)2 -1.097 0.243
Lived in Kibera for at Most 2 Years -0.085 0.03 -0.086 0.03
Number of Children -0.0113 0.0087 -0.0115 0.0087
Primary School Degree -0.032 0.026 -0.032 0.026
Age 0.0543 0.008 0.0546 0.008
(Age)2 -6.20E-04 1.10E-04 -6.20E-04 1.10E-04
Kikuyu -3.40E-04 0.042 -3.90E-04 0.042
Luhya 0.0234 0.045 0.0221 0.045
Luo 0.0021 0.038 0.0017 0.038
Kamba 0.191 0.077 0.193 0.077
Female Income Share > 0 & 20% 0.172 0.13
Female Income Share > 20 & 40% 0.278 0.071
Female Income Share > 40 & 80% 0.301 0.084
Female Income Share > 80 & 100% -0.048 0.083
Number of Observations 1267 1267
Psuedo R2 0.29 0.29
21
Anderson, Siwan, and Jean-Marie Baland."THE ECONOMICS OF ROSCAS AND INTRA-HOUSEHOLD RESOURCE
ALLOCATION."Center for Economic Research 2000-83 (2000): 20. Online Journal. 22
Anderson, Siwan, and Jean-Marie Baland."THE ECONOMICS OF ROSCAS AND INTRA-HOUSEHOLD RESOURCE
ALLOCATION."Center for Economic Research 2000-83 (2000): 24. Online Journal.

16
As you can see with the Psuedo R2in the Probit Estimation, the score is 0.29 and since it has a
low value, between 0 and 1, this would indicate that there's a low fit in the regression model.
This might be from the biasedness that was conducted from the exclusion of anyone younger
than 16, but one might not be too sure as that's not indicated.
In addition, it's not a true predictor of the outcome of either estimation, since the
interpretation of the ordinary least squares (OLS) for R2 is different for Pseudo R2's that would
indicate a different variation of the regression model used. In other words, the model they used
wasn't, R2 = 1 -∑ �)*+)
,�-.*/0
∑ �)*+)�-.
*/0
, but instead used one with different y variables, unfortunately the
Pseudo R2 predictor was not disclosed in the article.
Furthermore, based on the first estimation, they created a plot chart depicting the
"predicted values of ROSCA participation rates" in comparison to the "female income shares and
for the average levels of all other variables." The "average levels of all other variables" could be
accounted for as adding to the unbiasedness in the study as well. The chart below shows that at
the highest level of "ROSCA participation" is when the "female income share" is at its mean,
then dips (likely due to the squared terms adding a decreasing marginal effect) and makes the
inverted-U shape. This chart also closely resembles a Standard Normal Distribution and also
confirms their theoretical analysis of conjectures 1 and 223:
23
Anderson, Siwan, and Jean-Marie Baland."THE ECONOMICS OF ROSCAS AND INTRA-HOUSEHOLD RESOURCE
ALLOCATION."Center for Economic Research 2000-83 (2000): 25. Online Journal.
17
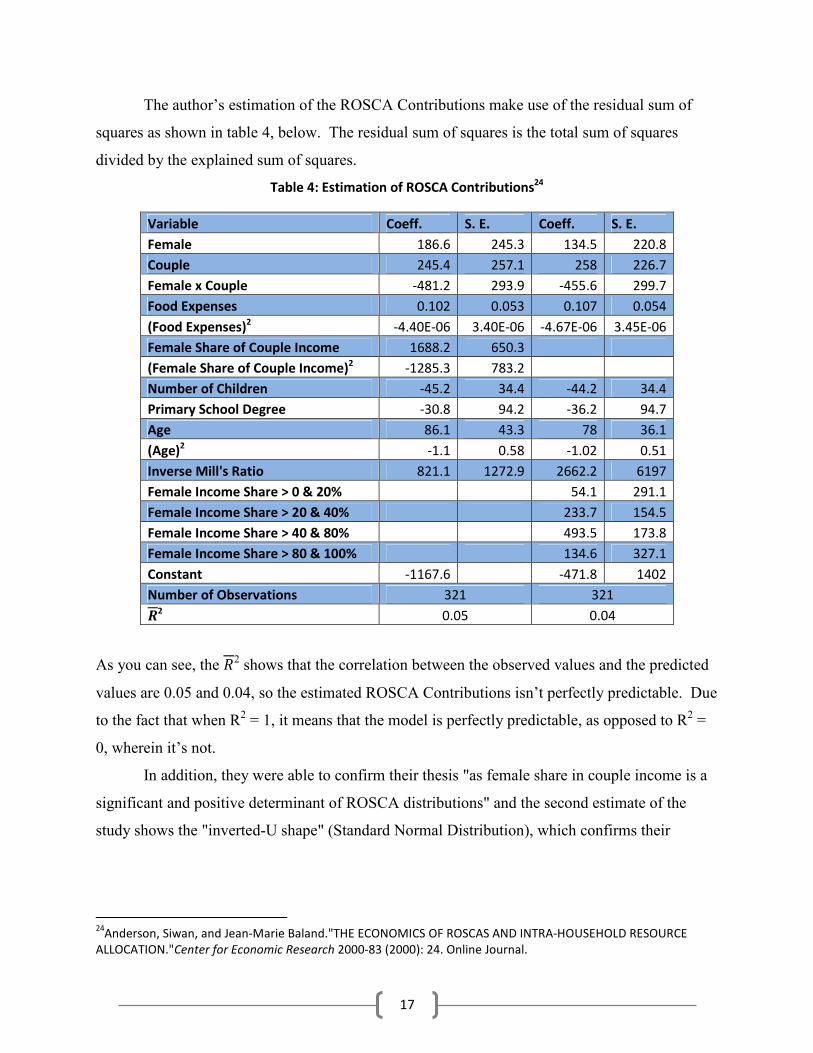
The author’s estimation of the ROSCA Contributions make use of the residual sum of
squares as shown in table 4, below. The residual sum of squares is the total sum of squares
divided by the explained sum of squares.
Table 4: Estimation of ROSCA Contributions24
Variable Coeff. S. E. Coeff. S. E.
Female 186.6 245.3 134.5 220.8
Couple 245.4 257.1 258 226.7
Female x Couple -481.2 293.9 -455.6 299.7
Food Expenses 0.102 0.053 0.107 0.054
(Food Expenses)2 -4.40E-06 3.40E-06 -4.67E-06 3.45E-06
Female Share of Couple Income 1688.2 650.3
(Female Share of Couple Income)2 -1285.3 783.2
Number of Children -45.2 34.4 -44.2 34.4
Primary School Degree -30.8 94.2 -36.2 94.7
Age 86.1 43.3 78 36.1
(Age)2 -1.1 0.58 -1.02 0.51
Inverse Mill's Ratio 821.1 1272.9 2662.2 6197
Female Income Share > 0 & 20% 54.1 291.1
Female Income Share > 20 & 40% 233.7 154.5
Female Income Share > 40 & 80% 493.5 173.8
Female Income Share > 80 & 100% 134.6 327.1
Constant -1167.6 -471.8 1402
Number of Observations 321 321
12 0.05 0.04
As you can see, the 22 shows that the correlation between the observed values and the predicted
values are 0.05 and 0.04, so the estimated ROSCA Contributions isn’t perfectly predictable. Due
to the fact that when R2 = 1, it means that the model is perfectly predictable, as opposed to R2 =
0, wherein it’s not.
In addition, they were able to confirm their thesis "as female share in couple income is a
significant and positive determinant of ROSCA distributions" and the second estimate of the
study shows the "inverted-U shape" (Standard Normal Distribution), which confirms their
24
Anderson, Siwan, and Jean-Marie Baland."THE ECONOMICS OF ROSCAS AND INTRA-HOUSEHOLD RESOURCE
ALLOCATION."Center for Economic Research 2000-83 (2000): 24. Online Journal.

18
theoretical analysis, conjectures 1 and 2. The second estimation is displayed in the diagram
below25:
Gauss Markov Assumptions: A1 through A6
As for the Gauss Markov Assumptions, if one were to find violations in the data, they
would use the Gauss Markov Assumptions as their guideline, more importantly a violation in
unbiasedness (A4), which would be the most prevalent in its detection. Although, the article
doesn’t explicitly give them, the assumptions below are implied or perceived as being so from
the given information in the article:
- A1. Linearity in Parameters: The relationships between the variables are linear due to
the fact that each variable is assigned a constant coefficient in the regression model.
- A2. Random Sampling:Random Sampling was performed as stated by the authors in the
article, “households, selected through a random process, were interviewed over the
course of 4months during the spring of 1997. All household members were first surveyed
for information ontheir education, work activity, and income.” Pg17
25
Anderson, Siwan, and Jean-Marie Baland."THE ECONOMICS OF ROSCAS AND INTRA-HOUSEHOLD RESOURCE
ALLOCATION."Center for Economic Research 2000-83 (2000): 27. Online Journal.

19
- A3. No Perfect Collinearity/Multicollinearity: The first estimation in Table 3.for the
correlation coefficients and the standard error contain no perfect collinearity. However,
the second estimation contained dummy variables as apparent by the absence of “Female
Share of Couple Income” and “(Female Share of Couple Income)2” from the regression.
- A4. Zero Conditional Mean (Unbiasedness), E[u|x] = 0: The sample comprised of
individuals participating and not participating in ROSCAs, married or not and all
individuals in the study were over the age of 16 and can be legally married by law. All
individuals in the sample passed all needed requirements, allowing them to be or not be
married, with or without children and participating or not participating in a ROSCA.
- A5. Homoskedasticity: The sample is homoskedastic as the random variables included
unbiased estimators in the model. There is homogeneity of the variance in the sample as
there is a consistency in the standard deviations. Although the authors make no mention
of the Breusch-Pagan test to verify this, the standard errors are constant. Thus, showing
the absence of hetersokedasticity.
- A6. Normality of the Error Term: There is no mention of the normality of the
error/residual term in the article, but one might assume that since there are minimal
variations within the data, aside some very few outliers, that they aren’t significant
enough to cause a problem, seeing as how there is no loss of unbiasedness.
Biasedness and Unbiasedness
Stated by the authors, “as a result, we have decided to consider all groups with a ROSCA
as one of their activities in our sample. The alternative would have been to consider groups,
which are only ROSCAs, but this could have led to a serious bias. In particular, in the survey, all
possible alternative functions of the groups were carefully mentioned, even when the latter was
clearly of secondary concern for the respondent.” Although, there isn’t any statistical data
showing unbiasedness, the sampled data took information from participants in micro-financing
institutions there were part of a ROSCA and not part of one, thus eliminating the concern for a
biased sample.
However, as mentioned earlier, the only type of biasedness in the study was the exclusion
of the people younger than 16 years of age. Granted, they wanted to include people that were in
civil union or married with a family, that were or were not in a ROSCA, but that's not to say that

20
people younger than 16 could be couples, have children and be in a ROSCA or vice versa. Only
for the fact that they were following the age restrictions set by the law helps to prove the
unbiasedness, otherwise it would be biased.
Inferences
As mentioned earlier, the conjectures 1 and 2 that the authors gave earlier were the
inferences that they based on the evidence from the empirical predictions. To recall the
conjectures or inferences are as follows26:
1. Conjecture 1.: The relationship between the probability of joining a ROSCA and female
relative income share, α, is an inverted-U shape
2. Conjecture 2.: ROSCA contributions are non-increasing in α [income share], and even
strictly decreasing for α [income share] high enough.
According to the article, the inferences they made were based on the woman's weighted
household decision making(γ). This was based on four levels of possibilities, from very small,
small, medium and large27:
- The very small γ, doesn't take reference from anything due to the fact no matter the
amount accumulated, the household doesn't want to buy the durable good and they don't
want to participate in a ROSCA.
- They take the small γ inference, from proposition 2, where accumulated savings exceed
one, as in the equation below:
This is where the wife needs to already have a large enough savings in order to convince
her husband to participate.
- The medium γ, draws inference directly from proposition 2 when it corresponds to a
stock of savings and the household savings path, given the condition that a high enough
stock may influence to save in future periods, recall the equation for Sk and :
26
Anderson, Siwan, and Jean-Marie Baland."THE ECONOMICS OF ROSCAS AND INTRA-HOUSEHOLD RESOURCE
ALLOCATION."Center for Economic Research 2000-83 (2000): 15. Online Journal. 27
Anderson, Siwan, and Jean-Marie Baland."THE ECONOMICS OF ROSCAS AND INTRA-HOUSEHOLD RESOURCE
ALLOCATION."Center for Economic Research 2000-83 (2000): 14. Online Journal.

21
- Large γ, is based on proposition 2 and gets inference from the likelihood of the household
willing to buy durable goods, but the ROSCA is utilized by the wife to increase the
savings rate for the family, being that condition below is met
Conclusion
The contributions in economic development that Rotating Savings and Credit
Associations apply to families in rural villages can be both beneficial to everyone in a family.
The observation that Siwan Anderson and Jean Marie-Baland they did in Kianda concerning the
savings behavior of a woman's ability to join a ROSCA and the factors that come into play as to
why and how they do so was very well detailed and calculated. Most prominently in the
woman's ability to benefit at their husbands expense by convincing them to contribute.
The fact they were able to demonstrate a woman's weighted decision in a household
relative to her husband's based on their shared income, along with her bargaining influence, and
both of their consumption preference levels in the village showed that they correct in their
theories and hypothesis were correct, from their models, and data with their demonstration of
inverted-U shapes charts (standard normal distribution curves). In doing so, they were able to
exhibit not only the importance of ROSCAs as a saving mechanism for rural villages, but also
their importance to the woman that stand to benefit most from using them, especially those in
marriages. They provide a higher accumulation of money that can be used for consumption at a
much faster rate when working in a group, as opposed not working in a group.
More rural villages and countries around the world should make use of ROSCAs as it has
the potential to drive them out of poverty, increasing the quality of life. On a different note, it
would be interesting to see how a ROSCA might work in poor suburban neighborhoods. The
results could be just as rewarding.

22
Works Cited
1. Anderson, Siwan and Baland, Jean-Marie, The Economics of Roscas and Intra-Household
Resource Allocation (July 2000). CentER Working Paper No. 2000-83. Available at SSRN:
http://ssrn.com/abstract=244530 or http://dx.doi.org/10.2139/ssrn.244530
2. Simone Baldassarri. "Rotating Saving Groups" (2011).
http://www.collaborativefinance.org/rosca/social-saving/
3. Grameen Heritage" Grameen Foundation. Trademarks & Copyright © 1998 Grameen
Communications., 23 Aug. 2011. Web. 18 May 2012.
<http://www.grameenfoundation.org/who-we-are/grameen-heritage>.
4. Credit Lending Models."Grameen Bank. Trademarks & Copyright © 1998 Grameen
Communications., 23 Aug. 2011. Web. 18 May 2012. <http://www.grameen-
info.org/index.php?option=com_content>.
5. Hoddinott, J., and L. Haddad. "Does Female Income Share Influence Household Expenditure?
Evidence from Cote D'Ivoire." Abstract. Oxford Bulletin of Economics and Statistics 57.1 (1995):
77-97. Print.
6. Bruce, J. "Homes Divided." Abstract. World Development 17.7 (1989): 979-91. Print.