root cause evaluation manual, revision 0. · pareto analysis troubleshooting/failure analysis fault...
TRANSCRIPT
NMC Committed to Nuclear Excellence
Revision: 0
Effective Date: 6/14/2002
Title: ROOT CAUSE EVALUATION MANUAL
Approval:
Director Performance Assessment
This manual is intended as a guidance document to the sites. Its use is recommended, but not mandatory.
I
INIVIL. 1(00 L-ause Lvaluation Manual
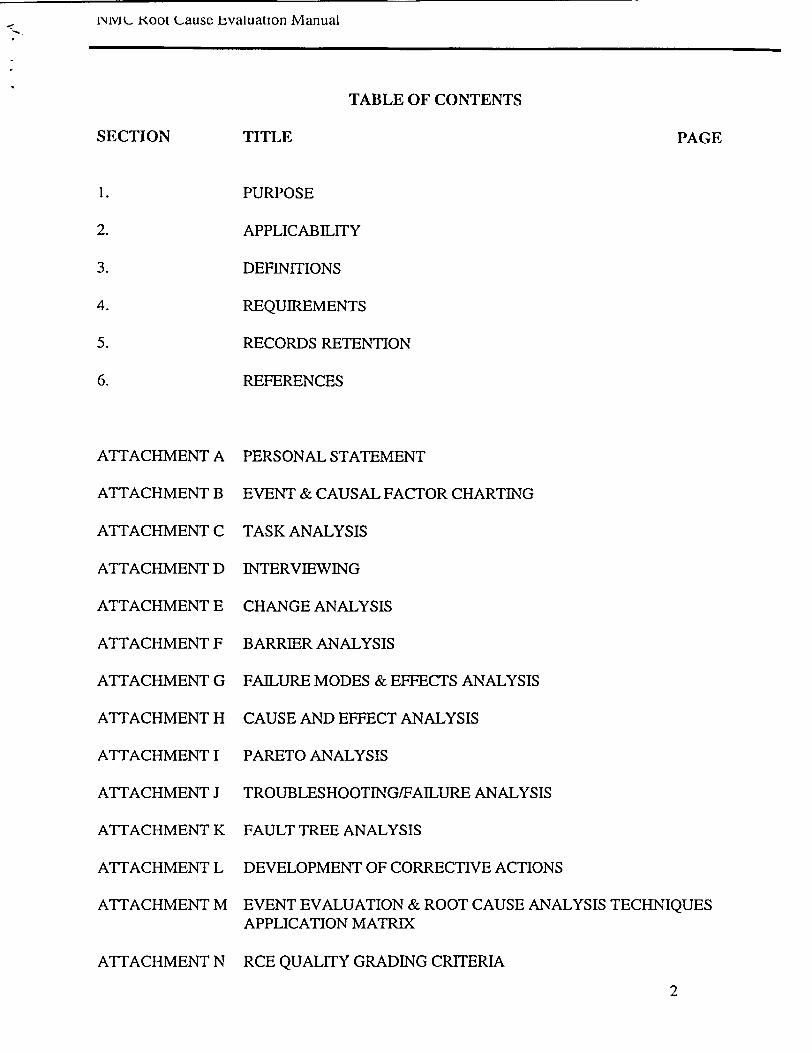
TABLE OF CONTENTS
SECTION
1.
2.
3.
4.
5.
6.
ATTACHMENT A
ATTACHMENT B
ATTACHMENT C
ATTACHMENT D
ATTACHMENT E
ATTACHMENT F
ATTACHMENT G
ATTACHMENT H
ATTACHMENT I
ATTACHMENT J
ATTACHMENT K
ATTACHMENT L
ATTACHMENT M
ATTACHMENT N
TITLE PAGE
PURPOSE
APPLICABILITY
DEFINITIONS
REQUIREMENTS
RECORDS RETENTION
REFERENCES
PERSONAL STATEMENT
EVENT & CAUSAL FACTOR CHARTING
TASK ANALYSIS
INTERVIEWING
CHANGE ANALYSIS
BARRIER ANALYSIS
FAILURE MODES & EFFECTS ANALYSIS
CAUSE AND EFFECT ANALYSIS
PARETO ANALYSIS
TROUBLESHOOTING/FAILURE ANALYSIS
FAULT TREE ANALYSIS
DEVELOPMENT OF CORRECTIVE ACTIONS
EVENT EVALUATION & ROOT CAUSE ANALYSIS TECHNIQUES APPLICATION MATRIX
RCE QUALITY GRADING CRITERIA
2

NML- Root Cause Evaluation Manual
ATTACHMENT 0
ATTACHMENT P
ATTACHMENT Q
ROOT CAUSE ANALYSIS PACKAGE COMPLETION CHECKLIST
EFFECTIVENESS REVIEWS
RCE REPORT TEMPLATE
3

NMC Root Cause Evaluation Manual
1. PURPOSE
1.1. The purpose of this document is to provide guidance for personnel to effectively identify the root cause(s) of problems to ensure proper corrective actions to prevent recurrence are implemented.
1.2. This document provides guidance and tools for an investigator to determine a root cause of an event. It is the investigators' responsibility to select the most appropriate analysis technique, whether covered by this guide or not, that will identify the root cause(s).
2. APPLICABILITY
2.1. It is the responsibility of NMC personnel conducting a Root Cause Evaluation (RCE) to ensure that the investigation is performed in compliance with applicable station procedures or controls. This guideline establishes the framework for standards and expectations regarding Root Cause Evaluation performance to ensure consistency, thoroughness and quality.
3. DEFINITIONS
3.1. Causal Factors: The potentially influencing conditions or elements that were present when a condition adverse to quality occurred that may have led to or contributed to the root or contributing cause(s).
3.2. Corrective Action: Should meet the following criteria
* Action taken to correct discrepant conditions and to prevent recurrence of an identified adverse condition or trend.
* Corrective action shall be implementable by reasonable action. * Shall consider the industry standards for performance. * Should be cost effective
3.3. Corrective Action to Prevent Recurrence (CATPR): Actions taken to address the Root Cause of a significant event identified in a Root Cause Evaluation.
3.4. Root Cause Evaluation (RCE): An analysis technique that identifies the cause of a problem or condition. The Root Cause is the most fundamental cause, that when eliminated, will correct the problem and prevent recurrence.
3.5. Contributing Cause: Causes that, if corrected would not by themselves have prevented the event, but are important enough to be recognized as needing corrective action to improve the quality of the process or product.
3.6. Root Cause: Identified cause(s) that, if corrected, will prevent recurrence of a condition adverse to quality.
3.7. Root Cause Investigator (RCI): A qualified individual assigned to perform a root cause evaluation.
4

INIMV Root Cause Evaluation Manual
3.8. Failure Mode: An event causal factor that when identified will help identify the Root Cause(s) and Contributing Cause(s) for an event.
3.9. Common Cause Assessment (CCA): An assessment method used to identify the Root Cause(s) and Contributing Cause(s) for a number of similar events. Usually initiated based on a declining or adverse trend, the analysis generally uses a variety of statistical analyses, interviews, and surveys to help to determine the Root Cause(s) of the adverse trend.
3.10. Equipment Failure Root Cause Evaluation (RCE): An assessment of equipment failures where the failure modes are the result of material, design, or similar equipment-related defects or natural phenomenon (e.g., tornado, lightning). This should include Maintenance Rule failures and should consider Human Error or Organizational/Programmatic Breakdown failure modes.
4. REQUIREMENTS
NOTE: Preservation of physical evidence and important information is necessary to determine root causes. Investigators should plan activities so that physical evidence and other important information is not altered, destroyed, or lost. Preservation of evidence must not interfere with or delay placing the plant or systems in a safe condition.
NOTE: The root cause investigator must not become distracted by event recovery activities. Investigators should communicate effectively with recovery team members, but stay focused on investigation and root cause analysis.
4.1. A root cause investigator should refer to this guide as appropriate, while performing evaluations. The intent of the guide is to improve the efficiency and effectiveness of evaluations.
4.2. If station management has determined that a Root Cause Evaluation is required, Management should appoint a leader who will conduct the investigation. A charter should be established, containing the following elements:
"* The scope and intent of the investigation should be defined and should be consistent with the severity of the event.
"• The authority of the investigator should be defined in relation to scope changes, priority of interviews, commanding internal and external support services, etc.
4.3. The charter should identify the composition of the investigation team.
5

Ivvit. Root Cause Evaluation Manual
4.4. RCE Preparation
4.4.1. Initiate the preparation process as soon as practicable after the evaluation is assigned. The following points should be helpful to the investigator to better plan the evaluation.
"* Determine the scope of the evaluation with the appropriate line manager. "* When planning the evaluation, consider who should be interviewed and any schedule
constraints that may impact the interviews (e.g., shift workers). "• If support from another department is involved, give them early notification. "* Give early consideration to the need to correspond with outside organizations such as
vendors, EPRI, other utilities, etc., if needed to support the evaluation. Sometimes information requests and inquiry responses can take several days or weeks. NOMIS and Nuclear Network are two industry information exchange media for requesting information from other utilities who may have experienced similar events.
"* Identify or define the station acceptable performance criterion that meets or exceeds applicable Industry Standards and Regulations.
"* If performing an RCE on an incident that involves chemicals or chemical processes, contact Industrial Health and Safety to ensure compliance with OSHA 1910.
4.4.2. The estimated number of man-hours expended for completion of a RCE is as follows: "* Common Cause = 100 - 700 (Hours may vary greatly based on extent of problem/size
of team). "* Root Cause = 40 to 80 (significant management review and revision may extend this).
4.5. RCE Information Gathering
4.5.1. The investigator should gather information and data relating to the event/problem. This includes physical evidence, interviews, records, and documents needed to support the root cause. Some typical sources of information which may be of assistance include the following:
"* Operating logs "* Maintenance records "• Inspection reports "* Procedures and Instructions "• Vendor Manuals "* Drawings and Specifications "* Equipment History Records "* Strip Chart Recordings "* Trend Chart Recordings "* Sequence of Event Recorders "* Radiological Surveys "• Plant Parameter Readings "* Sample Analysis and Results "• Correspondence "* Design Basis Information
6

NML Root Cause Evaluation Manual
"* Photographs/Sketches of Failure Site "* Industry Bulletins "* Previous internal operating experience or events "• Turnover logs for affected groups (e.g., RP, Maintenance) "* Task sheets "* Lesson plans
NOTE: Statements should be obtained prior to any critique which could alter the perceptions of those personnel involved with the event whenever possible.
4.5.2. Use Exhibit A, "Personnel Statement," or a similar form to obtain written statements from personnel involved as soon as practical (preferably prior to leaving the site) following the event. Personnel statements are normally written separately by each individual rather than as a collaborative summary of the event.
NOTE: Construction of an Event and Causal Factor Chart should begin as soon as information becomes available. Even though the initial event sequence and timeline may be incomplete, it should be started early in the evaluation process.
4.5.3. Construct an Event and Causal Factor Chart that shows the order in which each action of the event occurred. This can most easily be done by compiling all input information (e.g., interviews, written statements, evaluation results) and placing them in chronological order. A Task Analysis may be useful in constructing the Event and Causal Factor Chart. See Exhibit B, "Event and Causal Factor Charting," and Exhibit C, "Task Analysis."
4.5.4. Conduct personnel interviews with involved parties as soon as practical following the event. See Exhibit D, "Interviewing."
4.5.5. If it is suspected that the cause of the event may have been an intentional attempt to disrupt normal plant operation (e.g., tampering), notify station management and Security in accordance with applicable station procedures.
4.6. Analyzing Information
NOTE: These are not the only methods available, but represent proven techniques for evaluating various types of problems.
4.6.1. Using the facts identified by the evaluation, and reviewing the event as a whole, decide which of the facts or groups of facts are pertinent. Analytical techniques that may be helpful include:
"* Change Analysis (Exhibit E) "* Barrier Analysis (Exhibit F) "* Failure Modes and Effects Analysis (Exhibit G) "* Cause and Effects Analysis (Exhibit H) "* Pareto Analysis (Exhibit I) "* Troubleshooting/Failure Analysis (Exhibit J) "* Fault Tree Analysis (Exhibit K)
7

NMC Root Cause Evaluation Manual
4.6.2. Compare the facts to an "acceptable standard" and determine if an unacceptable condition exists. Identify each inappropriate action and equipment failure.
4.6.3. Search the corrective action program database for key words or similar events that could identify other related issues, past or present. Review the corrective actions from these other events and determine how effective they were in preventing or mitigating recurrence of the event.
4.6.4. The Nuclear Network can be used to identify similar industry events or other Operating Experience (OE) information.
4.6.5. Review the corrective actions taken from other events or OE evaluations and determine how effective they were in preventing the recurrence or mitigating the outcome of the current event. Consider whether any corrective actions still in progress could have prevented the event or mitigated the outcome of the event.
NOTE: All RCEs should address "EXTENT OF CONDITION." Ask the question, "Could this condition be lurking out there some where else?" If it is truly isolated and not applicable to anything else, state it explicitly in your report. Otherwise we need to determine the extent of the condition or how we will determine the extent.
4.6.6. Ensure similar components or documents are examined to determine the extent to which the unacceptable condition exists.
4.6.7. Evaluate potential detrimental effects on associated plant equipment.
4.6.8. Organize the information into an overall description of the problem.
4.6.9. Establish a start time and a finite end time to the event.
4.6.10. Determine the nuclear safety significance of the event. This may require formal analysis of the event by the Probabilistic Risk Assessment (PRA) group. PRA should be contacted early in the investigation as appropriate.
4.6.11. Occasionally, more than one apparently similar event is analyzed in one RCE report. The evaluation should use the analysis techniques described above to determine and analyze the pertinent facts, extent of condition, failure mode(s), etc., of the inappropriate action or adverse condition for each event or issue, then identify the root cause(s). Each event needs to be considered separately first as the causes may actually not be related at all (for example, three storage tanks failing over the course of a month may sound similar with a potential common root cause, but one might be due to a system lineup causing over pressurization, one due to a tornado, one due to corrosion). It is important to ensure that all issues and corrective actions required by the individual Action Request or RCEs are addressed in the final report.
4.7. Root Cause Determination
4.7.1. Once the Event and Causal Factor Chart has been constructed, it may be necessary to break down the sequence of events further to determine causal and contributing factors
8

NMC Root Cause Evaluation Manual
that led to each inappropriate action or equipment failure. Root cause(s) will be determined from the causal factors.
4.7.2. The failure modes (causal factors) should be determined by using the NMC Trend Code Manual. Each failure mode must be supported by facts determined in the investigation. Not all facts may necessarily lead to a failure mode; also, multiple facts may lead to a single failure mode and individual facts may lead to multiple failure modes.
4.7.3. Organizational & Programmatic (O&P) issues may initially be identified during interviews, but the issues should be verified through factual information such as procedures, process maps, regulations, etc.
NOTE: Normally, more than one failure mode is involved with an event. The failure mode is not a Root Cause, but a means to help determine the root cause(s).
4.7.4. Once all the failure modes are identified determine the potential Causes by stream analysis. Using the appropriate failure mode chart, for each failure mode identified, draw lines sequentially to the other failure modes that the preceding one "caused;" then draw lines to the failure mode from each of the others that it was "caused by." When all cause-effect relationships have been identified, count how many lines go out from and into each box on the chart. Failure modes with the most lines going out are causes, the ones with the most coming in are effects (although they may also be causes); the failure mode with the most should be related to the root cause. This is a graphical analysis similar to the analysis in the next step.
4.7.5. For each causal factor identified, ask the following questions until the root cause(s) is determined (see Exhibit H, "Cause and Effect Analysis").
"* What caused this? "* Why does this condition exist?
4.8. Root Cause Determination and Validation
4.8.1. Once the causes of an event have been identified, test them to ensure that the correction of the causes will prevent recurrence. If the "test" would not have prevented the event, the root cause has not been identified.
NOTE: If a cause does not meet all three of the required criteria but meets 1 or 2, then it is considered a "significant contributing" cause.
4.8.2. Each root cause should meet the following three criteria:
"* The problem would not have occurred had this cause not been present. "* The problem will not recur due to the same cause if it is corrected or eliminated. "* Correction or elimination of the cause(s) will prevent recurrence of similar conditions.
9

INML_ Root Cause Evaluation Manual
NOTE: Minimize the use of corrective actions that call for "assessment", "evaluation", "consideration", "review", etc. This is to minimize the likelihood of no corrective actions being implemented. RCEs which contained actions for assessment or evaluation of existing practices or programs typically end up with no actual changes being made.
4.9. Corrective Action Development
4.9.1. Solutions must be identified and implemented that will correct the identified root cause(s)
4.9.2. Brainstorming, and interviewing are good sources of CATPRs and involve people to establish ownership as early as possible. See Exhibit L, "Development of Corrective Actions."
4.9.3. Apply the following criteria to CATPRs to ensure they are viable.
"* Will these CATPRs prevent recurrence of the problem? "* Are the CATPRs within the capability of management to implement in a cost effective
manner? "* Do the CATPRs allow the site to meet its primary objectives of safety and consistent
electrical generation? "* Will the implementation of the CATPRs result in meeting or exceeding applicable
industry standards.
4.9.4. Assign priorities to the corrective actions in accordance with the guidance provided in the NMC Action Request Process.
4.9.5. Obtain "buy-in" from the Manager of the group that will be responsible for performing the corrective action.
4.9.6. If the investigator, sponsor, or a group responsible for implementing corrective actions is unable to reach agreement, the CAP Manager will facilitate a resolution. When necessary, CARB should provide the final resolution.
10

NMC Root Cause Evaluation Manual
4.9.7. Corrective actions should be specific and address each cause. Corrective actions too narrowly focused, unless appropriate, may not correct the root cause such that similar events are prevented. Corrective actions that are too broad or more extensive than the causes would imply may be an attempt to "shotgun" the cause. In the long run, this could prove costly and create the potential for another event.
4.10. NMC Site Notification
4.10.1. The other NMC sites should be notified of the significant event and preliminary findings as soon as possible. The Corrective Action Program manager should be utilized for these notifications.
4.10.2. Completion of this expectation should be documented in the Root Cause Evaluation report.
4.11. RCE Report Preparation
4.11.1. RCEs should be documented utilizing the NMC standard RCE template (Attachment Q). The RCE report should consist of the content listed below.
4.11.2. A cover page with a title, the Action Request and LER (if appropriate) associated with the event, the date of the event, and the names of the investigator(s).
4.11.3. An executive summary which includes: "* the purpose or of the evaluation "• a brief summary of the event "* the safety significance of the event "• major causes (root and contributing) "* major corrective actions "* reports to external agencies (including notification to other NMC sites)
4.11.4. An event narrative.
4.11.5. A section for an extent of condition assessment (generic implications) including: "* internal events "• external OE
4.11.6. A section for reports to external agencies: "* NRC, DNR, EPA, Insurance, etc. "* consideration for reporting to INPO
4.11.7. A data analysis section
4.11.8. A summary of the root and contributing causes and corrective actions with responsible groups and due dates
11

NMC Root Cause Evaluation Manual
4.11.9. A section for nuclear safety significance which should include:
* Actual nuclear safety significance (e.g., unable to fulfill design basis function).
NOTE that this may require input from Licensing, Engineering, or Probabilistic Risk Assessment (PRA).
"* personnel safety (actual or potential) "* environmental safety
4.11.10. An events and casual factors chart
4.11.11. After the RCE report is drafted, the cognizant managers and potentially affected personnel should be given the opportunity to review and comment on the draft report in its entirety prior to finalization.
4.11.12. The draft of the RCE should be given to the CAP Coordinator for review quality grading in accordance with the Root Cause Analysis Quality Index (RCQAI). This index assesses RCE quality according to a set of criteria that can be compared against industry results. This index will produce a score for the RCE and provides for feedback of specific comments to the RCI. (See Attachment N)
4.11.13. The cover page of the RCE will contain the signature and date of the Approving Manager, Corrective Action Program Manager.
4.11.14. When the RCE has been approved by the appropriate managers, it is routed to the CAP Coordinator. The CAP Coordinator should review the RCE and CAP database to ensure corrective actions have been entered. If corrective actions have not been entered, the CAP Coordinator will notify the RCI that the RCE is approved and corrective actions should be entered.
4.11.15. The CAP Coordinator shall distribute the RCE report to the appropriate site personnel.
NOTE: Entry of corrective actions into the Action Request database is independent of CARB review.
4.11.16. The RCE is considered approved when the appropriate managers sign the cover sheet. As soon as the RCE is approved, close the evaluation Activity associated with the RCE and enter any required corrective actions in the Action Request database.
12
NMC Root Cause Evaluation Manual
4.12. .Equipment Failure Root Cause Evaluation.
4.12. 1. Descriptions of other investigative methods, report content, etc., are contained in other sections of the Root Cause Manual.
4.12.2. The depth to which the equipment failure root cause analysis is taken is based on the safety and economic significance of the failure. See Exhibit M for possible techniques to use.
4.12.3. Quarantine or preserve the failed equipment so that evidence is not destroyed or disturbed.
4.12.4. Determine potential failure modes.
4.12.5. Where appropriate develop a testing plan that utilizes the failure modes chart to prove or refute all the possible causes. The testing plan should prevent destruction of evidence as much as possible for future testing and should detail the expected resulting possibilities.
4.12.6. Through the testing sequence different failure modes should be eliminated. The goal is to eliminate all but one failure mode. The failure mode should determine the root cause.
4.12.7. If testing shows that multiple event failure modes have taken place in the same event, then each must be considered for root cause and corrective actions should be applied to each unique root cause.
4.12.8. In these evaluations, the following additional items should be considered during the investigation. Findings in each of the items below should be provided in the final report:
"* Current Operability Determination or evaluation. "* Reportability evaluation. "• Industry Operating Experience (OE) review. "* Internal Operating Experience (OE) review. "* Vendor experience/input. "* Organizational & Programmatic Deficiencies/Human Error contribution.
4.12.9. Investigation of the failure mode may require laboratory analysis. Many of these test results must be compared to the original design specifications to determine if the critical characteristics of the failed item meet design requirements. Tolerances should be included as this will often identify a mis-manufactured item.
4.12.10. Successful equipment failure root cause is heavily dependent on a thorough and systematic evaluation of technical data. After collecting the data, perform simple analyses to eliminate possible scenarios. Watch for human error or programmatic problems. Consult experts as required.
13

NMC Root Cause Evaluation Manual
4.13. Common Cause Analysis (CCA)
4.13.1. Descriptions of other investigative methods, report content, etc., are contained in other sections of the Root Cause Manual.
4.13.2. Data Collection (from Action Requests, LERs, NOVs, etc.)
4.13.3. Data is generally from cause coding from completed evaluations. If any evaluation is still open that is to be included as part of the data, at a minimum an apparent cause needs to be determined and coded for analysis. Data may need to be transferred to another application for generating charts used in analysis. Data may need to be validated and possibly recoded due to variations on how people code similar events.
4.13.4. Develop an Organization & Program Interface Chart (OPIC chart) when appropriate.
"* Identify key activities (e.g., request work, prepare work plan, etc.) "* Chart should have just 15-20 elements "* When coding key activity, relate to chart "* The key activities will direct what questions need to be asked
4.13.5. Categorize Data, typically in six key areas (minimum):
"* Organization(s) "* Work Process(es) "* Key Activity "* Organizational/Programmatic Failure Mode "* Human Error/Inappropriate Action Failure Mode "* Human Error Type (Skill, Rule, or Knowledge-Based)
4.13.6. Plot the information using Nomographs/Pareto Charts (see Exhibit I) when appropriate.
" The error rate of the data plotted will determine which information in the charts is not used in further analysis (i.e., insignificant). The more data used, the smaller the error rate.
" Generally, for 50 bits of data, look at patterns that are statistically significant or above 8%; for 100 bits, above 6%. For a general common cause analysis, patterns above two times the error rate are often considered; for a process specific CCA, one times the error rate is appropriate.
4.13.7. Analyze for "Common Causes" or "Common Characteristics" or "Common Failure Modes." primary failure modes would be determined using Stream Analysis.
4.13.8. Perform further Root Cause and Quantitative Analysis as appropriate.
14

NMC Root Cause Evaluation Manual
4.14. Human Error Root Cause Evaluations
4.14.1. Descriptions of other investigative methods, report content, etc., are contained in other sections of the Root Cause Manual.
4.14.2. The NMC Human Error Failure Mode Chart defines internal factors (failure modes) for human errors. This chart is used in conjunction with the NMC Organization & Programmatic Failure Mode (O&P) Chart (external failure modes affecting human error) to analyze a human error event. Other investigative methods (e.g., Event and Causal Factor Charting, barrier analysis) are used to compliment the investigation.
4.14.3. Investigation of human errors generally follows these major steps:
"* Quickly obtain as much background information as possible. This information should define who was involved, what was in progress at the time of the error, when the error took place, and where the error took place.
"* Define potential inappropriate actions. These are the initial areas of interest that will focus the investigation.
"* Postulate potential internal failure modes using the NMC Human Error Failure Mode Chart.
"• Postulate potential external failure modes using the NMC Organization & Programmatic Failure Mode Chart..
"* Investigate the event or condition by performing interviews, reviewing procedures, training, operating experience, etc., as appropriate. An event and causal factor chart (E&CFC) is an important tool to guide the investigation. Other investigative methods may be employed as appropriate.
"* Eliminate failure modes that are not present. Validate and verify the failure modes that remain.
"* Determine the underlying reasons (causes) for the presence of the remaining failure mode(s) through further investigation (interviews, reviews of practices/procedures, evaluation of knowledge and skills, surveys, etc.).
4.14.4. Determine if the event is an isolated human error or has organizational and programmatic causes (external causes). As a general rule, if the recurrence rate is less than 0.3%, and the individual has a history of error, it is likely an isolated human error. Failure rates greater than 0.2% are likely due to O&P drivers. Recurrence rate is the rate of similar events with the same root cause. The number of events is determined through the review of internal operating experience. The rate is determined by comparing the number of events to the number of opportunities, either quantitatively or qualitatively. For some activities, quantitative rates can be determined (e.g., tagging activities - the number of tags hung is known), while for other activities, qualitative rates must be estimated using good judgment.
4.14.5. In some cases, a review of internal operating experience will not provide data to determine recurrence rate (some types of problems are not reported, the data base is incomplete, the activity rate may not be reasonably estimated, etc.). In these cases, further evaluation is required to determine if an O&P issue is the underlying cause of the human error.
15

NMC Root Cause Evaluation Manual
4.14.6. Develop appropriate corrective actions for the human error category (skill-based, rule-based, knowledge-based).
4.15. Effectiveness Reviews
4.15.1. Effectiveness Reviews should be developed by the RCE evaluator after CATPRs have been developed and approved. Effectiveness reviews are targeted towards CATPRs and should be identified in the text of the RCE (including the organization responsible for performance and the due date).
4.15.2. Effectiveness Reviews are performed after corrective actions have been implemented to ensure the RCE identified and corrected root causes. This is a proactive assessment of the corrective actions versus waiting for an event challenge to determine effectiveness. The depth and duration of an effectiveness review should be commensurate with the significance and complexity of the problem. See Exhibit P for general guidance and examples of when an Effectiveness Review might be appropriate.
5. RECORDS RETENTION
5.1. The original hard copy of the completed RCE report should be retained for reference and informational purposes.
5.2. An electronic copy of the completed RCE report should be added to the Action Request.
6. REFERENCES
6.1. FP-PA-ARP-01, "Action Request Process"
6.2. INPO 90-004, "Good Practice OE-207, Root Cause Analysis"
16

NMC Root Cause Evaluation Manual
ATFTACHMENT A PERSONAL STATEMENT
_ _ _ _ _ _ _ _ _ _ _ _ _/ / _ _ _ _ _ _ _ _
Name (Print) Date Position Department
General Instructions:
In your own words, describe your knowledge of the event facts, and your involvement in the event before, during, and after the final outcome. Include any pertinent verbal communications and specify who you spoke with (by name and/or position). Indicate the format of the communications (pre-job brief, direct assignment, inter-department interfaces, etc.), and who you spoke with. List any pertinent procedural or equipment conditions relating to the event. Use additional sheets as necessary.
Signature
17
iNiviLt- Koot L.ause Evaluation Manual
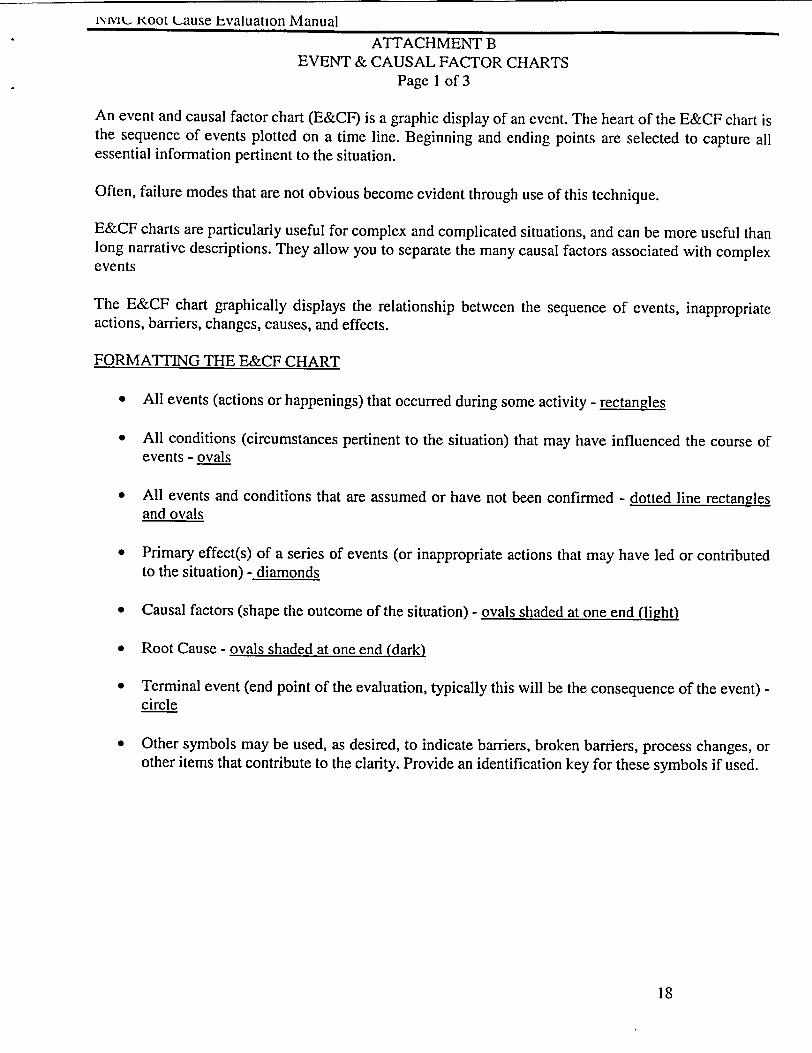
ATTACHMENT B EVENT & CAUSAL FACTOR CHARTS
Page 1 of 3
An event and causal factor chart (E&CF) is a graphic display of an event. The heart of the E&CF chart is the sequence of events plotted on a time line. Beginning and ending points are selected to capture all essential information pertinent to the situation.
Often, failure modes that are not obvious become evident through use of this technique.
E&CF charts are particularly useful for complex and complicated situations, and can be more useful than long narrative descriptions. They allow you to separate the many causal factors associated with complex events
The E&CF chart graphically displays the relationship between the sequence of events, inappropriate actions, barriers, changes, causes, and effects.
FORMATTING THE E&CF CHART
"* All events (actions or happenings) that occurred during some activity - rectangles
"* All conditions (circumstances pertinent to the situation) that may have influenced the course of events - ovals
"* All events and conditions that are assumed or have not been confirmed - dotted line rectangles and ovals
"* Primary effect(s) of a series of events (or inappropriate actions that may have led or contributed to the situation) - diamonds
"* Causal factors (shape the outcome of the situation) - ovals shaded at one end (light)
"* Root Cause - ovals shaded at one end (dark)
"• Terminal event (end point of the evaluation, typically this will be the consequence of the event) circle
"* Other symbols may be used, as desired, to indicate barriers, broken barriers, process changes, or other items that contribute to the clarity. Provide an identification key for these symbols if used.
18

ATTACHMENT B EVENT & CAUSAL FACTOR CHARTS
Page 2 of 3
CRITERIA FOR EVENT DESCRIPTION
Events should precisely describe a SINGLE action or happening (quantified) and be based on VALID information (facts). Use a short sentence, usually with just one subject noun and one action verb.
Chart scope should range from beginning to end of the situation sequence.
Each event should be derived directly from the event and conditions preceding it. When this is not the case, it is an indication that one or more events or conditions are missing.
Each event should be in the appropriate time relationship to the preceding and succeeding event.
Detail of the event sequence MUST be sufficient to ensure completeness of final report.
HOW TO DEVELOP AN E&CF CHART
STEP 1: Evaluate initial information and documentation * What were inappropriate actions and/or equipment failures? * When did they occur (during what task/evolution)? 0 How did they occur? * What were the consequences?
STEP 2: Begin constructing the preliminary primary event line. • Start early - use currently known facts * Use yellow sticky notes. The events, factors, and conditions will probably
need to be revised and rearranged.
STEP 3: Define scope of chart from initial information. * Initiating event, i.e., beginning point * Terminal event, i.e., the reason for the investigation
STEP 4: Add new information to preliminary chart. * Events
- Primary - directly leads to or follows a primary effect or inappropriate action
- Secondary - impacts primary event, but is not necessarily directly involved in situation. Plotted on horizontal lines parallel to primary events line
Conditions - Initial - During course of inappropriate actions or equipment failures - After inappropriate actions or equipment failures
19

ATTACHMENT B EVENT & CAUSAL FACTOR CHARTS
Page 3 of 3
STEP 5: Identify failed barriers, changes, and causal factors. * Analysis (Task, Change, Barrier, Cause & Effect, Interviewing) * Ensure facts are validated and conclusions are supported by facts
REMEMBER
There is no "correct" chart. The important thing to remember is to use the chart and the process to help discover the root causes and to convey that discovery process to others reviewing your investigation.
The "rules" are not mandatory. Violate these E&CFC rules when it contributes to communicating the information. The intent of this process is to understand the sequence of events and the relationships of the conditions and causal factors.
Service Water Hydraulic Attachment 1 Analyses Configuration
RCE 97-032 EVENT AND CAUSAL FACTORS CHART
FSAR Section 9 3 Addresses CCW Design
and Operation
Model Basis; and - Numober of Computfer
Runs Increasingly
-- Complexe ne
Indequae Interface - . r eteeEg~neernng
and Operations
20

ATTACHMENT C TASK ANALYSIS
Page 1 of 2
Task analysis is a tool that is used on evaluations where problems during performance of tasks contributed to the event. Performing a Task Analysis will provide the RCI with:
"* A clear understanding of how the task is normally performed.
"* Questions arising out of the analysis to be answered during the course of the evaluation, usually through interviewing.
One of the first priorities when entering an evaluation is to understand as much as possible about the activity that was being performed. It may be necessary to obtain the required expertise on the team to be able to perform the task analysis.
The task analysis will require a review of work documents, logs, technical manuals, and other documents in an effort to determine what the task is about and how it was to be performed. This process is called the Task Analysis method.
1. Paper and Pencil - the task is broken down on paper into subtasks identifying:
- Sequence of actions - Instructions - Conditions - Tools - Other materials associated with the performance of the task
This type of analysis consists of a review of logs, work documents, technical manuals, etc., to determine what the task was about and how it was to be performed. The steps, questions and concerns should be displayed on the preliminary event and causal factor chart.
2. Walk-Through - A step-by-step enactment of the task for an observer without carrying out the actual function. The observer makes notes of any differences between the actual performance enactment and the procedure steps. Personnel performing the walk-through should be people who actually do the tasks, but not people who were directly involved in the event. The walk-through should identify:
*, How the task is "really" performed * Problem areas such as:
- Discrepancies in procedure steps - Human factors design in the man-machine interface - Training, knowledge, or skill weaknesses
21

ATTACHMENT C TASK ANALYSIS
Page 2 of 2
Steps in Walk-Through Task Analysis:
1. Obtain preliminary information to understand what happened during the event.
2. Determine the scope of what is to be included in the walk-through.
3. Obtain necessary information:
* procedures, work package, etc. * drawings * interviews
I. Develop a guide for the walk-through to outline how the analysis will be conducted:
• identify key activities to be performed and observed * identify activities to be recorded
I. Determine exactly what information is going to be recorded and how - one technique is to check off each step as it occurs. Discrepancies and problems may be noted in the margin or in comment space provided adjacent to the step.
2. Select personnel to perform the task who normally perform it. If a crew is involved, crew
members should perform their normal role.
3. Perform the walk-through while observing and recording. Note any discrepancies or problems.
* Try to re-create the situation to obtain a sense of how the actual event occurred. * The walk-through may be done in slow motion, stopping to address questions. The
personnel performing the task may describe the activities from their perspective as they perform.
- The walk-through may be performed in real time to identify time-related problems. * An actual task in the plant may be observed, but preparation as described above is
necessary. A simulator or mock-up may be used.
1. Summarize and consolidate problems noted and questions to be answered during interviews.
Identify possible contributors or causal factors for the event or failure.
Example of a Task Analysis Worksheet
22
(1) Steps in Procedure or (2) Walk through by Analyst (3) Questions/Conclusions Practice. (Enter step or trained individual, about how task number and short (State how actual matches was/should be performed. description.) procedure.)
J. _____________________ I

ATTFACHMENT D INTERVIEWING TECHNIQUES
Page 1 of 5
Interview Preparation
All interviews require preparation, no matter how simple the problem seems. Interviewing is a "fact" finding skill rather than a "fault" finding session.
1. Develop a set of questions. The questions can be derived from the Events and Causal Factors Chart, Change Analysis, Barrier Analysis, and the enclosed Question Guide.
2. Consider the preferred sequence of interviews.
3. Make appointments.
4. Select an appropriate location
5. Allow time between interviews to reconstruct notes.
Introduction/Opening
The purpose of the introduction is to orient the interviewee and put him/her at ease.
1. Explain the purpose of the evaluation and the interview (to identify what happened, how it happened, why it happened, and what can be done to prevent recurrence).
2. Provide the interviewee with an overview of the material to be covered.
3. Show interest and get the interviewee involved.
4. Anticipate and answer the interviewees questions: "* What will happen with information (it will be used to determine root causes). "* Will my name be used (the report may include a list of interviewees). "* Why do you want to talk to me (we believe that you can help explain what happened)
23

ATTACHMENT D INTERVIEWING TECHNIQUES
Page 2 of 5
Ouestion/Answer
The purpose of the interview is to obtain the interviewee's recollection and understanding of the event. The following are some of the features of a successful interview.
"* Begin with open-ended questions to allow the interviewee to provide his/her perspective.
"* Listen carefully while taking notes. Do not interrupt.
"* Keep questions short and to the point.
"* Do not ask leading questions.
"• Use primary questions (from the prepared list) to introduce a topic and use secondary questions to clarify information.
The Closing
The closing accomplishes more than just concluding the interview. It provides an opportunity to validate information and obtain additional information.
* Summarize the information that was recorded. * Set up the potential for a follow-up interview. * Thank the interviewee for his/her help.
24
ATTACHMENT D INTERVIEWING TECHNIQUES
Page 3 of 5
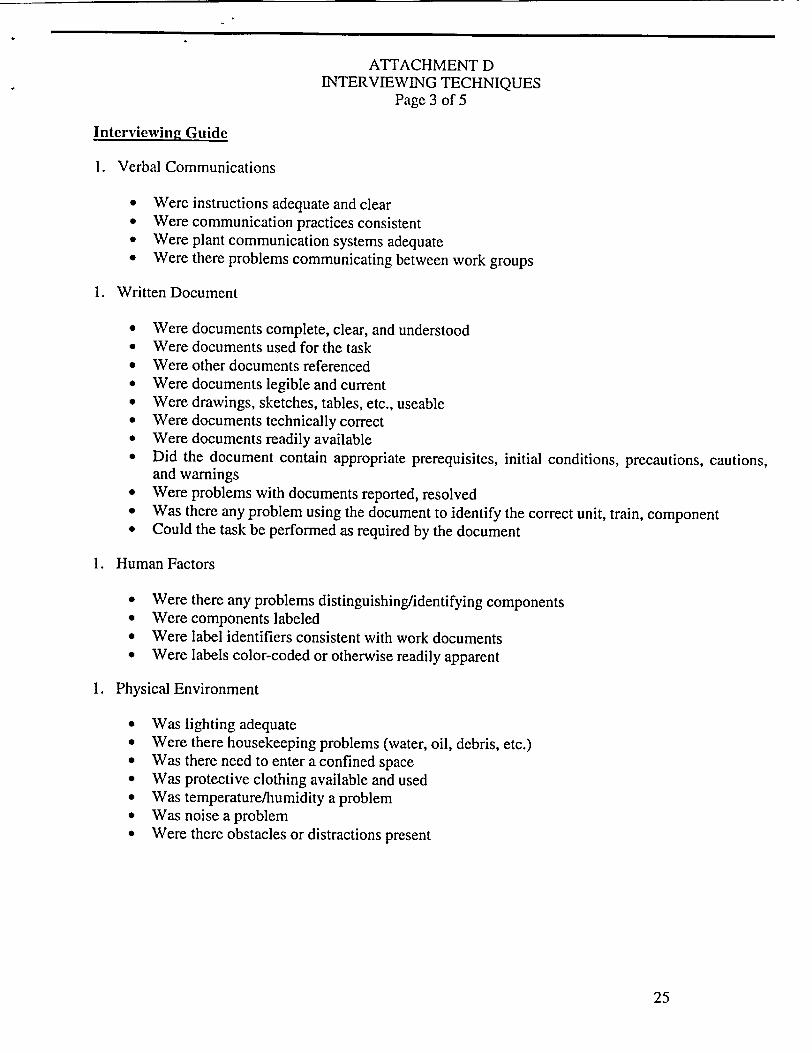
Interviewing Guide
1. Verbal Communications
"* Were instructions adequate and clear "* Were communication practices consistent "* Were plant communication systems adequate "* Were there problems communicating between work groups
1. Written Document
"* Were documents complete, clear, and understood "* Were documents used for the task "• Were other documents referenced "* Were documents legible and current "* Were drawings, sketches, tables, etc., useable "* Were documents technically correct "* Were documents readily available "* Did the document contain appropriate prerequisites, initial conditions, precautions, cautions,
and warnings "* Were problems with documents reported, resolved "* Was there any problem using the document to identify the correct unit, train, component "* Could the task be performed as required by the document
1. Human Factors
"* Were there any problems distinguishing/identifying components "* Were components labeled "* Were label identifiers consistent with work documents "* Were labels color-coded or otherwise readily apparent
1. Physical Environment
"* Was lighting adequate "• Were there housekeeping problems (water, oil, debris, etc.) "* Was there need to enter a confined space "* Was protective clothing available and used "* Was temperature/humidity a problem "* Was noise a problem "* Were there obstacles or distractions present
25

ATTACHMENT D INTERVIEWING TECHNIQUES
Page 4 of 5
1. Work Schedule
"* How may hours had been worked prior to the event "• How much overtime had been worked prior to the event "* How many consecutive days had the person worked "* What time of day did the event occur "* When was the next day off scheduled to occur
1. Work Practices
"* Determine procedure use (verbatim, guideline, not used, etc.) "* Were tools in good working condition "* Were all needed tools available "* Was self-checking used "* Was independent verification used "* Were radiological conditions understood "* Were system conditions understood "* Were short cuts used "* Were all the required people present
1. Work Organization and Supervision
"• Were duties distributed appropriately "* Was there enough time to prepare for the job "• Was there more than one simultaneous task "• Had the job been performed previously "• Were duties and responsibilities clear "* Was the supervisor at the job location periodically "* Were tasks coordinated among work groups "* Were priorities clearly established "• How long had this work crew worked together "* Was there an adequate pre-job briefing "• Were contingencies established for anticipated problems
26

ATTACHMENT D INTERVIEWING TECHNIQUES
Page 5 of 5
1. Training and Qualifications
"* Had the workers been trained to perform the task "* Was any training based on the actual task "* Did the worker have an understanding of the equipment involved "* Did the worker read and understand the work instructions "* Was any applicable training useful; qualified instructors "* Did training include mock-ups, simulator, etc. "* What were the differences between training and actual job "* How long since training was received "* Was sufficient time allowed for training "* How long since the task was last performed
1. Change Implementation
"* Was there anything different since the job had previously been performed "* Were changes adequately reflected in procedures, drawings, training, labels, etc.
1. Management and Administration
"* Were there any policies, goals, or objectives that influenced the event "* Did the worker understand who he/she reports io "* Were roles and responsibilities clear "* Were quality requirements clear "* Is the expectation for problem identification and resolution clearly understood "* Was support adequate (procedures, training, engineering, planning, scheduling, radiological
protection, clearance tagging, protective equipment, etc.) "* Were parts, materials, and supplies provided to support the job "* Was the reason for the job clear "* Was the job within the workers capabilities "* Were there unnecessary requirements "* Were there any conditions causing stress
27

ATTACHMENT E CHANGE ANALYSIS
Page 1 of 2
ALWAYS ASK
What was different about this situation from all the other times the same task or activity was carried out without an inappropriate action or equipment failure?
STEPS IN CHANGE ANALYSIS
1. Analyze the situation containing the inappropriate action or equipment failure.
2. Analyze a comparable situation that did not have an inappropriate action or equipment failure.
3. Compare the situation containing the inappropriate action or equipment failure with the reference situation.
4. Write down all known differences whether they appear relevant or not. As the evaluation progresses, be alert to other differences that were not apparent during the initial review and add them to the list.
5. Evaluate the differences for effect on producing the event. This must be done with careful attention to detail, e.g., a change in color or finish may change the heat transfer parameters and consequently affect system temperature.
6. Integrate information relevant to the causes of, and contributors to, the inappropriate action or equipment failure into the investigative process via the E&CF chart.
WHEN SHOULD CHANGE ANALYSIS BE USED?
"* When causes of in appropriate action or equipment failure are obscure
"* When you don't know where to start the evaluation
"* When you suspect that a change may have contributed to the inappropriate action or equipment failure
28

ATTACHMENT E CHANGE ANALYSIS
Page 2 of 2
EXAMPLES OF CHANGES TO CONSIDER
"* What - operating parameters (i.e., changes in temperature, pressure, flow, cycle time, etc.)
"* When - plant status, time of day, day of week, season of year, times when specific conditions exist (i.e., why does it work some times but not others?)
"* Where - physical location (i.e., why does it work in one location but not another?)
"* How - how equipment is supposed to work (i.e., why does it work in one application but not another?)
"• Who - personnel involved (i.e., is one individual or crew using a different method or technique?)
Example of a Change Analysis Worksheet
Problem Statement: (Optional section. Write a brief statement of the event being analyzed and the question that needs to be answered.)
29
Previous Condition Current Condition Change / Difference Impact or (or "Error Free" Assessment Condition, etc.)
(List all possible (List comparable (List all differences (What effect did the contributors one at a contributors.) without evaluation or change have on the time, need not be in value judgment or situation.) sequential order.) significance, whether
relevant or not.)
ATTACHMENT F BARRIER ANALYSIS
Page 1 of 3
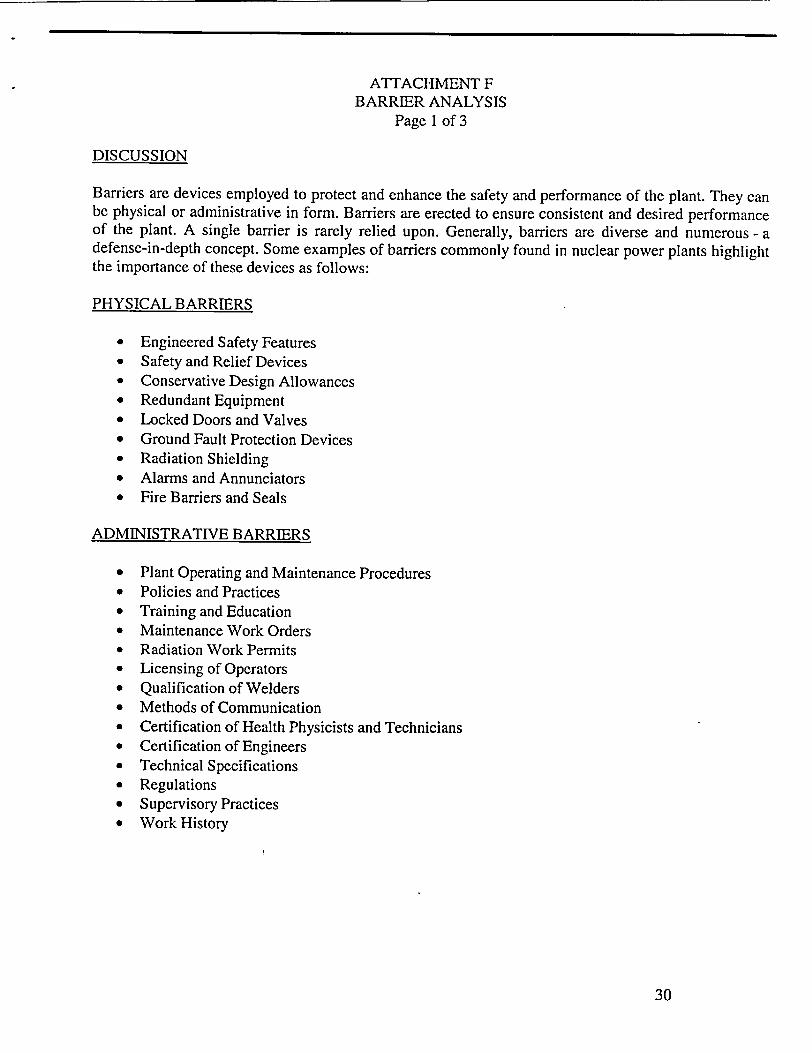
DISCUSSION
Barriers are devices employed to protect and enhance the safety and performance of the plant. They can be physical or administrative in form. Barriers are erected to ensure consistent and desired performance of the plant. A single barrier is rarely relied upon. Generally, barriers are diverse and numerous - a defense-in-depth concept. Some examples of barriers commonly found in nuclear power plants highlight the importance of these devices as follows:
PHYSICAL BARRIERS
"* Engineered Safety Features "* Safety and Relief Devices "* Conservative Design Allowances "* Redundant Equipment "* Locked Doors and Valves "* Ground Fault Protection Devices "* Radiation Shielding "* Alarms and Annunciators "* Fire Barriers and Seals
ADMINISTRATIVE BARRIERS
"* Plant Operating and Maintenance Procedures "* Policies and Practices "* Training and Education "* Maintenance Work Orders "* Radiation Work Permits "* Licensing of Operators "* Qualification of Welders "* Methods of Communication "* Certification of Health Physicists and Technicians "* Certification of Engineers "• Technical Specifications "* Regulations "* Supervisory Practices "* Work History
30

ATTACHMENT F BARRIER ANALYSIS
Page 2 of 3 BARRIER TYPES
"* Barriers that promote (good design, labeling, work planning, procedures) "* Barriers that prevent (interlocks, locked doors, physical segregation) "* Barriers that discourage (caution signs, rope barriers, notes/cautions in procedures/briefings) "* Barriers that-detect (hold points, check off lists, operator rounds, pre-job procedure reviews) "* Barriers that compensate (tests done at shutdown/low power, notifying control room prior to task)
BARRIER ANALYSIS METHODOLOGY
1. Identify target - Result of the event (e.g., Rx scram, ESF actuation, personnel injury, valve mispositioned, etc.). Target could also be desired result (e.g., successful completion of test).
2. Identify a single hazard to the target -Typically start with the symptoms or failure mode(s) at the time the event occurred. This could also be "energy" applied to the system (e.g., monthly pump test).
3. Identify all barriers.
4. Integrate this information into the preliminary E&CF.
5. Identify all apparent barriers that failed and allowed the event to progress.
6. Determine HOW the barrier failed, e.g., the relief valve barrier failed because although the valve was functional the set point had drifted high.
7. Determine WHY the barrier failed, e.g., the relief valve set point had not been checked since
original installation because it is non-safety related.
8. Validate the results of the analysis with information learned.
While barrier analysis identifies missing or defective barriers, it has a weakness. If the investigator does not recognize ALL failed barriers, the evaluation may be incomplete. Because using barrier analysis alone is very time consuming it is recommended that barrier analysis be used in conjunction with other techniques.
When a RCA evaluation is initiated, you must think in terms of barriers. Naturally, the barriers established in plants differ widely and evaluation of them is dependent upon your knowledge. Regardless of variations in barriers at plants, RCA provides the framework for barrier assessment because it focuses on precise barrier categories that have proven to be critical in identifying equipment failures. Corrective actions from RCA evaluations usually include modification of existing barriers, but caution should be taken before considering additional barriers so that additional failure modes are not introduced.
31

ATTACHMENT F BARRIER ANALYSIS
Page 3 of 3
Example of a Energy(Hazard)/Barrier/Target Analysis Worksheet
32
Energy/Hazard Barrier Assessment Target Monthly pump test Procedure No step to open Successful completion of
discharge valve, test Operator New Operator. Did not
QV&V or STAR Supervisor No oversight of first
time evolution.
(List one at a time, (Identify all applicable (Identify if barrier was (Identify all applicable need not be in physical and missing, weak, or targets such as individual sequential order.) administrative barriers ineffective and why.) organizations, equipment,
for each consequence.) facilities, and processes.)

ATTACHMENT G FAILURE MODES AND EFFECTS ANALYSIS
Page 1 of 2
THE FM & E ANALYSIS PROCESS
1. Develop a list of possible failure modes. Possible sources or references to develop the list might include the following:
"* Previous failures from equipment history data bases "* Known failures from industry user groups "* Known failures from original equipment manufacturer "* Previous failures from other stations "* Failure diagnostic programs, guides, and tools (EPRI ERCAWS, computer aids, consultants, etc.)
Possible failure modes can be documented on a Fishbone Diagram where each failure mode is a major rib of the fish. As an alternative, the major ribs can be general categories such as Human Performance, Procedures, Equipment, and Facilities.
1. Collect physical evidence (NOTE: this can be performed concurrently with Step 1.)
* Physical evidence should be gathered to completely understand the WHAT and HOW of the failure.
NOTE: Care must be taken while gathering evidence not to accidentally destroy other evidence. For example, if a component must be disassembled, care must be taken to capture all "as found" conditions. Do not clean or contaminate fracture surfaces. Measurements, photographs, video tape, or other methods should be considered to preserve evidence.
* Evidence should be gathered to validate or refute the postulated failure modes. For example, if one of the postulated failure modes is WATER HAMMER, then conduct a system walkdown to look for evidence of water hammer, such as damage to small pipe or instrument connections, etc.
1. Evaluate each possible failure mode against the physical evidence to validate or refute it. In other words, determine whether the failure mode would have produced the physical evidence that exists.
2. Continue Steps I through 3, and through a process of elimination reduce the list to the single failure mode or the most probable failure mode(s).
3. Evaluate the single or most probable failure modes using the "Cause and Effect" process to determine the root cause(s).
HINTS ON USING THE FM & EA PROCESS
A thorough understanding of the failed equipment is necessary in order to conduct FM & EA. A highly knowledgeable subject matter expert is needed. If the evaluation team does not possess a high level of knowledge, an expert needs to be recruited from elsewhere inside or outside of the
33
ATTACHMENT G FAILURE MODES AND EFFECTS ANALYSIS
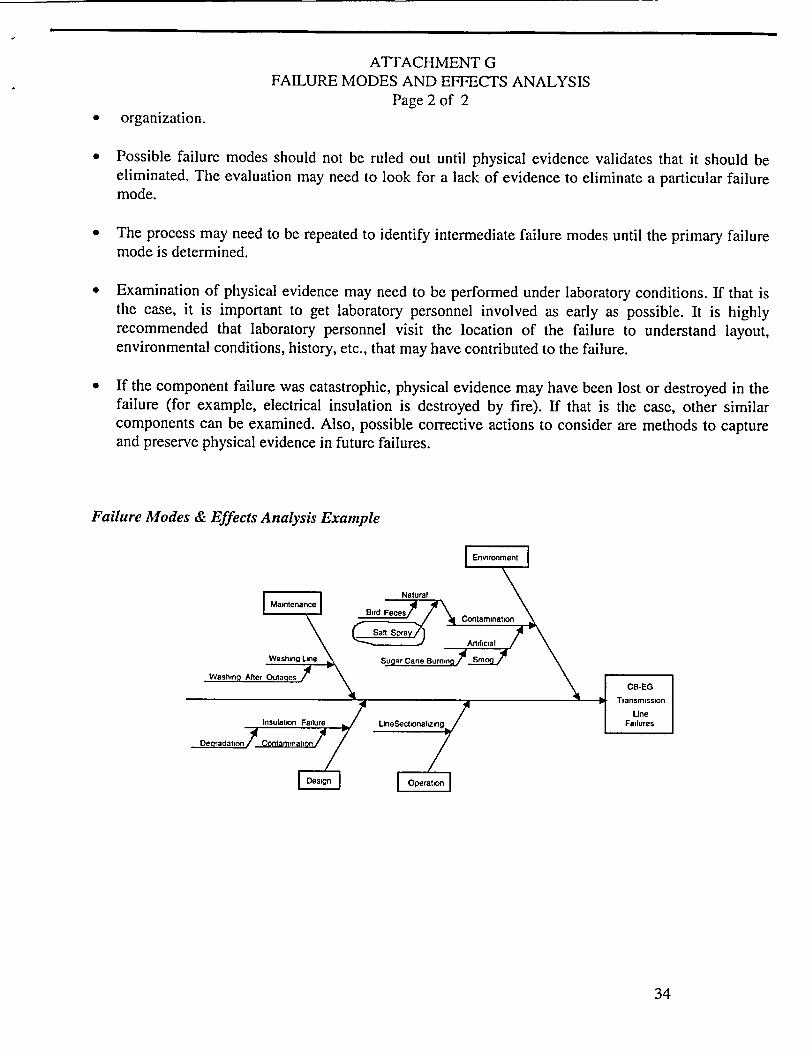
Page 2 of 2 " organization.
"* Possible failure modes should not be ruled out until physical evidence validates that it should be eliminated. The evaluation may need to look for a lack of evidence to eliminate a particular failure mode.
"* The process may need to be repeated to identify intermediate failure modes until the primary failure mode is determined.
" Examination of physical evidence may need to be performed under laboratory conditions. If that is the case, it is important to get laboratory personnel involved as early as possible. It is highly recommended that laboratory personnel visit the location of the failure to understand layout, environmental conditions, history, etc., that may have contributed to the failure.
" If the component failure was catastrophic, physical evidence may have been lost or destroyed in the failure (for example, electrical insulation is destroyed by fire). If that is the case, other similar components can be examined. Also, possible corrective actions to consider are methods to capture and preserve physical evidence in future failures.
Failure Modes & Effects Analysis Example
34

ATTACHMENT H CAUSE AND EFFECT ANALYSIS
Page 1 of 1
CAUSE AND EFFECT PRINCIPLES "* All events have a cause. These events are the result of plant conditions, plant design, human
performance, etc.
"* A bond/relationship exists between cause and effect.
"* Root cause(s) can be found by examining the relationships. Ask "why?," usually five to seven times to determine "root" cause.
HINTS ON USING CAUSE AND EFFECT ANALYSIS
"* Often causes and effect analysis will lead to management-controlled root causes (also called Organizational and Programmatic causes).
"* When more than one cause is responsible for an effect, each cause must be evaluated.
" Cause and effect is most effective when used within the framework of the E&CF chart. It is not a stand alone method because the situation must first be unraveled to the point where ALL failure modes are identified. This is particularly true in situations involving multiple failures.
"* This process of cause and effect provides a logical, structured guide to maintaining the evaluation on track, but will require good judgment and experience to be effective.
REPEAT CAUSE AND EFFECT ANALYSIS UNTIL:
"* The cause is outside of the control of the plant staff
"* The cause is determined to be cost prohibitive
"* The equipment failure is fully explained
"* There are no other causes that can be found that explain the effect being evaluated
"• Further cause and effect analysis will not provide additional benefit in correcting initial problem
35

ATTACHMENT I PARETO ANALYSIS
Page 1 of I
PURPOSE & DESCRIPTION
Pareto Analysis is the process of determining the "Vital Few" factors responsible for a particular problem. A Pareto Chart is a bar chart of failures ordered by frequency of failure, cost of failure or contribution to system unavailability.
EDG "A" Hours Unavailable
100%
90%
80%
70%
60%
50%
40%
30%
20%
10%
0%
C
I1.
EDG "B" Hours Unavailable
.0 Cm
Cg
0
500
450
400
350
300
250
200
150
100
50
0
1. Determine the Effect or Problem. What is the problem to be addressed? For example, is system reliability or availability of concern (or both)?
2. Decide how the Effect should be measured. Determine how to measure the problem. For example, frequency offailure is used to measure reliability; duration offailure is used to measure availability.
3. Decide how the Effect can be stratified. Failures are typically stratified by system equipment or component, although other strata may be used.
4. Interpret the Results. What does the Data Reveal? Which failures or causes are the "Vital Few?"
PARETO CHART CONSTRUCTION
1. Collect the data and group the events by category or strata.
2. Order the categories from highest to lowest (frequency, unavailability, etc.).
3. Draw bars for each category; the bar heights equal the category's frequency/duration.
4. Develop the cumulative line, adding the impact of each category from left to right.
36
500
450
400
350
300
250
200
150
100
50
0
C
41) 0.
==
=
o

ATTACHMENT J TROUBLESHOOTING / FAILURE ANALYSIS
Page 1 of 1
PURPOSE & DESCRIPTION
Troubleshooting is the diagnostic process of determining which component(s)' failure resulted in the observed system failure. Failure Analysis determines why the component failed (physical failure mechanism). Troubleshooting and Failure Analysis comprise the analysis portion of a root cause analysis.
PROCESS
Troubleshooting/Failure Analysis steps include:
1. Determine the Failure Sequence/Circumstances. Gather initial data relevant to the failure event. This includes failure reports, operations logs, strip chart recordings, etc.
2. Develop a Troubleshooting Plan. Develop a plan to diagnose the failure. Determine which subsystems/equipment/actions could have caused the failure, develop diagnostic tests that will eliminate or confirm the potential failure sources.
3. Identify the Failed Part. Perform the diagnostic activities identified by the plan. Identify the failed part or parts.
4. Confirm Failure of the Part. (When laboratory analysis is required) Confirm that the part declared to have failed by the troubleshooting process is, in fact, failed.
5. Develop a Failure Analysis Plan. Develop a plan to determine why the part failed. This may included laboratory analysis, process analysis (procurement, maintenance, etc.).
6. Analyze the Part's Failure Causes. Perform the failure analysis tasks outlined in the plan. Determine the physical causes of failure.
7. Determine the Sources of these Causes. Determine if the part is capable of performing its mission. Determine which management system failed and requires modification in order to prevent the reoccurrence of the failure.
8. Develop a Conclusion & Recommendations. Review the facts and data, draw conclusions regarding the part(s) which failed, the physical cause of the failure and the processes which resulted in the failure. Develop corrective action recommendations.
37

ATTACHMENT K FAULT TREE ANALYSIS
Page 1 of I
PURPOSE & DESCRIPTION
Fault Tree Analysis develops a logic model that is used to identify and verify possible causes of failure.
EXAMPLE FAULT TREE Mechanical Pump Seal
S oo ling Wamer Pump Seal Failure
M FalugdSeal Faiure Failure
Carbo O-Ring Facue Failure
1. Determine the Failure (Top Event) to be analyzed.
2. List High-Level events (subsystem or functional failures) which could have caused the failure event.
3. Proceed to determine how the high-level events could have occurred.
4. Identify basic events (equipment, component, or part failures, human errors) which could have caused the failure.
5. Develop and implement diagnostic tests to exclude potential causes or verify causes.
38

ATTACHMENT L DEVELOPMENT OF CORRECTIVE ACTIONS
Page 1 of 1
I. Corrective actions should be developed to address the following:
"* root causes (prevent recurrence) "* failure modes (repair what is broken) "* symptoms (detect future degradation before failure) "* common mode failures (other components, train, systems, unit, sites, departments, programs,
etc.) "* effectiveness follow up (are actions effecti% e)
IMPORTANT! Avoid the shotgun approach. Excessive and unnecessary corrective actions not only add burden to staff, but introduce the possibility for new failure modes. For proposed corrective actions, ask which root cause they will address. If they do not address a root cause, are they needed?
1. Recommended corrective actions need to: * address issues * be cost effective • be within control of site 0 meet or exceed industry standards
( 1 f' . .. ', 1, ,
I f ,
' *, ' .. . .* '• , • *.' , ,[ .1 ,. -', ,
*i * *, I ..! - , I1- #

ATTACHMENT M EVENT EVALUATION AND ROOT CAUSE ANALYSIS
TECHNIQUES APPLICATION GUIDELINE Page 1 of I
40
"Human % Organization & "Equipment" Performance Programmatic
Failures Problems Problems ,-: Trend
Failure Modes '&" X Effects Analysis ______________
Fishbone'Diagiram X X Paret Analysis X X X X Problem .Slving Quality
x Improvement Processes Statistical -,'-Pirocess X Control' General Error Model" X X System Task Analy•sis X X X X Events-'&" Causal X X X Factors Charting ____________
_______
Change Analysis X X X X Barrier Analysis.' X X X X Interviewing X X X X Cause & 'Effecfs, X x x x Analysis ____"______
FStr~eam An~aly~sis ______ _______Xx
Root Cause Evaluation Manual
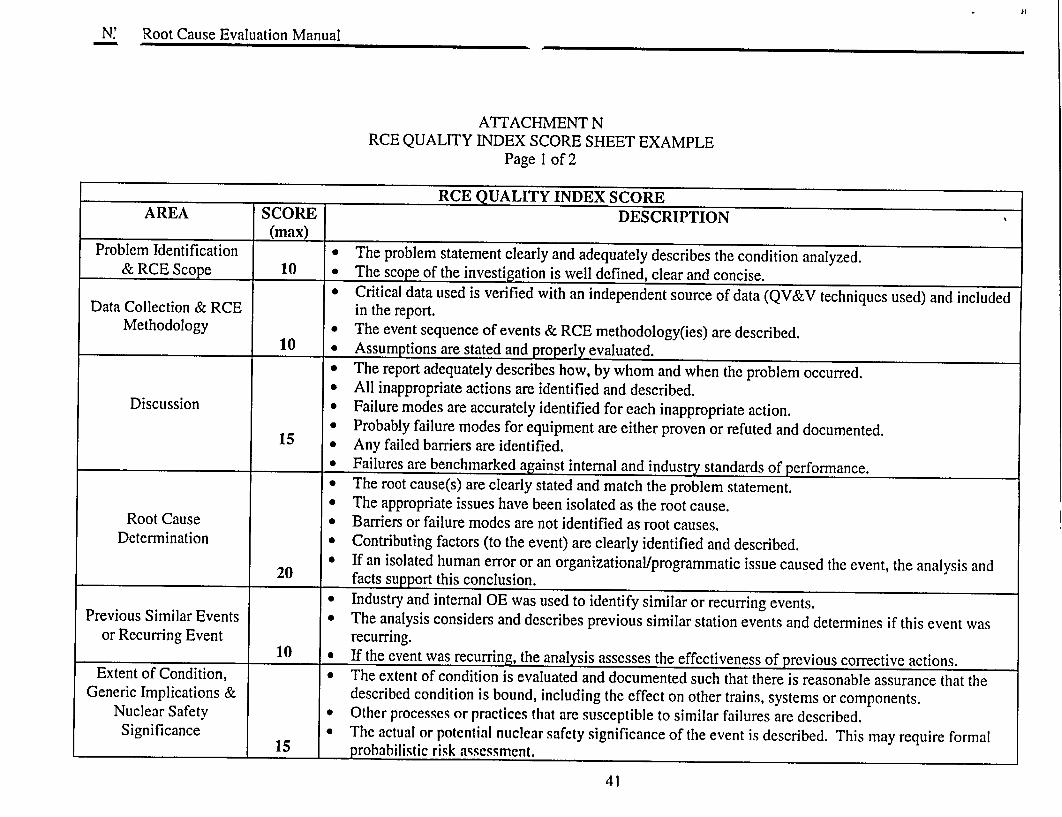
ATTACHMENT N RCE QUALITY INDEX SCORE SHEET EXAMPLE
Page 1 of 2
RCE QUALITY INDEX SCORE AREA SCORE DESCRIPTION
(max) Problem Identification e The problem statement clearly and adequately describes the condition analyzed.
& RCE Scope 10 • The scope of the investigation is well defined, clear and concise. * Critical data used is verified with an independent source of data (QV&V techniques used) and included
Data Collection & RCE in the report. Methodology * The event sequence of events & RCE methodology(ies) are described.
10 0 Assumptions are stated and properly evaluated. * The report adequately describes how, by whom and when the problem occurred. * All inappropriate actions are identified and described.
Discussion 0 Failure modes are accurately identified for each inappropriate action. * Probably failure modes for equipment are either proven or refuted and documented.
15 0 Any failed barriers are identified. * Failures are benchmarked against internal and industry standards of performance. * The root cause(s) are clearly stated and match the problem statement. * The appropriate issues have been isolated as the root cause.
Root Cause a Barriers or failure modes are not identified as root causes. Determination * Contributing factors (to the event) are clearly identified and described.
* If an isolated human error or an organizational/programmatic issue caused the event, the analysis and 20 facts support this conclusion.
* Industry and internal OE was used to identify similar or recurring events. Previous Similar Events e The analysis considers and describes previous similar station events and determines if this event was
or Recurring Event recurring. 10 & If the event was recurring, the analysis assesses the effectiveness of previous corrective actions.
Extent of Condition, 0 The extent of condition is evaluated and documented such that there is reasonable assurance that the Generic Implications & described condition is bound, including the effect on other trains, systems or components.
Nuclear Safety 0 Other processes or practices that are susceptible to similar failures are described. Significance 0 The actual or potential nuclear safety significance of the event is described. This may require formal
15 probabilistic risk assessment.
41

N' Root Cause Evaluation Manual
* Corrective Actions to Prevent Recurrence (CATPR) address each root cause and are clearly identified. * Corrective actions are cost effective, under management's span of control, meet or exceed industry
standards, and can be implemented by reasonable action. o Necessary immediate and interim corrective actions have been taken.
Corrective Actions • Corrective actions to address contributing factors are separated from CATPRs. • Corrective actions have an agreed to owner, due date and priority. o The corrective actions do not have the potential to introduce new problems. 2 The RCE contains provisions for performance of an Effectiveness Review. If it does not, there is
20 adequate justification for not performing one.
Total Score (Max = 100) The NMC goal is for all RCEs to score above 75.
SCORED BY: DATE:
GENERAL COMMENTS:
42

ATTACHMENT 0 ROOT CAUSE ANALYSIS PACKAGE
COMPLETION CHECKLIST Page 1 of 2
Data Sources
Documentation required to support factual statements is included or referenced to retrievable documents.
Evaluation Sources
The RCE Manual was used to determine which method of causal factor analysis is most appropriate for each category of event. (More than one method may be necessary to fully analyze the event or condition.) Documentation (e.g., worksheets, checklists, statements, copies of stripcharts) is referenced in the report and attached to confirm the method used to determine the root causes and causal factors and make a complete record.
Method(s) - Check method(s) used to determine root cause(s)
Event & Causal Factor Chart Fault Tree Analysis Change Analysis Barrier Analysis Other (describe):
Human Performance Analysis O &P Failure Analysis
Equipment Failure Analysis Task Analysis
Scope
Scope of evaluation addresses Action Request problem statement(s) and Plant Manager's direction.
Safety Significance
_ _ Probabilistic Risk Assessment contacted for assessing nuclear safety significance of the event.
Benchmarking/Extent of Condition
Internal and external operating experience have been checked for adverse trends/conditions. INPO Nuclear NETWORK or other sources have been used to identify industry standards.
43

ATTACHMENT 0 ROOT CAUSE ANALYSIS PACKAGE
COMPLETION CHECKLIST Page 2 of 2
Validation
Root causes and contributing factors were tested for validity.
Corrective Actions
Each root cause has a recommendation aimed at eliminating or minimizing its recurrence. (Contributing factors have corrective actions if appropriate.) Corrective Actions to Prevent Recurrence (CAPR or CATPR) are clearly identified. The appropriate group for implementation is identified for each corrective action. All corrective actions have been entered into the Action Request Process for follow-up.
Report/Communications
The report is in the format recommended. Peer review has been completed.
Report has been submitted to CAP Coordinator for quality scoring. Report has been approved by the appropriate group manager. Report has been submitted to CAP Coordinator for final distribution.
44

ATTACHMENT P EFFECTIVENESS REVIEWS
Page 1 of3
I. Effectiveness review action(s), assignment and due date (may be tied to corrective action completion) should be provided in all RCEs, or justification provided for non-performance.
2. Effectiveness review actions shall be tracked under the Action Request in the Action Request Program, and tagged with an identifier to allow exclusion for certain performance indicators, e.g., action average age.
3. A request for non-performance of an effectiveness review should be justified in the RCE and approved by CARB during the normal RCE review process.
4. It is expected that a majority of RCEs should have an effectiveness review. The CAP Coordinator will periodically compile these statistics and report to CARB.
5. Justification for NOT performing an effectiveness review:
"* Root/Significant Contributing Cause(s) not found. There are no CATPRs. "* Problem and correction is direct and straight forward, completion of corrective actions ensure
non-recurrence; e.g., incorrect valve position in a checklist.
"* Problem/cause is old and occurred under an old system/process. Analysis of the new system in the RCE indicated that the problem has not, and will not occur under the new system.
"* Cause was isolated human performance problem, with data justification for isolated human error provided in the RCE.
"* Equipment "run to failure" on purpose.
"* Isolated/spurious equipment failure, with no indication of an adverse trend, and no indication that extent of condition correction is warranted.
" A "de facto" effectiveness review has been performed in the interim - e.g., a self assessment has been performed that substantiates the effectiveness of the CATPR(s).
" Normal/existing performance monitoring is adequate to detect non-effective corrective actions before a significant problem recurs.
45

ATTACHMENT P EFFECTIVENESS REVIEWS
Page 2 of 3
Guidelines for performance of effectiveness reviews:
Effectiveness Reviews are performed after significant corrective actions (CATPRs and actions to address significant contributing causes) have been implemented to ensure the RCE identified and corrected the root cause(s). This is a proactive assessment of the corrective actions versus waiting for an event challenge to determine effectiveness. The depth and duration of an effectiveness review should be commensurate with the significance and complexity of the problem. The following provides general guidance:
1.0 The effectiveness review should ensure the following:
* all corrective actions to prevent recurrence are complete * the condition and cause(s) were corrected * no additional corrective actions are required * the corrective actions did not create any new adverse conditions
2.0 The effectiveness review can be performed using various techniques including:
* field verification or observation * audit * surveillance * self-assessment or assessment from outside entities, mini- (focused) assessment * survey (formal or informal) * records (e.g., logs, Action Requests) review * personnel interviews * testing
3.0 Effectiveness reviews will be tracked as action items in the CAP database.
4.0 If corrective actions have not been effective at removing the root cause or condition, initiate a CR to document the ineffective corrective action.
5.0 Completed Effectiveness Reviews should be presented to CARB as requested.
46

ATTACHMENT P EFFECTIVENESS REVIEWS
Page 3 of 3
Examples:
A root cause analysis was performed to determine why appropriate LCOs were not entered during an event. The root cause analysis determined that there was a lack of knowledge and understanding by the operators of the basis and requirements of certain technical specifications (knowledge based error on the part of several operators).
* The corrective action to prevent recurrence was to provide training on the basis and requirements of the technical specifications in question, and provide practical application in the classroom and simulator.
* An effectiveness review could be performed to determine if the classroom and simulator training adequately resolved the knowledge and application deficit by administering a test in re-qualification training after the corrective actions have been completed.
2 A root cause analysis was performed to determine why non-QA parts were installed on a QA component. The root cause analysis determined that the planner writing the work plan did not understand the method used to determine quality classification of sub-components or class breaks. The root cause also determined that the problem was widespread in the organization, that green lines were rarely used, and that the green lines were not readily accessible to the planners.
" Corrective actions to prevent recurrence included placing the green line prints in the area, training on their use, and establishing clear expectations for their use.
" In this case, an effectiveness review could be performed to determine if the work practice of the planners has been favorably impacted after completion of the corrective actions by performing a mini-self assessment by monitoring, observing, and discussing determination of quality classification with the planners.
Note that in both examples:
"* Corrective actions to prevent recurrence were targeted for the effectiveness review. "* The conditions were not due to isolated human error. "* The effectiveness review is proactive; i.e., it is focused at measuring the effect of the corrective
actions before the organization is challenged.
47
EXHIBIT Q RCE TEMPLATE
Com•mtned to Nuclear E uIen [NMC Site Plan t Name]
[REPORT TITLE]
RCE [Year - Number]
CR [Year - Number]
Event Date:
Principle Investigators:
[Name(s)]
Approvals:
CAP Manager Date
Manager Date
48