root cause analysis for probe mark control · conclusion c.w. chiang, et al. 21 • through above...
TRANSCRIPT

Root cause analysis for probe mark control
• Author DetailsCHAO WEN CHIANG CHIA WEI CHEN SHU JENG YEHMIN CHANG TU JYUN HAO LIN LING CHUN FANG
Presenters' BiographyCHAO WEN CHIANG• Master degree in mechanical engineering from Chang‐Gung University ,
Taiwan, 2004• 2006 join the WIN semiconductor Corp. • Major in WAT and visual inspection to improve testing.
2C.W. Chiang, et al.
CHIA WEI CHEN• Master degree in electrical engineering from National Central University,
Taiwan, 2006• 2007 join the WIN semiconductor Corp.• Major in the 100% wafer probing both on DC and RF testing.

Pass NG
Introduction / Background• We are belong to the wafer testing division from WIN semiconductor
foundry. • Probe mark uncertainties of thin GaAs wafer are major problems that we
met and result in wafer scrap. • The following photos show the result between pass and NG.
3C.W. Chiang, et al.
Idea inspiration
4C.W. Chiang, et al.
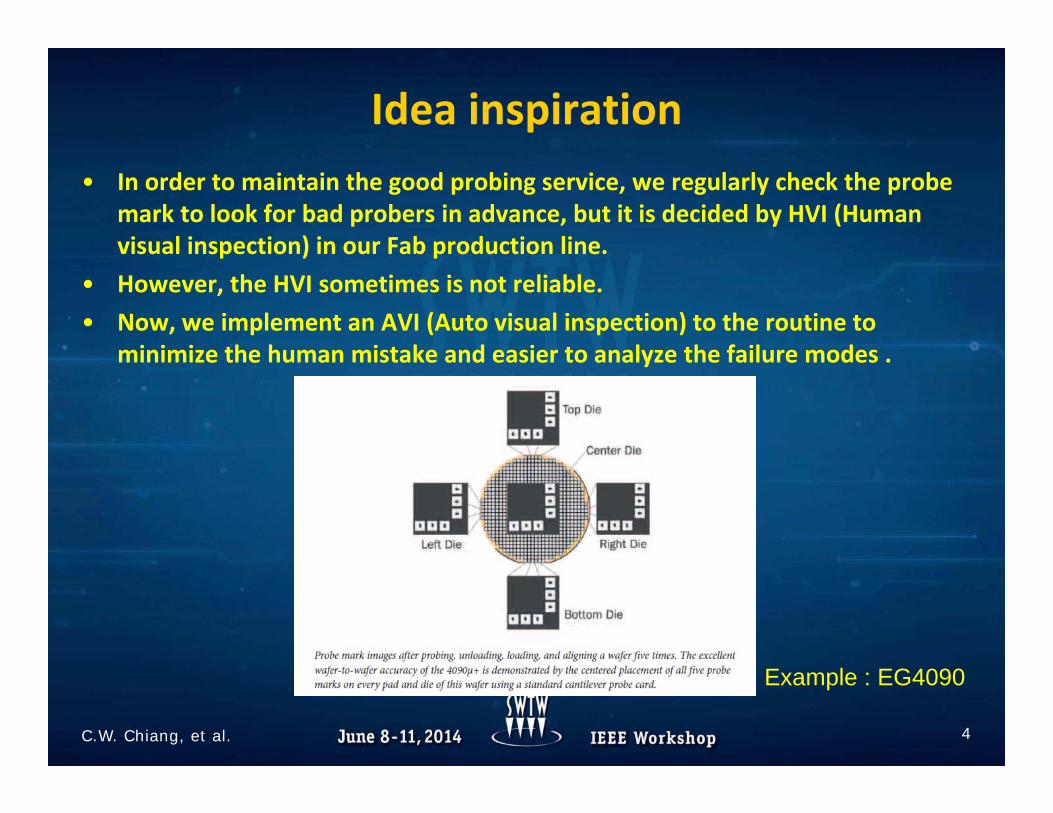
• In order to maintain the good probing service, we regularly check the probe mark to look for bad probers in advance, but it is decided by HVI (Human visual inspection) in our Fab production line.
• However, the HVI sometimes is not reliable.• Now, we implement an AVI (Auto visual inspection) to the routine to
minimize the human mistake and easier to analyze the failure modes .
Example : EG4090

Objectives / Goals
• The misalignment of probe mark has an important impact on wafer probing quality and throughput.
• We would like to check characteristics of probe mark for the purpose of analysis.
• Probe mark is a direct indication and a key point to express how well the prober works, therefore, the inspection to check probe mark is an essential procedure to wafer probing house. To distinguish misalignment from prober, thin wafer or operation is the main idea of our objective.
• It conducts accuracy and cycle time of foundry testing service well.
5C.W. Chiang, et al.

Methods (1/2)
• In this presentation, we will demonstrate how this wafer probe mark inspection check system that can analyze these probe mark failure modes (Linearity, Rotation, Orthogonality, and Offset) of prober to improve our wafer probing quality and prober utilization rate.
• A probe card and a wafer are necessary. We will take pad image of one die per reticle from both the X‐axial and Y‐axial. Based on the image, it will be processed by LabView program to arrange a recursion chart and pull out the region of interest to analyze the root cause of probe mark misalignment.
6C.W. Chiang, et al.

Methods (2/2)
• The analysis purpose includes two categories, one is to distinguish failure modes and the other is to do periodically quality check. According to analysis results, it can tell us the misalignment is from prober or operation.
• Four parameters as below are extracted from recursion chart.1. Linearity : linear movement of X‐axial and Y‐axial.2. Rotationality : theta rotation of X‐axial and Y‐axial. 3. Orthogonality : Orthogonal correlation of X‐axial and Y‐axial.4. Offset : probe mark position correctness over whole wafer.
7C.W. Chiang, et al.
Procedure
8C.W. Chiang, et al.
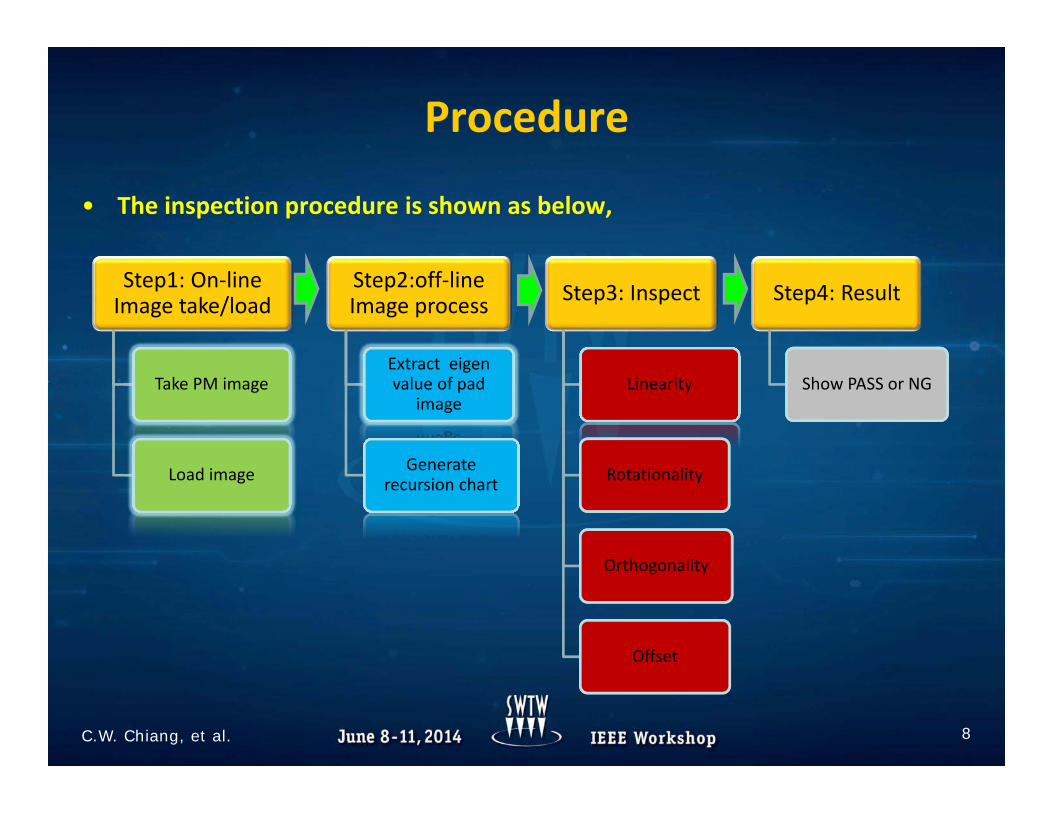
Step1: On‐line Image take/load
Take PM image
Load image
Step2:off‐line Image process
Extract eigenvalue of pad
image
Generate recursion chart
Step3: Inspect
Linearity
Rotationality
Orthogonality
Offset
Step4: Result
Show PASS or NG
• The inspection procedure is shown as below,
Procedure‐Step1
9C.W. Chiang, et al.
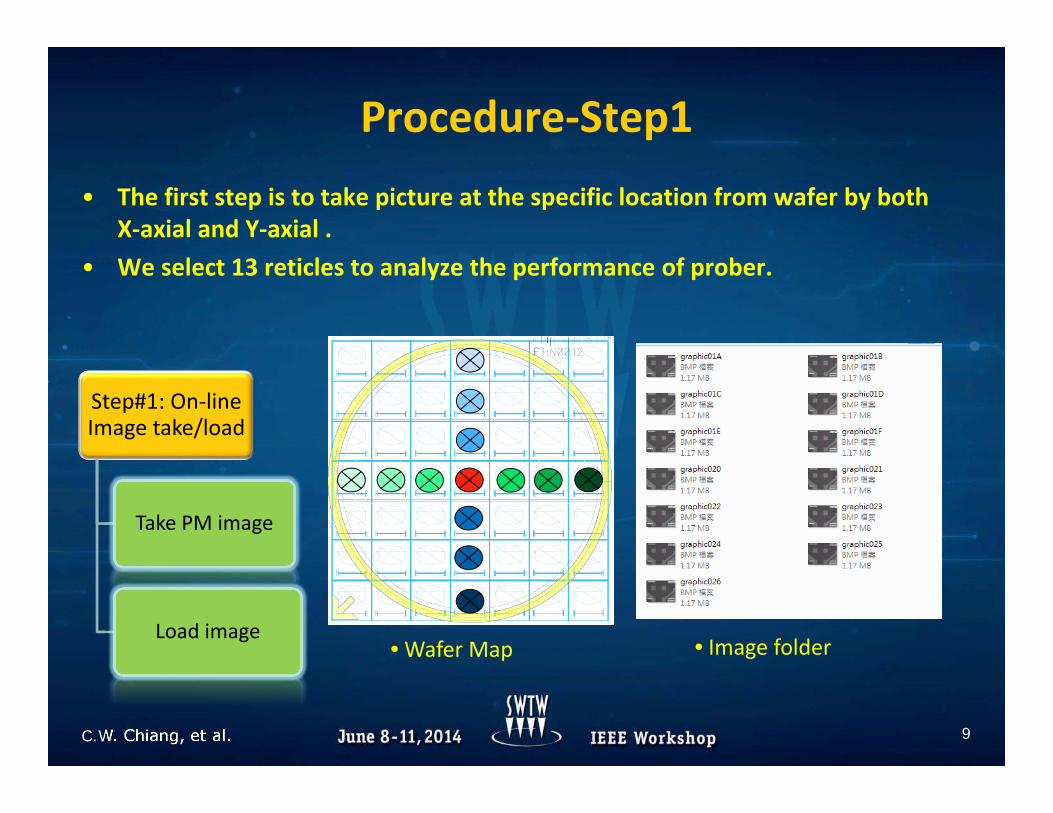
• The first step is to take picture at the specific location from wafer by both X‐axial and Y‐axial .
• We select 13 reticles to analyze the performance of prober.
Step#1: On‐line Image take/load
Take PM image
Load image• Image folder• Wafer Map
Procedure‐Step2
10C.W. Chiang, et al.
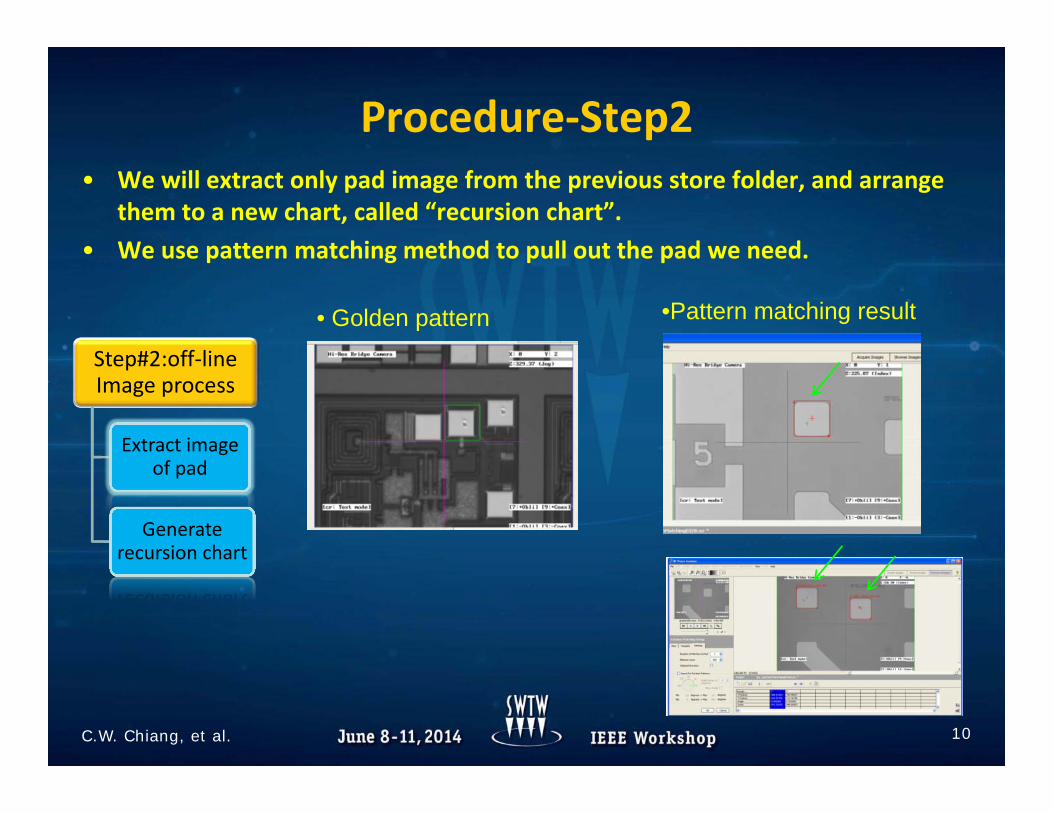
• We will extract only pad image from the previous store folder, and arrange them to a new chart, called “recursion chart”.
• We use pattern matching method to pull out the pad we need.
Step#2:off‐line Image process
Extract image of pad
Generate recursion chart
• Golden pattern •Pattern matching result

Procedure‐Step2 (Cont'd)
11C.W. Chiang, et al.
• Based on the method, the pad image can be extracted correctly.
• Then, we can generate the recursion chart after finishing extraction from these pictures. This chart consists of the pad from both X‐axial and Y‐axial.
Procedure‐Step3
12C.W. Chiang, et al.
Inspect
Linearity
Rotationality
Orthogonality
Offset
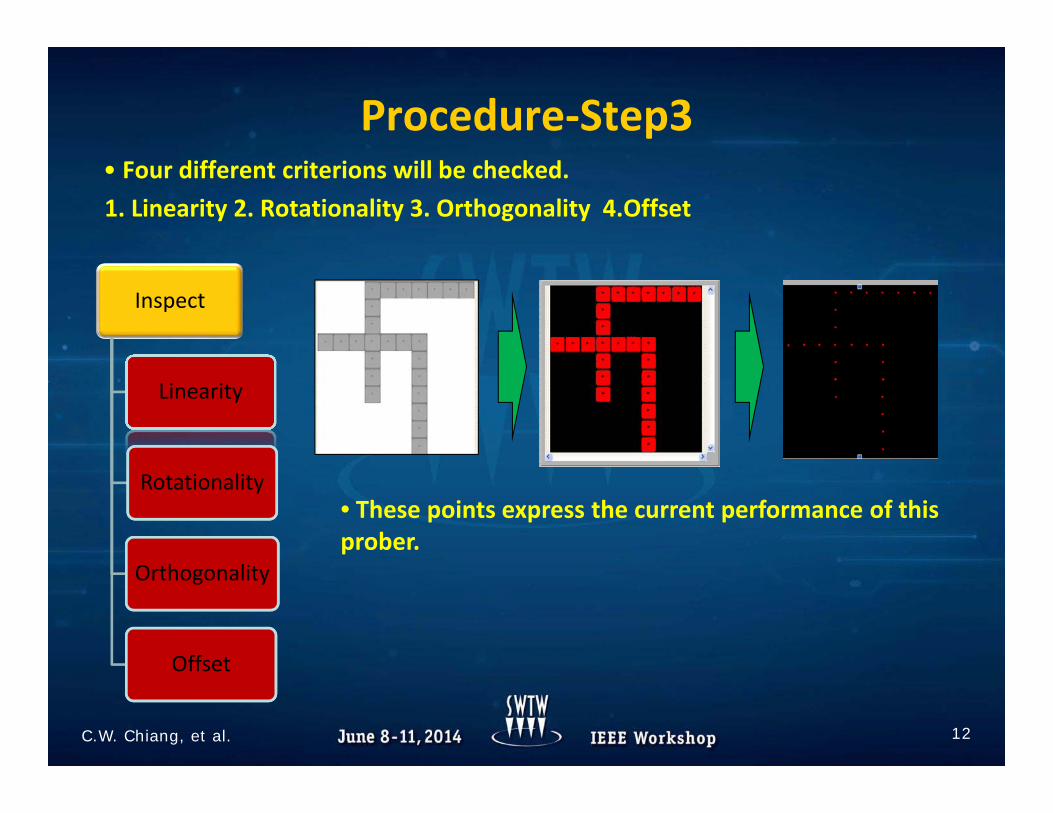
• Four different criterions will be checked.1. Linearity 2. Rotationality 3. Orthogonality 4.Offset
• These points express the current performance of this prober.

Procedure‐Step3 (Cont'd)
13C.W. Chiang, et al.
L1. L4.
L3.L2.
A1.A2.
A3.
Linearity Rotationality
Orthogonality
Offset
Procedure‐Step4
14C.W. Chiang, et al.
Step4: Result
Show PASS or NG
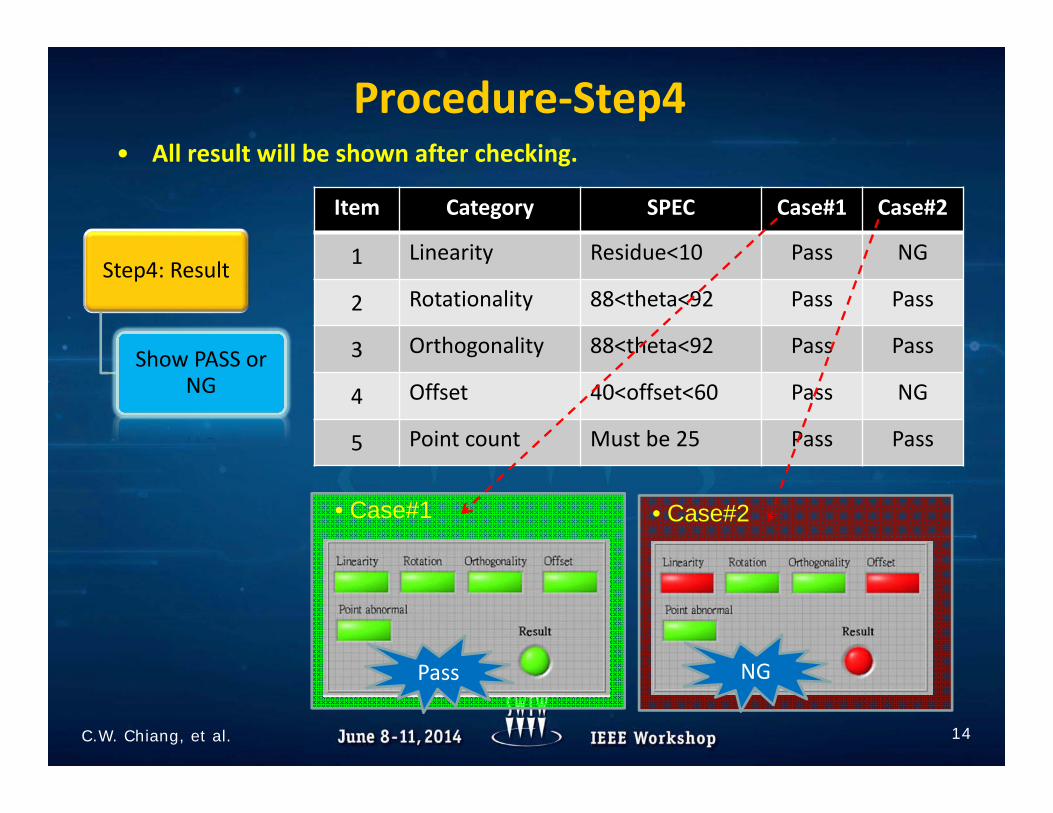
• All result will be shown after checking.
Item Category SPEC Case#1 Case#2
1 Linearity Residue<10 Pass NG
2 Rotationality 88<theta<92 Pass Pass
3 Orthogonality 88<theta<92 Pass Pass
4 Offset 40<offset<60 Pass NG
5 Point count Must be 25 Pass Pass
• Case#1
Pass
• Case#2
NG

Result‐case#1
15C.W. Chiang, et al.
• Normal

Result‐case#2
16C.W. Chiang, et al.
• One point fail.

Result‐case#3
17C.W. Chiang, et al.
• Y-axial fail.
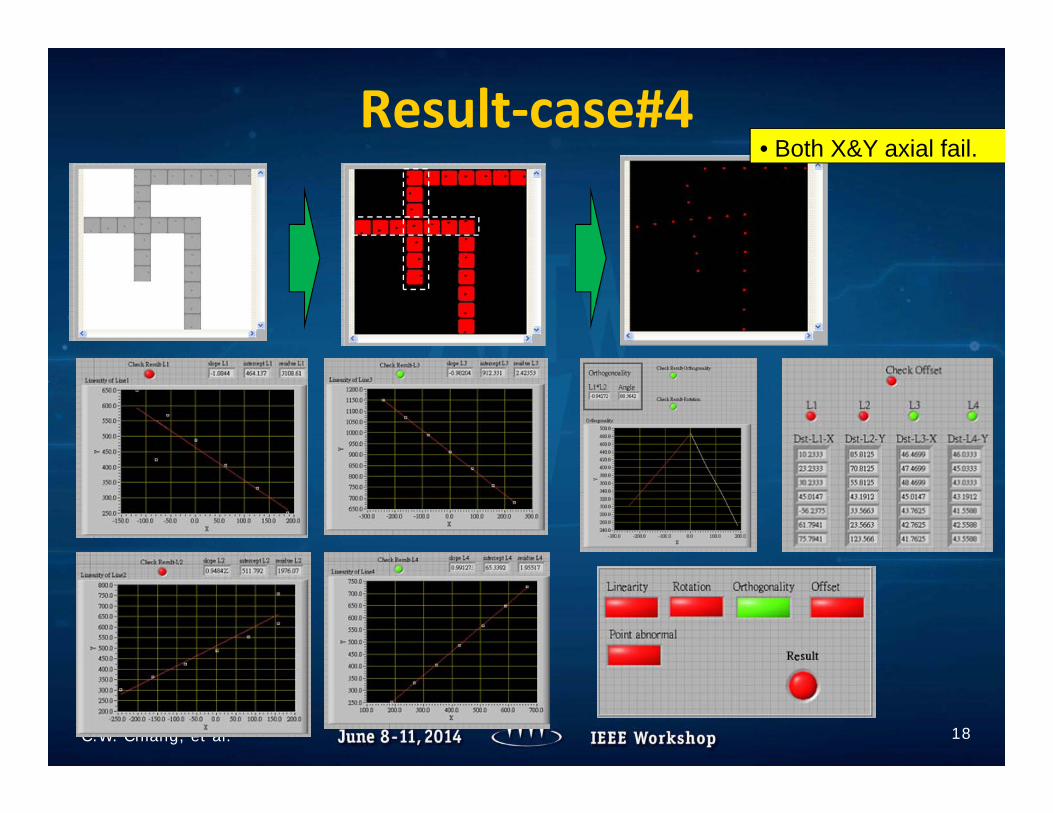
Result‐case#4
18C.W. Chiang, et al.
• Both X&Y axial fail.

Discussion of Results
19C.W. Chiang, et al.
Linearity check Rotationality check Orthogonality check Offset check
• Calculate 4 linear equation.
• Calculate the angle • Calculate the statusof orthogonalithy.
• Calculate the offset of each pad.
• To our experience, Orthogonality and linear failures are mostly from prober itself, offset failure is from operation, and rotation failure is from prober and wafer, probe card or operation.

Summary
20C.W. Chiang, et al.
Pass 1‐point NG 1‐axial NG 2‐axial NG

Conclusion
21C.W. Chiang, et al.
• Through above method, we can quickly decide the misalignment root cause, such that we can fix it on the right way that save both time and money.
• After implementing the method to periodically check prober indexing, we get three major advantages,– Efficiency : The recursion chart is created automaticallywithout handiwork.
– Accuracy : The result is checked by software without any subjective opinion.
– Reliability/Repeatability: The result is the same whatever who executes the program.
• UI

Follow‐On Work
22C.W. Chiang, et al.
• Regarding step1 (On‐line Image take/load), we would like to make it easy while taking picture. We will implement a footswitch to replace keyboard to improve the procedure.
• Meanwhile, we are thinking a method which can make sure PM situation while probing, and don’t suffer lots of testing time.
OM
Monitor
Scanner
Foot switch
Computer
Hardware

M a n y T h a n k s
23C.W. Chiang, et al.