roosevelt independent school district annual …
TRANSCRIPT
ROOSEVELT INDEPENDENT SCHOOL DISTRICT
ANNUAL FINANCIAL REPORT
FOR THE YEAR ENDED JUNE 30, 2019
BOLINGER, SEGARS, GILBERT & MOSS, L.L.P. CERTIFIED PUBLIC ACCOUNTANTS
LUBBOCK, TEXAS
ROOSEVELT INDEPENDENT SCHOOL DISTRICT
ANNUAL FINANCIAL REPORT
FOR THE YEAR ENDED JUNE 30, 2019
Bolinger, Segars, Gilbert & Moss, L.L.p. CERTIFIED PUBLIC ACCOUNTANTS

ROOSEVELT INDEPENDENT SCHOOL DISTRICT
ANNUAL FINANCIAL REPORT FOR THE YEAR ENDED JUNE 30, 2019
TABLE OF CONTENTS (CONTINUED) Page Exhibit CERTIFICATE OF BOARD FINANCIAL SECTION Independent Auditor’s Report Unmodified Opinions on the Basic Financial Statements ........................................... 1 Management’s Discussion and Analysis (Required Supplementary Information) ...... 4 Basic Financial Statements Government-Wide Financial Statements Statement of Net Position ..................................................................................... 11 A-1 Statement of Activities .......................................................................................... 12 B-1 Governmental Fund Financial Statements Balance Sheet ....................................................................................................... 13 C-1 Reconciliation of the Governmental Funds Balance Sheet to the Statement of Net Position ..................................................................................................... 14 C-2 Statement of Revenues, Expenditures, and Changes in Fund Balances ............. 15 C-3 Reconciliation of the Statement of Revenues, Expenditures, and Changes in Fund Balances of Governmental Funds to the Statement of Activities ........... 16 C-4 Proprietary Fund Financial Statements Statement of Net Position ..................................................................................... 17 D-1 Statement of Revenues, Expenses, and Changes in Net Position ....................... 18 D-2 Statement of Cash Flows ...................................................................................... 19 D-3 Fiduciary Fund Financial Statements Statement of Fiduciary Net Position ...................................................................... 20 E-1 Notes to Financial Statements .................................................................................... 21 Required Supplementary Information Budgetary Comparison Schedule – General Fund ..................................................... 49 G-1 Schedules of the District’s Proportionate Share of the Net Pension Liability .............. 50 G-2 Schedules of District Contributions for Pensions ........................................................ 51 G-3 Schedules of District’s Proportionate Share of the Net OPEB Liability ....................... 52 G-4 Schedules of District Contributions for Other Post-Employment Benefits .................. 53 G-5 Notes to Required Supplementary Information ........................................................... 54
Bolinger, Segars, Gilbert & Moss, L.L.p. CERTIFIED PUBLIC ACCOUNTANTS
ROOSEVELT INDEPENDENT SCHOOL DISTRICT
ANNUAL FINANCIAL REPORT FOR THE YEAR ENDED JUNE 30, 2019
TABLE OF CONTENTS (CONCLUDED) Page Exhibit Other Supplementary Information Combining Schedules - Non-Major Governmental Funds Combining Balance Sheet .................................................................................... 56 H-1 Combining Statement of Revenues, Expenditures, and Changes in Fund Balances .................................................................................................... 57 H-2 Required Texas Education Agency Schedules Schedule of Delinquent Taxes Receivable ........................................................... 59 J-1 Budgetary Comparison Schedule – Child Nutrition Fund ..................................... 60 J-2 Budgetary Comparison Schedule – Debt Service Fund ....................................... 61 J-3 OVERALL COMPLIANCE AND INTERNAL CONTROL SECTION Report on Internal Control Over Financial Reporting and on Compliance and Other Matters Based on an Audit of the Financial Statements Performed in Accordance with Government Auditing Standards .................................................. 62 Report on Compliance for Each Major Federal Program and Report On Internal Control over Compliance Required by Uniform Guidance .................... 64 FEDERAL FINANCIAL ASSISTANCE SECTION Schedule of Findings and Questioned Costs .............................................................. 66 Schedule of Status of Prior Year Findings .................................................................. 67 Schedule of Expenditures of Federal Awards ............................................................. 68 K-1 Notes to the Supplementary Schedule of Expenditures of Federal Awards .............. 69
Bolinger, Segars, Gilbert & Moss, L.L.p. CERTIFIED PUBLIC ACCOUNTANTS
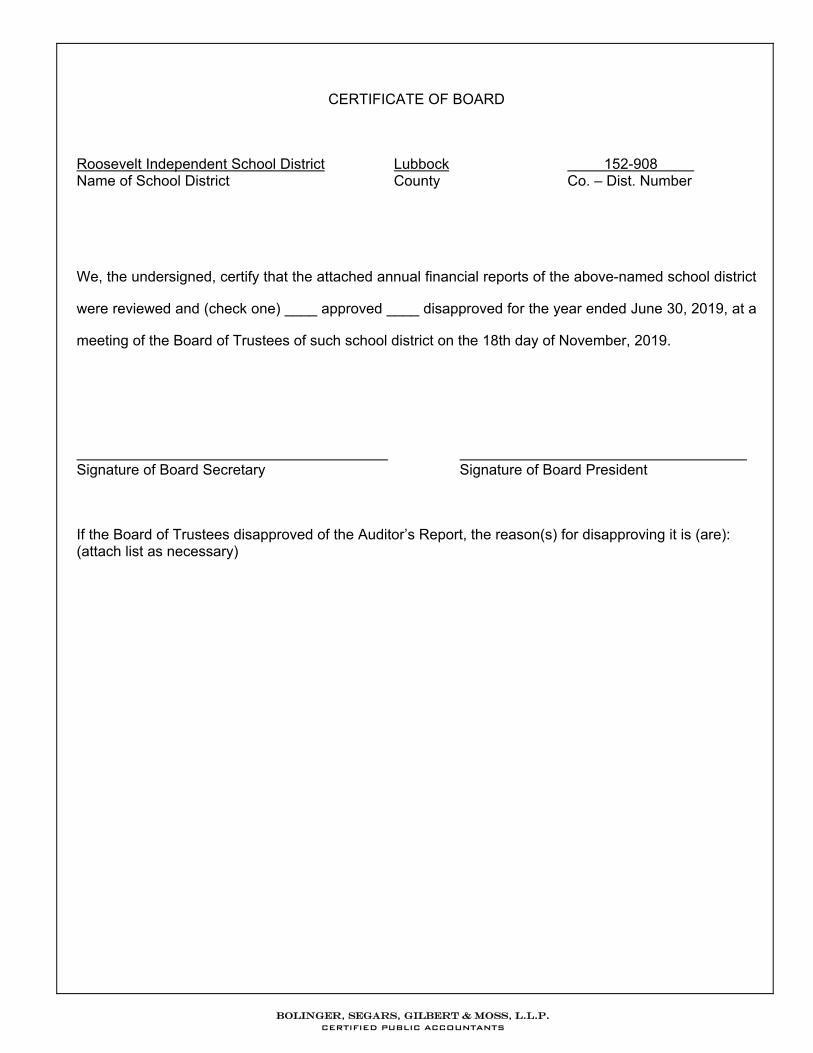
CERTIFICATE OF BOARD
Roosevelt Independent School District Lubbock 152-908 Name of School District County Co. – Dist. Number
We, the undersigned, certify that the attached annual financial reports of the above-named school district
were reviewed and (check one) ____ approved ____ disapproved for the year ended June 30, 2019, at a
meeting of the Board of Trustees of such school district on the 18th day of November, 2019.
Signature of Board Secretary Signature of Board President
If the Board of Trustees disapproved of the Auditor’s Report, the reason(s) for disapproving it is (are): (attach list as necessary)
Bolinger, Segars, Gilbert & Moss, L.L.p. CERTIFIED PUBLIC ACCOUNTANTS

FINANCIAL SECTION
Bolinger, Segars, Gilbert & Moss, L.L.p. CERTIFIED PUBLIC ACCOUNTANTS

BOLINGER, SEGARS, GILBERT & MOSS, L.L.P. c e r t i f i e d p u b l i c a c c o u n t a n t s
PHONE: (806) 747-3806
FAX: (806) 747-3815
8215 Nashville Avenue
LUBBOCK, TEXAS 79423-1954
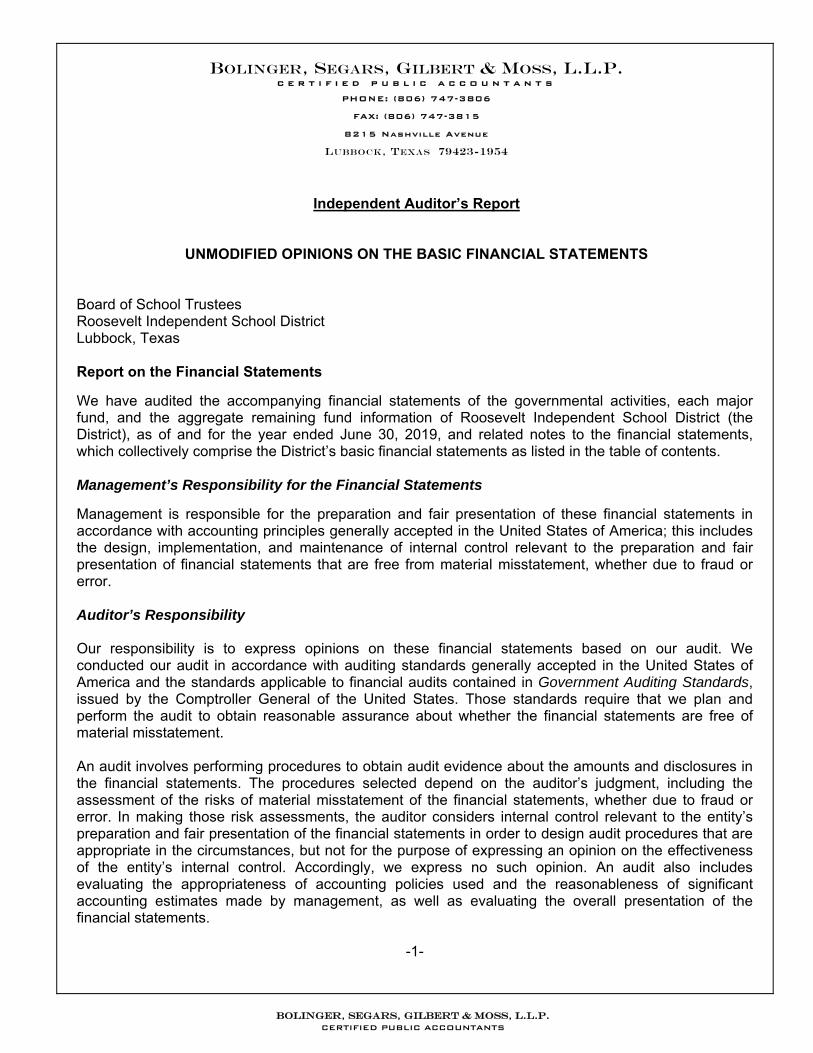
Independent Auditor’s Report
UNMODIFIED OPINIONS ON THE BASIC FINANCIAL STATEMENTS Board of School Trustees Roosevelt Independent School District Lubbock, Texas Report on the Financial Statements
We have audited the accompanying financial statements of the governmental activities, each major fund, and the aggregate remaining fund information of Roosevelt Independent School District (the District), as of and for the year ended June 30, 2019, and related notes to the financial statements, which collectively comprise the District’s basic financial statements as listed in the table of contents. Management’s Responsibility for the Financial Statements
Management is responsible for the preparation and fair presentation of these financial statements in accordance with accounting principles generally accepted in the United States of America; this includes the design, implementation, and maintenance of internal control relevant to the preparation and fair presentation of financial statements that are free from material misstatement, whether due to fraud or error. Auditor’s Responsibility Our responsibility is to express opinions on these financial statements based on our audit. We conducted our audit in accordance with auditing standards generally accepted in the United States of America and the standards applicable to financial audits contained in Government Auditing Standards, issued by the Comptroller General of the United States. Those standards require that we plan and perform the audit to obtain reasonable assurance about whether the financial statements are free of material misstatement. An audit involves performing procedures to obtain audit evidence about the amounts and disclosures in the financial statements. The procedures selected depend on the auditor’s judgment, including the assessment of the risks of material misstatement of the financial statements, whether due to fraud or error. In making those risk assessments, the auditor considers internal control relevant to the entity’s preparation and fair presentation of the financial statements in order to design audit procedures that are appropriate in the circumstances, but not for the purpose of expressing an opinion on the effectiveness of the entity’s internal control. Accordingly, we express no such opinion. An audit also includes evaluating the appropriateness of accounting policies used and the reasonableness of significant accounting estimates made by management, as well as evaluating the overall presentation of the financial statements.
-1-
Bolinger, Segars, Gilbert & Moss, L.L.p. CERTIFIED PUBLIC ACCOUNTANTS
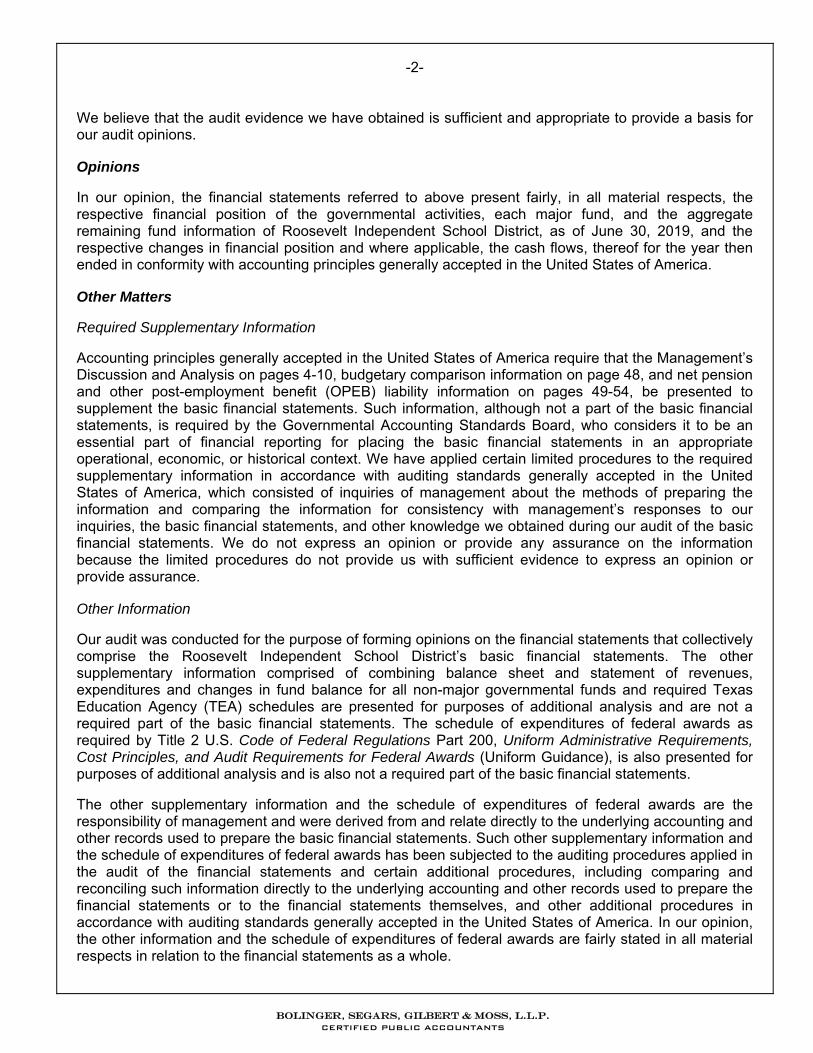
-2- We believe that the audit evidence we have obtained is sufficient and appropriate to provide a basis for our audit opinions. Opinions In our opinion, the financial statements referred to above present fairly, in all material respects, the respective financial position of the governmental activities, each major fund, and the aggregate remaining fund information of Roosevelt Independent School District, as of June 30, 2019, and the respective changes in financial position and where applicable, the cash flows, thereof for the year then ended in conformity with accounting principles generally accepted in the United States of America. Other Matters Required Supplementary Information Accounting principles generally accepted in the United States of America require that the Management’s Discussion and Analysis on pages 4-10, budgetary comparison information on page 48, and net pension and other post-employment benefit (OPEB) liability information on pages 49-54, be presented to supplement the basic financial statements. Such information, although not a part of the basic financial statements, is required by the Governmental Accounting Standards Board, who considers it to be an essential part of financial reporting for placing the basic financial statements in an appropriate operational, economic, or historical context. We have applied certain limited procedures to the required supplementary information in accordance with auditing standards generally accepted in the United States of America, which consisted of inquiries of management about the methods of preparing the information and comparing the information for consistency with management’s responses to our inquiries, the basic financial statements, and other knowledge we obtained during our audit of the basic financial statements. We do not express an opinion or provide any assurance on the information because the limited procedures do not provide us with sufficient evidence to express an opinion or provide assurance. Other Information Our audit was conducted for the purpose of forming opinions on the financial statements that collectively comprise the Roosevelt Independent School District’s basic financial statements. The other supplementary information comprised of combining balance sheet and statement of revenues, expenditures and changes in fund balance for all non-major governmental funds and required Texas Education Agency (TEA) schedules are presented for purposes of additional analysis and are not a required part of the basic financial statements. The schedule of expenditures of federal awards as required by Title 2 U.S. Code of Federal Regulations Part 200, Uniform Administrative Requirements, Cost Principles, and Audit Requirements for Federal Awards (Uniform Guidance), is also presented for purposes of additional analysis and is also not a required part of the basic financial statements. The other supplementary information and the schedule of expenditures of federal awards are the responsibility of management and were derived from and relate directly to the underlying accounting and other records used to prepare the basic financial statements. Such other supplementary information and the schedule of expenditures of federal awards has been subjected to the auditing procedures applied in the audit of the financial statements and certain additional procedures, including comparing and reconciling such information directly to the underlying accounting and other records used to prepare the financial statements or to the financial statements themselves, and other additional procedures in accordance with auditing standards generally accepted in the United States of America. In our opinion, the other information and the schedule of expenditures of federal awards are fairly stated in all material respects in relation to the financial statements as a whole.
Bolinger, Segars, Gilbert & Moss, L.L.p. CERTIFIED PUBLIC ACCOUNTANTS
-3- Other Reporting Required by Government Auditing Standards In accordance with Government Auditing Standards, we have also issued our report dated November 15, 2019, on our consideration of Roosevelt Independent School District’s internal control over financial reporting and our tests of its compliance with certain provisions of laws, regulations, contracts, grant agreements and other matters. The purpose of that report is to describe the scope of our testing of internal control over financial reporting and compliance and the results of that testing, and not to provide an opinion in the internal control over financial reporting or on compliance. That report is an integral part of an audit performed in accordance with Government Auditing Standards in considering Roosevelt Independent School District’s internal control over financial reporting and compliance.
Certified Public Accountants Lubbock, Texas
November 15, 2019
Bolinger, Segars, Gilbert & Moss, L.L.p. CERTIFIED PUBLIC ACCOUNTANTS

-4-
ROOSEVELT INDEPENDENT SCHOOL DISTRICT MANAGEMENT'S DISCUSSION AND ANALYSIS
INTRODUCTION
Our discussion and analysis of the Roosevelt Independent School District’s (the District) financial performance provides an overview of the District's financial performance for the year ended June 30, 2019. It should be read in conjunction with the District's Basic Financial Statements and Independent Auditor’s Report. The Management’s Discussion and Analysis (MD&A) is an element of the financial reporting model adopted by the Governmental Accounting Standards Board (GASB) in their Statement No. 34, Basic Financial Statements – and Management’s Discussion and Analysis – for State and Local Governments. FINANCIAL HIGHLIGHTS
ꞏ The net position of the District increased by $1,313,936. The District’s Statement of Activities showed total revenues were $14,615,747, and expenses totaled $13,301,811. ꞏ During the year ended June 30, 2019, there were changes in assumptions and benefits that increased the pension and OPEB liabilities. The District ended the year, June 30, 2019, with total net position of $7,665,544, including unrestricted (deficit) net position of ($668,912). The balance of cash and investments at June 30, 2019, was $6,131,707. ꞏ During the year, the District made principal payments on bonds of $410,000. Bonds Payable at June 30, 2019 totaled $8,230,000. This compares to a balance of $8,640,000 at June 30, 2018. ꞏ Total government-wide expenses were $13,301,811 for the year ended June 30, 2019; this compares with expenses of $9,525,367 for the year ended June 30, 2018. The District’s total revenues on the Statement of Activities increased from $11,976,133 in 2017-18 to $14,615,747 in 2018-19. These increases are mainly due to the change in assumptions for the OPEB and pension valuations. ꞏ Total general fund expenditures were $12,431,584 for the year ended June 30, 2019. This compares with general fund expenditures of $11,291,502 for the year ended June 30, 2018. This increase is mainly due to increased capital outlay in the current year for the baseball and softball renovations and the culinary arts center. ꞏ The District’s total revenues on the fund financial statements increased from $13,811,369 in 2017-18 to $14,495,168 in 2018-19. OVERVIEW OF THE FINANCIAL STATEMENTS
This annual report consists of a series of financial statements and notes to those statements. The statements are organized so the reader can understand the District as a whole and then proceed to provide an increasingly detailed look at specific financial activities. The government-wide financial statements include the Statement of Net Position and the Statement of Activities. These provide information about the activities of the District as a whole and present a longer-term view of the District's property and debt obligations and other financial matters. They reflect the flow of total economic resources in a manner similar to the financial reports of a business enterprise.
-5-
Fund financial statements report the District's operations in more detail than the government-wide statements by providing information about the District's most significant funds. For governmental activities, these statements tell how services were financed in the short-term as well as what resources remain for future spending. They reflect the flow of current financial resources and supply the basis for tax levies and the appropriations budget. For proprietary activities, fund financial statements tell how the services of the District were sold to departments within the District. The fiduciary statements provide financial information about activities for which the District acts solely as a trustee. The notes to the financial statements provide narrative explanations and additional data needed for full disclosure in the government-wide statements and the fund financial statements. The combining statements for non-major funds contain information about the District's individual non-major funds. The sections labeled TEA Required Schedules and Federal Awards Section contain data used by monitoring or regulatory agencies for assurance that the District is using funds supplied in compliance with the terms of grants. Reporting the District as a Whole Government-Wide Financial Statements The analysis of the District's overall financial condition and operations is presented in the Statement of Net Position and the Statement of Activities. Its primary purpose is to show whether the District is better off or worse off as a result of the year's activities. The Statement of Net Position includes all the District's assets and liabilities at the end of the year while the Statement of Activities includes all the revenues and expenses generated by the District's operations during the year. These statements apply the accrual basis of accounting which is the basis used by private sector companies. All of the current year's revenues and expenses are taken into account regardless of when cash is received or paid. The District's revenues are divided into those provided by outside parties who share the costs of some programs, such as tuition received from students from outside the district and grants provided by the U.S. Department of Education to assist children with disabilities or from disadvantaged backgrounds (program revenues), and revenues provided by the taxpayers or by TEA in equalization funding processes (general revenues). All the District's assets are reported whether they serve the current year or future years. Liabilities are considered regardless of whether they must be paid in the current or future years. These two statements report the District's net position and changes in them. The District's net position (the difference between assets and liabilities) provides one measure of the District's financial health, or financial position. Over time, increases or decreases in the District's net position are one indicator of whether its financial health is improving or deteriorating. To fully assess the overall health of the District, however, you should consider nonfinancial factors as well, such as changes in the District's average daily attendance or its property tax base and the condition of the District's facilities. In the Statement of Net Position and the Statement of Activities, the District is reporting its governmental activities. The District currently has no business-type activities or component units as defined in the GASB Statement No. 34. ꞏ Governmental activities – All of the District's basic services are reported here, including the instruction,
counseling, co-curricular activities, food services, transportation, maintenance, community services, and general administration. Property taxes, tuition, fees, and state and federal grants finance most of these activities.
-6-
Reporting the District's Most Significant Funds
Fund Financial Statements The fund financial statements provide detailed information about the most significant funds–not the District as a whole. Laws and contracts require the District to establish some funds, such as grants received from the U.S. Department of Education through TEA. The District's administration establishes many other funds to help it control and manage money for particular purposes. The District's three fund types – governmental, proprietary and fiduciary – use different accounting approaches. ꞏ Governmental funds – Most of the District's basic services are included in governmental funds. These use
modified accrual accounting (a method that measures the receipt and disbursement of cash and all other financial assets that can be readily converted to cash) and report balances that are available for future spending. The governmental fund statements provide a detailed short-term view of the District's general operations and the basic services it provides. We describe the differences between governmental activities (reported in the Statement of Net Position and the Statement of Activities) and governmental funds in reconciliation schedules following the fund financial statements.
ꞏ Proprietary funds – The District reports the activities for which it charges users (other units of the District) in
proprietary funds using the same accounting methods employed in the Statement of Net Position and the Statement of Activities. The internal service funds (the District’s only category of proprietary funds) report activities that provide worker’s compensation insurance coverage to the District's other programs and activities.
ꞏ Fiduciary funds – The District is the trustee, or fiduciary, for money raised by student activities. The District is
responsible for ensuring that the assets reported in these funds are used only for their intended purposes and by those to whom the assets belong. We exclude these activities from the government-wide financial statements because the District cannot use these assets to finance its operations.
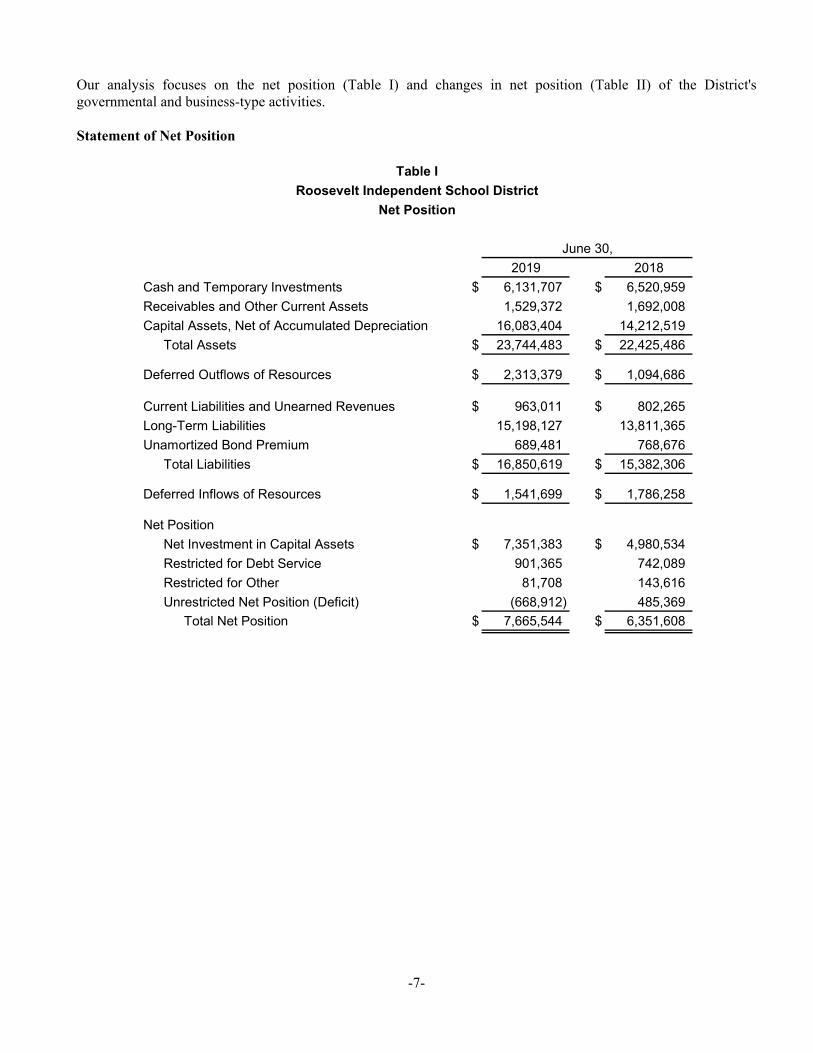
GOVERNMENT-WIDE FINANCIAL ANALYSIS The District’s net position increased during the year ended June 30, 2019, by $1,313,936 (see Table II). Unrestricted net position (deficit) – the part of net position that can be used to finance day-to-day operations without constraints established by debt covenants, enabling legislation, or other legal requirements – decreased from $485,369 in 2018 to ($668,912) mainly due to changes in assumptions and benefits that increased the pension and OPEB liabilities.
-7-
Our analysis focuses on the net position (Table I) and changes in net position (Table II) of the District's governmental and business-type activities. Statement of Net Position
Table I
Roosevelt Independent School District
Net Position
2019 2018
Cash and Temporary Investments $ 6,131,707 $ 6,520,959
Receivables and Other Current Assets 1,529,372 1,692,008
Capital Assets, Net of Accumulated Depreciation 16,083,404 14,212,519
Total Assets $ 23,744,483 $ 22,425,486
Deferred Outflows of Resources $ 2,313,379 $ 1,094,686
Current Liabilities and Unearned Revenues $ 963,011 $ 802,265
Long-Term Liabilities 15,198,127 13,811,365
Unamortized Bond Premium 689,481 768,676
Total Liabilities $ 16,850,619 $ 15,382,306
Deferred Inflows of Resources $ 1,541,699 $ 1,786,258
Net Position
Net Investment in Capital Assets $ 7,351,383 $ 4,980,534
Restricted for Debt Service 901,365 742,089
Restricted for Other 81,708 143,616
Unrestricted Net Position (Deficit) (668,912) 485,369
Total Net Position $ 7,665,544 $ 6,351,608
June 30,
-8-
Changes in Net Position
Table II
Roosevelt Independent School District
Changes in Net Position
Revenues: 2019 2018
Program Revenues:
Charges For Services $ 215,036 $ 217,860
Operating Grants and Contributions 2,850,448 308,828
General Revenues:
Maintenance and Operations Taxes 2,769,359 2,600,149
Debt Service Taxes 546,126 512,784
State Aid Not Restricted 8,122,885 8,267,566
Investment Earnings 111,893 68,946
Total Revenues $ 14,615,747 $ 11,976,133
Expenses:
Instruction $ 6,850,719 $ 4,317,658
Instructional Resources and Media Services 129,066 98,880
Curriculum and Instructional Staff Development 120,999 97,846
Instructional Leadership 48,360 28,181
School Leadership 687,211 448,784
Guidance, Counseling, and Evaluation Services 265,633 179,163
Social Work Services 26,038 19,484
Health Services 111,605 77,988
Student Transportation 610,203 472,607
Food Services 753,919 679,697
Co-curricular / Extracurricular Activities 672,571 529,494
General Administration 534,053 390,259
Plant Maintenance and Operations 1,763,469 1,539,124
Security and Monitoring Services 61,233 76,086
Data Processing Services 133,488 40,949
Debt Service 288,880 299,522
Payments to Fiscal Agent / Member Districts 216,507 202,832
Other Intergovernmental Charges 27,857 26,813
Total Expenses $ 13,301,811 $ 9,525,367
Increase in Net Position $ 1,313,936 $ 2,450,766
June 30,
The District's total revenues increased from $11,976,133 in fiscal year 2018 to $14,615,747 in fiscal year 2019, an increase of $2,639,614. The total expenses of the District increased by $3,776,444 from $9,525,367 to $13,301,811. Increases in revenue and expenditures were attributable to the implementation of GASB 75 in the prior year due to the negative allocation of on-behalf amounts. This allocation decreased revenue and decreased expenses in the prior year.
-9-
Other factors impacting the District’s financial position include the following:
The District appraised valuation of taxable property increased from $221,478,579 to $236,686,683 an increase of $15,208,104 or 6.9%. This increase is attributable largely to property reappraisals including mineral rights. The M&O tax rate was $1.17 in 2017-2018 and 2018-2019. The total school property taxes assessed for school year 2019 were $3,280,477. This is an increase of $177,562 from the $3,102,915 assessed in 2018.
Total tax collections for 2019 were $3,223,312 (98.3% of the current year levy). The tax collections for 2018 were $3,065,249 (98.8% of the current year levy).
Fund Balances The District’s total Governmental Funds fund balance was $6,402,590. This fund balance is reported in the various Governmental funds as follows: General Fund: $5,477,659 – Of this balance, $898,657 is committed for future construction and equipment purchases. $4,539,374 is available for current spending; however, it has been the practice of the District to try and maintain a fund balance that is at least several months operating expenses. In addition, $39,628 is classified as non-spendable fund balance associated with inventories and prepaid items. The balance in the General Fund in 2018 was $6,275,180. Debt Service Fund: $843,223 – This balance is restricted for extinguishing of long-term debt. The fund balance restricted for Debt Service in 2018 was $745,082. Special Revenue Fund: $81,708 – This balance is restricted for purposes associated with these special revenue funds. The fund balance restricted in 2018 was $143,616. Budgetary Highlights Over the course of the year, the Board of Trustees revised the District's budget several times. These budget amendments were necessary to reflect the revised estimates of revenues and expenses. CAPITAL ASSET AND DEBT ADMINISTRATION Capital Assets At the end of 2019, the District had $16,083,404 of capital assets, net of accumulated depreciation. Financial statement Footnote No. 6 discloses the capital asset activity of the District for the year ended June 30, 2019. Debt At June 30, 2019, the District’s long-term debt included $8,230,000 in Bonds Payable, $689,481 in unamortized bond premiums, and $36,163 in accrued leave liability. The funding for the payment of these bonds come from interest and sinking property taxes. Financial statement Footnote No. 9 discloses the debt activity of the District for the year ended June 30, 2019.
-10-
FACTORS BEARING ON THE DISTRICT’S FUTURE
Appraised value used for the 2020 budget preparation is $231,489,988, down 2% from 2019 and up 5% from 2018.
General operating fund spending per student decreases slightly in the 2020 budget from $13,677 to $13,624.
The District’s 2020 refined average daily attendance is expected to be 981.
House Bill 3, passed during the 86th legislative session created an overhaul towards allocating revenues from the state and has increased funding for the District. Although the tax rate which can be assessed on the District’s residents has been compressed this biennium, funding from the state has increased through an increase in the basic allotment for each student.
These indicators were taken into account when adopting the general fund budget for 2020. Amounts available for appropriation in the general fund budget are $13,250,000, an increase of 15% over the final 2019 budget of $11,481,742. Expenditures are budgeted at $12,472,933 for 2020. The largest increase was teacher salary schedule adjustments due to House Bill 3 followed by two improvement projects to the district: Phase 4 of the elementary bathroom renovations and a new elevator lift in the secondary building to be constructed in 2020. CONTACTING THE DISTRICT'S FINANCIAL MANAGEMENT This financial report is designed to provide our citizens, taxpayers, and creditors with a general overview of the District's finances and to show the District's accountability for the money it receives. If you have questions about this report or need additional financial information, contact the District's business office, at Roosevelt Independent School District, 1406 County Road 3300, Roosevelt, Texas 79403.

BASIC FINANCIAL STATEMENTS
Bolinger, Segars, Gilbert & Moss, L.L.p. CERTIFIED PUBLIC ACCOUNTANTS

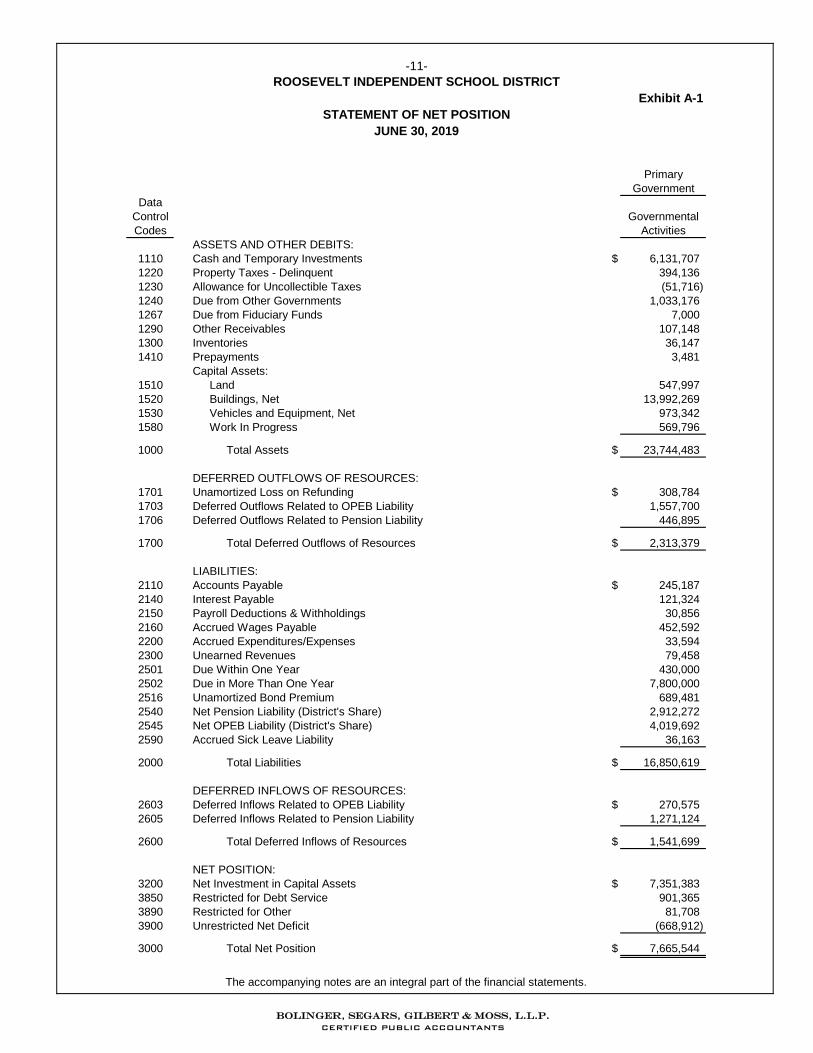
Exhibit A-1
Primary
Government
Data
Control Governmental
Codes Activities
ASSETS AND OTHER DEBITS:
1110 Cash and Temporary Investments $ 6,131,707
1220 Property Taxes - Delinquent 394,136
1230 Allowance for Uncollectible Taxes (51,716)
1240 Due from Other Governments 1,033,176
1267 Due from Fiduciary Funds 7,000
1290 Other Receivables 107,148
1300 Inventories 36,147
1410 Prepayments 3,481
Capital Assets:
1510 Land 547,997
1520 Buildings, Net 13,992,269
1530 Vehicles and Equipment, Net 973,342
1580 Work In Progress 569,796
1000 Total Assets $ 23,744,483
DEFERRED OUTFLOWS OF RESOURCES:
1701 Unamortized Loss on Refunding $ 308,784
1703 Deferred Outflows Related to OPEB Liability 1,557,700
1706 Deferred Outflows Related to Pension Liability 446,895
1700 Total Deferred Outflows of Resources $ 2,313,379
LIABILITIES:
2110 Accounts Payable $ 245,187
2140 Interest Payable 121,324
2150 Payroll Deductions & Withholdings 30,856
2160 Accrued Wages Payable 452,592
2200 Accrued Expenditures/Expenses 33,594
2300 Unearned Revenues 79,458
2501 Due Within One Year 430,000
2502 Due in More Than One Year 7,800,000
2516 Unamortized Bond Premium 689,481
2540 Net Pension Liability (District's Share) 2,912,272
2545 Net OPEB Liability (District's Share) 4,019,692
2590 Accrued Sick Leave Liability 36,163
2000 Total Liabilities $ 16,850,619
DEFERRED INFLOWS OF RESOURCES:
2603 Deferred Inflows Related to OPEB Liability $ 270,575
2605 Deferred Inflows Related to Pension Liability 1,271,124
2600 Total Deferred Inflows of Resources $ 1,541,699
NET POSITION:
3200 Net Investment in Capital Assets $ 7,351,383
3850 Restricted for Debt Service 901,365
3890 Restricted for Other 81,708
3900 Unrestricted Net Deficit (668,912)
3000 Total Net Position $ 7,665,544
-11-
ROOSEVELT INDEPENDENT SCHOOL DISTRICT
STATEMENT OF NET POSITION
JUNE 30, 2019
The accompanying notes are an integral part of the financial statements.
Bolinger, Segars, Gilbert & Moss, L.L.p. CERTIFIED PUBLIC ACCOUNTANTS
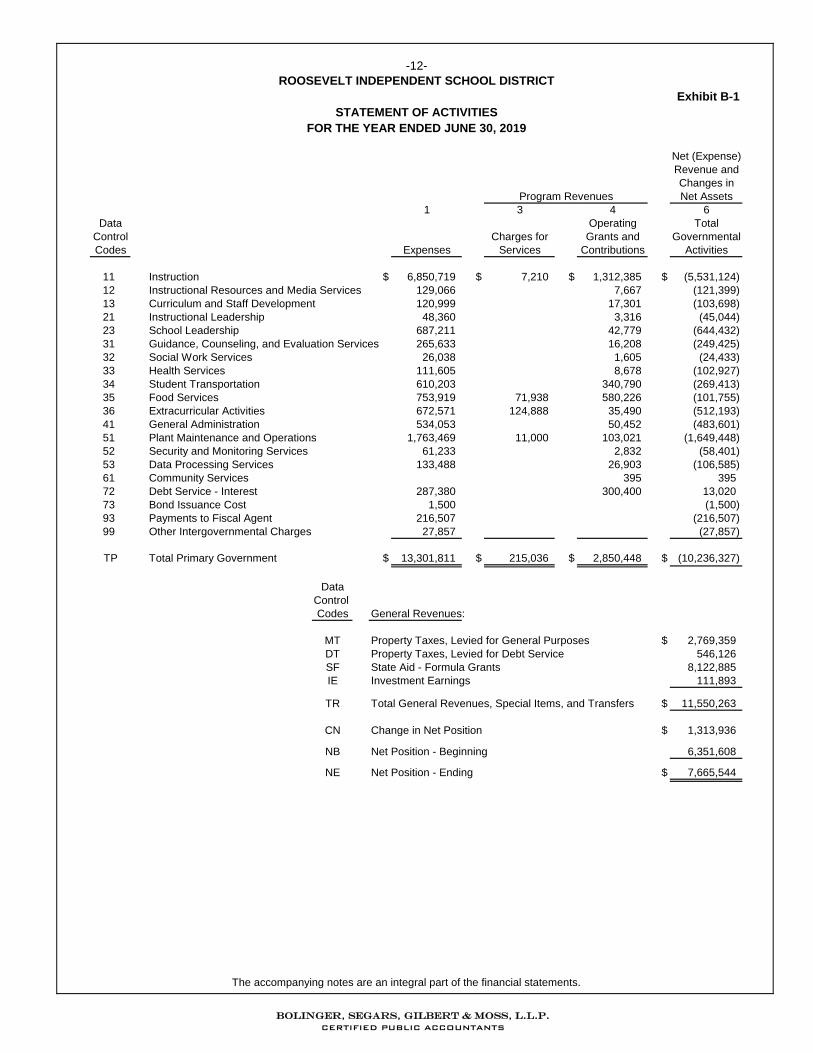
Exhibit B-1
Net (Expense)
Revenue and
Changes in
Net Assets
1 3 4 6
Data Operating Total
Control Charges for Grants and Governmental
Codes Expenses Services Contributions Activities
11 Instruction $ 6,850,719 $ 7,210 $ 1,312,385 $ (5,531,124)
12 Instructional Resources and Media Services 129,066 7,667 (121,399)
13 Curriculum and Staff Development 120,999 17,301 (103,698)
21 Instructional Leadership 48,360 3,316 (45,044)
23 School Leadership 687,211 42,779 (644,432)
31 Guidance, Counseling, and Evaluation Services 265,633 16,208 (249,425)
32 Social Work Services 26,038 1,605 (24,433)
33 Health Services 111,605 8,678 (102,927)
34 Student Transportation 610,203 340,790 (269,413)
35 Food Services 753,919 71,938 580,226 (101,755)
36 Extracurricular Activities 672,571 124,888 35,490 (512,193)
41 General Administration 534,053 50,452 (483,601)
51 Plant Maintenance and Operations 1,763,469 11,000 103,021 (1,649,448)
52 Security and Monitoring Services 61,233 2,832 (58,401)
53 Data Processing Services 133,488 26,903 (106,585)
61 Community Services 395 395
72 Debt Service - Interest 287,380 300,400 13,020
73 Bond Issuance Cost 1,500 (1,500)
93 Payments to Fiscal Agent 216,507 (216,507)
99 Other Intergovernmental Charges 27,857 (27,857)
TP Total Primary Government $ 13,301,811 $ 215,036 $ 2,850,448 $ (10,236,327)
Data
Control
Codes General Revenues:
MT Property Taxes, Levied for General Purposes $ 2,769,359
DT Property Taxes, Levied for Debt Service 546,126
SF State Aid - Formula Grants 8,122,885
IE Investment Earnings 111,893
TR Total General Revenues, Special Items, and Transfers $ 11,550,263
CN Change in Net Position $ 1,313,936
NB Net Position - Beginning 6,351,608
NE Net Position - Ending $ 7,665,544
Program Revenues
FOR THE YEAR ENDED JUNE 30, 2019
-12-
ROOSEVELT INDEPENDENT SCHOOL DISTRICT
STATEMENT OF ACTIVITIES
The accompanying notes are an integral part of the financial statements.
Bolinger, Segars, Gilbert & Moss, L.L.p. CERTIFIED PUBLIC ACCOUNTANTS
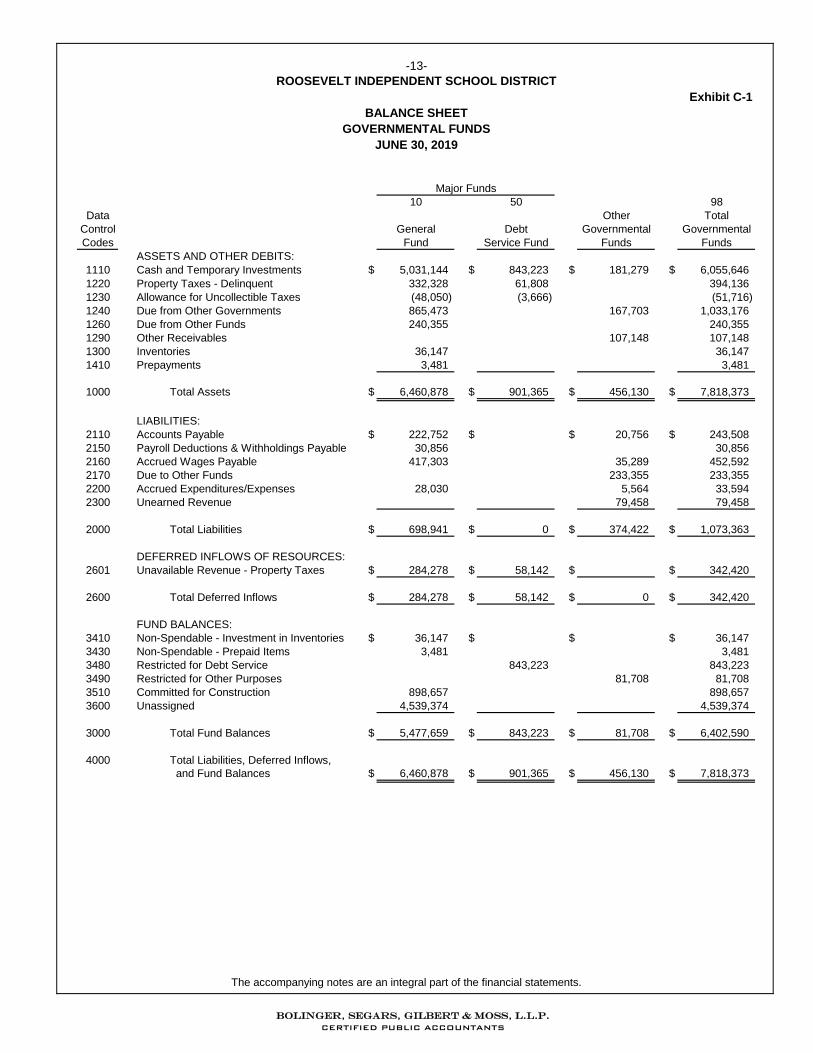
10 50 98
Data Other Total
Control General Debt Governmental Governmental
Codes Fund Service Fund Funds Funds
ASSETS AND OTHER DEBITS:
1110 Cash and Temporary Investments $ 5,031,144 $ 843,223 $ 181,279 $ 6,055,646
1220 Property Taxes - Delinquent 332,328 61,808 394,136
1230 Allowance for Uncollectible Taxes (48,050) (3,666) (51,716)
1240 Due from Other Governments 865,473 167,703 1,033,176
1260 Due from Other Funds 240,355 240,355
1290 Other Receivables 107,148 107,148
1300 Inventories 36,147 36,147
1410 Prepayments 3,481 3,481
1000 Total Assets $ 6,460,878 $ 901,365 $ 456,130 $ 7,818,373
LIABILITIES:
2110 Accounts Payable $ 222,752 $ $ 20,756 $ 243,508
2150 Payroll Deductions & Withholdings Payable 30,856 30,856
2160 Accrued Wages Payable 417,303 35,289 452,592
2170 Due to Other Funds 233,355 233,355
2200 Accrued Expenditures/Expenses 28,030 5,564 33,594
2300 Unearned Revenue 79,458 79,458
2000 Total Liabilities $ 698,941 $ 0 $ 374,422 $ 1,073,363
DEFERRED INFLOWS OF RESOURCES:
2601 Unavailable Revenue - Property Taxes $ 284,278 $ 58,142 $ $ 342,420
2600 Total Deferred Inflows $ 284,278 $ 58,142 $ 0 $ 342,420
FUND BALANCES:
3410 Non-Spendable - Investment in Inventories $ 36,147 $ $ $ 36,147
3430 Non-Spendable - Prepaid Items 3,481 3,481
3480 Restricted for Debt Service 843,223 843,223
3490 Restricted for Other Purposes 81,708 81,708
3510 Committed for Construction 898,657 898,657
3600 Unassigned 4,539,374 4,539,374
3000 Total Fund Balances $ 5,477,659 $ 843,223 $ 81,708 $ 6,402,590
4000 Total Liabilities, Deferred Inflows,
and Fund Balances $ 6,460,878 $ 901,365 $ 456,130 $ 7,818,373
Major Funds
JUNE 30, 2019
Exhibit C-1
-13-
ROOSEVELT INDEPENDENT SCHOOL DISTRICT
BALANCE SHEET
GOVERNMENTAL FUNDS
The accompanying notes are an integral part of the financial statements.
Bolinger, Segars, Gilbert & Moss, L.L.p. CERTIFIED PUBLIC ACCOUNTANTS
ROOSEVELT INDEPENDENT SCHOOL DISTRICT
Exhibit C-2
Data
Control
Codes
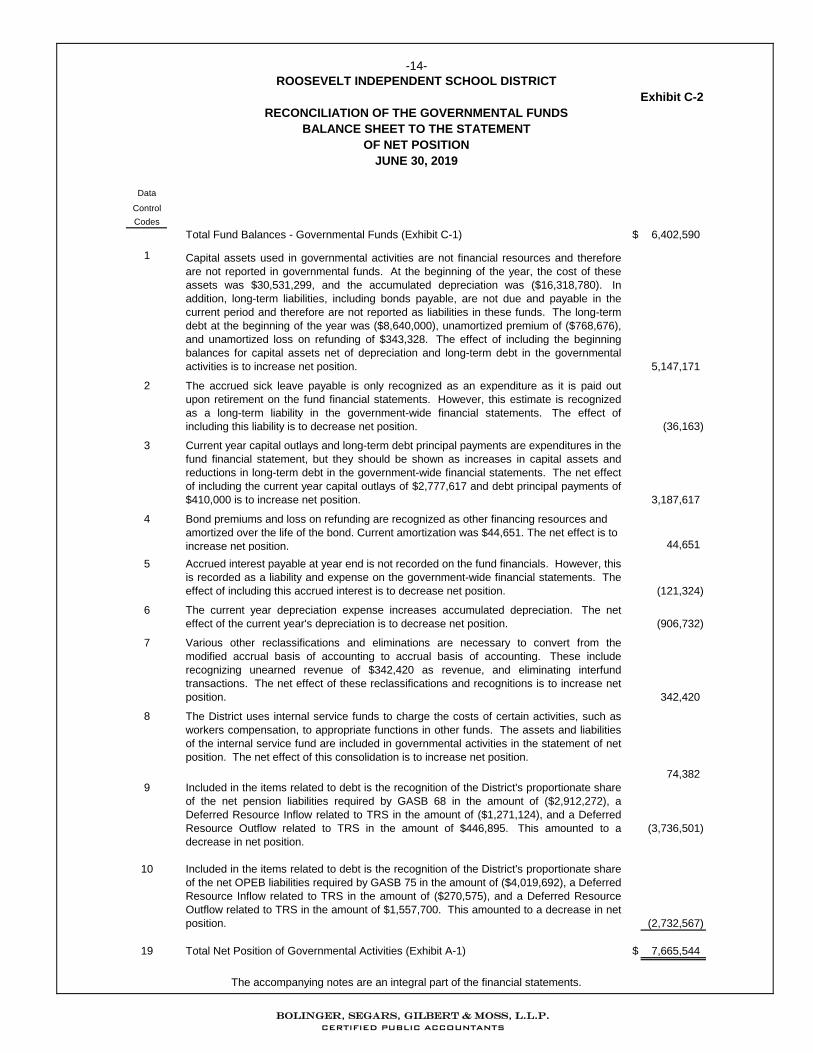
Total Fund Balances - Governmental Funds (Exhibit C-1) $ 6,402,590
1
5,147,171
2
(36,163)
3
3,187,617
4
44,651
5
(121,324)
6
(906,732)
7
342,420
8
74,382
9
(3,736,501)
10
(2,732,567)
19 $ 7,665,544Total Net Position of Governmental Activities (Exhibit A-1)
Capital assets used in governmental activities are not financial resources and therefore
are not reported in governmental funds. At the beginning of the year, the cost of these
assets was $30,531,299, and the accumulated depreciation was ($16,318,780). In
addition, long-term liabilities, including bonds payable, are not due and payable in the
current period and therefore are not reported as liabilities in these funds. The long-term
debt at the beginning of the year was ($8,640,000), unamortized premium of ($768,676),
and unamortized loss on refunding of $343,328. The effect of including the beginning
balances for capital assets net of depreciation and long-term debt in the governmental
activities is to increase net position.
Current year capital outlays and long-term debt principal payments are expenditures in the
fund financial statement, but they should be shown as increases in capital assets and
reductions in long-term debt in the government-wide financial statements. The net effect
of including the current year capital outlays of $2,777,617 and debt principal payments of
$410,000 is to increase net position.
The current year depreciation expense increases accumulated depreciation. The net
effect of the current year's depreciation is to decrease net position.
Various other reclassifications and eliminations are necessary to convert from the
modified accrual basis of accounting to accrual basis of accounting. These include
recognizing unearned revenue of $342,420 as revenue, and eliminating interfund
transactions. The net effect of these reclassifications and recognitions is to increase net
position.
The accrued sick leave payable is only recognized as an expenditure as it is paid out
upon retirement on the fund financial statements. However, this estimate is recognized
as a long-term liability in the government-wide financial statements. The effect of
including this liability is to decrease net position.
The District uses internal service funds to charge the costs of certain activities, such as
workers compensation, to appropriate functions in other funds. The assets and liabilities
of the internal service fund are included in governmental activities in the statement of net
position. The net effect of this consolidation is to increase net position.
Bond premiums and loss on refunding are recognized as other financing resources and
amortized over the life of the bond. Current amortization was $44,651. The net effect is to
increase net position.
Accrued interest payable at year end is not recorded on the fund financials. However, this
is recorded as a liability and expense on the government-wide financial statements. The
effect of including this accrued interest is to decrease net position.
Included in the items related to debt is the recognition of the District's proportionate share
of the net pension liabilities required by GASB 68 in the amount of ($2,912,272), a
Deferred Resource Inflow related to TRS in the amount of ($1,271,124), and a Deferred
Resource Outflow related to TRS in the amount of $446,895. This amounted to a
decrease in net position.
Included in the items related to debt is the recognition of the District's proportionate share
of the net OPEB liabilities required by GASB 75 in the amount of ($4,019,692), a Deferred
Resource Inflow related to TRS in the amount of ($270,575), and a Deferred Resource
Outflow related to TRS in the amount of $1,557,700. This amounted to a decrease in net
position.
-14-
RECONCILIATION OF THE GOVERNMENTAL FUNDS
BALANCE SHEET TO THE STATEMENT
OF NET POSITION
JUNE 30, 2019
The accompanying notes are an integral part of the financial statements.
Bolinger, Segars, Gilbert & Moss, L.L.p. CERTIFIED PUBLIC ACCOUNTANTS
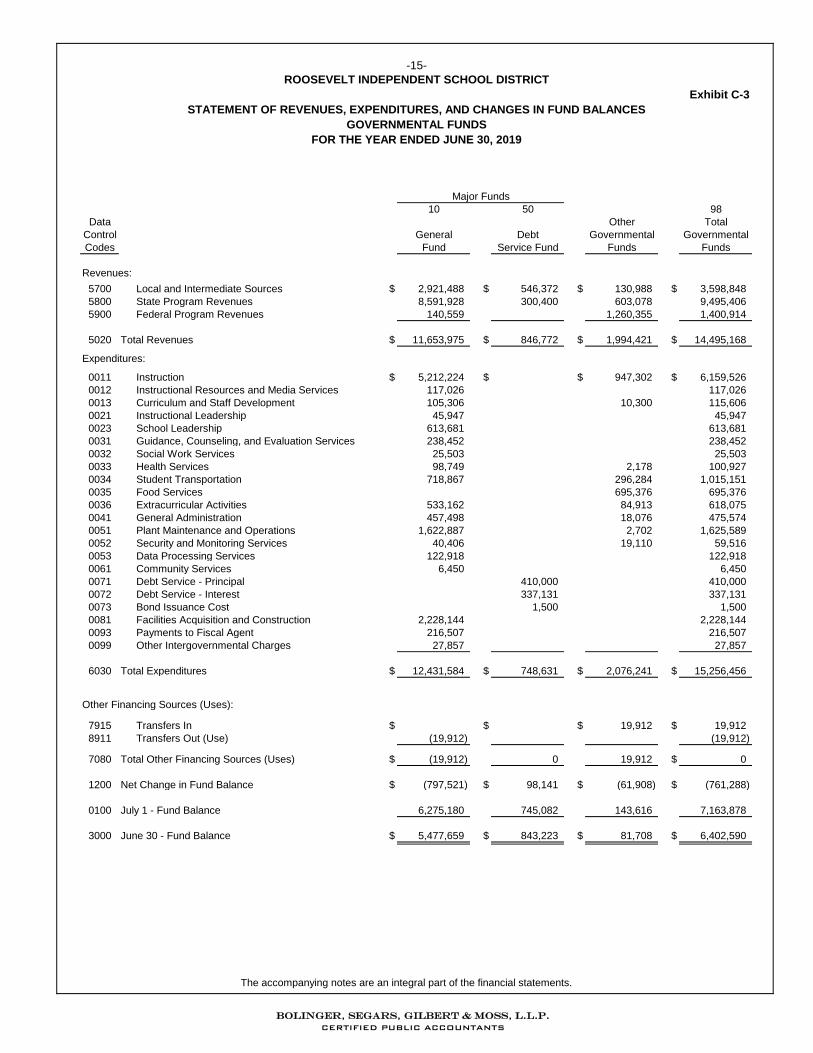
Exhibit C-3
10 50 98
Data Other Total
Control General Debt Governmental Governmental
Codes Fund Service Fund Funds Funds
Revenues:
5700 Local and Intermediate Sources $ 2,921,488 $ 546,372 $ 130,988 $ 3,598,848
5800 State Program Revenues 8,591,928 300,400 603,078 9,495,406
5900 Federal Program Revenues 140,559 1,260,355 1,400,914
5020 Total Revenues $ 11,653,975 $ 846,772 $ 1,994,421 $ 14,495,168
Expenditures:
0011 Instruction $ 5,212,224 $ $ 947,302 $ 6,159,526
0012 Instructional Resources and Media Services 117,026 117,026
0013 Curriculum and Staff Development 105,306 10,300 115,606
0021 Instructional Leadership 45,947 45,947
0023 School Leadership 613,681 613,681
0031 Guidance, Counseling, and Evaluation Services 238,452 238,452
0032 Social Work Services 25,503 25,503
0033 Health Services 98,749 2,178 100,927
0034 Student Transportation 718,867 296,284 1,015,151
0035 Food Services 695,376 695,376
0036 Extracurricular Activities 533,162 84,913 618,075
0041 General Administration 457,498 18,076 475,574
0051 Plant Maintenance and Operations 1,622,887 2,702 1,625,589
0052 Security and Monitoring Services 40,406 19,110 59,516
0053 Data Processing Services 122,918 122,918
0061 Community Services 6,450 6,450
0071 Debt Service - Principal 410,000 410,000
0072 Debt Service - Interest 337,131 337,131
0073 Bond Issuance Cost 1,500 1,500
0081 Facilities Acquisition and Construction 2,228,144 2,228,144
0093 Payments to Fiscal Agent 216,507 216,507
0099 Other Intergovernmental Charges 27,857 27,857
6030 Total Expenditures $ 12,431,584 $ 748,631 $ 2,076,241 $ 15,256,456
Other Financing Sources (Uses):
7915 Transfers In $ $ $ 19,912 $ 19,912
8911 Transfers Out (Use) (19,912) (19,912)
7080 Total Other Financing Sources (Uses) $ (19,912) 0 19,912 $ 0
1200 Net Change in Fund Balance $ (797,521) $ 98,141 $ (61,908) $ (761,288)
0100 July 1 - Fund Balance 6,275,180 745,082 143,616 7,163,878
3000 June 30 - Fund Balance $ 5,477,659 $ 843,223 $ 81,708 $ 6,402,590
Major Funds
-15-
ROOSEVELT INDEPENDENT SCHOOL DISTRICT
STATEMENT OF REVENUES, EXPENDITURES, AND CHANGES IN FUND BALANCES
GOVERNMENTAL FUNDS
FOR THE YEAR ENDED JUNE 30, 2019
The accompanying notes are an integral part of the financial statements.
Bolinger, Segars, Gilbert & Moss, L.L.p. CERTIFIED PUBLIC ACCOUNTANTS
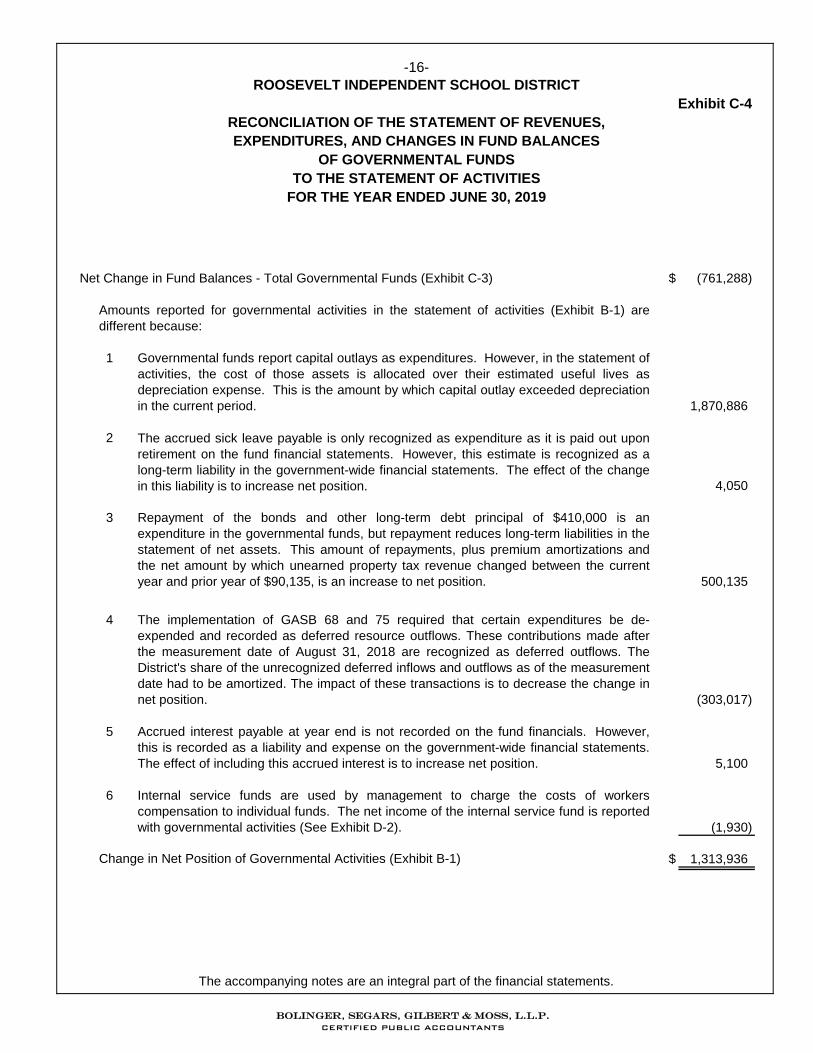
Exhibit C-4
Net Change in Fund Balances - Total Governmental Funds (Exhibit C-3) $ (761,288)
1
1,870,886
2
4,050
3
500,135
4
(303,017)
5
5,100
6
(1,930)
$ 1,313,936Change in Net Position of Governmental Activities (Exhibit B-1)
Amounts reported for governmental activities in the statement of activities (Exhibit B-1) are
different because:
Governmental funds report capital outlays as expenditures. However, in the statement of
activities, the cost of those assets is allocated over their estimated useful lives as
depreciation expense. This is the amount by which capital outlay exceeded depreciation
in the current period.
Repayment of the bonds and other long-term debt principal of $410,000 is an
expenditure in the governmental funds, but repayment reduces long-term liabilities in the
statement of net assets. This amount of repayments, plus premium amortizations and
the net amount by which unearned property tax revenue changed between the current
year and prior year of $90,135, is an increase to net position.
The accrued sick leave payable is only recognized as expenditure as it is paid out upon
retirement on the fund financial statements. However, this estimate is recognized as a
long-term liability in the government-wide financial statements. The effect of the change
in this liability is to increase net position.
Internal service funds are used by management to charge the costs of workers
compensation to individual funds. The net income of the internal service fund is reported
with governmental activities (See Exhibit D-2).
Accrued interest payable at year end is not recorded on the fund financials. However,
this is recorded as a liability and expense on the government-wide financial statements.
The effect of including this accrued interest is to increase net position.
The implementation of GASB 68 and 75 required that certain expenditures be de-
expended and recorded as deferred resource outflows. These contributions made after
the measurement date of August 31, 2018 are recognized as deferred outflows. The
District's share of the unrecognized deferred inflows and outflows as of the measurement
date had to be amortized. The impact of these transactions is to decrease the change in
net position.
TO THE STATEMENT OF ACTIVITIES
FOR THE YEAR ENDED JUNE 30, 2019
-16-
ROOSEVELT INDEPENDENT SCHOOL DISTRICT
RECONCILIATION OF THE STATEMENT OF REVENUES,
EXPENDITURES, AND CHANGES IN FUND BALANCES
OF GOVERNMENTAL FUNDS
The accompanying notes are an integral part of the financial statements.
Bolinger, Segars, Gilbert & Moss, L.L.p. CERTIFIED PUBLIC ACCOUNTANTS
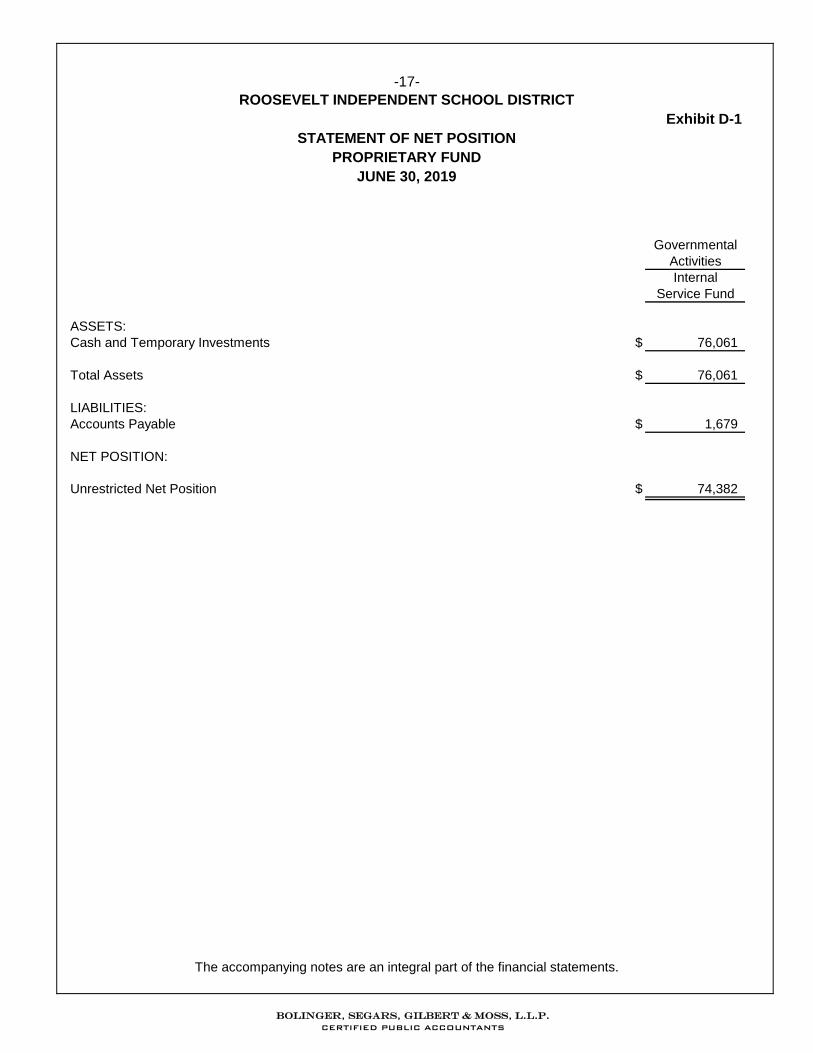
Exhibit D-1
Governmental
Activities
Internal
Service Fund
ASSETS:
Cash and Temporary Investments $ 76,061
Total Assets $ 76,061
LIABILITIES:
Accounts Payable $ 1,679
NET POSITION:
Unrestricted Net Position $ 74,382
ROOSEVELT INDEPENDENT SCHOOL DISTRICT
-17-
STATEMENT OF NET POSITION
PROPRIETARY FUND
JUNE 30, 2019
The accompanying notes are an integral part of the financial statements.
Bolinger, Segars, Gilbert & Moss, L.L.p. CERTIFIED PUBLIC ACCOUNTANTS
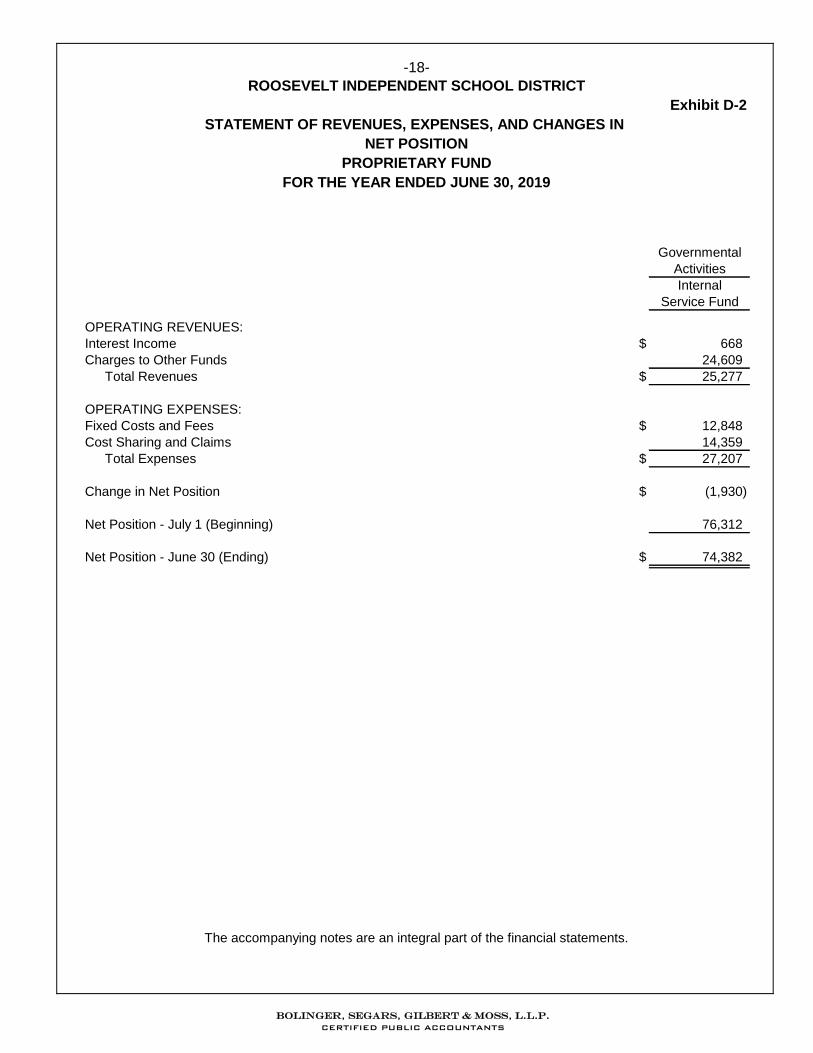
Exhibit D-2
Governmental
Activities
Internal
Service Fund
OPERATING REVENUES:
Interest Income $ 668
Charges to Other Funds 24,609
Total Revenues $ 25,277
OPERATING EXPENSES:
Fixed Costs and Fees $ 12,848
Cost Sharing and Claims 14,359
Total Expenses $ 27,207
Change in Net Position $ (1,930)
Net Position - July 1 (Beginning) 76,312
Net Position - June 30 (Ending) $ 74,382
FOR THE YEAR ENDED JUNE 30, 2019
ROOSEVELT INDEPENDENT SCHOOL DISTRICT
-18-
STATEMENT OF REVENUES, EXPENSES, AND CHANGES IN
NET POSITION
PROPRIETARY FUND
The accompanying notes are an integral part of the financial statements.
Bolinger, Segars, Gilbert & Moss, L.L.p. CERTIFIED PUBLIC ACCOUNTANTS

Exhibit D-3
STATEMENT OF CASH FLOWS
PROPRIETARY FUND
FOR THE YEAR ENDED JUNE 30, 2019
Governmental
Activities
Internal
Service Fund
INCREASE (DECREASE) IN CASH AND
CASH EQUIVALENTS
Cash Flows From Operating Activities
Cash Receipts From Charges to Other Funds $ 24,609
Cash Receipts From Interest Income 668
Cash Payments to Suppliers for Goods and Services (25,672)
Net Cash From Operating Activities $ (395)
Net Change in Cash and Cash Equivalents $ (395)
Cash and Cash Equivalents at Beginning of Year 76,456
Cash and Cash Equivalents at End of Year $ 76,061
RECONCILIATION OF OPERATING INCOME TO NET
CASH PROVIDED BY OPERATING ACTIVITIES
Operating Loss $ (1,930)
Changes in Liabilities
Increase in Accounts Payable 1,535
Net Cash From Operating Activities $ (395)
ROOSEVELT INDEPENDENT SCHOOL DISTRICT
-19-
The accompanying notes are an integral part of the financial statements.
Bolinger, Segars, Gilbert & Moss, L.L.p. CERTIFIED PUBLIC ACCOUNTANTS
ROOSEVELT INDEPENDENT SCHOOL DISTRICT
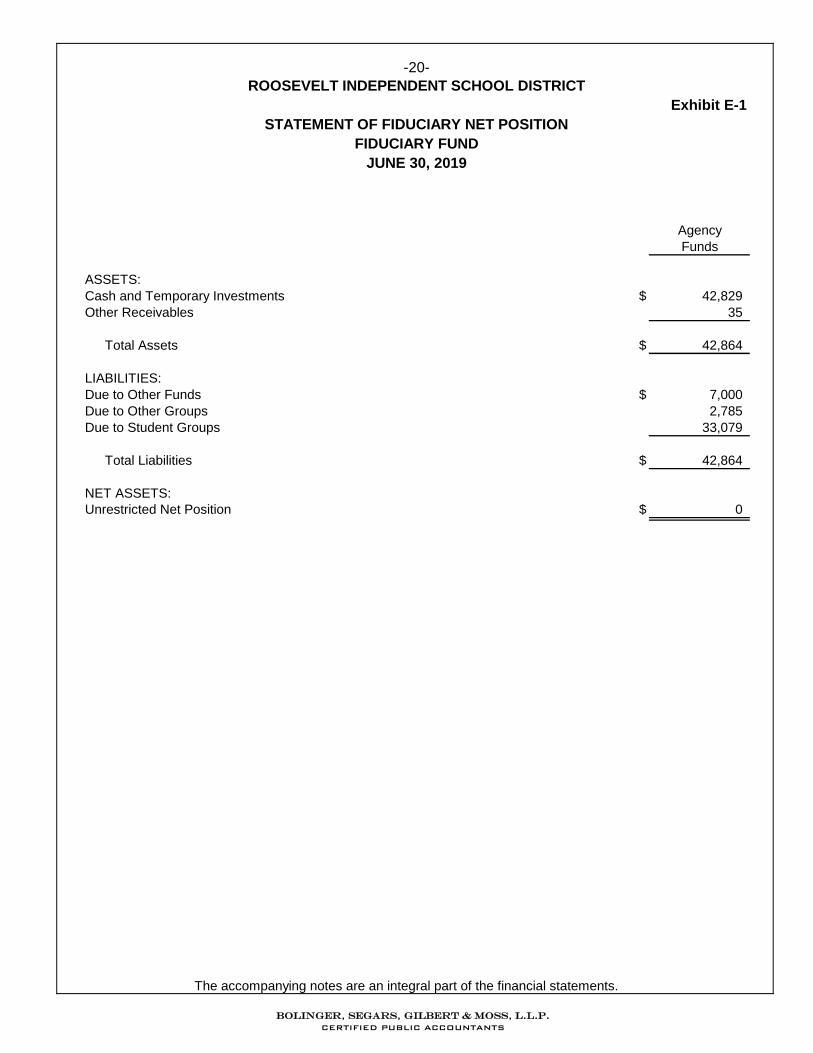
Exhibit E-1
STATEMENT OF FIDUCIARY NET POSITION
FIDUCIARY FUND
JUNE 30, 2019
Agency
Funds
ASSETS:
Cash and Temporary Investments $ 42,829
Other Receivables 35
Total Assets $ 42,864
LIABILITIES:
Due to Other Funds $ 7,000
Due to Other Groups 2,785
Due to Student Groups 33,079
Total Liabilities $ 42,864
NET ASSETS:
Unrestricted Net Position $ 0
-20-
The accompanying notes are an integral part of the financial statements.
Bolinger, Segars, Gilbert & Moss, L.L.p. CERTIFIED PUBLIC ACCOUNTANTS
-21- ROOSEVELT INDEPENDENT SCHOOL DISTRICT
NOTES TO FINANCIAL STATEMENTS
1. SUMMARY OF SIGNIFICANT ACCOUNTING POLICIES
The Roosevelt Independent School District (the District) is a public education agency operating under the applicable laws and regulations of the State of Texas. The District prepares its basic financial statements in conformity with accounting principles generally accepted in the United States of America promulgated by the Governmental Accounting Standards Board (GASB) applicable to governmental units. The District also complies with the appropriate version of the Texas Education Agency’s (TEA) Financial Accountability System Resource Guide (FAR) and the requirements of contracts and grants of agencies from which it receives funds. GASB is the accepted standard setting body for establishing governmental accounting and financial reporting principles. The more significant accounting policies of the District are described below.
A. REPORTING ENTITY
The Board of School Trustees (the Board), a seven member group, has fiscal accountability over all activities related to public elementary and secondary education within the jurisdiction of the District. The Board is elected by the public and has the exclusive power and duty to govern and oversee the management of the District. All powers and duties not specifically delegated by statute to the TEA (the Agency) or to the State Board of Education are reserved for the Board, and the Agency may not substitute its judgment for the lawful exercise of those powers and duties by the Board. The District is not included in any other governmental "reporting entity" as defined in governmental accounting and financial reporting standards. There are no component units included within the reporting entity.
The District receives funding from local, state, and federal government sources and must comply with the requirements of these funding entities.
B. BASIS OF ACCOUNTING AND PRESENTATION
GOVERNMENT-WIDE FINANCIAL STATEMENTS The Statement of Net Position and the Statement of Activities display information about the government-wide entity as a whole. These statements report information on all of the non-fiduciary activities of the District. For the most part, the effect of interfund activity has been removed from these statements. Governmental activities, which normally are supported by taxes, state foundation funds, grants, and intergovernmental revenues, are reported separately from business-type activities, which rely to a significant extent on fees and charges for support (i.e., internal service funds are considered governmental activities and not business-type activities). The District currently has no business-type activities. These government-wide financial statements were prepared using the economic resources measurement focus and the accrual basis of accounting. Revenues are recorded when earned, and expenses are recorded when a liability is incurred, regardless of the timing of related cash flows. Property taxes are recognized as revenues in the year for which they are levied. Grants and similar items are recognized as revenue as soon as all eligibility requirements imposed by the provider have been met.
Bolinger, Segars, Gilbert & Moss, L.L.p. CERTIFIED PUBLIC ACCOUNTANTS
-22- ROOSEVELT INDEPENDENT SCHOOL DISTRICT
NOTES TO FINANCIAL STATEMENTS
In the government-wide financial statements, long-term debt and other long-term obligations are reported as liabilities in the applicable governmental activities or statement of net position. Bond premiums are deferred and amortized over the life of the bonds. Bond issue costs are expensed in accordance with GASB Statements No. 63 and 65. Interest payable on capital appreciation bonds are recognized as an increase in long-term debt and an increase in interest expense as accreted.
The Statement of Activities demonstrates how other people or entities that participate in programs the District operates have shared in the payment of the direct costs. The “Charges for Services” column includes payments made by parties that purchase, use, or directly benefit from goods or services provided by a given function or segment of the District. Examples include tuition paid by students not residing in the District, school lunch charges, etc. The “Operating Grants and Contributions” column includes amounts paid by organizations outside the District to help meet the operational or capital requirements of a given function. Examples include grants under the Elementary and Secondary Education Act. If a revenue is not a program revenue, it is a general revenue used to support all of the District’s functions. Taxes are always general revenues. The District reports all direct expenses by function in the Statement of Activities. Direct expenses are those that are clearly identifiable with a function. Indirect expenses of other functions are not allocated to those functions but are reported separately in the Statement of Activities. Depreciation expense is specifically identified by function and is included in the direct expense to each function allocated. Interest on general long-term debt is considered an indirect expense and is reported separately on the Statement of Activities. Interfund activities between governmental funds and proprietary funds appear as due to/due from on the Governmental Fund Balance Sheet and Proprietary Fund Statement of Net Position and as other resources and other uses on the Governmental Fund Statement of Revenues, Expenditures and Changes in Fund Balance and on the Proprietary Fund Statement of Revenues, Expenses, and Changes in Fund Net Position. All interfund transactions between governmental funds and between governmental funds and internal service funds are eliminated on the government-wide statements. Interfund activities between governmental funds and fiduciary funds remain as due to/due from on the government-wide Statement of Net Position.
FUND FINANCIAL STATEMENTS Separate financial statements are provided for governmental funds and fiduciary funds. Since the resources in the fiduciary funds cannot be used for District operations, they are not included in the government-wide statements. Major governmental funds are reported as separate columns in the fund financial statements. Governmental fund financial statements are reported using the current financial resources measurement focus and the modified accrual basis of accounting. Revenues are recognized as soon as they are both measurable and available. Revenues are considered to be available when they are collectible within the current period or soon enough thereafter to pay liabilities of the current period. For this purpose, the government considers revenues to be available if they are collected within 60 days of the end of the current fiscal period.
Bolinger, Segars, Gilbert & Moss, L.L.p. CERTIFIED PUBLIC ACCOUNTANTS
-23- ROOSEVELT INDEPENDENT SCHOOL DISTRICT
NOTES TO FINANCIAL STATEMENTS
Revenues from local sources consist primarily of property taxes. Amounts have been recorded for property tax revenues collected through June 30, 2019. State revenues are recognized under the susceptible-to-accrual concept. Miscellaneous revenues are recorded as revenue when received in cash because they are generally not measurable until actually received. Investment earnings are recorded as earned since they are both measurable and available. Expenditures generally are recorded when a liability is incurred, as under accrual accounting. However, debt service expenditures and claims and judgments are recorded only when payment is due. In the fund financial statements, governmental fund types recognize bond issue costs in the current period. The face amount of the debt issued is reported as other financing sources. Issuance costs, whether or not withheld from the actual debt proceeds received, are reported as debt service expenditures. Premiums and discounts on bonds issued, as well as applicable gain or loss on refinancing of bonds, are recognized on the statement of net position and amortized over the life of the applicable bonds. The proprietary fund and the fiduciary fund financial statements were reported using the economic resources measurement focus and the accrual basis of accounting. Revenues are recorded when earned, and expenses are recorded when a liability is incurred, regardless of the timing of related cash flows. The District applies all GASB pronouncements, as well as the Financial Accounting Standards Board pronouncements issued on or before November 30, 1989, unless these pronouncements conflict or contradict GASB pronouncements.
Propriety funds distinguish operating revenues and expenses from non-operating items. Operating revenues result from providing goods and services in connection with a propriety fund’s principal ongoing operations, they usually come from exchange or exchange-like transactions. Interest income earned on the operating cash account is considered operating revenue. All other revenues are non-operating. Agency funds utilize the accrual basis of accounting, but do not have a measurement focus as they report only assets and liabilities.
GOVERNMENTAL FUND TYPES The District reports the following major governmental funds:
General Fund – This fund is established to account for resources used for general operations. All general tax revenues and other receipts that are not allocated by law or contractual agreement to some other fund are accounted for in this fund. This is a budgeted fund and unassigned fund balances are considered resources available for current operations.
Debt Service Fund – This fund is used to account for payment of principal and interest on long-term general obligation debt and other long-term debts for which tax has been dedicated. This is a budgeted fund and any unused sinking fund balances will be transferred to the general fund after all of the related debt obligations have been met.
Bolinger, Segars, Gilbert & Moss, L.L.p. CERTIFIED PUBLIC ACCOUNTANTS
-24- ROOSEVELT INDEPENDENT SCHOOL DISTRICT
NOTES TO FINANCIAL STATEMENTS
Additionally, the government reports the following governmental fund types: Special Revenue Funds – These funds are used to account for resources restricted to, or designated for, specific purposes by a grantor. Federal financial assistance generally is accounted for in a special revenue fund. Except for the food service fund, any unused balances are returned to the grantor at the close of specified project periods.
The District’s food service is considered a special revenue fund since the general fund only subsidizes the food service program for all expenditures in excess of National School Lunch Program (NSLP) and user fees. For all other funds in this fund type, project accounting is employed to maintain integrity for the various sources of funds.
PROPRIETARY FUND TYPES
Internal Service Funds – Internal service funds are used to account for revenues and expenses related to services provided to parties inside the District, specifically for the operation of its partially-funded insurance plan for workers' compensation on a cost-reimbursement basis.
FIDUCIARY FUND TYPES Agency Funds – These custodial funds are used to account for activities of student groups and other organizational activities requiring clearing accounts. Financial resources for the agency funds are recorded as assets and liabilities; therefore, these funds do not include revenues and expenditures and have no fund equity. Student activity organizations exist with the explicit approval of, and are subject to revocation by, the Board. If any unused resources are declared surplus by the student groups, they are transferred to the general fund with a recommendation to the Board for an appropriate utilization through a budgeted program.
C. BASIS OF ACCOUNTING APPLICABLE TO ALL FINANCIAL STATEMENTS
Capital assets, which include buildings and improvements, furniture and equipment, vehicles, and work in progress are reported in the government-wide financial statements. Capital assets are defined by the District as assets with an individual cost of more than $5,000. Such assets are recorded at historical cost or estimated historical cost if purchased or constructed. The costs of normal maintenance and repairs that do not add to the value of the asset or materially extend the assets’ useful lives are not capitalized.
Revenues from state and federal grants are considered to be earned to the extent of expenditures made under the provisions of the grant. Funds received but unexpended are reflected as deferred revenues, and funds expended but not yet received are shown as receivables. If balances have not been expended by the end of the project period, grantors generally require the District to refund all or part of the unused amount.
Bolinger, Segars, Gilbert & Moss, L.L.p. CERTIFIED PUBLIC ACCOUNTANTS
-25- ROOSEVELT INDEPENDENT SCHOOL DISTRICT
NOTES TO FINANCIAL STATEMENTS
It is the District’s policy to permit some employees to accumulate earned but unused sick pay benefits. The District will pay $50 per day for the first 25 days and $25 per day for the next 75 days. Nothing is paid in excess of 100 days. To be eligible for this sick leave pay out an employee must retire from the District and cannot be hired by another District. The estimated sick leave liability, based on those employees fully eligible as of June 30, 2019 and those employees five years or less away from being fully eligible, is $36,163. This is recognized as a long-term liability on the government-wide financial statements. Since Internal Service Funds support the operations of governmental funds, they are consolidated with the governmental funds in the government-wide financial statements. The expenditures of governmental funds that create the revenues of internal service funds are eliminated to avoid “grossing up” the revenues and expenses of the District as a whole. When the District incurs an expense for which it may use either restricted or unrestricted assets, it uses the restricted assets first whenever they will have to be returned if they are not used. Supplies and materials are debited as expenditures when purchased, except for copy paper. Copy paper is accounted for in inventory at cost, and is recorded as expenditures when it is consumed. In accordance with the FAR, the District has adopted and installed an accounting system which exceeds the minimum requirements prescribed by the State Board of Education and approved by the State Auditor. Specifically, the District’s accounting system uses codes and the code structure presented in the Accounting Code Section of the FAR. Mandatory codes are utilized in the form provided in that section.
D. BUDGETARY DATA
The official budget was prepared on the modified accrual basis of accounting, which is consistent with accounting principles generally accepted in the United States of America, for the general fund, debt service fund, and the food service special revenue fund. The remaining special revenue funds adopt project-length budgets which do not correspond to the District’s fiscal year. The following procedures were followed in establishing the budgetary data reflected in the basic financial statements:
a. Prior to June 20th of the preceding fiscal year, the District prepares a budget for the next
succeeding fiscal year beginning July 1st. The operating budget includes proposed expenditures and the means of financing them.
b. A meeting of the Board is then called for the purpose of adopting the proposed budget. At
least ten days public notice of the meeting must be given. c. Prior to July 1st, the budget is legally enacted through passage of a resolution by the
Board.
Bolinger, Segars, Gilbert & Moss, L.L.p. CERTIFIED PUBLIC ACCOUNTANTS
-26- ROOSEVELT INDEPENDENT SCHOOL DISTRICT
NOTES TO FINANCIAL STATEMENTS
The budget is prepared and controlled at the function level within each fund and is amended at this level as needed. Amendments are presented to the Board at its regular meetings. Each amendment must have Board approval. Such amendments are made before the fact, and they are reflected in the official minutes of the Board. During the year, several amendments were necessary.
E. ENCUMBRANCE ACCOUNTING Encumbrances for goods or purchased services are documented by purchase orders or contracts. Under Texas law, appropriations lapse at June 30, and encumbrances outstanding at that time are to be either cancelled or appropriately provided for in the subsequent year’s budget. There were no outstanding encumbrances at June 30, 2019.
F. FUND BALANCES
The District has adopted GASB Statement 54, which redefined how fund balances of the
governmental funds are presented in the financial statements. Fund balances are classified as follows:
Non-Spendable Fund Balance – Amounts that are legally or contractually required to be maintained in tact (and is generally not expected to be converted to cash).
Restricted – Amounts that can be spent only for specific purposes because of restrictions
by external sources (creditors, laws of other governments, etc.) or by constitutional provision or enabling legislation.
Committed – Amounts that can be used only for specific purposes determined by formal
action by the Board of Trustees, the highest level of decision making authority.
Assigned – Amounts that can be used for a specific purpose as expressed by the authorized administrator, the Superintendent.
Unassigned – Amounts not included in other spendable classifications. When an expenditure is incurred for purposes for which both restricted and unrestricted fund
balance is available, the District considers restricted funds to have been spent first. When an expenditure for which committed, assigned, or unassigned fund balances are available, the District considers amounts to have been spent first out of committed funds, then assigned funds, and finally unassigned funds, as needed, unless the Board has provided otherwise in its commitment or assignment actions.
The Board has adopted a minimum fund balance policy for the general fund. The policy requires
the unassigned fund balance at fiscal year-end to be at least ten percent of the current fiscal expenditures less capital outlay and transfers out budgeted for the fund.
Bolinger, Segars, Gilbert & Moss, L.L.p. CERTIFIED PUBLIC ACCOUNTANTS
-27- ROOSEVELT INDEPENDENT SCHOOL DISTRICT
NOTES TO FINANCIAL STATEMENTS
G. NET POSITION ON THE STATEMENT OF NET POSITION
Net position on the statement of net position include the following:
Net Investment in Capital Assets – This component of net position represents the difference between capital assets less both the accumulated depreciation and the outstanding balance of debt, excluding any unspent bond proceeds that is directly attributable to the acquisition, construction, or improvement of those assets.
Restricted for Other – This component of net position represents the difference between assets and liabilities of the campus activity funds.
Restricted for Debt Service – This component of net position represents the difference between assets and liabilities of the Debt Service Fund that consists of assets with constraints placed on their use by creditors.
Unrestricted – The difference between assets and liabilities that is not reported as Investment in Capital Assets or otherwise restricted.
H. PENSIONS
The fiduciary net position of the Teacher Retirement System of Texas (TRS) has been determined using the flow of economic resources measurement focus and full accrual basis of accounting. This includes for purposes of measuring the net pension liability, deferred outflows of resources and deferred inflows of resources related to pensions, pension expense, and information about assets, liabilities and additions to/deductions from TRS's fiduciary net position. Benefit payments (including refunds of employee contributions) are recognized when due and payable in accordance with the benefit terms. Investments are reported at fair value.
I. OTHER POST-EMPLOYMENT BENEFITS (OPEB)
The fiduciary net position of the TRS Care Plan has been determined using the flow of economic resources measurement focus and full accrual basis of accounting. This includes for purposes of measuring the net OPEB liability, deferred outflows of resources and deferred inflows of resources related to other post-employment benefits, OPEB expense, and information about assets, liabilities and additions to/deductions from TRS Care’s fiduciary net position. Benefit payments are recognized when due and payable in accordance with the benefit terms. There are no investments as this a pay-as-you-go plan and all cash is held in a cash account.
J. CASH AND CASH EQUIVALENTS – PROPRIETARY FUNDS
For purposes of the statement of cash flows for proprietary fund types, the District considers highly liquid investments to be cash equivalents if they have a maturity of three months or less when purchased.
Bolinger, Segars, Gilbert & Moss, L.L.p. CERTIFIED PUBLIC ACCOUNTANTS
-28- ROOSEVELT INDEPENDENT SCHOOL DISTRICT
NOTES TO FINANCIAL STATEMENTS
K. MANAGEMENT’S USE OF ESTIMATES
The preparation of financial statements in conformity with accounting principles generally accepted in the United States requires management to make estimates and assumptions that affect the reported amounts of assets and liabilities and disclosure of contingent assets and liabilities at the date of the financial statements and the reported amounts of revenues and expenditures during the reporting period. Actual results could differ from those estimates.
2. DEPOSITS AND INVESTMENTS
Legal and Contractual Provisions Governing Deposits and Investments The Public Funds Investment Act (Government Code Chapter 2256) (The Act) contains specific
provisions in the areas of investment practices, management reports and establishment of appropriate policies. Among other things, it requires the District to adopt, implement, and publicize an investment policy. That policy must address the following areas: (1) safety of principal and liquidity, (2) portfolio diversification, (3) allowable investments, (4) acceptable risk levels, (5) expected rates of return, (6) maximum allowable stated maturity of portfolio investments, (7) maximum average dollar-weighted maturity allowed based on the stated maturity date for the portfolio, (8) investment staff quality and capabilities, and (9) bid solicitation preferences for certificates of deposit.
Statutes authorize the District to invest in (1) obligations of the U.S. Treasury, certain U.S. agencies,
and the State of Texas; (2) certificates of deposit, (3) certain municipal securities, (4) money market savings accounts, (5) repurchase agreements, (6) bankers acceptances, (7) mutual funds, (8) investment pools, (9) guaranteed investment contracts, and (10) common trust funds. The Act also requires the District to have independent auditors perform test procedures related to investment practices as provided by the Act. The District is in substantial compliance with the requirements of the Act and with local policies.
Policies Governing Deposits and Investments In compliance with the Public Funds Investment Act, the District has adopted a deposit and
investment policy. That policy does not address the following risks:
a. Custodial Credit Risk – Deposits and Investments: In the case of deposits, this is the risk that in the event of a bank failure, the government's deposits and investments in certificates of deposits may not be returned to it. The District's policy does not contain legal or policy requirements that would limit the exposure to custodial credit risk for deposits and investments, other than the following: The State of Texas requires that a financial institution secure deposits and investments made by state or local governments by pledging securities in excess of the highest cash balance of the government. The District is not exposed to custodial credit risk for its deposits and investments in investment pools are all covered by depository insurance and pledged securities held by a third party in the District’s name.
Bolinger, Segars, Gilbert & Moss, L.L.p. CERTIFIED PUBLIC ACCOUNTANTS
-29- ROOSEVELT INDEPENDENT SCHOOL DISTRICT
NOTES TO FINANCIAL STATEMENTS
b. Concentration of Credit Risk – The investment policy of the District contains no limitations on the amount that can be invested in any one issuer. Investments in any one issuer (other than U.S. Treasury securities, mutual funds, and external investment pools) that represent five percent or more of the total entity investments represent a concentration risk. At June 30, 2019, all of the District’s investments are in investment pools.
c. Credit Risk – The risk that an issuer of other counterparty to an investment will not fulfill its
obligations. The ratings of securities by nationally recognized rating agencies are designed to give an indication of credit risk. At June 30, 2019, the District was not significantly exposed to credit risk.
d. Interest Rate Risk – Not applicable
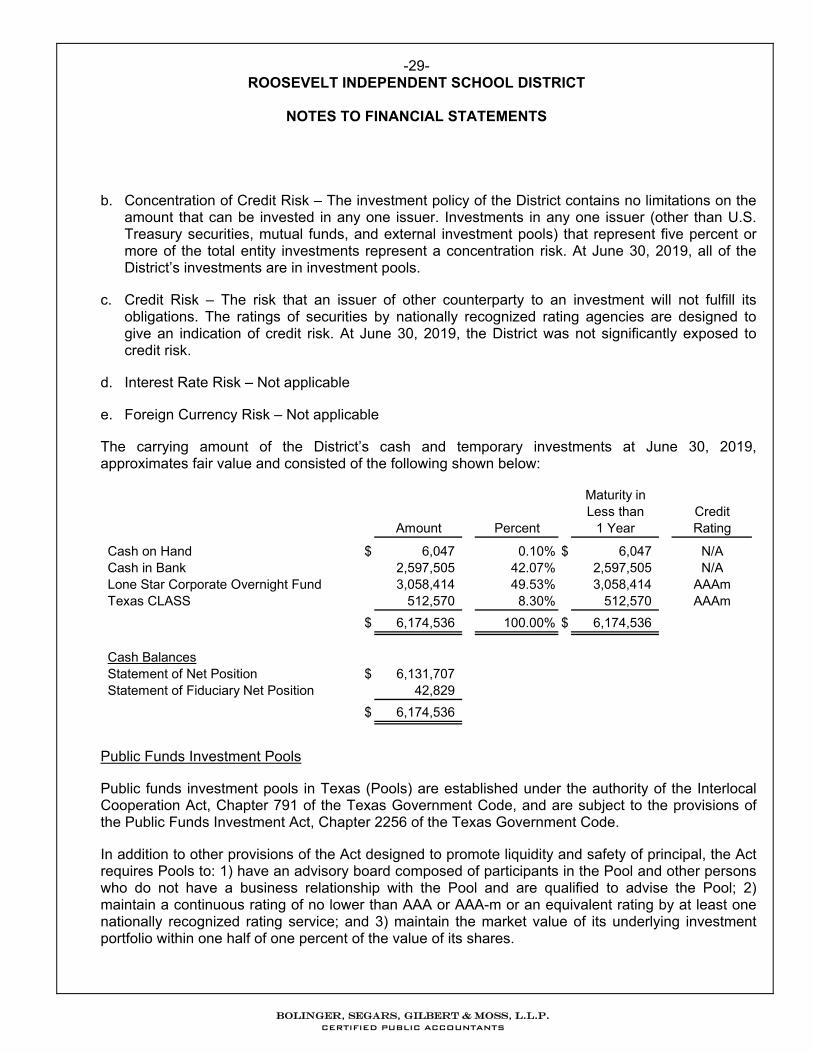
e. Foreign Currency Risk – Not applicable The carrying amount of the District’s cash and temporary investments at June 30, 2019,
approximates fair value and consisted of the following shown below:
Maturity inLess than Credit
Amount Percent 1 Year Rating
Cash on Hand $ 6,047 0.10% $ 6,047 N/ACash in Bank 2,597,505 42.07% 2,597,505 N/ALone Star Corporate Overnight Fund 3,058,414 49.53% 3,058,414 AAAmTexas CLASS 512,570 8.30% 512,570 AAAm
$ 6,174,536 100.00% $ 6,174,536
Cash BalancesStatement of Net Position $ 6,131,707Statement of Fiduciary Net Position 42,829
$ 6,174,536
Public Funds Investment Pools Public funds investment pools in Texas (Pools) are established under the authority of the Interlocal Cooperation Act, Chapter 791 of the Texas Government Code, and are subject to the provisions of the Public Funds Investment Act, Chapter 2256 of the Texas Government Code. In addition to other provisions of the Act designed to promote liquidity and safety of principal, the Act requires Pools to: 1) have an advisory board composed of participants in the Pool and other persons who do not have a business relationship with the Pool and are qualified to advise the Pool; 2) maintain a continuous rating of no lower than AAA or AAA-m or an equivalent rating by at least one nationally recognized rating service; and 3) maintain the market value of its underlying investment portfolio within one half of one percent of the value of its shares.
Bolinger, Segars, Gilbert & Moss, L.L.p. CERTIFIED PUBLIC ACCOUNTANTS
-30- ROOSEVELT INDEPENDENT SCHOOL DISTRICT
NOTES TO FINANCIAL STATEMENTS
The District’s investment in Pools are reported at an amount determined by the fair value per share of the Pool’s underlying portfolio, unless the Pool is 2a7-like, in which case they are reported at share value. A 2a7-like pool is one which is not registered with the Securities and Exchange Commission as an investment company, but nevertheless has a policy that it will, and does, operate in a manner consistent with the SEC’s Rule 2a7 of the Investment Company Act of 1940.
3. PROPERTY TAXES
Property taxes are levied by October 1st on the assessed value listed as of the prior January 1st for all real and business personal property located in the District in conformity with Subtitle E, Texas Property Tax Code. Taxes are due on receipt of the tax bill and are delinquent if not paid before February 1st of the year following the year in which imposed. On January 1st of each year, a tax lien attaches to property to secure the payment of all taxes, penalties, and interest ultimately imposed. Delinquent taxes are prorated between maintenance and debt service based on rates adopted for the year of the levy. All property taxes remaining uncollected after ten years are provided for in the allowance for uncollectible taxes. Uncollectible personal property taxes are periodically reviewed and written off, but the District is prohibited from writing off real property taxes without specific statutory authority from the Texas Legislature.
4. RECEIVABLE FROM OTHER GOVERNMENTS
The amount due from other governments consisted of $865,473 due from the state for foundation revenue and $167,703 due various special revenue fund programs.
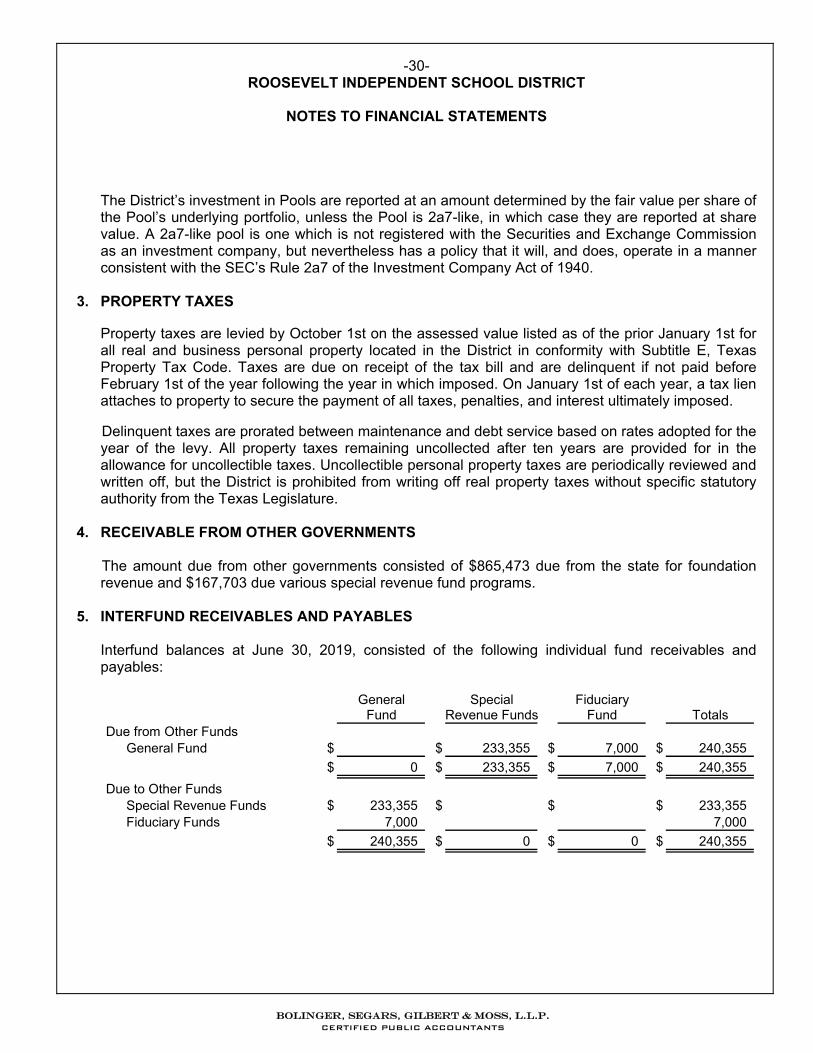
5. INTERFUND RECEIVABLES AND PAYABLES
Interfund balances at June 30, 2019, consisted of the following individual fund receivables and payables:
General Special FiduciaryFund Revenue Funds Fund Totals
Due from Other FundsGeneral Fund $ $ 233,355 $ 7,000 $ 240,355
$ 0 $ 233,355 $ 7,000 $ 240,355
Due to Other FundsSpecial Revenue Funds $ 233,355 $ $ $ 233,355 Fiduciary Funds 7,000 7,000
$ 240,355 $ 0 $ 0 $ 240,355
Bolinger, Segars, Gilbert & Moss, L.L.p. CERTIFIED PUBLIC ACCOUNTANTS
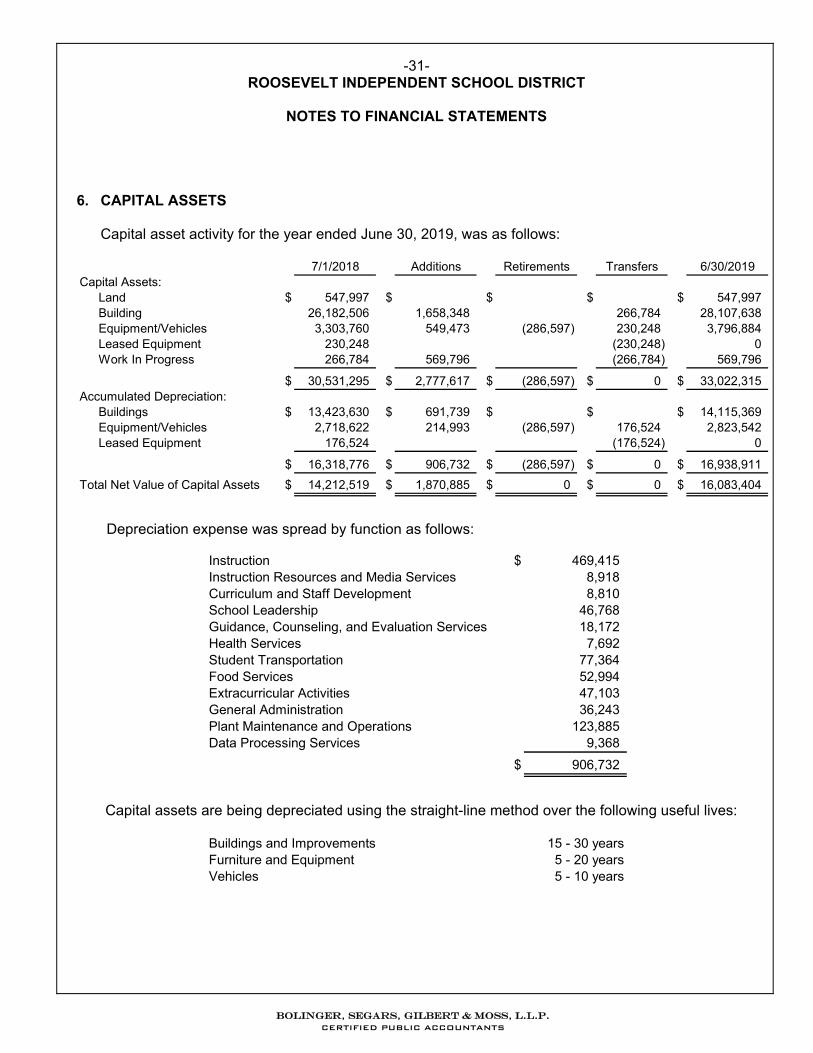
-31- ROOSEVELT INDEPENDENT SCHOOL DISTRICT
NOTES TO FINANCIAL STATEMENTS
6. CAPITAL ASSETS Capital asset activity for the year ended June 30, 2019, was as follows:
7/1/2018 Additions Retirements Transfers 6/30/2019Capital Assets:
Land $ 547,997 $ $ $ $ 547,997Building 26,182,506 1,658,348 266,784 28,107,638Equipment/Vehicles 3,303,760 549,473 (286,597) 230,248 3,796,884Leased Equipment 230,248 (230,248) 0Work In Progress 266,784 569,796 (266,784) 569,796
$ 30,531,295 $ 2,777,617 $ (286,597) $ 0 $ 33,022,315Accumulated Depreciation:
Buildings $ 13,423,630 $ 691,739 $ $ $ 14,115,369Equipment/Vehicles 2,718,622 214,993 (286,597) 176,524 2,823,542Leased Equipment 176,524 (176,524) 0
$ 16,318,776 $ 906,732 $ (286,597) $ 0 $ 16,938,911
Total Net Value of Capital Assets $ 14,212,519 $ 1,870,885 $ 0 $ 0 $ 16,083,404
Depreciation expense was spread by function as follows:
Instruction $ 469,415Instruction Resources and Media Services 8,918Curriculum and Staff Development 8,810School Leadership 46,768Guidance, Counseling, and Evaluation Services 18,172Health Services 7,692Student Transportation 77,364Food Services 52,994Extracurricular Activities 47,103General Administration 36,243Plant Maintenance and Operations 123,885Data Processing Services 9,368
$ 906,732
Capital assets are being depreciated using the straight-line method over the following useful lives:
Buildings and Improvements 15 - 30 yearsFurniture and Equipment 5 - 20 yearsVehicles 5 - 10 years
Bolinger, Segars, Gilbert & Moss, L.L.p. CERTIFIED PUBLIC ACCOUNTANTS
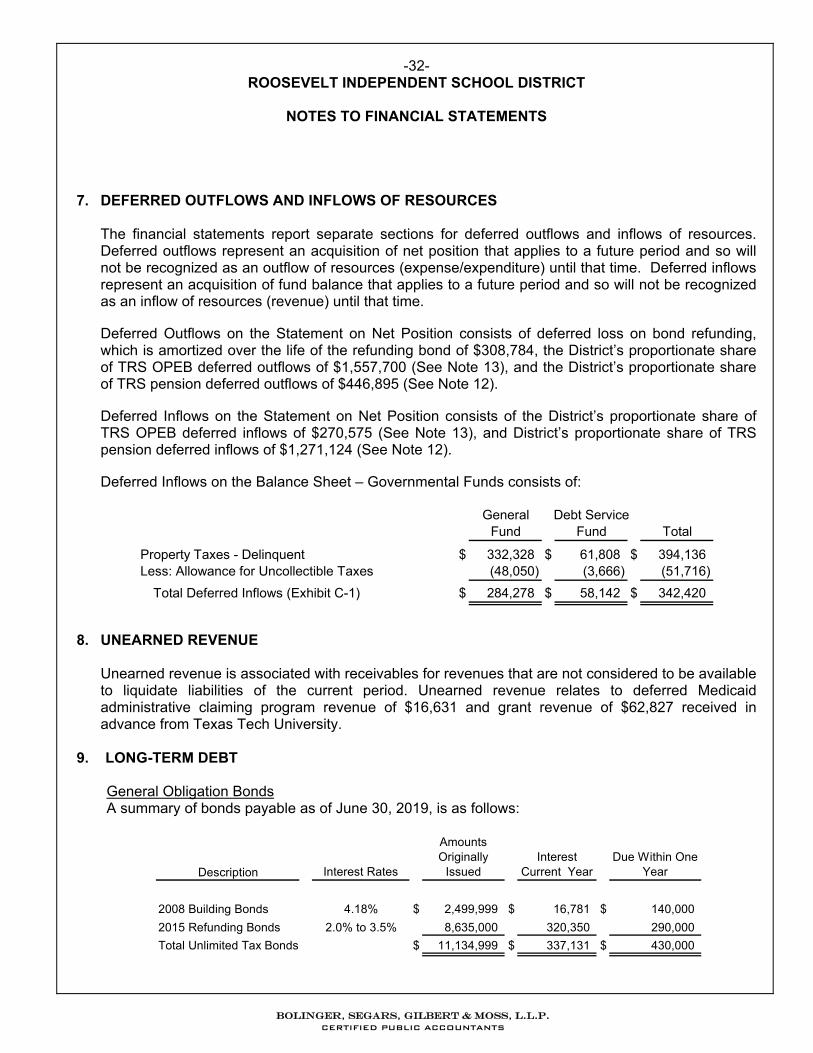
-32- ROOSEVELT INDEPENDENT SCHOOL DISTRICT
NOTES TO FINANCIAL STATEMENTS
7. DEFERRED OUTFLOWS AND INFLOWS OF RESOURCES
The financial statements report separate sections for deferred outflows and inflows of resources. Deferred outflows represent an acquisition of net position that applies to a future period and so will not be recognized as an outflow of resources (expense/expenditure) until that time. Deferred inflows represent an acquisition of fund balance that applies to a future period and so will not be recognized as an inflow of resources (revenue) until that time. Deferred Outflows on the Statement on Net Position consists of deferred loss on bond refunding, which is amortized over the life of the refunding bond of $308,784, the District’s proportionate share of TRS OPEB deferred outflows of $1,557,700 (See Note 13), and the District’s proportionate share of TRS pension deferred outflows of $446,895 (See Note 12). Deferred Inflows on the Statement on Net Position consists of the District’s proportionate share of TRS OPEB deferred inflows of $270,575 (See Note 13), and District’s proportionate share of TRS pension deferred inflows of $1,271,124 (See Note 12). Deferred Inflows on the Balance Sheet – Governmental Funds consists of:
General Debt Service
Fund Fund Total
Property Taxes - Delinquent $ 332,328 $ 61,808 $ 394,136Less: Allowance for Uncollectible Taxes (48,050) (3,666) (51,716)
Total Deferred Inflows (Exhibit C-1) $ 284,278 $ 58,142 $ 342,420
8. UNEARNED REVENUE
Unearned revenue is associated with receivables for revenues that are not considered to be available to liquidate liabilities of the current period. Unearned revenue relates to deferred Medicaid administrative claiming program revenue of $16,631 and grant revenue of $62,827 received in advance from Texas Tech University.
9. LONG-TERM DEBT General Obligation Bonds A summary of bonds payable as of June 30, 2019, is as follows:
Description Interest Rates
Amounts Originally
IssuedInterest
Current YearDue Within One
Year
2008 Building Bonds 4.18% $ 2,499,999 $ 16,781 $ 140,000
2015 Refunding Bonds 2.0% to 3.5% 8,635,000 320,350 290,000
Total Unlimited Tax Bonds $ 11,134,999 $ 337,131 $ 430,000
Bolinger, Segars, Gilbert & Moss, L.L.p. CERTIFIED PUBLIC ACCOUNTANTS
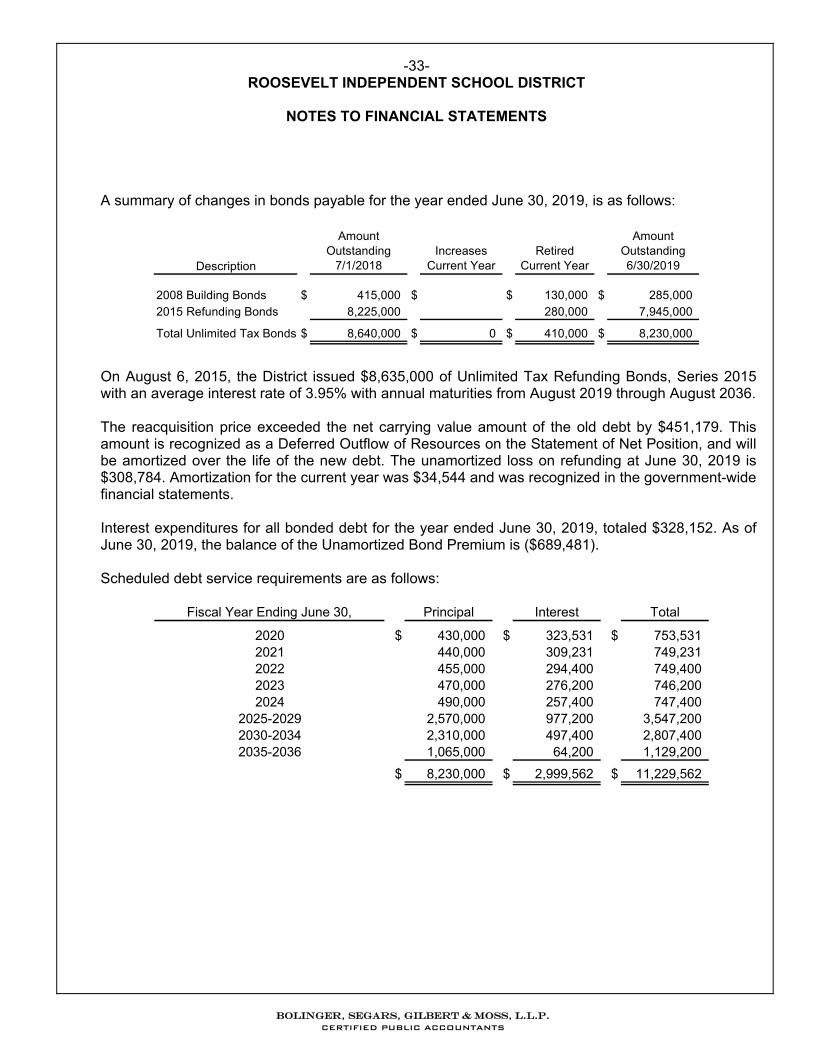
-33- ROOSEVELT INDEPENDENT SCHOOL DISTRICT
NOTES TO FINANCIAL STATEMENTS
A summary of changes in bonds payable for the year ended June 30, 2019, is as follows:
Description
Amount Outstanding
7/1/2018Increases
Current YearRetired
Current Year
Amount Outstanding 6/30/2019
2008 Building Bonds $ 415,000 $ $ 130,000 $ 285,000 2015 Refunding Bonds 8,225,000 280,000 7,945,000
Total Unlimited Tax Bonds $ 8,640,000 $ 0 $ 410,000 $ 8,230,000
On August 6, 2015, the District issued $8,635,000 of Unlimited Tax Refunding Bonds, Series 2015
with an average interest rate of 3.95% with annual maturities from August 2019 through August 2036. The reacquisition price exceeded the net carrying value amount of the old debt by $451,179. This
amount is recognized as a Deferred Outflow of Resources on the Statement of Net Position, and will be amortized over the life of the new debt. The unamortized loss on refunding at June 30, 2019 is $308,784. Amortization for the current year was $34,544 and was recognized in the government-wide financial statements.
Interest expenditures for all bonded debt for the year ended June 30, 2019, totaled $328,152. As of June 30, 2019, the balance of the Unamortized Bond Premium is ($689,481).
Scheduled debt service requirements are as follows:
Fiscal Year Ending June 30, Principal Interest Total
2020 $ 430,000 $ 323,531 $ 753,531 2021 440,000 309,231 749,231 2022 455,000 294,400 749,400 2023 470,000 276,200 746,2002024 490,000 257,400 747,400
2025-2029 2,570,000 977,200 3,547,200 2030-2034 2,310,000 497,400 2,807,400 2035-2036 1,065,000 64,200 1,129,200
$ 8,230,000 $ 2,999,562 $ 11,229,562
Bolinger, Segars, Gilbert & Moss, L.L.p. CERTIFIED PUBLIC ACCOUNTANTS
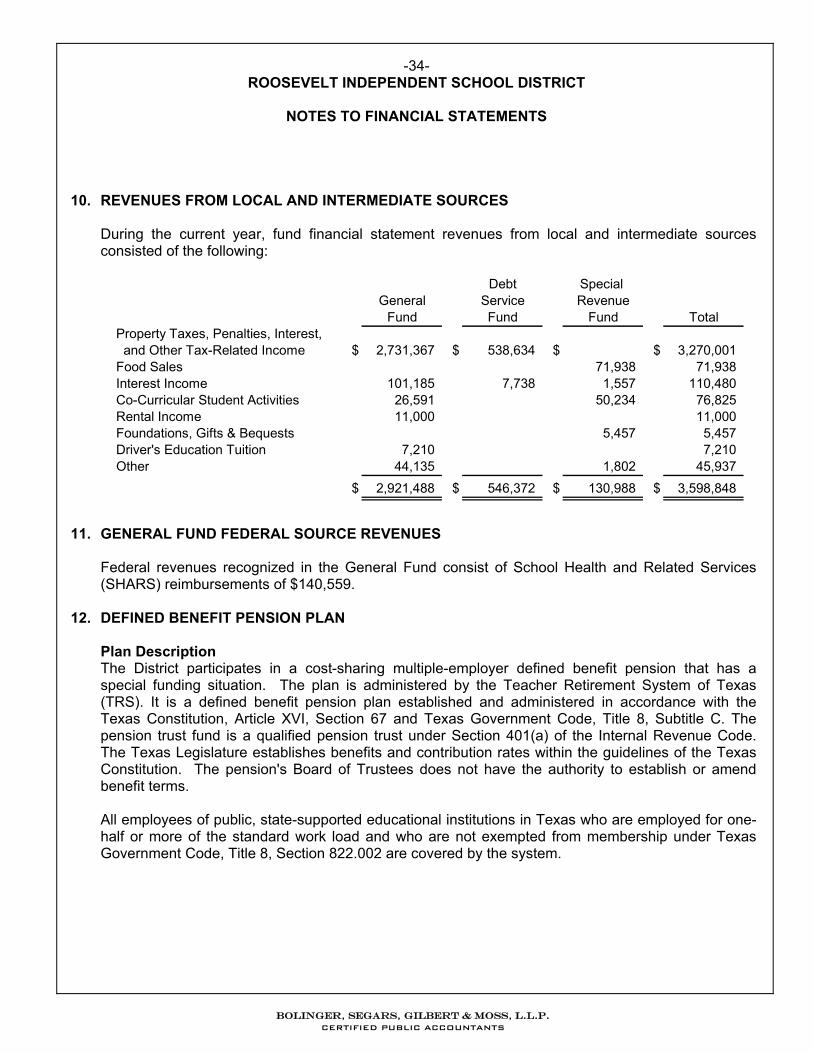
-34- ROOSEVELT INDEPENDENT SCHOOL DISTRICT
NOTES TO FINANCIAL STATEMENTS
10. REVENUES FROM LOCAL AND INTERMEDIATE SOURCES
During the current year, fund financial statement revenues from local and intermediate sources consisted of the following:
Debt Special General Service Revenue
Fund Fund Fund TotalProperty Taxes, Penalties, Interest, and Other Tax-Related Income $ 2,731,367 $ 538,634 $ $ 3,270,001Food Sales 71,938 71,938Interest Income 101,185 7,738 1,557 110,480Co-Curricular Student Activities 26,591 50,234 76,825Rental Income 11,000 11,000Foundations, Gifts & Bequests 5,457 5,457Driver's Education Tuition 7,210 7,210Other 44,135 1,802 45,937
$ 2,921,488 $ 546,372 $ 130,988 $ 3,598,848
11. GENERAL FUND FEDERAL SOURCE REVENUES
Federal revenues recognized in the General Fund consist of School Health and Related Services (SHARS) reimbursements of $140,559.
12. DEFINED BENEFIT PENSION PLAN
Plan Description The District participates in a cost-sharing multiple-employer defined benefit pension that has a special funding situation. The plan is administered by the Teacher Retirement System of Texas (TRS). It is a defined benefit pension plan established and administered in accordance with the Texas Constitution, Article XVI, Section 67 and Texas Government Code, Title 8, Subtitle C. The pension trust fund is a qualified pension trust under Section 401(a) of the Internal Revenue Code. The Texas Legislature establishes benefits and contribution rates within the guidelines of the Texas Constitution. The pension's Board of Trustees does not have the authority to establish or amend benefit terms.
All employees of public, state-supported educational institutions in Texas who are employed for one-half or more of the standard work load and who are not exempted from membership under Texas Government Code, Title 8, Section 822.002 are covered by the system.
Bolinger, Segars, Gilbert & Moss, L.L.p. CERTIFIED PUBLIC ACCOUNTANTS
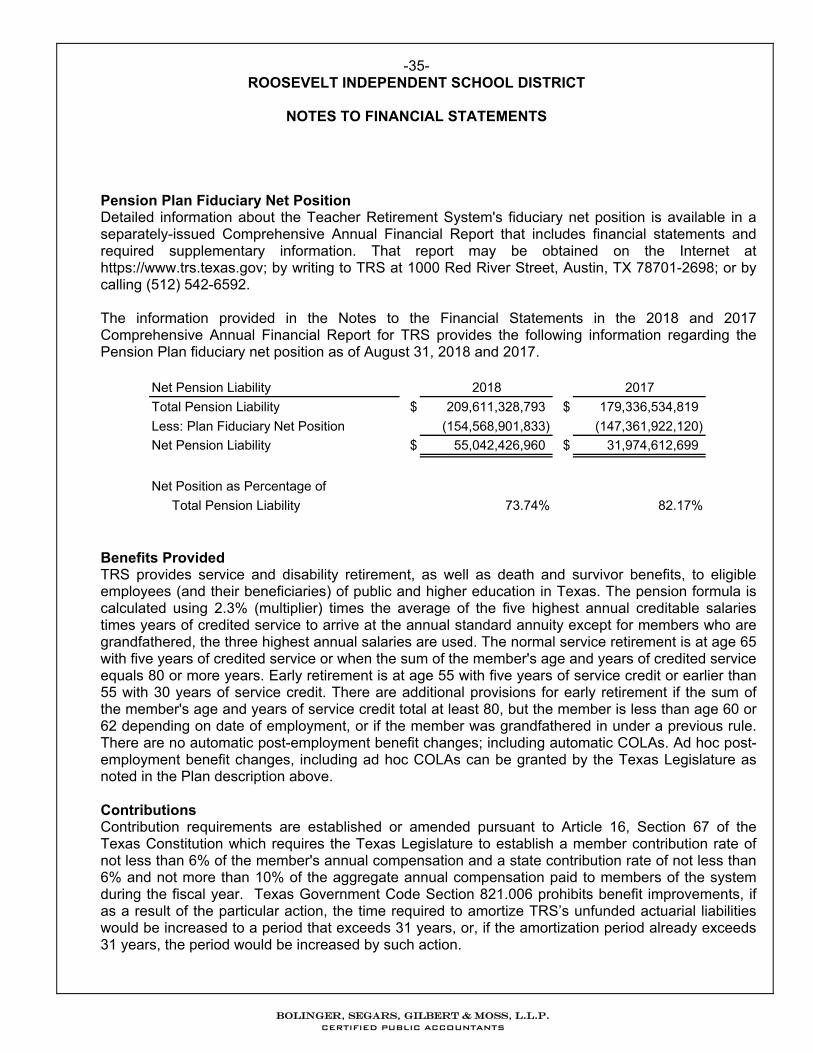
-35- ROOSEVELT INDEPENDENT SCHOOL DISTRICT
NOTES TO FINANCIAL STATEMENTS
Pension Plan Fiduciary Net Position Detailed information about the Teacher Retirement System's fiduciary net position is available in a separately-issued Comprehensive Annual Financial Report that includes financial statements and required supplementary information. That report may be obtained on the Internet at https://www.trs.texas.gov; by writing to TRS at 1000 Red River Street, Austin, TX 78701-2698; or by calling (512) 542-6592. The information provided in the Notes to the Financial Statements in the 2018 and 2017 Comprehensive Annual Financial Report for TRS provides the following information regarding the Pension Plan fiduciary net position as of August 31, 2018 and 2017.
Net Pension Liability 2018 2017
Total Pension Liability $ 209,611,328,793 $ 179,336,534,819
Less: Plan Fiduciary Net Position (154,568,901,833) (147,361,922,120)
Net Pension Liability $ 55,042,426,960 $ 31,974,612,699
Net Position as Percentage of
Total Pension Liability 73.74% 82.17%
Benefits Provided TRS provides service and disability retirement, as well as death and survivor benefits, to eligible employees (and their beneficiaries) of public and higher education in Texas. The pension formula is calculated using 2.3% (multiplier) times the average of the five highest annual creditable salaries times years of credited service to arrive at the annual standard annuity except for members who are grandfathered, the three highest annual salaries are used. The normal service retirement is at age 65 with five years of credited service or when the sum of the member's age and years of credited service equals 80 or more years. Early retirement is at age 55 with five years of service credit or earlier than 55 with 30 years of service credit. There are additional provisions for early retirement if the sum of the member's age and years of service credit total at least 80, but the member is less than age 60 or 62 depending on date of employment, or if the member was grandfathered in under a previous rule. There are no automatic post-employment benefit changes; including automatic COLAs. Ad hoc post-employment benefit changes, including ad hoc COLAs can be granted by the Texas Legislature as noted in the Plan description above. Contributions Contribution requirements are established or amended pursuant to Article 16, Section 67 of the Texas Constitution which requires the Texas Legislature to establish a member contribution rate of not less than 6% of the member's annual compensation and a state contribution rate of not less than 6% and not more than 10% of the aggregate annual compensation paid to members of the system during the fiscal year. Texas Government Code Section 821.006 prohibits benefit improvements, if as a result of the particular action, the time required to amortize TRS’s unfunded actuarial liabilities would be increased to a period that exceeds 31 years, or, if the amortization period already exceeds 31 years, the period would be increased by such action.
Bolinger, Segars, Gilbert & Moss, L.L.p. CERTIFIED PUBLIC ACCOUNTANTS
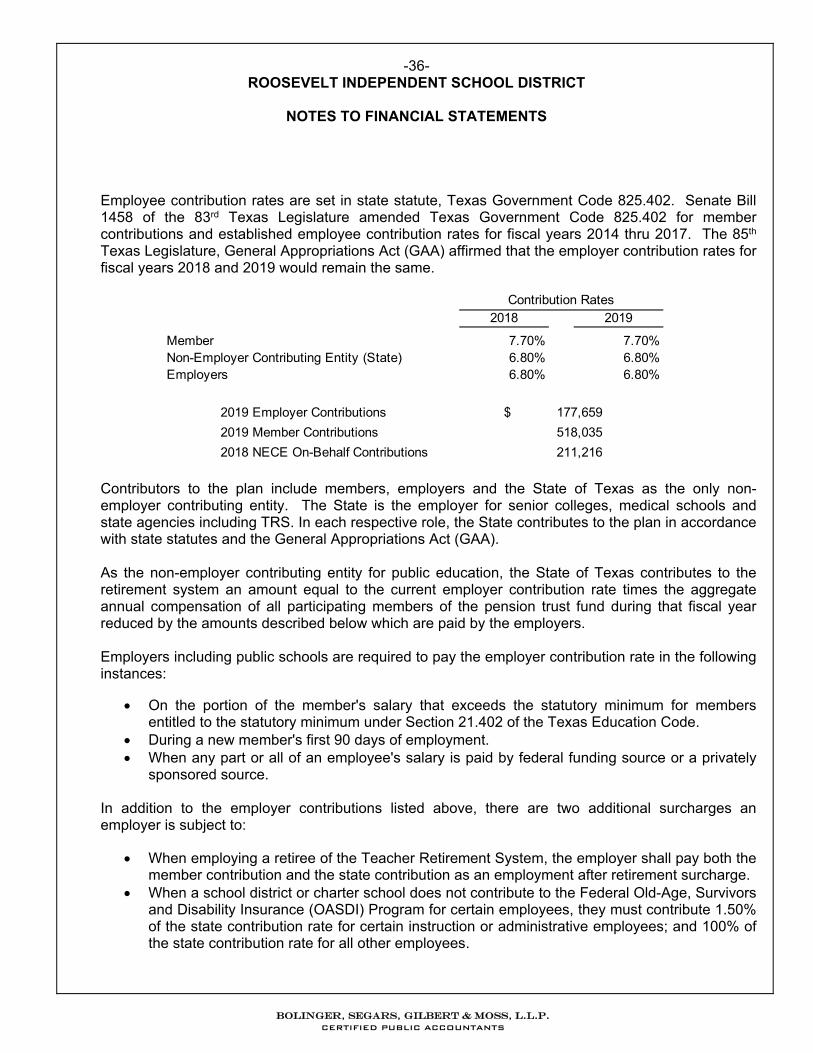
-36- ROOSEVELT INDEPENDENT SCHOOL DISTRICT
NOTES TO FINANCIAL STATEMENTS
Employee contribution rates are set in state statute, Texas Government Code 825.402. Senate Bill 1458 of the 83rd Texas Legislature amended Texas Government Code 825.402 for member contributions and established employee contribution rates for fiscal years 2014 thru 2017. The 85th Texas Legislature, General Appropriations Act (GAA) affirmed that the employer contribution rates for fiscal years 2018 and 2019 would remain the same.
2018 2019
Member 7.70% 7.70%Non-Employer Contributing Entity (State) 6.80% 6.80%Employers 6.80% 6.80%
Contribution Rates
2019 Employer Contributions $ 177,659
2019 Member Contributions 518,035
2018 NECE On-Behalf Contributions 211,216
Contributors to the plan include members, employers and the State of Texas as the only non-employer contributing entity. The State is the employer for senior colleges, medical schools and state agencies including TRS. In each respective role, the State contributes to the plan in accordance with state statutes and the General Appropriations Act (GAA). As the non-employer contributing entity for public education, the State of Texas contributes to the retirement system an amount equal to the current employer contribution rate times the aggregate annual compensation of all participating members of the pension trust fund during that fiscal year reduced by the amounts described below which are paid by the employers. Employers including public schools are required to pay the employer contribution rate in the following instances:
On the portion of the member's salary that exceeds the statutory minimum for members entitled to the statutory minimum under Section 21.402 of the Texas Education Code.
During a new member's first 90 days of employment. When any part or all of an employee's salary is paid by federal funding source or a privately
sponsored source.
In addition to the employer contributions listed above, there are two additional surcharges an employer is subject to:
When employing a retiree of the Teacher Retirement System, the employer shall pay both the member contribution and the state contribution as an employment after retirement surcharge.
When a school district or charter school does not contribute to the Federal Old-Age, Survivors and Disability Insurance (OASDI) Program for certain employees, they must contribute 1.50% of the state contribution rate for certain instruction or administrative employees; and 100% of the state contribution rate for all other employees.
Bolinger, Segars, Gilbert & Moss, L.L.p. CERTIFIED PUBLIC ACCOUNTANTS
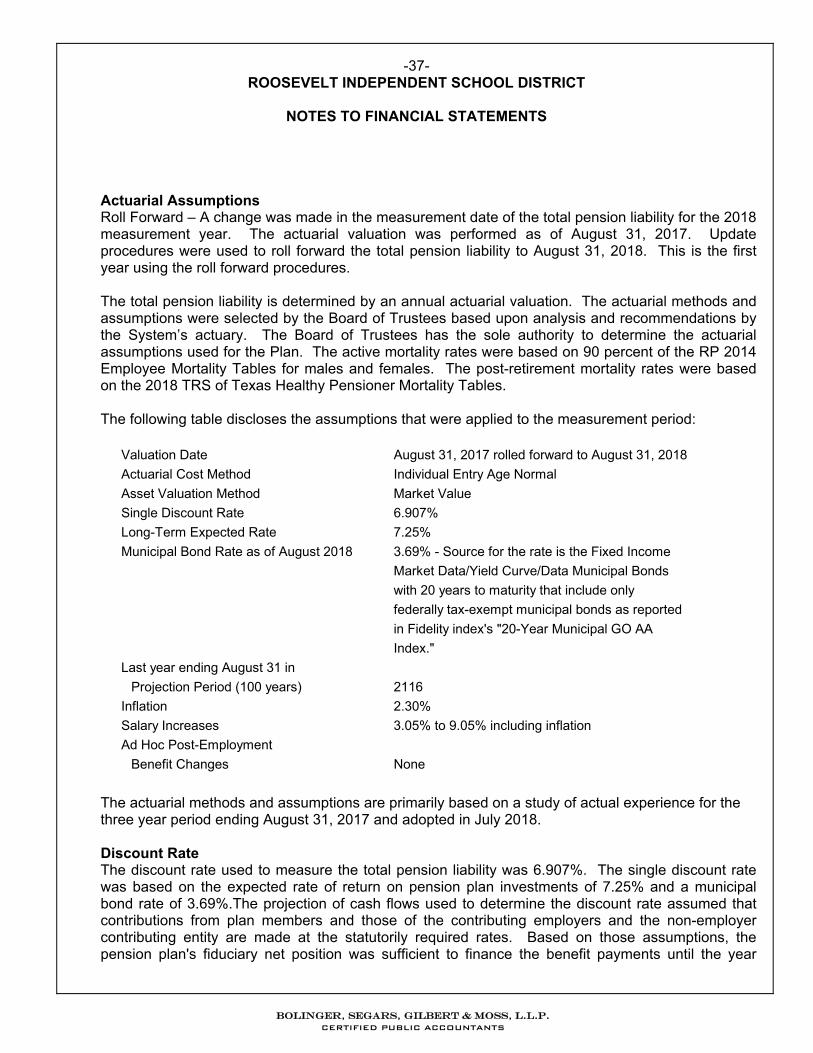
-37- ROOSEVELT INDEPENDENT SCHOOL DISTRICT
NOTES TO FINANCIAL STATEMENTS
Actuarial Assumptions Roll Forward – A change was made in the measurement date of the total pension liability for the 2018 measurement year. The actuarial valuation was performed as of August 31, 2017. Update procedures were used to roll forward the total pension liability to August 31, 2018. This is the first year using the roll forward procedures. The total pension liability is determined by an annual actuarial valuation. The actuarial methods and assumptions were selected by the Board of Trustees based upon analysis and recommendations by the System’s actuary. The Board of Trustees has the sole authority to determine the actuarial assumptions used for the Plan. The active mortality rates were based on 90 percent of the RP 2014 Employee Mortality Tables for males and females. The post-retirement mortality rates were based on the 2018 TRS of Texas Healthy Pensioner Mortality Tables.
The following table discloses the assumptions that were applied to the measurement period:
Valuation Date August 31, 2017 rolled forward to August 31, 2018
Actuarial Cost Method Individual Entry Age Normal
Asset Valuation Method Market Value
Single Discount Rate 6.907%
Long-Term Expected Rate 7.25%
Municipal Bond Rate as of August 2018 3.69% - Source for the rate is the Fixed Income
Market Data/Yield Curve/Data Municipal Bonds
with 20 years to maturity that include only
federally tax-exempt municipal bonds as reported
in Fidelity index's "20-Year Municipal GO AA
Index."
Last year ending August 31 in
Projection Period (100 years) 2116
Inflation 2.30%
Salary Increases 3.05% to 9.05% including inflation
Ad Hoc Post-Employment
Benefit Changes None
The actuarial methods and assumptions are primarily based on a study of actual experience for the three year period ending August 31, 2017 and adopted in July 2018.
Discount Rate The discount rate used to measure the total pension liability was 6.907%. The single discount rate was based on the expected rate of return on pension plan investments of 7.25% and a municipal bond rate of 3.69%.The projection of cash flows used to determine the discount rate assumed that contributions from plan members and those of the contributing employers and the non-employer contributing entity are made at the statutorily required rates. Based on those assumptions, the pension plan's fiduciary net position was sufficient to finance the benefit payments until the year
Bolinger, Segars, Gilbert & Moss, L.L.p. CERTIFIED PUBLIC ACCOUNTANTS
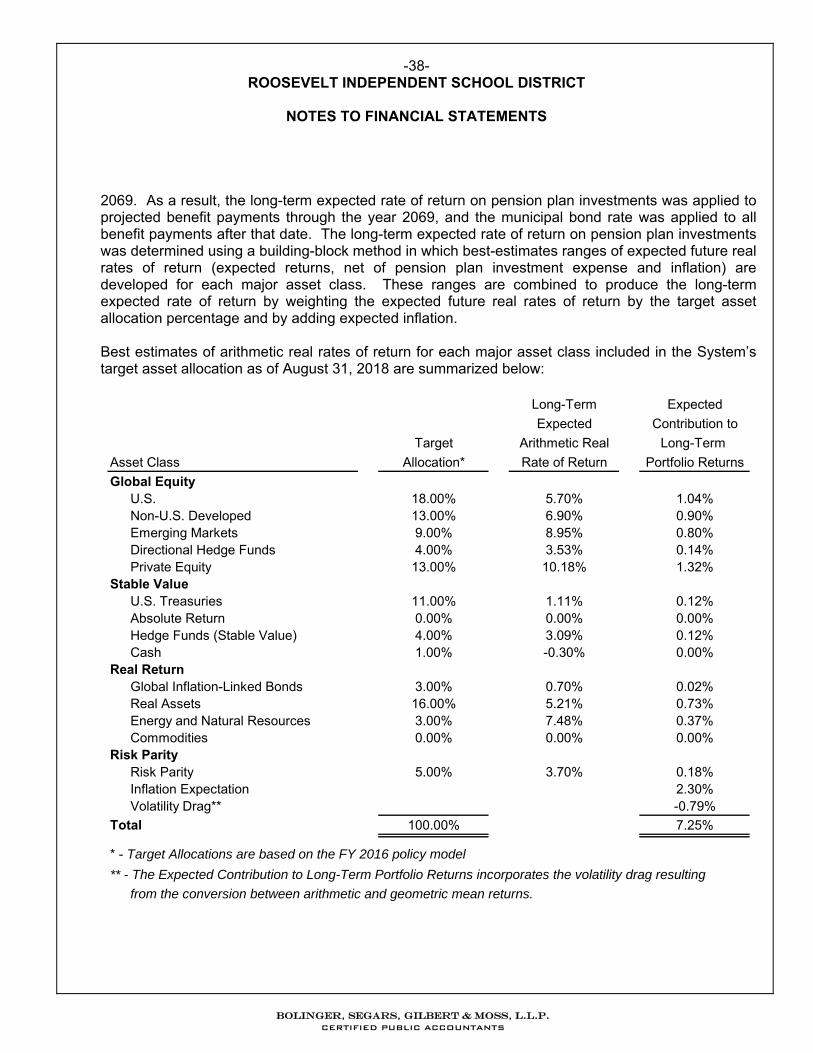
-38- ROOSEVELT INDEPENDENT SCHOOL DISTRICT
NOTES TO FINANCIAL STATEMENTS
2069. As a result, the long-term expected rate of return on pension plan investments was applied to projected benefit payments through the year 2069, and the municipal bond rate was applied to all benefit payments after that date. The long-term expected rate of return on pension plan investments was determined using a building-block method in which best-estimates ranges of expected future real rates of return (expected returns, net of pension plan investment expense and inflation) are developed for each major asset class. These ranges are combined to produce the long-term expected rate of return by weighting the expected future real rates of return by the target asset allocation percentage and by adding expected inflation. Best estimates of arithmetic real rates of return for each major asset class included in the System’s target asset allocation as of August 31, 2018 are summarized below:
Long-Term Expected
Expected Contribution to
Target Arithmetic Real Long-Term
Asset Class Allocation* Rate of Return Portfolio Returns
Global EquityU.S. 18.00% 5.70% 1.04%Non-U.S. Developed 13.00% 6.90% 0.90%Emerging Markets 9.00% 8.95% 0.80%Directional Hedge Funds 4.00% 3.53% 0.14%Private Equity 13.00% 10.18% 1.32%
Stable ValueU.S. Treasuries 11.00% 1.11% 0.12%Absolute Return 0.00% 0.00% 0.00%Hedge Funds (Stable Value) 4.00% 3.09% 0.12%Cash 1.00% -0.30% 0.00%
Real ReturnGlobal Inflation-Linked Bonds 3.00% 0.70% 0.02%Real Assets 16.00% 5.21% 0.73%Energy and Natural Resources 3.00% 7.48% 0.37%Commodities 0.00% 0.00% 0.00%
Risk ParityRisk Parity 5.00% 3.70% 0.18%Inflation Expectation 2.30%Volatility Drag** -0.79%
Total 100.00% 7.25%
* - Target Allocations are based on the FY 2016 policy model
** - The Expected Contribution to Long-Term Portfolio Returns incorporates the volatility drag resulting
from the conversion between arithmetic and geometric mean returns.
Bolinger, Segars, Gilbert & Moss, L.L.p. CERTIFIED PUBLIC ACCOUNTANTS
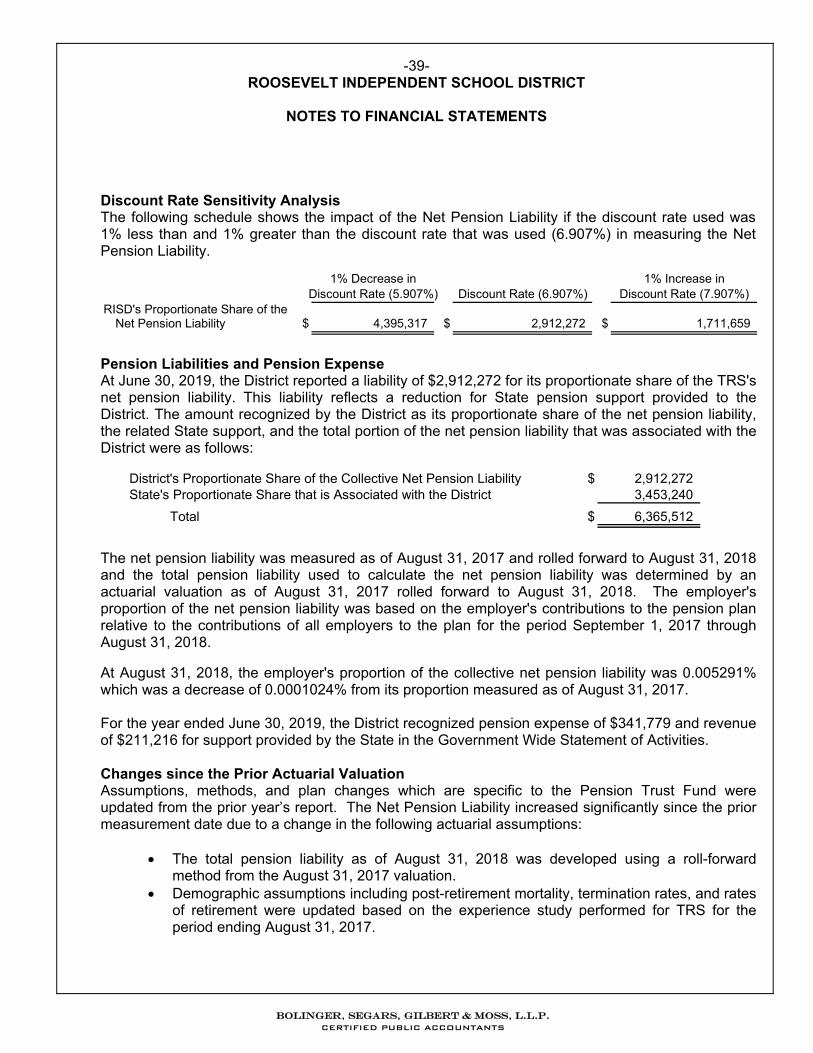
-39- ROOSEVELT INDEPENDENT SCHOOL DISTRICT
NOTES TO FINANCIAL STATEMENTS
Discount Rate Sensitivity Analysis The following schedule shows the impact of the Net Pension Liability if the discount rate used was 1% less than and 1% greater than the discount rate that was used (6.907%) in measuring the Net Pension Liability.
1% Decrease in 1% Increase inDiscount Rate (5.907%) Discount Rate (6.907%) Discount Rate (7.907%)
RISD's Proportionate Share of theNet Pension Liability $ 4,395,317 $ 2,912,272 $ 1,711,659
Pension Liabilities and Pension Expense At June 30, 2019, the District reported a liability of $2,912,272 for its proportionate share of the TRS's net pension liability. This liability reflects a reduction for State pension support provided to the District. The amount recognized by the District as its proportionate share of the net pension liability, the related State support, and the total portion of the net pension liability that was associated with the District were as follows:
District's Proportionate Share of the Collective Net Pension Liability $ 2,912,272 State's Proportionate Share that is Associated with the District 3,453,240
Total $ 6,365,512
The net pension liability was measured as of August 31, 2017 and rolled forward to August 31, 2018 and the total pension liability used to calculate the net pension liability was determined by an actuarial valuation as of August 31, 2017 rolled forward to August 31, 2018. The employer's proportion of the net pension liability was based on the employer's contributions to the pension plan relative to the contributions of all employers to the plan for the period September 1, 2017 through August 31, 2018. At August 31, 2018, the employer's proportion of the collective net pension liability was 0.005291% which was a decrease of 0.0001024% from its proportion measured as of August 31, 2017.
For the year ended June 30, 2019, the District recognized pension expense of $341,779 and revenue of $211,216 for support provided by the State in the Government Wide Statement of Activities. Changes since the Prior Actuarial Valuation Assumptions, methods, and plan changes which are specific to the Pension Trust Fund were updated from the prior year’s report. The Net Pension Liability increased significantly since the prior measurement date due to a change in the following actuarial assumptions:
The total pension liability as of August 31, 2018 was developed using a roll-forward method from the August 31, 2017 valuation.
Demographic assumptions including post-retirement mortality, termination rates, and rates of retirement were updated based on the experience study performed for TRS for the period ending August 31, 2017.
Bolinger, Segars, Gilbert & Moss, L.L.p. CERTIFIED PUBLIC ACCOUNTANTS
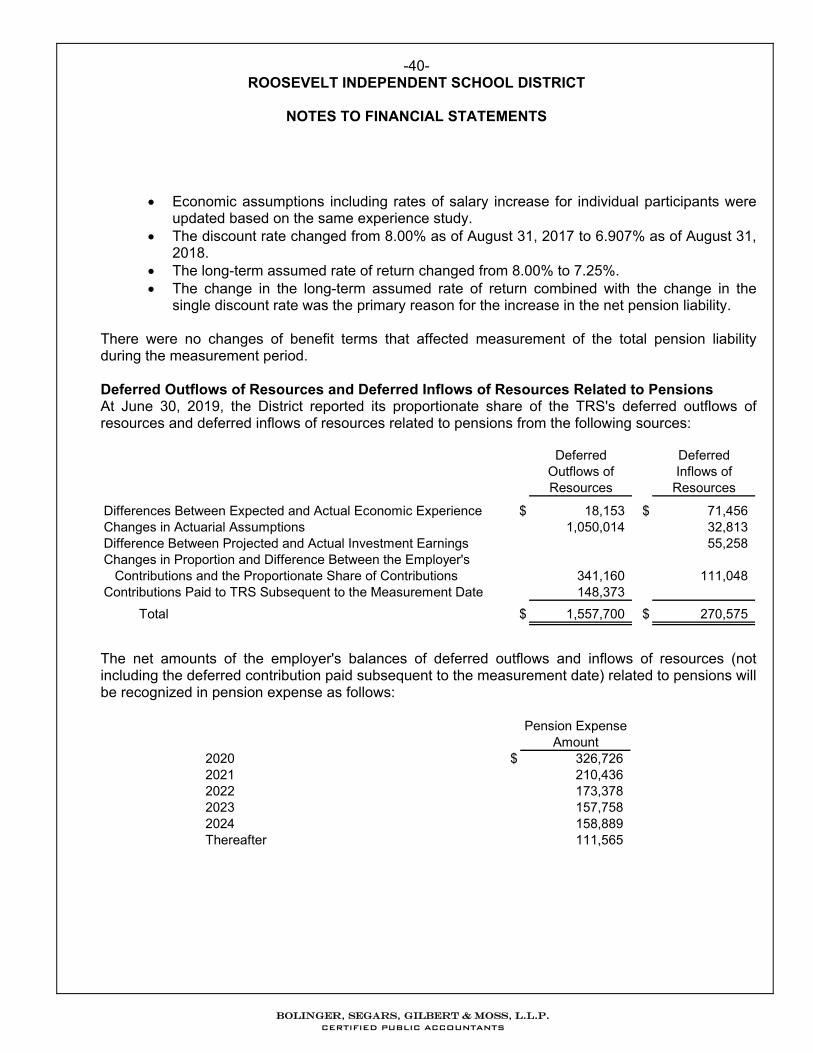
-40- ROOSEVELT INDEPENDENT SCHOOL DISTRICT
NOTES TO FINANCIAL STATEMENTS
Economic assumptions including rates of salary increase for individual participants were updated based on the same experience study.
The discount rate changed from 8.00% as of August 31, 2017 to 6.907% as of August 31, 2018.
The long-term assumed rate of return changed from 8.00% to 7.25%. The change in the long-term assumed rate of return combined with the change in the
single discount rate was the primary reason for the increase in the net pension liability. There were no changes of benefit terms that affected measurement of the total pension liability during the measurement period. Deferred Outflows of Resources and Deferred Inflows of Resources Related to Pensions At June 30, 2019, the District reported its proportionate share of the TRS's deferred outflows of resources and deferred inflows of resources related to pensions from the following sources:
Deferred Deferred
Outflows of Inflows ofResources Resources
Differences Between Expected and Actual Economic Experience $ 18,153 $ 71,456 Changes in Actuarial Assumptions 1,050,014 32,813 Difference Between Projected and Actual Investment Earnings 55,258 Changes in Proportion and Difference Between the Employer's Contributions and the Proportionate Share of Contributions 341,160 111,048 Contributions Paid to TRS Subsequent to the Measurement Date 148,373
Total $ 1,557,700 $ 270,575
The net amounts of the employer's balances of deferred outflows and inflows of resources (not including the deferred contribution paid subsequent to the measurement date) related to pensions will be recognized in pension expense as follows:
Pension Expense
Amount2020 $ 326,726 2021 210,436 2022 173,378 2023 157,758 2024 158,889 Thereafter 111,565
Bolinger, Segars, Gilbert & Moss, L.L.p. CERTIFIED PUBLIC ACCOUNTANTS
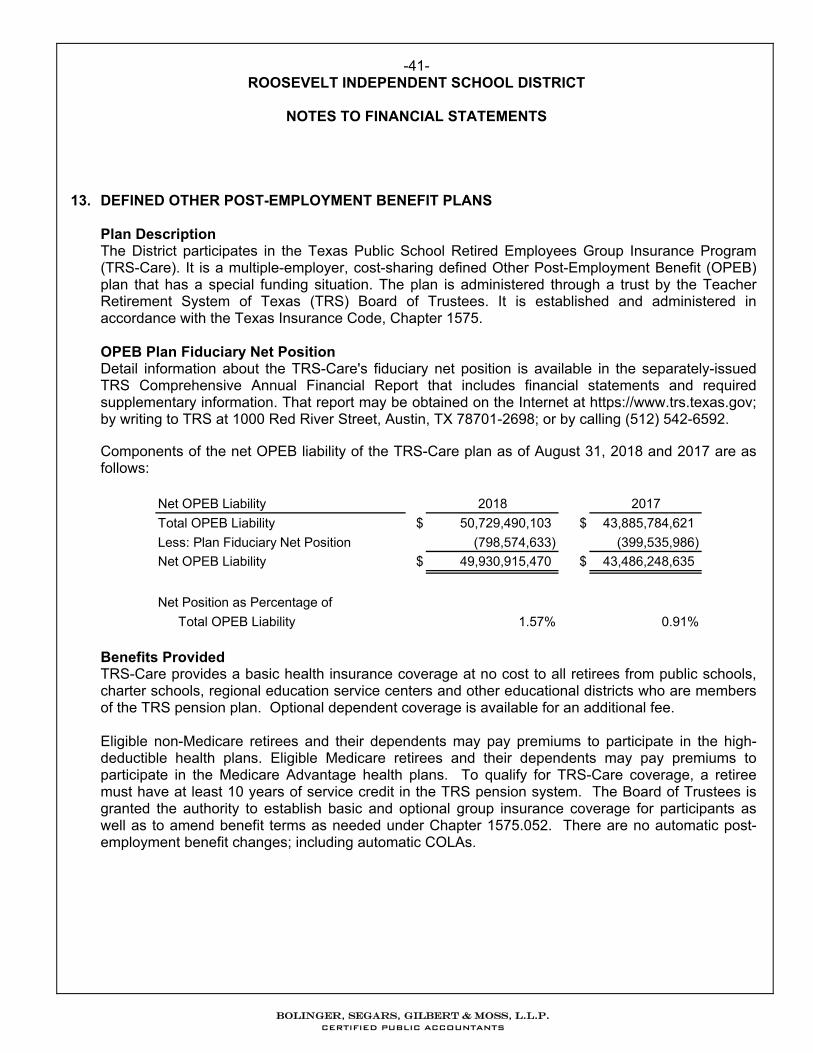
-41- ROOSEVELT INDEPENDENT SCHOOL DISTRICT
NOTES TO FINANCIAL STATEMENTS
13. DEFINED OTHER POST-EMPLOYMENT BENEFIT PLANS Plan Description The District participates in the Texas Public School Retired Employees Group Insurance Program (TRS-Care). It is a multiple-employer, cost-sharing defined Other Post-Employment Benefit (OPEB) plan that has a special funding situation. The plan is administered through a trust by the Teacher Retirement System of Texas (TRS) Board of Trustees. It is established and administered in accordance with the Texas Insurance Code, Chapter 1575. OPEB Plan Fiduciary Net Position Detail information about the TRS-Care's fiduciary net position is available in the separately-issued TRS Comprehensive Annual Financial Report that includes financial statements and required supplementary information. That report may be obtained on the Internet at https://www.trs.texas.gov; by writing to TRS at 1000 Red River Street, Austin, TX 78701-2698; or by calling (512) 542-6592.
Components of the net OPEB liability of the TRS-Care plan as of August 31, 2018 and 2017 are as follows:
Net OPEB Liability 2018 2017
Total OPEB Liability $ 50,729,490,103 $ 43,885,784,621
Less: Plan Fiduciary Net Position (798,574,633) (399,535,986)
Net OPEB Liability $ 49,930,915,470 $ 43,486,248,635
Net Position as Percentage of
Total OPEB Liability 1.57% 0.91%
Benefits Provided TRS-Care provides a basic health insurance coverage at no cost to all retirees from public schools, charter schools, regional education service centers and other educational districts who are members of the TRS pension plan. Optional dependent coverage is available for an additional fee. Eligible non-Medicare retirees and their dependents may pay premiums to participate in the high-deductible health plans. Eligible Medicare retirees and their dependents may pay premiums to participate in the Medicare Advantage health plans. To qualify for TRS-Care coverage, a retiree must have at least 10 years of service credit in the TRS pension system. The Board of Trustees is granted the authority to establish basic and optional group insurance coverage for participants as well as to amend benefit terms as needed under Chapter 1575.052. There are no automatic post-employment benefit changes; including automatic COLAs.
Bolinger, Segars, Gilbert & Moss, L.L.p. CERTIFIED PUBLIC ACCOUNTANTS
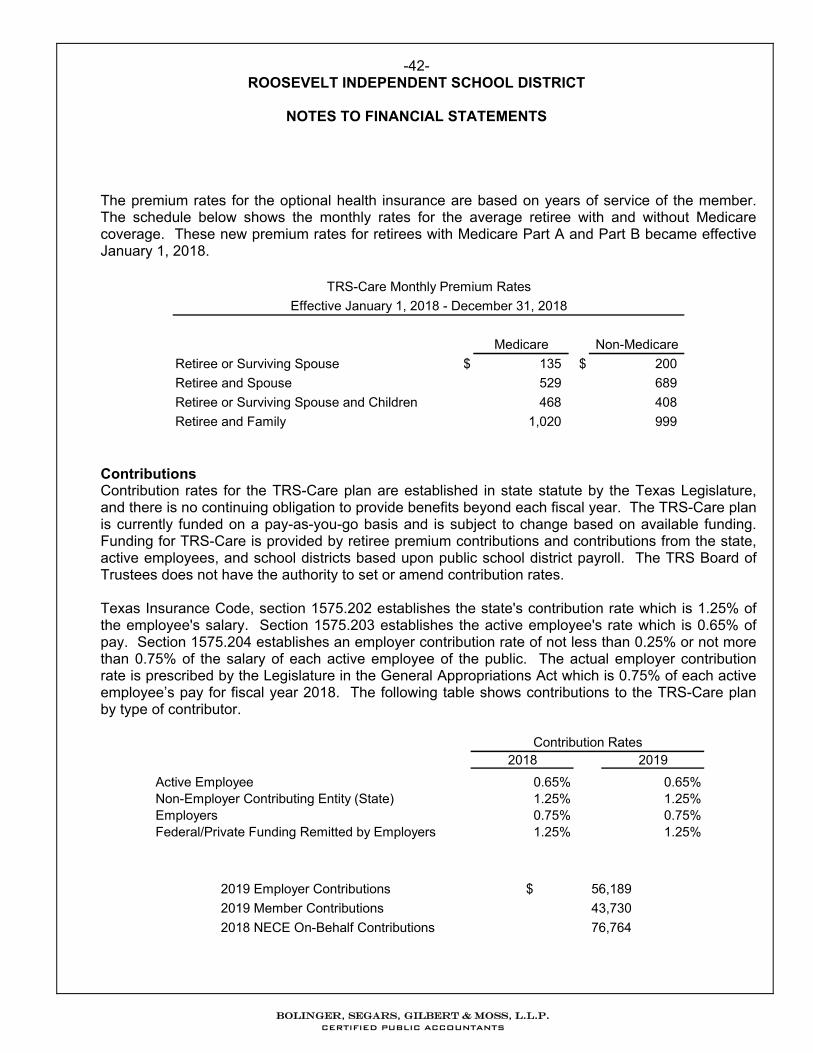
-42- ROOSEVELT INDEPENDENT SCHOOL DISTRICT
NOTES TO FINANCIAL STATEMENTS
The premium rates for the optional health insurance are based on years of service of the member. The schedule below shows the monthly rates for the average retiree with and without Medicare coverage. These new premium rates for retirees with Medicare Part A and Part B became effective January 1, 2018.
Medicare Non-Medicare
Retiree or Surviving Spouse $ 135 $ 200
Retiree and Spouse 529 689
Retiree or Surviving Spouse and Children 468 408
Retiree and Family 1,020 999
Effective January 1, 2018 - December 31, 2018
TRS-Care Monthly Premium Rates
Contributions Contribution rates for the TRS-Care plan are established in state statute by the Texas Legislature, and there is no continuing obligation to provide benefits beyond each fiscal year. The TRS-Care plan is currently funded on a pay-as-you-go basis and is subject to change based on available funding. Funding for TRS-Care is provided by retiree premium contributions and contributions from the state, active employees, and school districts based upon public school district payroll. The TRS Board of Trustees does not have the authority to set or amend contribution rates. Texas Insurance Code, section 1575.202 establishes the state's contribution rate which is 1.25% of the employee's salary. Section 1575.203 establishes the active employee's rate which is 0.65% of pay. Section 1575.204 establishes an employer contribution rate of not less than 0.25% or not more than 0.75% of the salary of each active employee of the public. The actual employer contribution rate is prescribed by the Legislature in the General Appropriations Act which is 0.75% of each active employee’s pay for fiscal year 2018. The following table shows contributions to the TRS-Care plan by type of contributor.
2018 2019
Active Employee 0.65% 0.65%Non-Employer Contributing Entity (State) 1.25% 1.25%Employers 0.75% 0.75%Federal/Private Funding Remitted by Employers 1.25% 1.25%
Contribution Rates
2019 Employer Contributions $ 56,189
2019 Member Contributions 43,730
2018 NECE On-Behalf Contributions 76,764
Bolinger, Segars, Gilbert & Moss, L.L.p. CERTIFIED PUBLIC ACCOUNTANTS
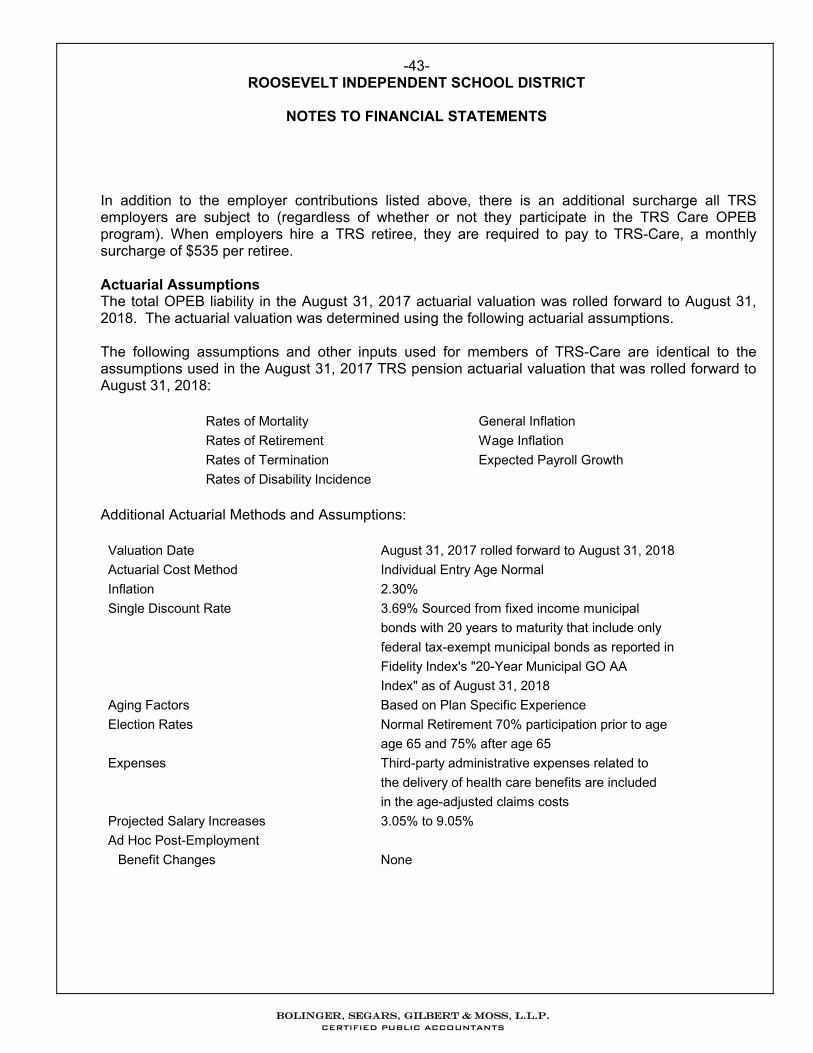
-43- ROOSEVELT INDEPENDENT SCHOOL DISTRICT
NOTES TO FINANCIAL STATEMENTS
In addition to the employer contributions listed above, there is an additional surcharge all TRS employers are subject to (regardless of whether or not they participate in the TRS Care OPEB program). When employers hire a TRS retiree, they are required to pay to TRS-Care, a monthly surcharge of $535 per retiree.
Actuarial Assumptions The total OPEB liability in the August 31, 2017 actuarial valuation was rolled forward to August 31, 2018. The actuarial valuation was determined using the following actuarial assumptions.
The following assumptions and other inputs used for members of TRS-Care are identical to the assumptions used in the August 31, 2017 TRS pension actuarial valuation that was rolled forward to August 31, 2018:
Rates of Mortality General Inflation
Rates of Retirement Wage Inflation
Rates of Termination Expected Payroll Growth
Rates of Disability Incidence Additional Actuarial Methods and Assumptions:
Valuation Date August 31, 2017 rolled forward to August 31, 2018
Actuarial Cost Method Individual Entry Age Normal
Inflation 2.30%
Single Discount Rate 3.69% Sourced from fixed income municipal
bonds with 20 years to maturity that include only
federal tax-exempt municipal bonds as reported in
Fidelity Index's "20-Year Municipal GO AA
Index" as of August 31, 2018
Aging Factors Based on Plan Specific Experience
Election Rates Normal Retirement 70% participation prior to age
age 65 and 75% after age 65
Expenses Third-party administrative expenses related to
the delivery of health care benefits are included
in the age-adjusted claims costs
Projected Salary Increases 3.05% to 9.05%
Ad Hoc Post-Employment
Benefit Changes None
Bolinger, Segars, Gilbert & Moss, L.L.p. CERTIFIED PUBLIC ACCOUNTANTS
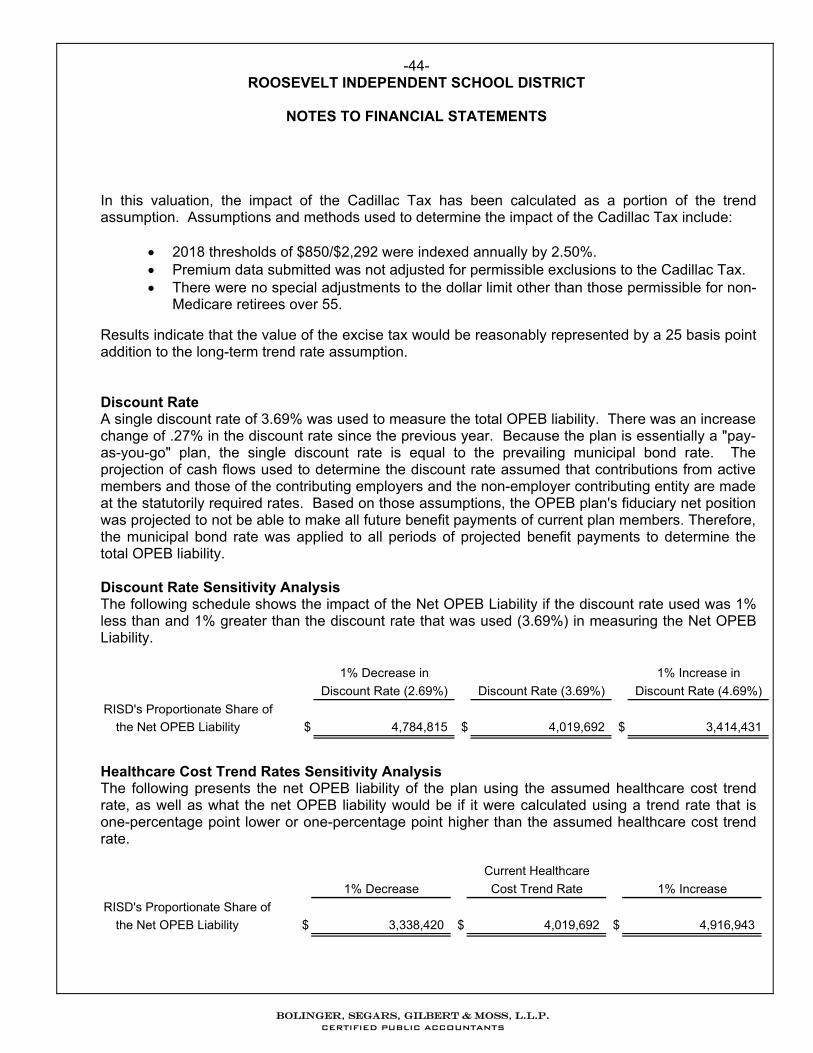
-44-ROOSEVELT INDEPENDENT SCHOOL DISTRICT
NOTES TO FINANCIAL STATEMENTS
In this valuation, the impact of the Cadillac Tax has been calculated as a portion of the trend assumption. Assumptions and methods used to determine the impact of the Cadillac Tax include:
2018 thresholds of $850/$2,292 were indexed annually by 2.50%. Premium data submitted was not adjusted for permissible exclusions to the Cadillac Tax. There were no special adjustments to the dollar limit other than those permissible for non-
Medicare retirees over 55.
Results indicate that the value of the excise tax would be reasonably represented by a 25 basis point addition to the long-term trend rate assumption.
Discount Rate A single discount rate of 3.69% was used to measure the total OPEB liability. There was an increase change of .27% in the discount rate since the previous year. Because the plan is essentially a "pay-as-you-go" plan, the single discount rate is equal to the prevailing municipal bond rate. The projection of cash flows used to determine the discount rate assumed that contributions from active members and those of the contributing employers and the non-employer contributing entity are made at the statutorily required rates. Based on those assumptions, the OPEB plan's fiduciary net position was projected to not be able to make all future benefit payments of current plan members. Therefore, the municipal bond rate was applied to all periods of projected benefit payments to determine the total OPEB liability.
Discount Rate Sensitivity Analysis The following schedule shows the impact of the Net OPEB Liability if the discount rate used was 1% less than and 1% greater than the discount rate that was used (3.69%) in measuring the Net OPEB Liability.
1% Decrease in 1% Increase in
Discount Rate (2.69%) Discount Rate (3.69%) Discount Rate (4.69%)
RISD's Proportionate Share of
the Net OPEB Liability $ 4,784,815 $ 4,019,692 $ 3,414,431
Healthcare Cost Trend Rates Sensitivity Analysis The following presents the net OPEB liability of the plan using the assumed healthcare cost trend rate, as well as what the net OPEB liability would be if it were calculated using a trend rate that is one-percentage point lower or one-percentage point higher than the assumed healthcare cost trend rate.
Current Healthcare
1% Decrease Cost Trend Rate 1% Increase
RISD's Proportionate Share of
the Net OPEB Liability $ 3,338,420 $ 4,019,692 $ 4,916,943
Bolinger, Segars, Gilbert & Moss, L.L.p. CERTIFIED PUBLIC ACCOUNTANTS
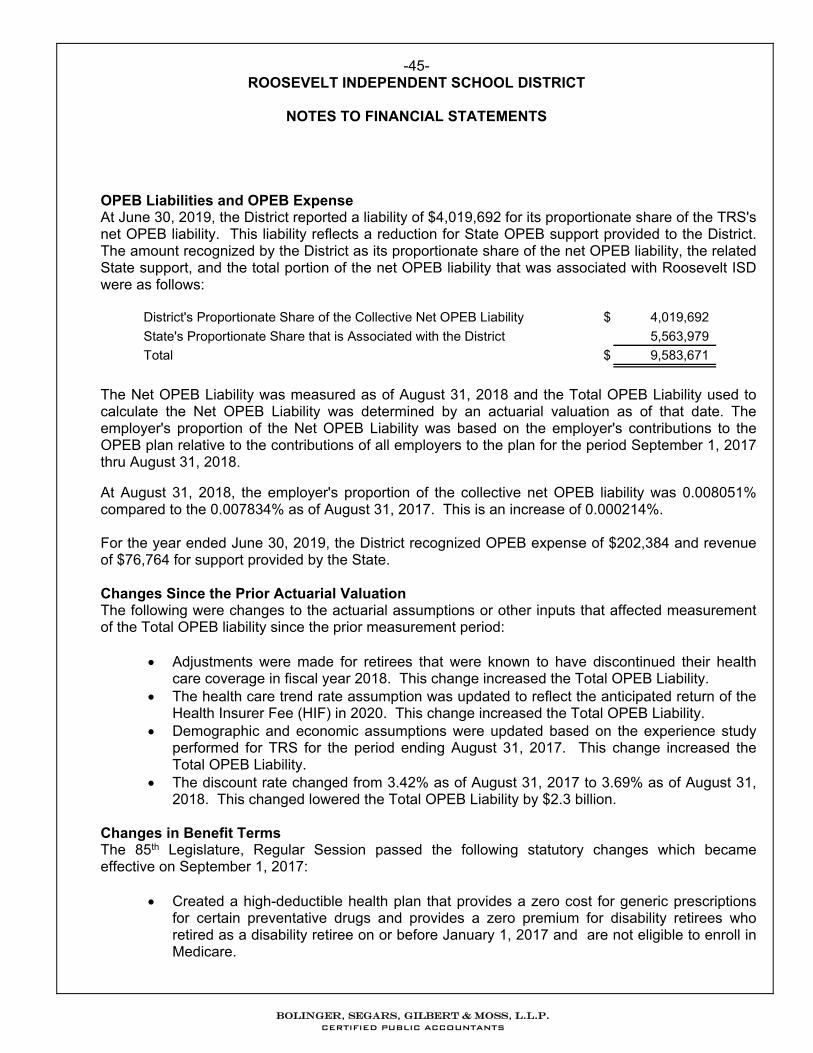
-45- ROOSEVELT INDEPENDENT SCHOOL DISTRICT
NOTES TO FINANCIAL STATEMENTS
OPEB Liabilities and OPEB Expense At June 30, 2019, the District reported a liability of $4,019,692 for its proportionate share of the TRS's net OPEB liability. This liability reflects a reduction for State OPEB support provided to the District. The amount recognized by the District as its proportionate share of the net OPEB liability, the related State support, and the total portion of the net OPEB liability that was associated with Roosevelt ISD were as follows:
District's Proportionate Share of the Collective Net OPEB Liability $ 4,019,692
State's Proportionate Share that is Associated with the District 5,563,979
Total $ 9,583,671
The Net OPEB Liability was measured as of August 31, 2018 and the Total OPEB Liability used to calculate the Net OPEB Liability was determined by an actuarial valuation as of that date. The employer's proportion of the Net OPEB Liability was based on the employer's contributions to the OPEB plan relative to the contributions of all employers to the plan for the period September 1, 2017 thru August 31, 2018. At August 31, 2018, the employer's proportion of the collective net OPEB liability was 0.008051% compared to the 0.007834% as of August 31, 2017. This is an increase of 0.000214%. For the year ended June 30, 2019, the District recognized OPEB expense of $202,384 and revenue of $76,764 for support provided by the State.
Changes Since the Prior Actuarial Valuation The following were changes to the actuarial assumptions or other inputs that affected measurement of the Total OPEB liability since the prior measurement period:
Adjustments were made for retirees that were known to have discontinued their health care coverage in fiscal year 2018. This change increased the Total OPEB Liability.
The health care trend rate assumption was updated to reflect the anticipated return of the Health Insurer Fee (HIF) in 2020. This change increased the Total OPEB Liability.
Demographic and economic assumptions were updated based on the experience study performed for TRS for the period ending August 31, 2017. This change increased the Total OPEB Liability.
The discount rate changed from 3.42% as of August 31, 2017 to 3.69% as of August 31, 2018. This changed lowered the Total OPEB Liability by $2.3 billion.
Changes in Benefit Terms The 85th Legislature, Regular Session passed the following statutory changes which became effective on September 1, 2017:
Created a high-deductible health plan that provides a zero cost for generic prescriptions for certain preventative drugs and provides a zero premium for disability retirees who retired as a disability retiree on or before January 1, 2017 and are not eligible to enroll in Medicare.
Bolinger, Segars, Gilbert & Moss, L.L.p. CERTIFIED PUBLIC ACCOUNTANTS
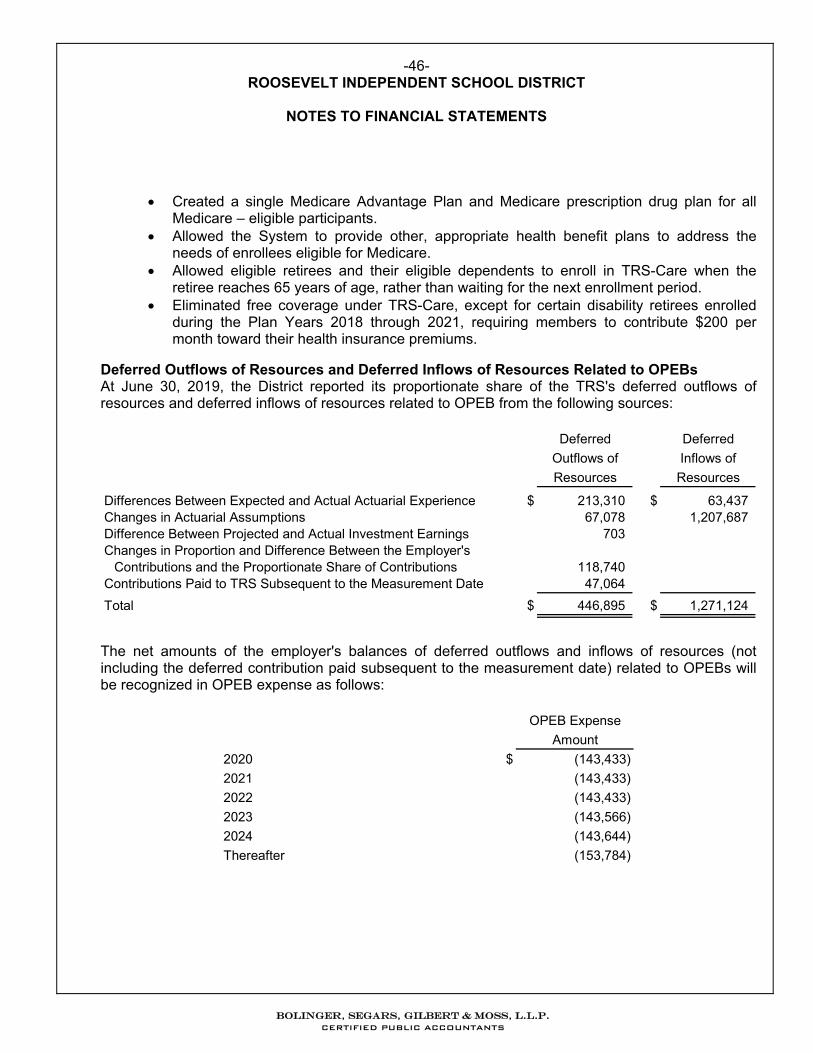
-46- ROOSEVELT INDEPENDENT SCHOOL DISTRICT
NOTES TO FINANCIAL STATEMENTS
Created a single Medicare Advantage Plan and Medicare prescription drug plan for all Medicare – eligible participants.
Allowed the System to provide other, appropriate health benefit plans to address the needs of enrollees eligible for Medicare.
Allowed eligible retirees and their eligible dependents to enroll in TRS-Care when the retiree reaches 65 years of age, rather than waiting for the next enrollment period.
Eliminated free coverage under TRS-Care, except for certain disability retirees enrolled during the Plan Years 2018 through 2021, requiring members to contribute $200 per month toward their health insurance premiums.
Deferred Outflows of Resources and Deferred Inflows of Resources Related to OPEBs At June 30, 2019, the District reported its proportionate share of the TRS's deferred outflows of resources and deferred inflows of resources related to OPEB from the following sources:
Deferred Deferred
Outflows of Inflows of
Resources Resources
Differences Between Expected and Actual Actuarial Experience $ 213,310 $ 63,437 Changes in Actuarial Assumptions 67,078 1,207,687 Difference Between Projected and Actual Investment Earnings 703 Changes in Proportion and Difference Between the Employer's
Contributions and the Proportionate Share of Contributions 118,740 Contributions Paid to TRS Subsequent to the Measurement Date 47,064
Total $ 446,895 $ 1,271,124
The net amounts of the employer's balances of deferred outflows and inflows of resources (not including the deferred contribution paid subsequent to the measurement date) related to OPEBs will be recognized in OPEB expense as follows:
OPEB Expense
Amount
2020 $ (143,433)
2021 (143,433)
2022 (143,433)
2023 (143,566)
2024 (143,644)
Thereafter (153,784)
Bolinger, Segars, Gilbert & Moss, L.L.p. CERTIFIED PUBLIC ACCOUNTANTS
-47- ROOSEVELT INDEPENDENT SCHOOL DISTRICT
NOTES TO FINANCIAL STATEMENTS
14. HEALTH INSURANCE During the year ended June 30, 2019, employees of the District were covered by a health insurance plan through TRS – Active Care Program administered by the Teacher Retirement System. The District contributed $225 of the employee-only premium per month and employees, at their option, authorized payroll withholdings to pay contributions for dependents. Under this plan, the District is not liable for costs incurred beyond the premiums paid. Additionally, payments made on behalf of the District by the state for Medicare, Part D fringe benefits and salaries amounted to $21,190 and $25,314 for the year ended June 30, 2019 and 2018, respectively.
15. SELF-INSURANCE – WORKMEN'S COMPENSATION The District participates in a public entity risk pool for its Workmen's Compensation Insurance needs.
Over 90 school districts participate in the pool administered by SchoolComp. The agreement between the District and the pool is renewable annually on September 1. The District's maximum loss under the agreement for 2019 was set at $20,335 excluding fixed costs of $20,120. The pool is protected against unanticipated catastrophic loss by stop loss coverage provided through Safety National Casualty Corporation. The stop loss policy covers individual claims in excess of $325,000. The District accounts for its costs associated with the pool through an internal service fund.
The claims administrator for the pool has estimated the District's share of unpaid claims as of June
30, 2019 to be $21,815.
16. LITIGATION
There is no litigation pending against the District which would have a material effect on the financial statements.
17. COMMITMENTS AND CONTINGENCIES
Federal and State Funding The District participates in numerous state and federal grant programs which are governed by various rules and regulations of the grantor agencies. Costs charged to the respective grant programs are subject to audit and adjustment by the grantor agencies; therefore, to the extent that the District has not complied with the rules and regulations governing the grants, refunds of any money received may be required and the collectability of any related receivable may be impaired. In the opinion of the District, there are no significant contingent liabilities relating to compliance with the rules and regulations governing the respective grants; therefore, no provision has been recorded in the accompanying combined financial statements for such contingencies.
Bolinger, Segars, Gilbert & Moss, L.L.p. CERTIFIED PUBLIC ACCOUNTANTS
-48- ROOSEVELT INDEPENDENT SCHOOL DISTRICT
NOTES TO FINANCIAL STATEMENTS
18. SUBSEQUENT EVENTS
The District's management has evaluated subsequent events though November 15, 2019, the date which the financial statements were available for issue.
Bolinger, Segars, Gilbert & Moss, L.L.p. CERTIFIED PUBLIC ACCOUNTANTS
REQUIRED SUPPLEMENTARY INFORMATION
EXHIBITS G-1 THROUGH G-5
Bolinger, Segars, Gilbert & Moss, L.L.p. CERTIFIED PUBLIC ACCOUNTANTS

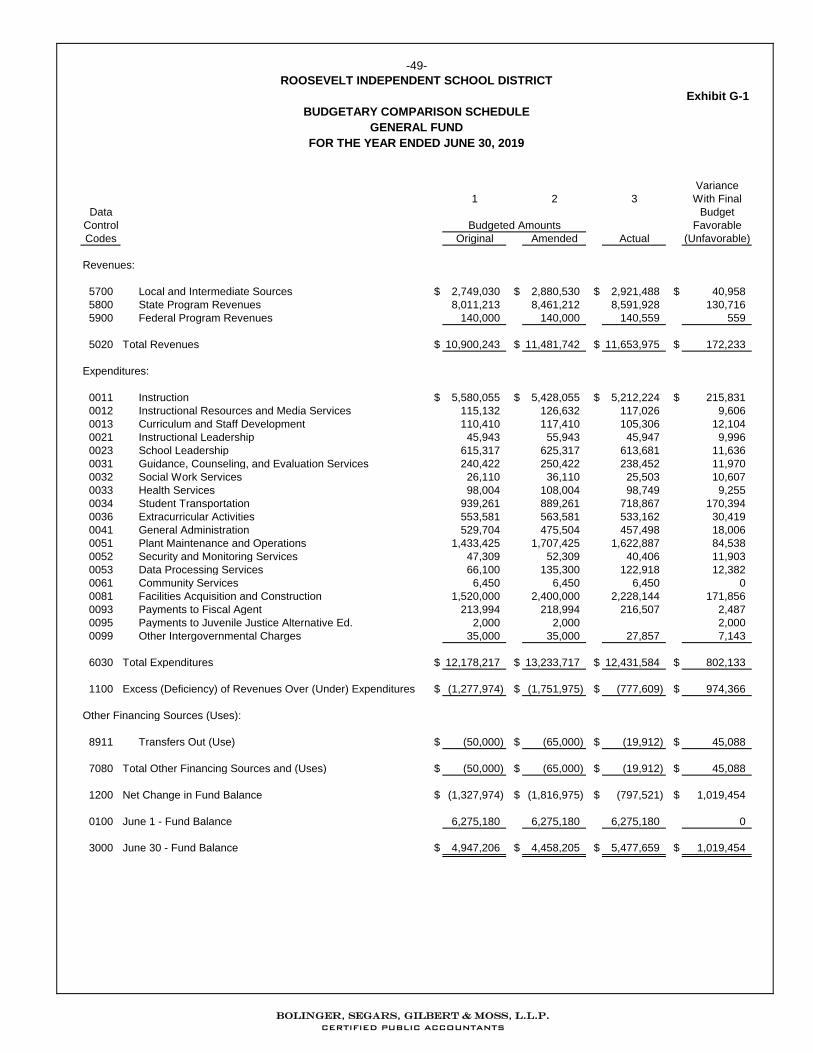
Exhibit G-1
Variance
1 2 3 With Final
Data Budget
Control Favorable
Codes Original Amended Actual (Unfavorable)
Revenues:
5700 Local and Intermediate Sources $ 2,749,030 $ 2,880,530 $ 2,921,488 $ 40,958
5800 State Program Revenues 8,011,213 8,461,212 8,591,928 130,716
5900 Federal Program Revenues 140,000 140,000 140,559 559
5020 Total Revenues $ 10,900,243 $ 11,481,742 $ 11,653,975 $ 172,233
Expenditures:
0011 Instruction $ 5,580,055 $ 5,428,055 $ 5,212,224 $ 215,831
0012 Instructional Resources and Media Services 115,132 126,632 117,026 9,606
0013 Curriculum and Staff Development 110,410 117,410 105,306 12,104
0021 Instructional Leadership 45,943 55,943 45,947 9,996
0023 School Leadership 615,317 625,317 613,681 11,636
0031 Guidance, Counseling, and Evaluation Services 240,422 250,422 238,452 11,970
0032 Social Work Services 26,110 36,110 25,503 10,607
0033 Health Services 98,004 108,004 98,749 9,255
0034 Student Transportation 939,261 889,261 718,867 170,394
0036 Extracurricular Activities 553,581 563,581 533,162 30,419
0041 General Administration 529,704 475,504 457,498 18,006
0051 Plant Maintenance and Operations 1,433,425 1,707,425 1,622,887 84,538
0052 Security and Monitoring Services 47,309 52,309 40,406 11,903
0053 Data Processing Services 66,100 135,300 122,918 12,382
0061 Community Services 6,450 6,450 6,450 0
0081 Facilities Acquisition and Construction 1,520,000 2,400,000 2,228,144 171,856
0093 Payments to Fiscal Agent 213,994 218,994 216,507 2,487
0095 Payments to Juvenile Justice Alternative Ed. 2,000 2,000 2,000
0099 Other Intergovernmental Charges 35,000 35,000 27,857 7,143
6030 Total Expenditures $ 12,178,217 $ 13,233,717 $ 12,431,584 $ 802,133
1100 Excess (Deficiency) of Revenues Over (Under) Expenditures $ (1,277,974) $ (1,751,975) $ (777,609) $ 974,366
Other Financing Sources (Uses):
8911 Transfers Out (Use) $ (50,000) $ (65,000) $ (19,912) $ 45,088
7080 Total Other Financing Sources and (Uses) $ (50,000) $ (65,000) $ (19,912) $ 45,088
1200 Net Change in Fund Balance $ (1,327,974) $ (1,816,975) $ (797,521) $ 1,019,454
0100 June 1 - Fund Balance 6,275,180 6,275,180 6,275,180 0
3000 June 30 - Fund Balance $ 4,947,206 $ 4,458,205 $ 5,477,659 $ 1,019,454
Budgeted Amounts
-49-
ROOSEVELT INDEPENDENT SCHOOL DISTRICT
BUDGETARY COMPARISON SCHEDULE
GENERAL FUND
FOR THE YEAR ENDED JUNE 30, 2019
Bolinger, Segars, Gilbert & Moss, L.L.p. CERTIFIED PUBLIC ACCOUNTANTS
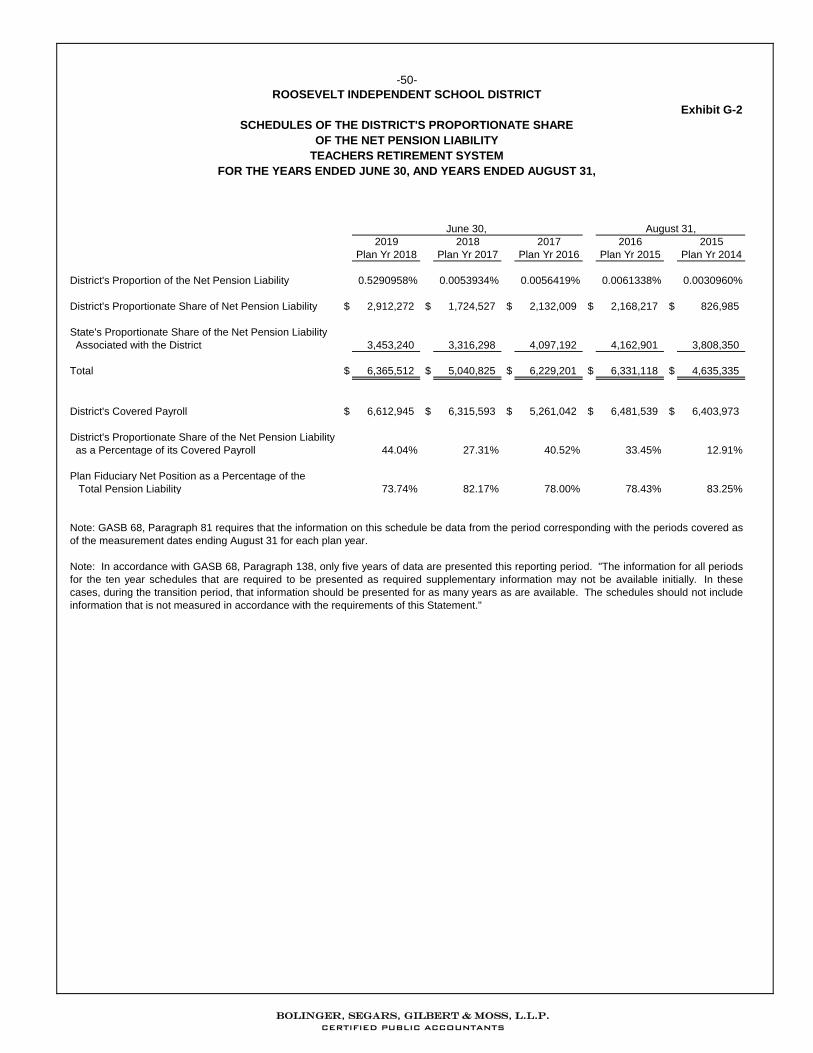
Exhibit G-2
2019 2018 2017 2016 2015
Plan Yr 2018 Plan Yr 2017 Plan Yr 2016 Plan Yr 2015 Plan Yr 2014
District's Proportion of the Net Pension Liability 0.5290958% 0.0053934% 0.0056419% 0.0061338% 0.0030960%
District's Proportionate Share of Net Pension Liability $ 2,912,272 $ 1,724,527 $ 2,132,009 $ 2,168,217 $ 826,985
State's Proportionate Share of the Net Pension Liability
Associated with the District 3,453,240 3,316,298 4,097,192 4,162,901 3,808,350
Total $ 6,365,512 $ 5,040,825 $ 6,229,201 $ 6,331,118 $ 4,635,335
District's Covered Payroll $ 6,612,945 $ 6,315,593 $ 5,261,042 $ 6,481,539 $ 6,403,973
District's Proportionate Share of the Net Pension Liability
as a Percentage of its Covered Payroll 44.04% 27.31% 40.52% 33.45% 12.91%
Plan Fiduciary Net Position as a Percentage of the
Total Pension Liability 73.74% 82.17% 78.00% 78.43% 83.25%
Note: In accordance with GASB 68, Paragraph 138, only five years of data are presented this reporting period. "The information for all periods
for the ten year schedules that are required to be presented as required supplementary information may not be available initially. In these
cases, during the transition period, that information should be presented for as many years as are available. The schedules should not include
information that is not measured in accordance with the requirements of this Statement."
August 31,
-50-
ROOSEVELT INDEPENDENT SCHOOL DISTRICT
SCHEDULES OF THE DISTRICT'S PROPORTIONATE SHARE
OF THE NET PENSION LIABILITY
TEACHERS RETIREMENT SYSTEM
FOR THE YEARS ENDED JUNE 30, AND YEARS ENDED AUGUST 31,
June 30,
Note: GASB 68, Paragraph 81 requires that the information on this schedule be data from the period corresponding with the periods covered as
of the measurement dates ending August 31 for each plan year.
Bolinger, Segars, Gilbert & Moss, L.L.p. CERTIFIED PUBLIC ACCOUNTANTS
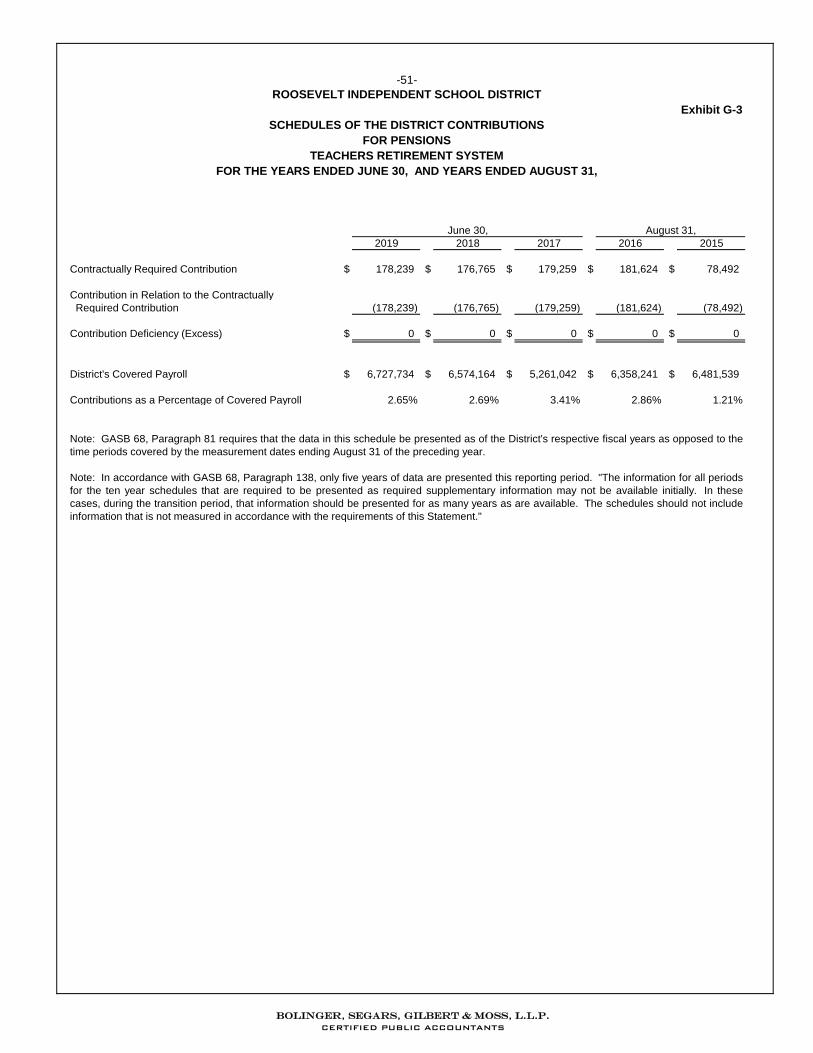
Exhibit G-3
June 30,
2019 2018 2017 2016 2015
Contractually Required Contribution $ 178,239 $ 176,765 $ 179,259 $ 181,624 $ 78,492
Contribution in Relation to the Contractually
Required Contribution (178,239) (176,765) (179,259) (181,624) (78,492)
Contribution Deficiency (Excess) $ 0 $ 0 $ 0 $ 0 $ 0
District's Covered Payroll $ 6,727,734 $ 6,574,164 $ 5,261,042 $ 6,358,241 $ 6,481,539
Contributions as a Percentage of Covered Payroll 2.65% 2.69% 3.41% 2.86% 1.21%
Note: In accordance with GASB 68, Paragraph 138, only five years of data are presented this reporting period. "The information for all periods
for the ten year schedules that are required to be presented as required supplementary information may not be available initially. In these
cases, during the transition period, that information should be presented for as many years as are available. The schedules should not include
information that is not measured in accordance with the requirements of this Statement."
August 31,
-51-
ROOSEVELT INDEPENDENT SCHOOL DISTRICT
SCHEDULES OF THE DISTRICT CONTRIBUTIONS
TEACHERS RETIREMENT SYSTEM
FOR THE YEARS ENDED JUNE 30, AND YEARS ENDED AUGUST 31,
FOR PENSIONS
Note: GASB 68, Paragraph 81 requires that the data in this schedule be presented as of the District's respective fiscal years as opposed to the
time periods covered by the measurement dates ending August 31 of the preceding year.
Bolinger, Segars, Gilbert & Moss, L.L.p. CERTIFIED PUBLIC ACCOUNTANTS
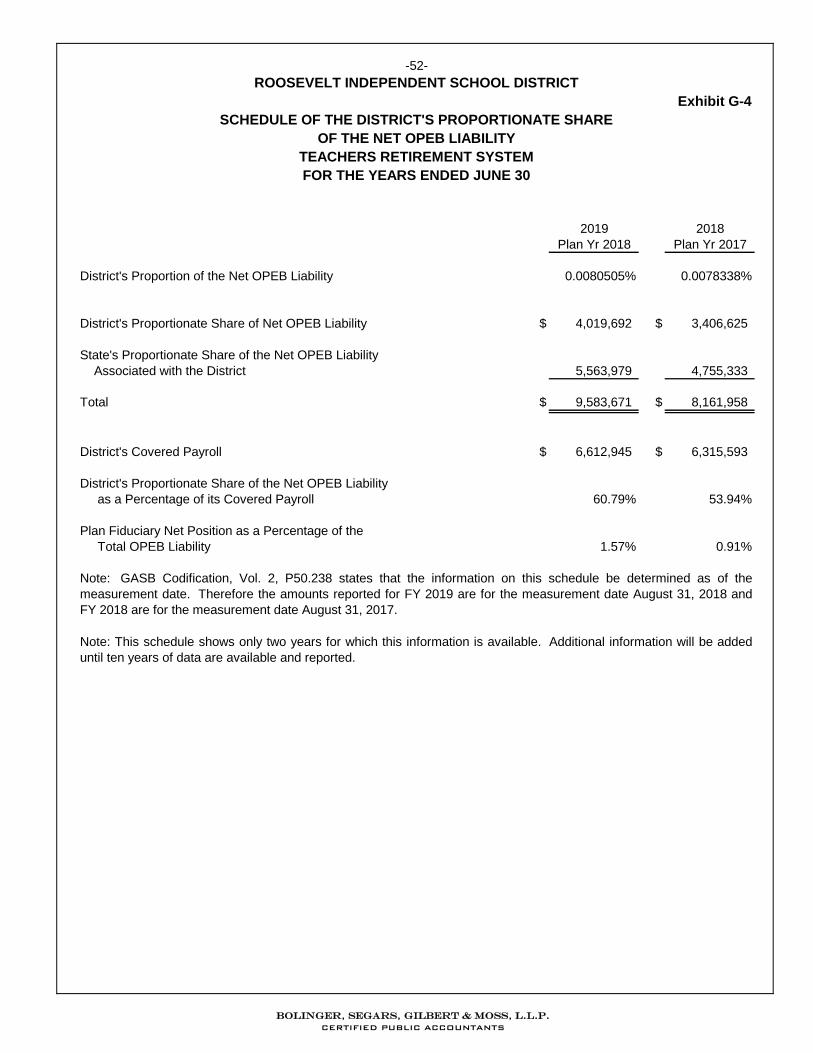
ROOSEVELT INDEPENDENT SCHOOL DISTRICT
Exhibit G-4
SCHEDULE OF THE DISTRICT'S PROPORTIONATE SHARE
OF THE NET OPEB LIABILITY
TEACHERS RETIREMENT SYSTEM
FOR THE YEARS ENDED JUNE 30
2019 2018
Plan Yr 2018 Plan Yr 2017
District's Proportion of the Net OPEB Liability 0.0080505% 0.0078338%
District's Proportionate Share of Net OPEB Liability $ 4,019,692 $ 3,406,625
State's Proportionate Share of the Net OPEB Liability
Associated with the District 5,563,979 4,755,333
Total $ 9,583,671 $ 8,161,958
District's Covered Payroll $ 6,612,945 $ 6,315,593
District's Proportionate Share of the Net OPEB Liability
as a Percentage of its Covered Payroll 60.79% 53.94%
Plan Fiduciary Net Position as a Percentage of the
Total OPEB Liability 1.57% 0.91%
Note: This schedule shows only two years for which this information is available. Additional information will be added
until ten years of data are available and reported.
-52-
Note: GASB Codification, Vol. 2, P50.238 states that the information on this schedule be determined as of the
measurement date. Therefore the amounts reported for FY 2019 are for the measurement date August 31, 2018 and
FY 2018 are for the measurement date August 31, 2017.
Bolinger, Segars, Gilbert & Moss, L.L.p. CERTIFIED PUBLIC ACCOUNTANTS
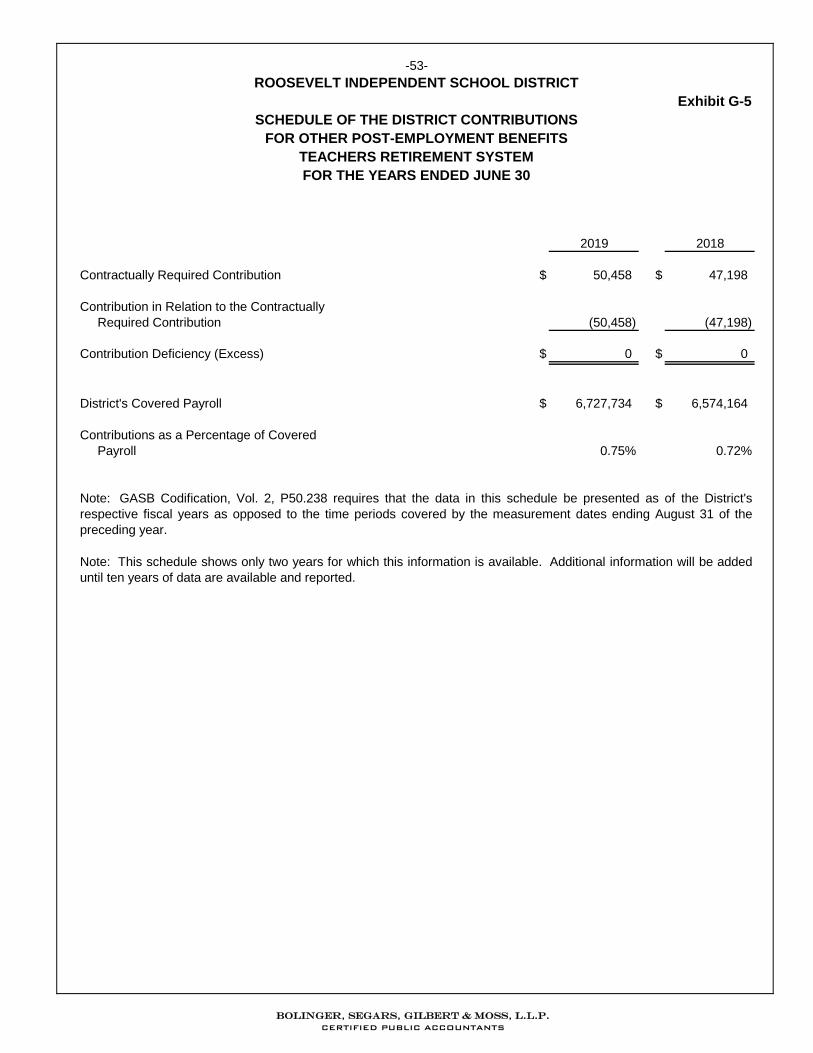
ROOSEVELT INDEPENDENT SCHOOL DISTRICT
Exhibit G-5
SCHEDULE OF THE DISTRICT CONTRIBUTIONS
FOR OTHER POST-EMPLOYMENT BENEFITS
TEACHERS RETIREMENT SYSTEM
FOR THE YEARS ENDED JUNE 30
2019 2018
Contractually Required Contribution $ 50,458 $ 47,198
Contribution in Relation to the Contractually
Required Contribution (50,458) (47,198)
Contribution Deficiency (Excess) $ 0 $ 0
District's Covered Payroll $ 6,727,734 $ 6,574,164
Contributions as a Percentage of Covered
Payroll 0.75% 0.72%
Note: This schedule shows only two years for which this information is available. Additional information will be added
until ten years of data are available and reported.
-53-
Note: GASB Codification, Vol. 2, P50.238 requires that the data in this schedule be presented as of the District's
respective fiscal years as opposed to the time periods covered by the measurement dates ending August 31 of the
preceding year.
Bolinger, Segars, Gilbert & Moss, L.L.p. CERTIFIED PUBLIC ACCOUNTANTS
-54- ROOSEVELT INDEPENDENT SCHOOL DISTRICT
NOTES TO REQUIRED SUPPLEMENTARY INFORMATION
A. NOTES TO SCHEDULES FOR THE TRS PENSION Changes of Benefit Terms There were no changes of benefit terms that affected measurement of the total pension liability during the measurement period. Changes of Assumptions Assumptions, methods, and plan changes which are specific to the Pension Trust Fund were updated from the prior year’s report. The Net Pension Liability increased significantly since the prior measurement date due to a change in the following actuarial assumptions:
The total pension liability as of August 31, 2018 was developed using a roll-forward method from the August 31, 2017 valuation.
Demographic assumptions including post-retirement mortality, termination rates, and rates of retirement were updated based on the experience study performed for TRS for the period ending August 31, 2017.
Economic assumptions including rates of salary increase for individual participants were updated based on the same experience study.
The discount rate changed from 8.00% as of August 31, 2017 to 6.907% as of August 31, 2018.
The long-term assumed rate of return changed from 8.00% to 7.25%. The change in the long-term assumed rate of return combined with the change in the
single discount rate was the primary reason for the increase in the net pension liability.
B. NOTES TO SCHEDULES FOR THE TRS OPEB PLAN Changes of Benefit Terms The 85th Legislature, Regular Session passed the following statutory changes which became effective on September 1, 2017:
Created a high-deductible health plan that provides a zero cost for generic prescriptions for certain preventative drugs and provides a zero premium for disability retirees who retired as a disability retiree on or before January 1, 2017 and are not eligible to enroll in Medicare.
Created a single Medicare Advantage Plan and Medicare prescription drug plan for all Medicare—eligible participants.
Allowed the System to provide other, appropriate health benefit plans to address the needs of enrollees eligible for Medicare.
Allowed eligible retirees and their eligible dependents to enroll in TRS-Care when the retiree reaches 65 years of age, rather than waiting for the next enrollment period.
Eliminated free coverage under TRS-Care, except for certain disability retirees enrolled during the Plan Years 2018 through 2021, requiring members to contribute $200 per month toward their health insurance premiums.
Bolinger, Segars, Gilbert & Moss, L.L.p. CERTIFIED PUBLIC ACCOUNTANTS
-55- ROOSEVELT INDEPENDENT SCHOOL DISTRICT
NOTES TO REQUIRED SUPPLEMENTARY INFORMATION
Changes of Assumptions The following were changes to the actuarial assumptions or other inputs that affected measurement of the total OPEB liability since the prior measurement period:
Adjustments were made for retirees that were known to have discontinued their health care coverage in fiscal year 2018. This change increased the Total OPEB Liability.
The health care trend rate assumption was updated to reflect the anticipated return of the Health Insurer Fee (HIF) in 2020. This change increased the Total OPEB Liability.
Demographic and economic assumptions were updated based on the experience study performed for TRS for the period ending August 31, 2017. This change increased the Total OPEB Liability.
The discount rate changed from 3.42% as of August 31, 2017 to 3.69% as of August 31, 2018. This changed lowered the Total OPEB Liability by $2.3 billion.
In this valuation, the impact of the Cadillac Tax has been calculated as a portion of the trend assumption. Assumptions and methods used to determine the impact of the Cadillac Tax include:
2018 thresholds of $850/$2,292 were indexed annually by 2.50%. Premium data submitted was not adjusted for permissible exclusions to the Cadillac Tax. There were no special adjustments to the dollar limit other than those permissible for non-
Medicare retirees over 55.
Results indicate that the value of the excise tax would be reasonably represented by a 25 basis point addition to the long-term trend rate assumption.
Bolinger, Segars, Gilbert & Moss, L.L.p. CERTIFIED PUBLIC ACCOUNTANTS

OTHER SUPPLEMENTARY INFORMATION
EXHIBITS H-1 THROUGH J-3
Bolinger, Segars, Gilbert & Moss, L.L.p. CERTIFIED PUBLIC ACCOUNTANTS

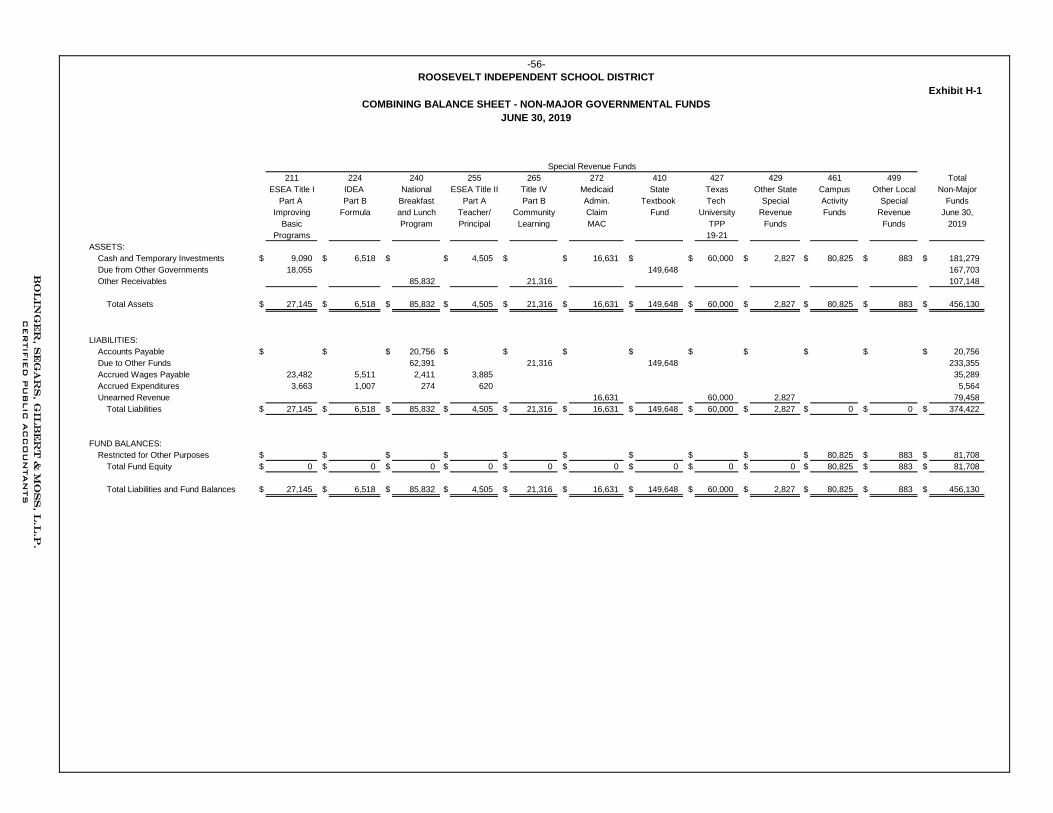
ROOSEVELT INDEPENDENT SCHOOL DISTRICT
Exhibit H-1
COMBINING BALANCE SHEET - NON-MAJOR GOVERNMENTAL FUNDS
JUNE 30, 2019
211 224 240 255 265 272 410 427 429 461 499 Total
ESEA Title I IDEA National ESEA Title II Title IV Medicaid State Texas Other State Campus Other Local Non-Major
Part A Part B Breakfast Part A Part B Admin. Textbook Tech Special Activity Special Funds
Improving Formula and Lunch Teacher/ Community Claim Fund University Revenue Funds Revenue June 30,
Basic Program Principal Learning MAC TPP Funds Funds 2019
Programs 19-21
ASSETS:
Cash and Temporary Investments $ 9,090 $ 6,518 $ $ 4,505 $ $ 16,631 $ $ 60,000 $ 2,827 $ 80,825 $ 883 $ 181,279
Due from Other Governments 18,055 149,648 167,703
Other Receivables 85,832 21,316 107,148
Total Assets $ 27,145 $ 6,518 $ 85,832 $ 4,505 $ 21,316 $ 16,631 $ 149,648 $ 60,000 $ 2,827 $ 80,825 $ 883 $ 456,130
LIABILITIES:
Accounts Payable $ $ $ 20,756 $ $ $ $ $ $ $ $ $ 20,756
Due to Other Funds 62,391 21,316 149,648 233,355
Accrued Wages Payable 23,482 5,511 2,411 3,885 35,289
Accrued Expenditures 3,663 1,007 274 620 5,564
Unearned Revenue 16,631 60,000 2,827 79,458
Total Liabilities $ 27,145 $ 6,518 $ 85,832 $ 4,505 $ 21,316 $ 16,631 $ 149,648 $ 60,000 $ 2,827 $ 0 $ 0 $ 374,422
FUND BALANCES:
Restricted for Other Purposes $ $ $ $ $ $ $ $ $ $ 80,825 $ 883 $ 81,708
Total Fund Equity $ 0 $ 0 $ 0 $ 0 $ 0 $ 0 $ 0 $ 0 $ 0 $ 80,825 $ 883 $ 81,708
Total Liabilities and Fund Balances $ 27,145 $ 6,518 $ 85,832 $ 4,505 $ 21,316 $ 16,631 $ 149,648 $ 60,000 $ 2,827 $ 80,825 $ 883 $ 456,130
-56-
Special Revenue Funds
Bo
lin
ge
r, S
eg
ar
s, G
ilb
er
t &
Mo
ss
, L.L
.p.
CER
TIF
IED
PU
BLIC
AC
CO
UN
TAN
TS
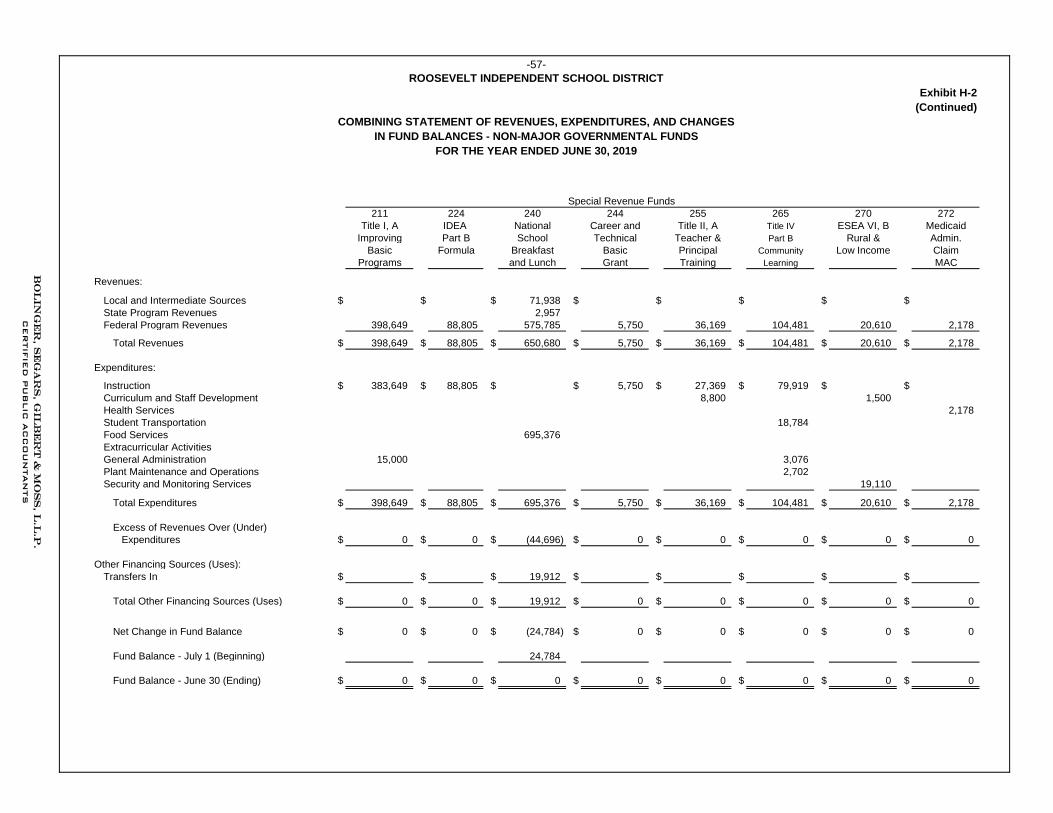
ROOSEVELT INDEPENDENT SCHOOL DISTRICT
Exhibit H-2
(Continued)
COMBINING STATEMENT OF REVENUES, EXPENDITURES, AND CHANGES
IN FUND BALANCES - NON-MAJOR GOVERNMENTAL FUNDS
FOR THE YEAR ENDED JUNE 30, 2019
Special Revenue Funds
211 224 240 244 255 265 270 272
Title I, A IDEA National Career and Title II, A Title IV ESEA VI, B Medicaid
Improving Part B School Technical Teacher & Part B Rural & Admin.
Basic Formula Breakfast Basic Principal Community Low Income Claim
Programs and Lunch Grant Training Learning MAC
Revenues:
Local and Intermediate Sources $ $ $ 71,938 $ $ $ $ $
State Program Revenues 2,957
Federal Program Revenues 398,649 88,805 575,785 5,750 36,169 104,481 20,610 2,178
Total Revenues $ 398,649 $ 88,805 $ 650,680 $ 5,750 $ 36,169 $ 104,481 $ 20,610 $ 2,178
Expenditures:
Instruction $ 383,649 $ 88,805 $ $ 5,750 $ 27,369 $ 79,919 $ $
Curriculum and Staff Development 8,800 1,500
Health Services 2,178
Student Transportation 18,784
Food Services 695,376
Extracurricular Activities
General Administration 15,000 3,076
Plant Maintenance and Operations 2,702
Security and Monitoring Services 19,110
Total Expenditures $ 398,649 $ 88,805 $ 695,376 $ 5,750 $ 36,169 $ 104,481 $ 20,610 $ 2,178
Excess of Revenues Over (Under)
Expenditures $ 0 $ 0 $ (44,696) $ 0 $ 0 $ 0 $ 0 $ 0
Other Financing Sources (Uses):
Transfers In $ $ $ 19,912 $ $ $ $ $
Total Other Financing Sources (Uses) $ 0 $ 0 $ 19,912 $ 0 $ 0 $ 0 $ 0 $ 0
Net Change in Fund Balance $ 0 $ 0 $ (24,784) $ 0 $ 0 $ 0 $ 0 $ 0
Fund Balance - July 1 (Beginning) 24,784
Fund Balance - June 30 (Ending) $ 0 $ 0 $ 0 $ 0 $ 0 $ 0 $ 0 $ 0
-57-
Bo
lin
ge
r, S
eg
ar
s, G
ilb
er
t &
Mo
ss
, L.L
.p.
CER
TIF
IED
PU
BLIC
AC
CO
UN
TAN
TS
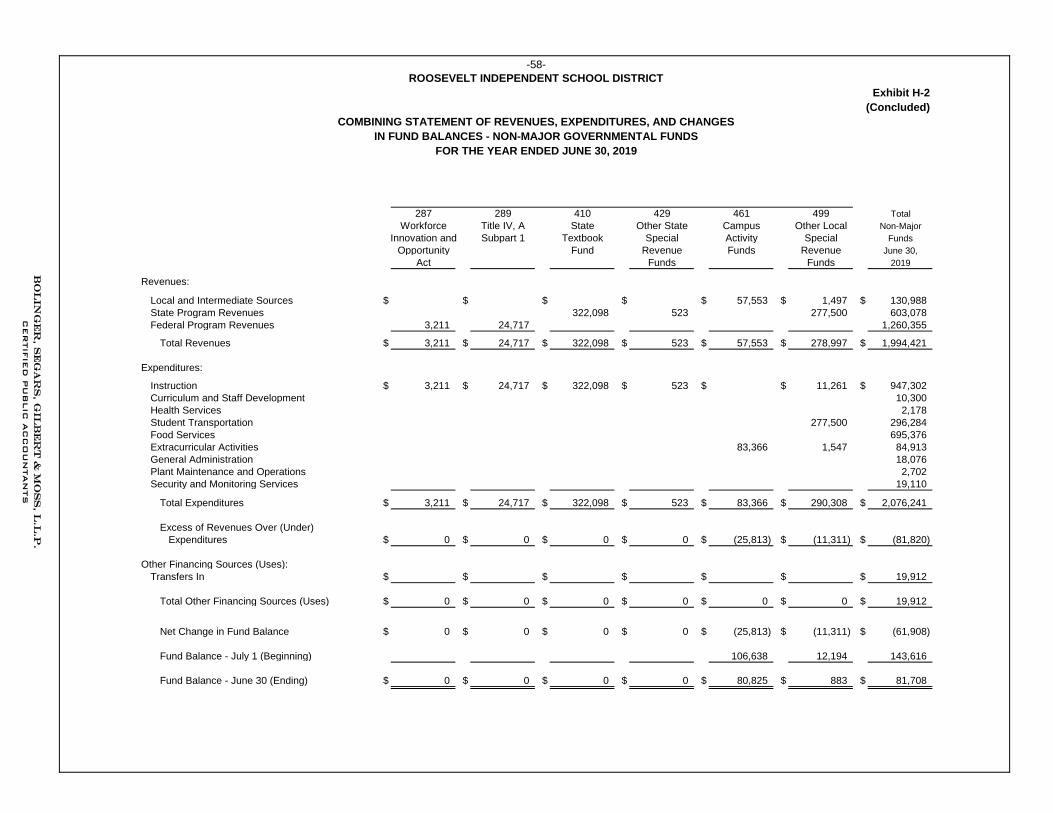
Exhibit H-2
(Concluded)
287 289 410 429 461 499 Total
Workforce Title IV, A State Other State Campus Other Local Non-Major
Innovation and Subpart 1 Textbook Special Activity Special Funds
Opportunity Fund Revenue Funds Revenue June 30,
Act Funds Funds 2019
Revenues:
Local and Intermediate Sources $ $ $ $ $ 57,553 $ 1,497 $ 130,988
State Program Revenues 322,098 523 277,500 603,078
Federal Program Revenues 3,211 24,717 1,260,355
Total Revenues $ 3,211 $ 24,717 $ 322,098 $ 523 $ 57,553 $ 278,997 $ 1,994,421
Expenditures:
Instruction $ 3,211 $ 24,717 $ 322,098 $ 523 $ $ 11,261 $ 947,302
Curriculum and Staff Development 10,300
Health Services 2,178
Student Transportation 277,500 296,284
Food Services 695,376
Extracurricular Activities 83,366 1,547 84,913
General Administration 18,076
Plant Maintenance and Operations 2,702
Security and Monitoring Services 19,110
Total Expenditures $ 3,211 $ 24,717 $ 322,098 $ 523 $ 83,366 $ 290,308 $ 2,076,241
Excess of Revenues Over (Under)
Expenditures $ 0 $ 0 $ 0 $ 0 $ (25,813) $ (11,311) $ (81,820)
Other Financing Sources (Uses):
Transfers In $ $ $ $ $ $ $ 19,912
Total Other Financing Sources (Uses) $ 0 $ 0 $ 0 $ 0 $ 0 $ 0 $ 19,912
Net Change in Fund Balance $ 0 $ 0 $ 0 $ 0 $ (25,813) $ (11,311) $ (61,908)
Fund Balance - July 1 (Beginning) 106,638 12,194 143,616
Fund Balance - June 30 (Ending) $ 0 $ 0 $ 0 $ 0 $ 80,825 $ 883 $ 81,708
-58-
ROOSEVELT INDEPENDENT SCHOOL DISTRICT
COMBINING STATEMENT OF REVENUES, EXPENDITURES, AND CHANGES
IN FUND BALANCES - NON-MAJOR GOVERNMENTAL FUNDS
FOR THE YEAR ENDED JUNE 30, 2019
Bo
lin
ge
r, S
eg
ar
s, G
ilb
er
t &
Mo
ss
, L.L
.p.
CER
TIF
IED
PU
BLIC
AC
CO
UN
TAN
TS
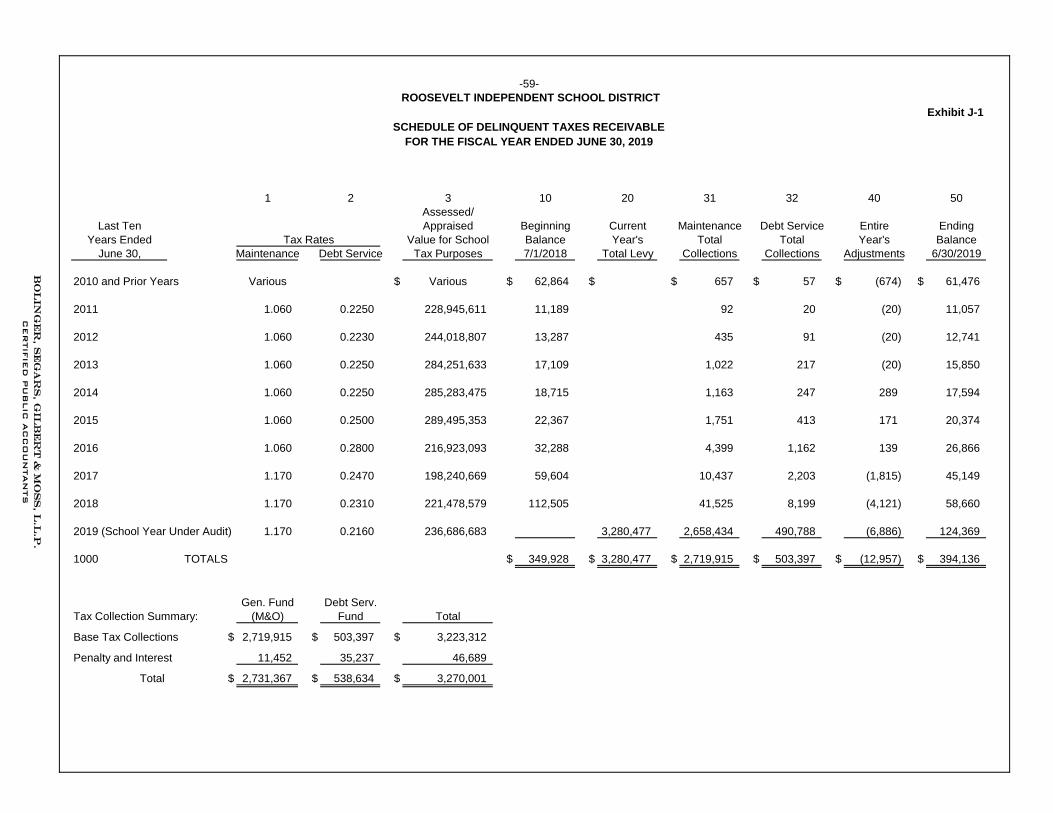
ROOSEVELT INDEPENDENT SCHOOL DISTRICT
Exhibit J-1
SCHEDULE OF DELINQUENT TAXES RECEIVABLE
FOR THE FISCAL YEAR ENDED JUNE 30, 2019
1 2 3 10 20 31 32 40 50
Assessed/
Last Ten Appraised Beginning Current Maintenance Debt Service Entire Ending
Years Ended Tax Rates Value for School Balance Year's Total Total Year's Balance
June 30, Maintenance Debt Service Tax Purposes 7/1/2018 Total Levy Collections Collections Adjustments 6/30/2019
2010 and Prior Years Various $ Various $ 62,864 $ $ 657 $ 57 $ (674) $ 61,476
2011 1.060 0.2250 228,945,611 11,189 92 20 (20) 11,057
2012 1.060 0.2230 244,018,807 13,287 435 91 (20) 12,741
2013 1.060 0.2250 284,251,633 17,109 1,022 217 (20) 15,850
2014 1.060 0.2250 285,283,475 18,715 1,163 247 289 17,594
2015 1.060 0.2500 289,495,353 22,367 1,751 413 171 20,374
2016 1.060 0.2800 216,923,093 32,288 4,399 1,162 139 26,866
2017 1.170 0.2470 198,240,669 59,604 10,437 2,203 (1,815) 45,149
2018 1.170 0.2310 221,478,579 112,505 41,525 8,199 (4,121) 58,660
2019 (School Year Under Audit) 1.170 0.2160 236,686,683 3,280,477 2,658,434 490,788 (6,886) 124,369
1000 TOTALS $ 349,928 $ 3,280,477 $ 2,719,915 $ 503,397 $ (12,957) $ 394,136
Gen. Fund Debt Serv.
Tax Collection Summary: (M&O) Fund Total
Base Tax Collections $ 2,719,915 $ 503,397 $ 3,223,312
Penalty and Interest 11,452 35,237 46,689
Total $ 2,731,367 $ 538,634 $ 3,270,001
-59-
Bo
lin
ge
r, S
eg
ar
s, G
ilb
er
t &
Mo
ss
, L.L
.p.
CER
TIF
IED
PU
BLIC
AC
CO
UN
TAN
TS

ROOSEVELT INDEPENDENT SCHOOL DISTRICT
Exhibit J-2
BUDGETARY COMPARISON SCHEDULECHILD NUTRITION FUND
FOR THE YEAR ENDED JUNE 30, 2019
Variance
1 2 3 With Final
Data Budget
Control Favorable
Codes Original Amended Actual (Unfavorable)
Revenues:
5700 Local and Intermediate $ 76,542 $ 76,542 $ 71,938 $ (4,604)
5800 State Program Revenues 3,474 3,474 2,957 (517)
5900 Federal Program Revenues 592,516 592,516 575,785 (16,731)
5020 Total Revenues $ 672,532 $ 672,532 $ 650,680 $ (21,852)
Expenditures:
0035 Food Services $ 722,532 $ 722,532 $ 695,376 $ 27,156
6030 Total Expenditures $ 722,532 $ 722,532 $ 695,376 $ 27,156
1100 Excess of Revenues Over
Expenditures $ (50,000) $ (50,000) $ (44,696) $ 5,304
Other Financing Sources (Uses):
7915 Transfers In $ 50,000 $ 65,000 $ 19,912 $ (45,088)
7080 Total Other Financing Sources and (Uses) $ 50,000 $ 65,000 $ 19,912 $ (45,088)
1200 Net Change in Fund Balance $ 0 $ 15,000 $ (24,784) $ (39,784)
0100 July 1 - Fund Balance 24,784 24,784 24,784 0
3000 June 30 - Fund Balance $ 24,784 $ 39,784 $ 0 $ (39,784)
Budgeted Amounts
-60-
Bolinger, Segars, Gilbert & Moss, L.L.p. CERTIFIED PUBLIC ACCOUNTANTS
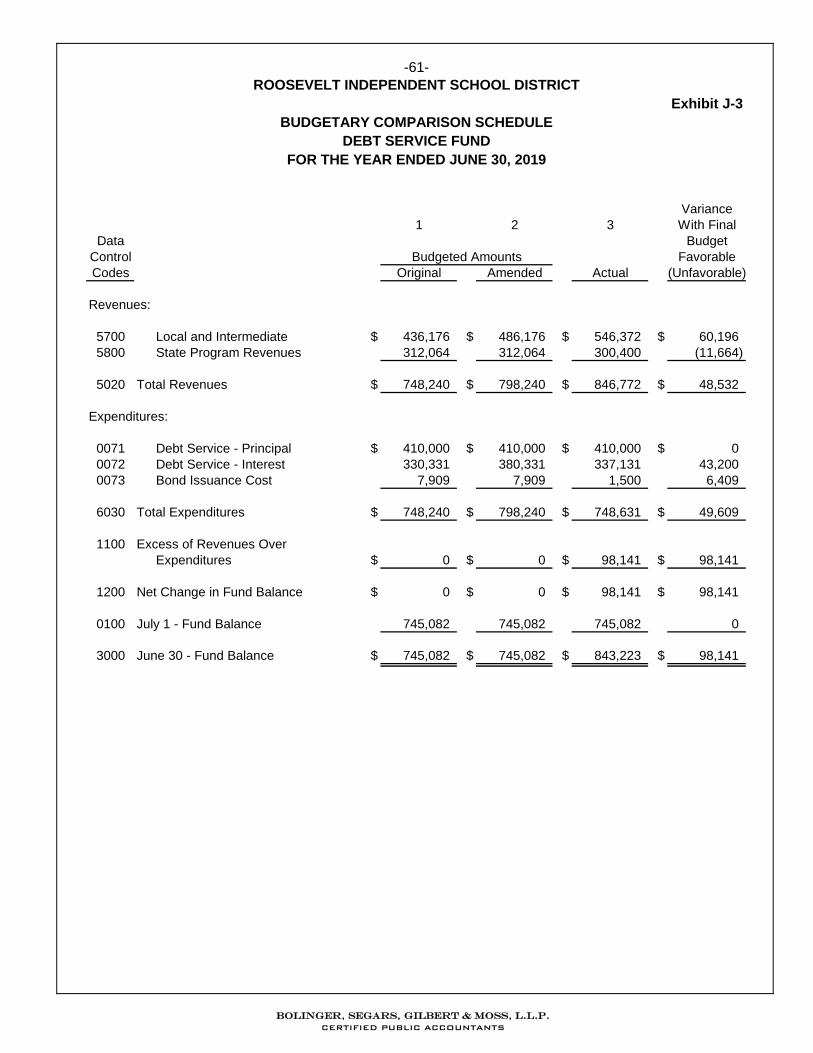
ROOSEVELT INDEPENDENT SCHOOL DISTRICT
Exhibit J-3
BUDGETARY COMPARISON SCHEDULE
DEBT SERVICE FUND
FOR THE YEAR ENDED JUNE 30, 2019
Variance
1 2 3 With Final
Data Budget
Control Favorable
Codes Original Amended Actual (Unfavorable)
Revenues:
5700 Local and Intermediate $ 436,176 $ 486,176 $ 546,372 $ 60,196
5800 State Program Revenues 312,064 312,064 300,400 (11,664)
5020 Total Revenues $ 748,240 $ 798,240 $ 846,772 $ 48,532
Expenditures:
0071 Debt Service - Principal $ 410,000 $ 410,000 $ 410,000 $ 0
0072 Debt Service - Interest 330,331 380,331 337,131 43,200
0073 Bond Issuance Cost 7,909 7,909 1,500 6,409
6030 Total Expenditures $ 748,240 $ 798,240 $ 748,631 $ 49,609
1100 Excess of Revenues Over
Expenditures $ 0 $ 0 $ 98,141 $ 98,141
1200 Net Change in Fund Balance $ 0 $ 0 $ 98,141 $ 98,141
0100 July 1 - Fund Balance 745,082 745,082 745,082 0
3000 June 30 - Fund Balance $ 745,082 $ 745,082 $ 843,223 $ 98,141
Budgeted Amounts
-61-
Bolinger, Segars, Gilbert & Moss, L.L.p. CERTIFIED PUBLIC ACCOUNTANTS
OVERALL COMPLIANCE AND INTERNAL CONTROL SECTION
Bolinger, Segars, Gilbert & Moss, L.L.p. CERTIFIED PUBLIC ACCOUNTANTS

BOLINGER, SEGARS, GILBERT & MOSS, L.L.P. c e r t i f i e d p u b l i c a c c o u n t a n t s
PHONE: (806) 747-3806
FAX: (806) 747-3815
8215 Nashville Avenue
LUBBOCK, TEXAS 79423-1954
REPORT ON INTERNAL CONTROL OVER FINANCIAL REPORTING AND ON COMPLIANCE AND OTHER MATTERS BASED ON AN AUDIT OF THE FINANCIAL STATEMENTS
PERFORMED IN ACCORDANCE WITH GOVERNMENT AUDITING STANDARDS
Independent Auditor’s Report Board of School Trustees Roosevelt Independent School District Lubbock, Texas We have audited, in accordance with the auditing standards generally accepted in the Unites States of America and the standards applicable to financial audits contained in Government Auditing Standards issued by the Comptroller General of the United States, the financial statements of the governmental activities, each major fund, and the aggregate remaining fund information of Roosevelt Independent School District as of and for the year ended June 30, 2019, and related notes to the financial statements, which collectively comprise Roosevelt Independent School District’s basic financial statements and have issued our report thereon dated November 15, 2019. Internal Control Over Financial Reporting In planning and performing our audit of the financial statements, we considered Roosevelt Independent School District’s internal control over financial reporting (internal control) to determine the audit procedures that are appropriate in the circumstances for the purpose of expressing our opinions on the financial statements, but not for the purpose of expressing our opinions on the effectiveness of Roosevelt Independent School District’s internal control. Accordingly, we do not express an opinion on the effectiveness of Roosevelt Independent School District’s internal control. A deficiency in internal control exists when the design or operation of a control does not allow management or employees, in the normal course of performing their assigned functions, to prevent or detect and correct misstatements on a timely basis. A material weakness is a deficiency, or a combination of deficiencies, in internal control such that there is a reasonable possibility that a material misstatement of the entity’s financial statements will not be prevented, or detected and corrected on a timely basis. A significant deficiency is a deficiency, or a combination of deficiencies, in internal control that is less severe than a material weakness, yet important enough to merit attention by those charged with governance. Our consideration of internal control was for the limited purpose described in the first paragraph of this section and was not designed to identify all deficiencies in internal control that might be material weaknesses or significant deficiencies. Given these limitations, during our audit we did not identify any deficiencies in internal control over financial reporting that we consider to be material weaknesses. However material weaknesses may exist that have not been identified.
-62-
Bolinger, Segars, Gilbert & Moss, L.L.p. CERTIFIED PUBLIC ACCOUNTANTS
-63- Compliance and Other Matters As part of obtaining reasonable assurance about whether Roosevelt Independent School District’s financial statements are free of material misstatement, we performed tests of its compliance with certain provisions of laws, regulations, contracts, and grant agreements, noncompliance with which could have a direct and material effect on the determination of financial statement amounts. However, providing an opinion on compliance with those provisions was not an objective of our audit and accordingly, we do not express such an opinion. The results of our tests disclosed no instances of noncompliance or other matters that are required to be reported under Government Auditing Standards. Purpose of this Report The purpose of this report is solely to describe the scope of our testing of internal control and compliance and the results of that testing, and not to provide an opinion on the effectiveness of the entity’s internal control or on compliance. This report is an integral part of an audit performed in accordance with Government Auditing Standards in considering the entity’s internal control and compliance. Accordingly, this communication is not suitable for any other purpose.
Certified Public Accountants Lubbock, Texas
November 15, 2019
Bolinger, Segars, Gilbert & Moss, L.L.p. CERTIFIED PUBLIC ACCOUNTANTS
BOLINGER, SEGARS, GILBERT & MOSS, L.L.P. c e r t i f i e d p u b l i c a c c o u n t a n t s
PHONE: (806) 747-3806
FAX: (806) 747-3815
8215 Nashville Avenue
LUBBOCK, TEXAS 79423-1954
REPORT ON COMPLIANCE FOR EACH MAJOR FEDERAL PROGRAM AND REPORT ON INTERNAL CONTROL OVER COMPLIANCE REQUIRED BY UNIFORM GUIDANCE
Independent Auditor’s Report Board of School Trustees Roosevelt Independent School District Lubbock, Texas Report on Compliance for Each Major Federal Program We have audited Roosevelt Independent School District’s compliance with the types of compliance requirements described in the Compliance Supplement that could have a direct and material effect on each of the District’s major federal programs for the year ended June 30, 2019. Roosevelt Independent School District’s major federal programs are identified in the summary of auditor’s results section of the accompanying schedule of findings and questioned costs. Management’s Responsibility
Management is responsible for compliance with federal statutes, regulations, and the terms and conditions of its federal awards applicable to its federal programs. Auditor’s Responsibility
Our responsibility is to express an opinion on compliance for each of Roosevelt Independent School District’s major federal programs based on our audit of the types of compliance requirements referred to above. We conducted our audit of compliance in accordance with auditing standards generally accepted in the United States of America; the standards applicable to financial audits contained in Government Auditing Standards, issued by the Comptroller General of the United States; and the audit requirements of Title 2 U.S. Code of Federal Regulations Part 200, Uniform Administrative Requirements, Cost Principles, and Audit Requirements for Federal Awards (Uniform Guidance). Those standards and the Uniform Guidance require that we plan and perform the audit to obtain reasonable assurance about whether noncompliance with the types of compliance requirements referred to above that could have a direct and material effect on a major federal program occurred. An audit includes examining, on a test basis, evidence about the District’s compliance with those requirements and performing such other procedures as we considered necessary in the circumstances.
We believe that our audit provides a reasonable basis for our opinion on compliance for each major federal program. However, our audit does not provide a legal determination on Roosevelt Independent School District’s compliance with those requirements.
-64-
Bolinger, Segars, Gilbert & Moss, L.L.p. CERTIFIED PUBLIC ACCOUNTANTS
-65- Opinion on Each Major Federal Program
In our opinion, the Roosevelt Independent School District complied, in all material respects, with the compliance requirements referred to above that could have a direct and material effect on each of its major federal programs for the year ended June 30, 2019. Report on Internal Control Over Compliance Management of Roosevelt Independent School District is responsible for establishing and maintaining effective internal control over compliance with the types of compliance requirements referred to above. In planning and performing our audit of compliance, we considered the District’s internal control over compliance with the types of requirements that could have a direct and material effect on each major federal program to determine the auditing procedures that are appropriate in the circumstances for the purpose of expressing an opinion on compliance for each major federal program and to test and report on internal control over compliance in accordance with Uniform Guidance, but not for the purpose of expressing an opinion on the effectiveness of internal control over compliance. Accordingly, we do not express an opinion on the effectiveness of the District’s internal control over compliance. A deficiency in internal control over compliance exists when the design or operation of a control over compliance does not allow management or employees, in the normal course of performing their assigned functions, to prevent, or detect and correct, noncompliance with a type of compliance requirement of a federal program on a timely basis. A material weakness in internal control over compliance is a deficiency, or combination of deficiencies, in internal control over compliance, such that there is a reasonable possibility that material noncompliance with a type of compliance requirement of a federal program will not be prevented, or detected and corrected, on a timely basis. A significant deficiency in internal control over compliance is a deficiency, or a combination of deficiencies, in internal control over compliance with a type of compliance requirement of a federal program that is less severe than a material weakness in internal control over compliance, yet important enough to merit attention by those charged with governance. Our consideration of the internal control over compliance was for the limited purpose described in the first paragraph of this section and would not necessarily identify all deficiencies in internal control over compliance that might be deficiencies, significant deficiencies or material weaknesses. We did not identify any deficiencies in internal control over compliance that we consider to be material weaknesses. However, material weaknesses may exist that have not been identified. Purpose of this Report The purpose of this report on internal control over compliance is solely to describe the scope of our testing of internal control over compliance and the results of that testing based on the requirements of Uniform Guidance. Accordingly, this report is not suitable for any other purpose.
Certified Public Accountants Lubbock, Texas
November 15, 2019
Bolinger, Segars, Gilbert & Moss, L.L.p. CERTIFIED PUBLIC ACCOUNTANTS
FEDERAL FINANCIAL ASSISTANCE SECTION
Bolinger, Segars, Gilbert & Moss, L.L.p. CERTIFIED PUBLIC ACCOUNTANTS


ROOSEVELT INDEPENDENT SCHOOL DISTRICT
SCHEDULE OF FINDINGS AND QUESTIONED COSTS
FOR THE YEAR ENDED JUNE 30, 2019
A. Section I - Summary of Auditor's Results
1. Financial Statements
Type of auditor's report issued Unmodified
Internal control over financial reporting:
Material weakness(es) identified? yes X no
Significant deficiencies identified that are
not considered to be material weaknesses? yes X none reported
Noncompliance material to financial statements noted? yes X no
2. Federal Awards
Internal control over major programs:
Material weakness(es) identified? yes X no
Significant deficiency identified that are
not considered to be material weaknesses? yes X none reported
Type of auditor's report issued on compliance for major programs Unmodified
Any audit findings disclosed that are required to be
reported in accordance with 2 CFR 200.516(a)? yes X no
Identification of major programs:
CFDA Number(s) Name of Federal Program or Cluster
10.553 School Breakfast Program (SBP) - Child Nutrition Cluster
10.555 National School Lunch Program (NSLP) - Child Nutrition Cluster
Dollar threshold used to distinguish between
type A and type B programs: $
Auditee qualified as low-risk auditee? X yes no
B. Section II - Findings Related to the Financial Statements
The audit disclosed no findings required to be reported.
C. Section III - Findings and Questioned Costs Related to the Federal Awards
The audit disclosed no findings required to be reported.
750,000
-66-
Bolinger, Segars, Gilbert & Moss, L.L.p. CERTIFIED PUBLIC ACCOUNTANTS
-67- ROOSEVELT INDEPENDENT SCHOOL DISTRICT
SCHEDULE OF STATUS OF PRIOR YEAR FINDINGS
FOR THE YEAR ENDED JUNE 30, 2019 Prior Year’s Finding/Noncompliance N/A Status of Prior Year’s Finding/Noncompliance N/A
Bolinger, Segars, Gilbert & Moss, L.L.p. CERTIFIED PUBLIC ACCOUNTANTS
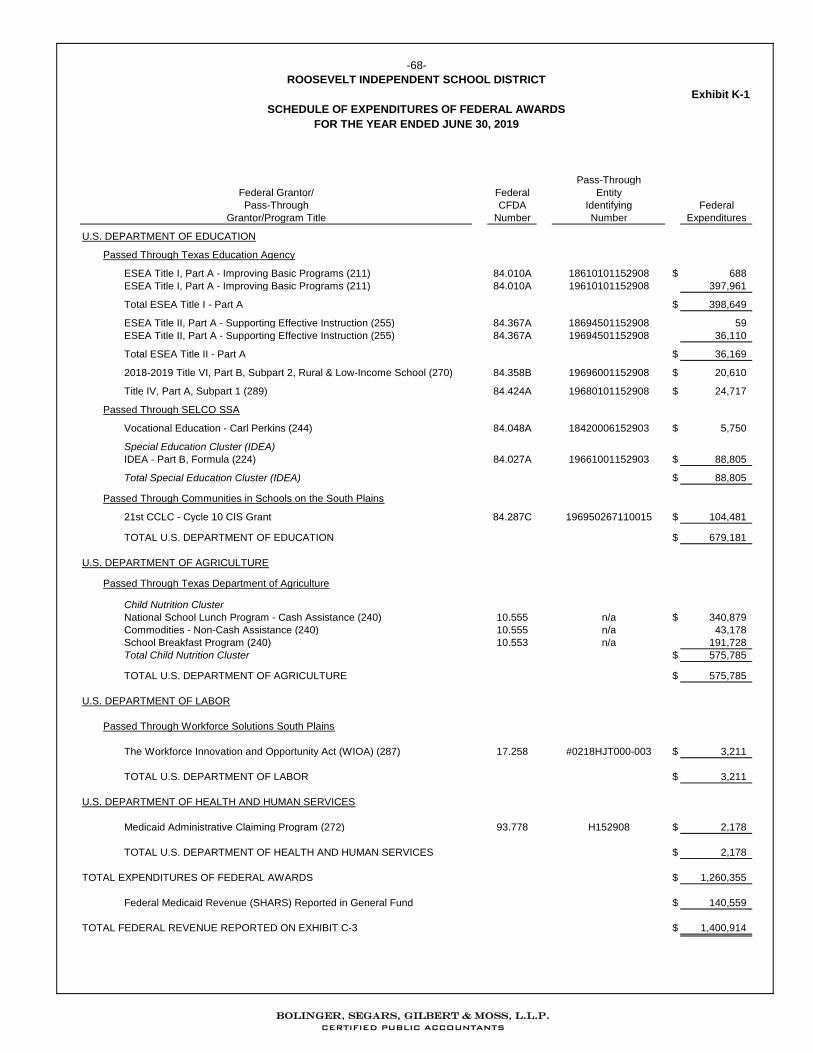
ROOSEVELT INDEPENDENT SCHOOL DISTRICT
Exhibit K-1
SCHEDULE OF EXPENDITURES OF FEDERAL AWARDS
FOR THE YEAR ENDED JUNE 30, 2019
Pass-Through
Federal Grantor/ Federal Entity
Pass-Through CFDA Identifying Federal
Grantor/Program Title Number Number Expenditures
U.S. DEPARTMENT OF EDUCATION
Passed Through Texas Education Agency
ESEA Title I, Part A - Improving Basic Programs (211) 84.010A 18610101152908 $ 688
ESEA Title I, Part A - Improving Basic Programs (211) 84.010A 19610101152908 397,961
Total ESEA Title I - Part A $ 398,649
ESEA Title II, Part A - Supporting Effective Instruction (255) 84.367A 18694501152908 59
ESEA Title II, Part A - Supporting Effective Instruction (255) 84.367A 19694501152908 36,110
Total ESEA Title II - Part A $ 36,169
2018-2019 Title VI, Part B, Subpart 2, Rural & Low-Income School (270) 84.358B 19696001152908 $ 20,610
Title IV, Part A, Subpart 1 (289) 84.424A 19680101152908 $ 24,717
Passed Through SELCO SSA
Vocational Education - Carl Perkins (244) 84.048A 18420006152903 $ 5,750
Special Education Cluster (IDEA)
IDEA - Part B, Formula (224) 84.027A 19661001152903 $ 88,805
Total Special Education Cluster (IDEA) $ 88,805
Passed Through Communities in Schools on the South Plains
21st CCLC - Cycle 10 CIS Grant 84.287C 196950267110015 $ 104,481
TOTAL U.S. DEPARTMENT OF EDUCATION $ 679,181
U.S. DEPARTMENT OF AGRICULTURE
Passed Through Texas Department of Agriculture
Child Nutrition Cluster
National School Lunch Program - Cash Assistance (240) 10.555 n/a $ 340,879
Commodities - Non-Cash Assistance (240) 10.555 n/a 43,178
School Breakfast Program (240) 10.553 n/a 191,728
Total Child Nutrition Cluster $ 575,785
TOTAL U.S. DEPARTMENT OF AGRICULTURE $ 575,785
U.S. DEPARTMENT OF LABOR
Passed Through Workforce Solutions South Plains
The Workforce Innovation and Opportunity Act (WIOA) (287) 17.258 #0218HJT000-003 $ 3,211
TOTAL U.S. DEPARTMENT OF LABOR $ 3,211
U.S. DEPARTMENT OF HEALTH AND HUMAN SERVICES
Medicaid Administrative Claiming Program (272) 93.778 H152908 $ 2,178
TOTAL U.S. DEPARTMENT OF HEALTH AND HUMAN SERVICES $ 2,178
TOTAL EXPENDITURES OF FEDERAL AWARDS $ 1,260,355
Federal Medicaid Revenue (SHARS) Reported in General Fund $ 140,559
TOTAL FEDERAL REVENUE REPORTED ON EXHIBIT C-3 $ 1,400,914
-68-
Bolinger, Segars, Gilbert & Moss, L.L.p. CERTIFIED PUBLIC ACCOUNTANTS
-69- ROOSEVELT INDEPENDENT SCHOOL DISTRICT
NOTES TO THE SUPPLEMENTARY SCHEDULE OF EXPENDITURES OF FEDERAL AWARDS
FOR THE YEAR ENDED JUNE 30, 2019
Basis of Presentation The accompanying schedule of expenditures of federal awards (the Schedule) includes the federal award activity of Roosevelt Independent School District under programs of the federal government for the year ended June 30, 2019. The information in the Schedule is presented in accordance with the requirements of Title 2 U.S. Code of Federal Regulations Part 200, Uniform Administrative Requirements, Cost Principles, and Audit Requirements for Federal Awards (Uniform Guidance). Summary of Significant Accounting Policies (A) Expenditures reported on the Schedule are reported on the accrual basis of accounting. Such
expenditures are recognized following the cost principles contained in the Uniform Guidance, wherein certain types of expenditures are not allowed or are limited as to reimbursement.
(B) Roosevelt Independent School District has not elected to use the 10 percent de minimus indirect cost
rate as allowed under the Uniform Guidance.
Bolinger, Segars, Gilbert & Moss, L.L.p. CERTIFIED PUBLIC ACCOUNTANTS