room temperature synthesized solid solution aufe
TRANSCRIPT

Nanoscale
PAPER
Cite this: Nanoscale, 2021, 13, 10402
Received 19th January 2021,Accepted 6th May 2021
DOI: 10.1039/d1nr00383f
rsc.li/nanoscale
Room temperature synthesized solid solution AuFenanoparticles and their transformation into Au/FeJanus nanocrystals†
Maria V. Efremova, *‡a,b Marina Spasova,c Markus Heidelmann,d
Ivan S. Grebennikov,b Zi-An Li,c Anastasiia S. Garanina,b Iana O. Tcareva, b
Alexander G. Savchenko,b Michael Farle,c Natalia L. Klyachko,a,f
Alexander G. Majougab,e and Ulf Wiedwald *b,c
Solid solution AuFe nanoparticles were synthesized for the first time under ambient conditions by an
adapted method previously established for the Fe3O4–Au core–shell morphology. These AuFe particles
preserved the fcc structure of Au incorporated with paramagnetic Fe atoms. The metastable AuFe can be
segregated by transformation into Janus Au/Fe particles with bcc Fe and fcc Au upon annealing. The
ferromagnetic Fe was epitaxially grown on low index fcc Au planes. This preparation route delivers new
perspective materials for magnetoplasmonics and biomedical applications and suggests the reconsidera-
tion of existing protocols for magnetite–gold core–shell synthesis.
Introduction
Magnetite and gold nanoparticles (NPs) are the materials ofchoice for a vast variety of biomedical applications due to theirsize-dependent and controllable physicochemical propertiesand biocompatibility.1–5 Hybrid magnetite–gold NPs combinethe magnetic and plasmonic properties, which make them oneof the best candidates for tumor theranostics,6–8 multimodal
magnetic resonance imaging/computer tomography (MRI/CT)imaging,9–11 MRI-guided radiosensitization,12 enhancedhyperthermia,13,14 and other applications.15–18 For these pur-poses, core–shell magnetite–gold NPs are especially attractiveif the gold shell completely covers the magnetic core and pro-tects the latter from oxidation, minimizes its possible toxicity,and enables the functionalization with sulfur-containingligands (mainly thiols).19–21 To date, various syntheticapproaches have been developed to generate such NPs.22–25
Among the most common methods is the iterative reductionof hydrogen tetrachloroaurate with hydroxylamine hydro-chloride.26 Despite promising in vitro and in vivo applicationsof magnetite–gold NPs obtained by this method,27–29 theauthors often do not provide detailed structural and magneticcharacterization of these nanomaterials. In particular, unam-biguous evidence of the core–shell structure is still pendingwhereas it was presented for other core-shell systems like mag-netite–silica NPs.30,31 From the chemical standpoint, at leastpartial dissolution of Fe ions from Fe3O4 cores can be expectedconsidering the harsh acidic environment during Au saltreduction. In the current study, we have investigated thisapproach in detail and provided a comprehensive step-by-stepcharacterization of the final product after the removal ofuncoated Fe3O4 seeds.
Despite previous reports, we do not observe core-shell mor-phologies but find gold-rich solid solution AuFe NPs. In thephase diagram, the solubility of Fe in Au is extremely low witha limit of 1–2 mass% at 25 °C.32 Nonetheless, solid solutionsof Fe and Au can be prepared by non-equilibrium techniques
†Electronic supplementary information (ESI) available: Fig. S1: Size distributionof Fe3O4 NPs and AuFe NPs; Fig. S2: Bright-field TEM image of AuFe NPs on acarbon-coated Cu grid before purification; Fig. S3: Magnetic characterization ofFe3O4 seeds and AuFe NPs; Fig. S4: Size distribution of inclusions (regions of adifferent contrast) in the TEM images of the AuFe NPs; Fig. S5: Properties ofAuFe NPs for bio-applications; Fig. S6: TEM overview image indicating theinclusions. Fig. S7: Overview EDX spectrum of AuFe NPs. Fig. S8: HAADF-STEMof Au/Fe Janus particles 1 year after annealing. See DOI: 10.1039/d1nr00383f‡Current address: Department of Nuclear Medicine, TUM School of Medicine,Technical University of Munich, 81675 Munich, Germany. E-mail: [email protected]
aDepartment of Chemistry, Lomonosov Moscow State University, Moscow, 119991,
Russian FederationbNational University of Science and Technology “MISIS”, Moscow, 119049,
Russian FederationcFaculty of Physics and Center for Nanointegration Duisburg-Essen, University of
Duisburg-Essen, Duisburg, 47057 Germany. E-mail: [email protected] - Interdisciplinary Center for Analytics on the Nanoscale and Center for
Nanointegration Duisburg-Essen, University of Duisburg-Essen, Duisburg, 47057
GermanyeD. Mendeleev University of Chemical Technology of Russia, Moscow, 125047,
Russian FederationfG.R. Derzhavin Tambov State University, Tambov, 392000, Russian Federation
10402 | Nanoscale, 2021, 13, 10402–10413 This journal is © The Royal Society of Chemistry 2021
Ope
n A
cces
s A
rtic
le. P
ublis
hed
on 0
6 M
ay 2
021.
Dow
nloa
ded
on 2
/21/
2022
11:
23:3
6 A
M.
Thi
s ar
ticle
is li
cens
ed u
nder
a C
reat
ive
Com
mon
s A
ttrib
utio
n-N
onC
omm
erci
al 3
.0 U
npor
ted
Lic
ence
.
View Article OnlineView Journal | View Issue

like gas phase condensation33,34 and pulsed laser ablation inliquids.35–37 In the present study, we have described the syn-thesis of AuFe solid solution nanocrystals, for the first timeunder ambient conditions, using the methods of colloidalchemistry. Interestingly, the solid solution is metastable atroom temperature forming Fe-rich regions in the Au matrixduring storage. By in situ annealing experiments in trans-mission electron microscopy (TEM) and vibrating samplemagnetometry (VSM), we have proved the segregation of metal-lic Fe from the AuFe solid solution finally forming Au/Fe JanusNPs. Therefore, this study provides new insights into the estab-lished synthesis of core–shell NPs suggesting completelydifferent underlying mechanisms and final structures. It alsofacilitates the reassessment of possible applications of suchNPs leading to new materials for magnetoplasmonics.
ExperimentalMaterials
Iron chloride(II) tetrahydrate (FeCl2·4H2O, 98%), iron(III) chlor-ide (FeCl3, anhydrous, 97%), hydrogen tetrachloroaurate(III) tri-hydrate (HAuCl4·3H2O, 99.9%), sodium citrate dihydrate(Na3C6H5O7·2H2O, 99%), hydroxylamine hydrochloride(NH2OH·HCl, 99%), ammonium hydroxide solution (NH3·H2O,28%), nitric acid (HNO3, 69%), hydrochloric acid (HCl, 36%),perchloric acid (HClO4, 70%), iron standard for ICP(TraceCERT, 1000 mg L−1 Fe in nitric acid), and gold standardfor ICP (TraceCERT, 1000 mg L−1 Au in hydrochloric acid) werepurchased from Sigma-Aldrich. HS–PEG–COOH (2 kDa) waspurchased from Nanocs Inc. SERVAPOR dialysis tubing,MWCO 12 000–14 000 kDa, was purchased from SERVA. Waterused in all experiments was deionized (18.2 MΩ cm−1,Millipore Milli-Q Academic System). All vessels were washedwith hot solution of aqua regia and then rinsed with deionizedwater before synthesis.
Synthesis of Fe3O4 NPs
Fe3O4 NPs were prepared by co-precipitation of Fe(II) and Fe(III)salts according to the procedure described in ref. 38 with slightmodifications. Briefly, 650 mg of FeCl3 and 398 mg ofFeCl2·4H2O were dissolved in 5 mL of 2 M HCl, the obtainedsolution was added dropwise to 50 mL of 0.7 M NH3 solution indeionized H2O, and then the mixture was magnetically stirredfor 30 minutes. After that, the NPs were magnetically decantedand washed with 50 mL of 2 M HClO4, and they were magneti-cally decanted again and dissolved in 50 mL of H2O for30 minutes using an ultrasonic bath (BANDELIN SONOREX).
Synthesis of AuFe NPs
AuFe NPs were prepared by room-temperature iterativereduction of chloroauric acid with hydroxylamine hydro-chloride according to the general scheme described in ref. 26.0.19 mL of previously obtained Fe3O4 NP solution (or 0.19 mLof H2O during the control experiment) was added to 7.31 mLof H2O in a flat-bottomed flask under magnetic stirring. Then
7.5 mL of 0.1 M sodium citrate solution was added, and themixture was stirred for 10 minutes. After that the solution wasdiluted with 135 mL of H2O, and aliquots of 1% HAuCl4 solu-tion and 0.2 M solution of NH2OH·HCl were incrementallyadded (with 10–15 minutes between additions) according tothe scheme described in ref. 26.
Purification and modification of AuFe NPs
20 mL of the as prepared freshly sonicated (30 min) AuFe NPdispersion were centrifuged using a MiniSpin Plus centrifugeat 7000 rpm (RCF 3300g) for 5 min. The supernatant was sep-arated with a pipette; the residue was resuspended in 10 mL ofH2O by sonication. Then, it was mixed with 10 mL of anaqueous HS–PEG–COOH solution (0.103 μmol of ligand) andstirred overnight. The unbound ligand was washed off by dialy-sis (3 times in 1 L H2O). For the investigation by inductivelycoupled plasma mass-spectrometry, AuFe NPs were addition-ally purified by acid treatment. 50 mL of freshly sonicated(30 min) AuFe NP dispersion were mixed with 10 mL of con-centrated hydrochloric acid under vigorous stirring for12 hours. Then the NPs were decanted, washed with 50 mL ofH2O, decanted again and resuspended in 50 mL of H2O. ForX-ray diffraction and magnetometry, AuFe NPs were desiccatedusing a rotary evaporator.
Electron microscopy
TEM micrographs were obtained using a JEOL JEM-1400 (120kV) microscope. Samples were prepared by casting and evapor-ating a droplet of aqueous solution of NPs onto a formvar-coated copper grid (300 mesh). The average diameter of NPswas calculated from TEM images by analyzing about 1000 NPsfor each sample using ImageJ software (National Institutes ofHealth, USA). HRTEM micrographs were obtained usingprobe-side Cs-corrected JEOL JEM 2200FS and probe-side Cs-corrected JEM-ARM200F HR/Cold FEG microscopes, both oper-ated at an acceleration voltage of 200 kV. Overview images weretaken in conventional bright-field TEM mode while the high-angle annular dark-field STEM and bright-field HRTEM modeswere used for the high-resolution micrographs. Samples wereprepared by casting and evaporating a droplet of solution ontoa carbon-coated copper grid (300 mesh). EDX elementalmapping was carried out in the scanning mode utilizing anOxford X-max detector. For the annealing experiment, the NPswere deposited on a heating chip. The annealing experimentwas carried out utilizing a Protochips Aduro in situ heatingholder in the JEM 2200FS.
X-ray diffraction
Patterns were measured from 2θ = 30° to 120° at a scan rate of0.1° per step and 3 s per point using a X-ray powder diffract-ometer Rigaku Ultima IV with Co-Kα radiation and a graphitemonochromator in the diffracted beam path. Quantitative XRDanalysis (including crystal size evaluation by determination ofthe coherent scattering region) was performed using PHAN%and SPECTRUM programs developed by Physical MaterialsScience Department of NUST “MISiS” (modified Rietveld
Nanoscale Paper
This journal is © The Royal Society of Chemistry 2021 Nanoscale, 2021, 13, 10402–10413 | 10403
Ope
n A
cces
s A
rtic
le. P
ublis
hed
on 0
6 M
ay 2
021.
Dow
nloa
ded
on 2
/21/
2022
11:
23:3
6 A
M.
Thi
s ar
ticle
is li
cens
ed u
nder
a C
reat
ive
Com
mon
s A
ttrib
utio
n-N
onC
omm
erci
al 3
.0 U
npor
ted
Lic
ence
.View Article Online

method) based on the minimization of the difference betweenthe experimental spectrum and the model. For fitting thespectra, the lattice parameters, the amount of each phase andtheir crystallite sizes were optimized.
Magnetometry
The dried powder of Fe3O4 or AuFe NPs (about 10 mg) wasfilled in synthetic capsules for vibrating sample magnetometry(VSM) and the hysteresis loops and temperature dependentmagnetization were measured using a Quantum Design PPMSDynaCool system. For high temperature VSM, sample powderhas been dispersed in Zircar cement and deposited on aheating stick.
Visible absorption spectroscopy
AuFe NPs solution was examined with a Thermo ScientificMultiskan GO spectrometer at wavelengths from 400 nm to800 nm.
ICP-MS measurements
The iron and gold content in AuFe NPs were determined withan ELAN DRC II 9000 (PerkinElmer SCIEX) inductively coupledplasma mass spectrometer. A series of 5 calibration samples inthe concentration range of 0.1–10 ppm were prepared bydilution of commercial ICP standards with diluted (to 2–5%HNO3) aqua regia. The samples were similarly digested withdiluted aqua regia in the concentration range of 0.1–10 ppm.
Cell cultures
PC-3 and LNCaP human prostate cancer cells were purchasedfrom the American Type Culture Collection (ATCC, Manassas,VA, USA) and cultured in RPMI-1640 medium (Gibco) sup-plemented with 10% fetal bovine serum (FBS) (Gibco), 2 mML-glutamine (Gibco), and RPMI vitamin solution (Sigma) at37 °C in a humidified incubator supplied with 5% CO2. Bothcell lines routinely tested negative for mycoplasma.
MTS assay
PC-3 and LNCaP cells were seeded in a 96-well plate (10 × 103
cells per well) in a culture medium and cultivated at 37 °Cunder a humidified atmosphere containing 5% CO2. The cellswere counted using an automatic cell counter EVE. After 24 h,the cells were washed with 100 μL of serum-free medium andincubated with 100 μL of AuFe NP serial dilutions. To evaluatethe cytotoxicity of NPs, the standard MTS test39 was used. Thesolution of AuFe NPs in the concentration range 7.5–150.0 µgAu mL−1 was added to the cell culture medium. 48 h later, thecells were washed with 100 μL of serum-free medium and new100 μL of culture medium with 20 μL of MTS reagent (CellTiter96 AQueous Non-Radioactive Cell Proliferation Assay,Promega, USA) were added per well. After 4 h of incubation at37 °C in darkness, the absorbance of the solution wasmeasured at 490 nm using a Thermo Scientific Multiskan GOspectrometer. 1× PBS, 10% well volume, was used as a negativecontrol, and 30% DMSO diluted in cell medium was used as apositive control.
ResultsSynthesis of NPs
Fe3O4 seeds were obtained by the co-precipitation of iron saltswith ammonia solution as described in ref. 38. For the syn-thesis of AuFe NPs, we use a room-temperature iterativereduction of HAuCl4 with NH2OH·HCl in the presence ofFe3O4 seeds adapted from ref. 26. The process can bedescribed as follows:
4HAuCl4 þ 6NH2OH �HCl ! 4Auþ 3N2Oþ 22HClþ 3H2O
ð1ÞDuring the reaction, a considerable amount of hydrochloric
acid (HCl) is produced. We believe that this can lead to at leastpartial dissolution of Fe ions from Fe3O4 seed NPs. While it isnot a priori known whether Fe ions or Fe3O4 seeds serve asprimary nucleation sites for Au reduction, the latter is clearly aheterogeneous nucleation process.26 To this end, we failed toobtain stable Au NPs when Fe3O4 seeds were initially excludedfrom the reaction mixture and replaced with an equal amountof deionized water. In that case, visible aggregates appeared atthe bottom of the flask after the first addition of HAuCl4 andNH2OH·HCl.
After synthesis, the reaction mixture contains AuFe, Fe3O4,and Au NPs. For purification, we have developed a two-stepapproach based on centrifugation and subsequent HCl treat-ment of the final product. Centrifugation is a widely usedmethod40 based on the selection of rotation speeds to precipi-tate larger-sized and heavier AuFe NPs while smaller andlighter Fe3O4 NPs (and, possibly, small Au NPs) remain in thesupernatant. Yet, it only allows for mechanical separation ofthe reaction mixture and cannot ensure complete removal ofthe uncoated Fe3O4 NPs, especially when the latter are clus-tered or formed on the Au surface. Therefore, we sup-plemented a chemical “etching” step, namely, the treatment ofNPs with 1.7 M HCl acid that dissolves Fe3O4 NPs, while theanalogous examples involving 1 M HCl41 or 2 M HCl42 havebeen reported before. To keep the AuFe NPs stable in the col-loidal solution, they are coated with PEG prior to the acid treat-ment (see Experimental section for details).
Morphology, structure, and composition of the NPs
Fig. 1 presents low-resolution TEM images. Fe3O4 seeds haveroughly a spherical shape and an average diameter of 9 ± 2 nm(Fig. 1a and Fig. S1a†). After reduction of Au in the presence ofiron oxide seeds we obtain a mixture of more electron-denseand less electron-dense NPs with or without Au, respectively(see Fig. S2†). Purification by centrifugation and acid treatmentleaves predominantly electron-dense Au-rich and rather spheri-cal NPs with an average diameter of 32 ± 5 nm in the colloidalsolution (Fig. 1b and Fig. S1b†). The electron diffraction pattern(Fig. 1c) only shows the fcc Au structure in AuFe NPs withoutadditional rings that can be assigned to any of the iron oxides(magnetite Fe3O4, maghemite γ-Fe2O3, etc.). This finding is con-firmed by powder X-ray diffraction (XRD) patterns displayed in
Paper Nanoscale
10404 | Nanoscale, 2021, 13, 10402–10413 This journal is © The Royal Society of Chemistry 2021
Ope
n A
cces
s A
rtic
le. P
ublis
hed
on 0
6 M
ay 2
021.
Dow
nloa
ded
on 2
/21/
2022
11:
23:3
6 A
M.
Thi
s ar
ticle
is li
cens
ed u
nder
a C
reat
ive
Com
mon
s A
ttrib
utio
n-N
onC
omm
erci
al 3
.0 U
npor
ted
Lic
ence
.View Article Online

Fig. 1d. For initial seeds, all diffraction peaks correspond toFe3O4 (100% volume fraction) while after the reaction withhydrogen tetrachloroaurate and subsequent purification, onlyfcc Au peaks (100% volume fraction) are detected.
By XRD, the lattice constants and crystallite sizes areextracted from the experimental data using Rietveld refine-ment with the reference data of Fe3O4 (ICDD PDF-2 no. 00-019-0629) and Au (ICDD PDF-2 no. 03-065-8601). Iron oxide seedsare monocrystalline with a crystallite size of 8 ± 1 nm matchingwell to the TEM diameter of 9 ± 2 nm. The lattice parameter of0.8362 ± 0.0004 nm suggests a non-stoichiometric, intermedi-ate state between Fe3O4 (a = 0.8397 nm) and γ-Fe2O3 (a =0.8347 nm),43 which is further verified using room-tempera-ture hysteresis data showing a saturation magnetization of61.0 ± 0.1 A m2 kg−1 (Fig. S3a†) in agreement with the data forFe3O4 NPs and their hybrids of similar size previously reportedin the literature.44 For AuFe NPs, the lattice parameter of0.4087 nm ± 0.0002 nm matches the volumetric Au value (a =0.4087 nm),45 and a polycrystalline state is obtained (crystallitesize of 15 ± 2 nm vs. 32 ± 5 nm given by TEM which is con-firmed by high-resolution TEM shown below).
The composition of the NPs was determined by ICP-MS.After each purification step, the amount of Fe decreases. TheAuFe NPs contain 6.60 ± 1.55 mass% Fe directly after synthesis,0.70 ± 0.19 mass% Fe after purification via centrifugation andfinally 0.26 ± 0.06 mass% Fe after etching with HCl.
Crystalline structure and elemental composition at the level ofsingle NPs
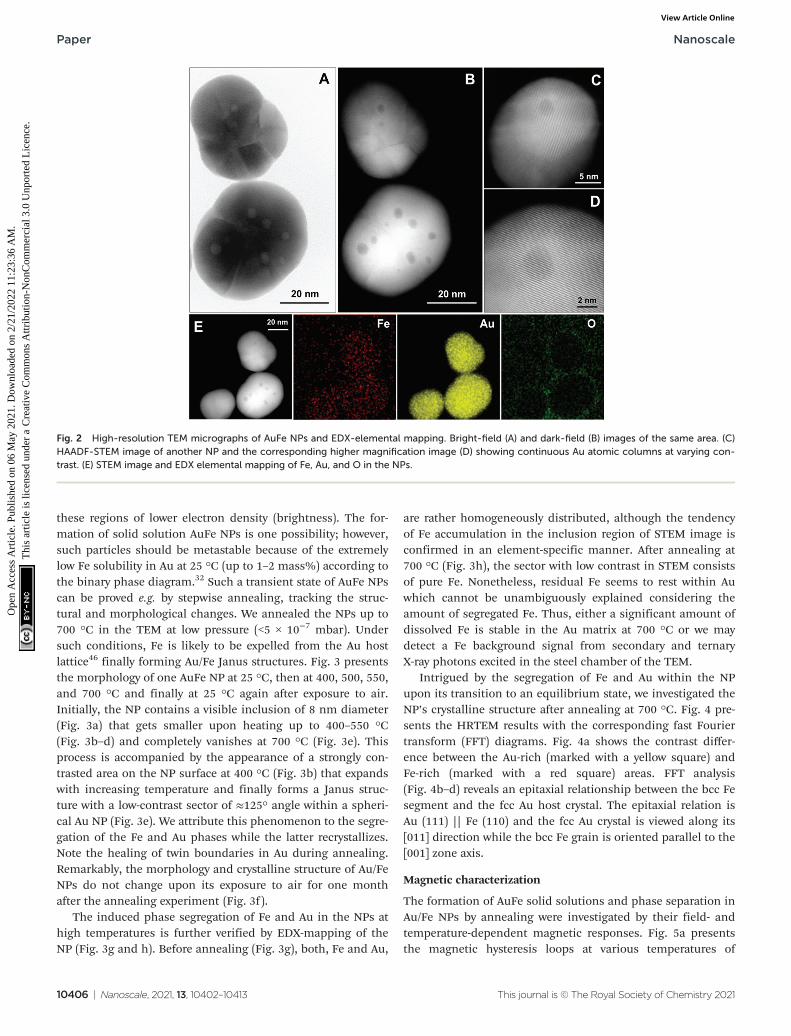
Further insight into the structure of NPs is gained by high-angle annular dark field-scanning TEM (HAADF-STEM) andbright-field high resolution HRTEM imaging and energy-dis-persive X-ray (EDX) elemental mapping as shown in Fig. 2.Most of the NPs are polycrystalline and contain severalinclusions (up to 8 per NP) that appear as small sphericalregions of different contrast with an average diameter of 3.4 ±1.0 nm (Fig. 2a and b, size distribution in Fig. S4†). At highermagnification (Fig. 2c and d), one can also see an inhomo-geneous contrast distribution within the NPs, which isespecially evident in the darker region with ≈3 nm size.Nevertheless, it is clear from these images that the crystallo-graphic planes and atomic columns of Au are not distortedeven near or at inclusions. STEM-EDX elemental mapping atroom temperature (Fig. 2e) confirms the presence of gold anda rather homogeneous distribution of Fe. Importantly, werevealed that there is no oxygen within the particles, excludingthe possibility of a magnetite–gold core–shell structure.
Morphological, structural and compositional changes in theNPs upon annealing
Although STEM-EDX cannot resolve a different stoichiometryin the inclusions, we expect a somewhat higher Fe content in
Fig. 1 Morphology and crystalline structure of NPs. Bright-field TEM images of Fe3O4 NPs (A) and AuFe NPs after purification (B). (C) SAED patternof (B). All diffraction rings can be ascribed to the fcc Au lattice as indicated in the image. (D) X-ray diffraction patterns of Fe3O4 seeds (bottom panel)and AuFe NPs after purification (top panel). The intensities are normalized to the strongest peak. The red and blue vertical lines represent theangular position and relative intensity of the reference powder diffractograms of the Fe3O4 and Au phases, respectively.
Nanoscale Paper
This journal is © The Royal Society of Chemistry 2021 Nanoscale, 2021, 13, 10402–10413 | 10405
Ope
n A
cces
s A
rtic
le. P
ublis
hed
on 0
6 M
ay 2
021.
Dow
nloa
ded
on 2
/21/
2022
11:
23:3
6 A
M.
Thi
s ar
ticle
is li
cens
ed u
nder
a C
reat
ive
Com
mon
s A
ttrib
utio
n-N
onC
omm
erci
al 3
.0 U
npor
ted
Lic
ence
.View Article Online
these regions of lower electron density (brightness). The for-mation of solid solution AuFe NPs is one possibility; however,such particles should be metastable because of the extremelylow Fe solubility in Au at 25 °C (up to 1–2 mass%) according tothe binary phase diagram.32 Such a transient state of AuFe NPscan be proved e.g. by stepwise annealing, tracking the struc-tural and morphological changes. We annealed the NPs up to700 °C in the TEM at low pressure (<5 × 10⁻⁷ mbar). Undersuch conditions, Fe is likely to be expelled from the Au hostlattice46 finally forming Au/Fe Janus structures. Fig. 3 presentsthe morphology of one AuFe NP at 25 °C, then at 400, 500, 550,and 700 °C and finally at 25 °C again after exposure to air.Initially, the NP contains a visible inclusion of 8 nm diameter(Fig. 3a) that gets smaller upon heating up to 400–550 °C(Fig. 3b–d) and completely vanishes at 700 °C (Fig. 3e). Thisprocess is accompanied by the appearance of a strongly con-trasted area on the NP surface at 400 °C (Fig. 3b) that expandswith increasing temperature and finally forms a Janus struc-ture with a low-contrast sector of ≈125° angle within a spheri-cal Au NP (Fig. 3e). We attribute this phenomenon to the segre-gation of the Fe and Au phases while the latter recrystallizes.Note the healing of twin boundaries in Au during annealing.Remarkably, the morphology and crystalline structure of Au/FeNPs do not change upon its exposure to air for one monthafter the annealing experiment (Fig. 3f).
The induced phase segregation of Fe and Au in the NPs athigh temperatures is further verified by EDX-mapping of theNP (Fig. 3g and h). Before annealing (Fig. 3g), both, Fe and Au,
are rather homogeneously distributed, although the tendencyof Fe accumulation in the inclusion region of STEM image isconfirmed in an element-specific manner. After annealing at700 °C (Fig. 3h), the sector with low contrast in STEM consistsof pure Fe. Nonetheless, residual Fe seems to rest within Auwhich cannot be unambiguously explained considering theamount of segregated Fe. Thus, either a significant amount ofdissolved Fe is stable in the Au matrix at 700 °C or we maydetect a Fe background signal from secondary and ternaryX-ray photons excited in the steel chamber of the TEM.
Intrigued by the segregation of Fe and Au within the NPupon its transition to an equilibrium state, we investigated theNP’s crystalline structure after annealing at 700 °C. Fig. 4 pre-sents the HRTEM results with the corresponding fast Fouriertransform (FFT) diagrams. Fig. 4a shows the contrast differ-ence between the Au-rich (marked with a yellow square) andFe-rich (marked with a red square) areas. FFT analysis(Fig. 4b–d) reveals an epitaxial relationship between the bcc Fesegment and the fcc Au host crystal. The epitaxial relation isAu (111) || Fe (110) and the fcc Au crystal is viewed along its[011] direction while the bcc Fe grain is oriented parallel to the[001] zone axis.
Magnetic characterization
The formation of AuFe solid solutions and phase separation inAu/Fe NPs by annealing were investigated by their field- andtemperature-dependent magnetic responses. Fig. 5a presentsthe magnetic hysteresis loops at various temperatures of
Fig. 2 High-resolution TEM micrographs of AuFe NPs and EDX-elemental mapping. Bright-field (A) and dark-field (B) images of the same area. (C)HAADF-STEM image of another NP and the corresponding higher magnification image (D) showing continuous Au atomic columns at varying con-trast. (E) STEM image and EDX elemental mapping of Fe, Au, and O in the NPs.
Paper Nanoscale
10406 | Nanoscale, 2021, 13, 10402–10413 This journal is © The Royal Society of Chemistry 2021
Ope
n A
cces
s A
rtic
le. P
ublis
hed
on 0
6 M
ay 2
021.
Dow
nloa
ded
on 2
/21/
2022
11:
23:3
6 A
M.
Thi
s ar
ticle
is li
cens
ed u
nder
a C
reat
ive
Com
mon
s A
ttrib
utio
n-N
onC
omm
erci
al 3
.0 U
npor
ted
Lic
ence
.View Article Online

5–300 K normalized to the total sample mass mtot = 15.43 mg.The overall shape of the hysteresis loops suggests the presenceof several magnetic components. It is striking that the highfield slopes change sign from paramagnetic at low tempera-tures to diamagnetic at high temperatures, which we ascribe toparamagnetic Fe atoms in the diamagnetic Au matrix as dis-cussed below.
The hysteresis loops contain further a ferrimagnetic com-ponent originating from the residual uncovered Fe3O4 seedspresent in the sample after purification (see the Experimentalsection). In Fig. S3,† the hysteresis loops of the Fe3O4 seed NPs(Fig. S3a†) and the hysteresis of AuFe NPs are plotted in asmaller range after the subtraction of the high-field slopes(Fig. S3b†). The coercive field μ0HC is 26 mT at 5 K, which is inagreement with the data previously reported in the literature,44
whereas the fitting of the coercive fields e.g. with Sharrock’sequation is not applicable here. The ferrimagnetic component
is very small (µFe3O4= 1.02 × 10⁻⁷ A m2), which means that the
diamagnetic Au prevails over the total sample mass.Considering the saturation magnetization of initial Fe3O4
Fig. 3 In situ annealing experiment in TEM. HAADF-STEM images of aAuFe NP on a SiN chip at 25 °C (A), 400 °C (B), 500 °C (C), 550 °C (D),and 700 °C (E) revealing the diffusion of Fe towards the surface of thehybrid NP. Panel (F) reflects the unchanged morphology at 25 °C after aone-month exposure to air demonstrating the resistance to atmosphericoxygen. The area shown by the white dotted circle is Fe-rich, havinglower contrast that vanishes with increasing temperature. EDX-elemen-tal mapping shows Fe and Au in the same NP before (G) and afterannealing at 700 °C (H) proving the temperature induced phase segre-gation. The binning factors 4 and 2 in (G) and (H), respectively, werechosen for the best data visualization. The scale bar is 5 nm.
Fig. 4 Structural investigation of the Au/Fe NP on a SiN chip afterannealing at 700 °C. Bright-field HRTEM image (A) and the corres-ponding FFT images (B and C) of the areas shown in (A) in yellow andred colors, respectively. The FFT pattern in (B) corresponds to the Au fccstructure (marked with yellow indices) and the NP is viewed along its[011] direction. The FFT pattern in (C) corresponds to the Fe bcc struc-ture (marked with red indices) and the NP is viewed along its [001] direc-tion. The FFT pattern in (D) corresponds to the Au/Fe interface area. The[111] and [110] crystallographic directions of Au and Fe align to eachother.
Nanoscale Paper
This journal is © The Royal Society of Chemistry 2021 Nanoscale, 2021, 13, 10402–10413 | 10407
Ope
n A
cces
s A
rtic
le. P
ublis
hed
on 0
6 M
ay 2
021.
Dow
nloa
ded
on 2
/21/
2022
11:
23:3
6 A
M.
Thi
s ar
ticle
is li
cens
ed u
nder
a C
reat
ive
Com
mon
s A
ttrib
utio
n-N
onC
omm
erci
al 3
.0 U
npor
ted
Lic
ence
.View Article Online

seeds, we estimate mFe3O4= (1.02 × 10⁻⁷ A m2)/(61.02 A m2
kg−1) = 1.67 μg (Fe3O4) or is equivalent to 1.21 μg (Fe).The Fe oxide component is a side effect in the present
experiments, which can be separated from Fe dissolved in theAu matrix. We get access to the paramagnetic contribution ofFe in Au by plotting the high-field magnetic susceptibility χ
(slopes in Fig. 5a). This χ is, however, the sum of χpara (Fe) andχdia (Au). The paramagnetic Fe atoms can be described by theLangevin function (χ ∝ T−1), thus we plot χT (T ) and subtractthe linearly decreasing diamagnetic contribution of Au in this
scaling (temperature-independent). After this, we obtain thesusceptibility χFe in Au displayed in Fig. 5b. Below 50 K, χT isstrongly decreasing which we ascribe to freezing of randomlyoriented Fe magnetic moments in the Au matrix due to RKKYinteraction. Above 50 K, χT can be approximated with a con-stant value. The Curie constant is given by
C ¼ μ0Nμ2
3kB¼ χFe inAu � T ¼ 5:11� 10�12 m3 K
¼ 4:06� 10�7 emuKOe�1;
ð2Þ
where µ0 = 1.257 × 10⁻⁶ V s (A m)−1 is the vacuum permeability,kB is the Boltzmann constant, and µ = 2.8μB is the magneticmoment of Fe atoms in the Au matrix taken as the mediumfrom previous experiments of fcc Fe (in an Au matrix)47 andDFT calculations.48,49 Note that the fcc Fe magnetic momentof 2.8µB also matches the extrapolation of the fcc branch onthe Fe electron concentration in the Slater–Pauling curve.50
Then, the number N of Fe atoms in the Au matrix can be esti-mated as:
N ¼ Csample � 3kBμ0μ2
¼ 1:431� 1017: ð3Þ
This leads to Fe mass mFe in Au = 20.16 μg dissolved in Au.Thus, the total sample mass mtot = mAu + mFe in Au + mFe3O4
=15 408 µg + 20.16 μg + 1.67 μg = 15.43 mg and about ≈0.14 Femass% or a Fe/Au atomic ratio of 0.5%. We estimated the errorbars of the analysis to be in the order of 10–15%. In addition,the results proved that most Fe is dissolved in the Au matrix(20.16 μg) as compared to the residual Fe3O4 seeds (mFe =1.21 μg).
Fig. 5c presents the high-temperature magnetization of theAuFe NPs upon annealing towards segregated Au/Fe NPs up to1000 K at B = 200 mT. The two components (Fe atoms in Auand residual Fe3O4 seeds) show up in two magnetic orderingtemperatures as indicated by the mean field model fits. Notethat this measurement has been performed using the identicalpowder, but about 1 year after the low temperature measure-ments. During this period, significant Fe diffusion to the par-ticle surface and progression of oxidation may lead toincreased Fe3O4 content in the magnetic measurements.Overall, we observe 3 distinct regions, while the total magneticmoment of the sample decreases with increasing T. In theinterval between 300 K and 850 K, the Fe3O4 signal decreases,which is overlaid by the segregation of Fe atoms in Au towardsmetallic Fe (cf. TEM annealing series) and explains the firstdip in Fig. 5c. It should be noted that the sample powder wasembedded in Zircar cement containing residual water fromcement dispersion. Therefore, the oxidation of segregated Fe ispossible upon heating, and the relative contributions of Fe inAu, segregated metallic Fe and Fe3O4 seeds change during themeasurement. To fit the data in the 670–830 K interval, we usea mean field approach with the exponent δ = 0.5, which givesthe Curie temperature TC (Fe3O4) = 850 K, and the remainingcomponent has TC = 1006 K, pointing towards small metallicFe segments in the Au/Fe NPs with slightly reduced Curie
Fig. 5 Magnetic characterization of AuFe NPs. (A) Hysteresis loopsrecorded at various temperatures between 5 K and 300 K. (B) χT (T ) plotafter subtraction of the Au diamagnetic component for the evaluation ofthe Curie constant; (C) high-temperature total magnetic moment ofanother sample at B = 200 mT. Two ordering temperatures are obtainedas identified by the fits for Fe3O4 and Fe using mean field models whilethe dip at 600 K is due to diffusion.
Paper Nanoscale
10408 | Nanoscale, 2021, 13, 10402–10413 This journal is © The Royal Society of Chemistry 2021
Ope
n A
cces
s A
rtic
le. P
ublis
hed
on 0
6 M
ay 2
021.
Dow
nloa
ded
on 2
/21/
2022
11:
23:3
6 A
M.
Thi
s ar
ticle
is li
cens
ed u
nder
a C
reat
ive
Com
mon
s A
ttrib
utio
n-N
onC
omm
erci
al 3
.0 U
npor
ted
Lic
ence
.View Article Online

temperature TC as compared to bulk metallic Fe TC = 1043 K.50
Note that the maximum temperature of the device is 1000 K.
Biomedical applications of AuFe
As a first step towards the biomedical application of initialAuFe solid solution NPs synthesized in this work (Fig. S5†), wemeasured their plasmon resonance with the maximum at533 nm in the UV-VIS spectrum (Fig. S5a†) and demonstratedthat the viability of human prostate cancer cell lines LNCaPand PC-3 after 48 hours of incubation with NPs is above 90%and 85%, respectively, for the entire tested concentrationrange up to 150 μg mL−1 Au (Fig. S5b†).
Discussion
In this work, we make use of the widely used method of itera-tive hydrogen tetrachloroaurate reduction in the presence ofmagnetite seeds aiming for core–shell iron oxide–gold NPs.Astonishingly and in contrast to previous reports, comprehen-sive characterization of the product reveals the successful syn-thesis of solid solution fcc AuFe NPs by employing themethods of colloidal chemistry at ambient temperature. Inthis discussion, we have summarized our data and comparedthe present results step-by-step with the data previouslyreported in the literature.
According to low-resolution TEM (Fig. 1a and b) the size ofNPs increases after the reduction of hydrogen tetrachloroau-rate from 9 ± 2 nm to 32 ± 5 nm for Fe3O4 seeds and solid solu-tion AuFe NPs, respectively. Thus, heterogeneous Au nuclea-tion is successful although the final size of NPs is less thanthat reported for NPs prepared by an analogous Au coatingprocedure (50 ± 5 nm).26 The formation of a core-shell struc-ture consisting of a Fe3O4 core surrounded by an Au shell,however, is not identified. This significant difference withrespect to the work by Lyon et al.26 is likely explained by thedifferent iron oxide seed treatment with strong electrostaticstabilization with perchloric acid, similar to the ones reportedby Lo et al.38 In this case, NPs are strongly separated fromneighbors and can facilitate the formation of one Au-contain-ing particle per seed.
Diffraction data, XRD and electron diffraction, do notconfirm the presence of a core–shell architecture. Both theSAED pattern (Fig. 1c) and the X-ray diffractogram (Fig. 1d)only reveal fcc Au in the NPs. This result has been reported bymany other groups who investigated the core–shell structuresand has been ascribed to a “heavy atom effect” from thecompact Au shell overlapping signals of the Fe3O4 core.40,51,52
We agree with Luchini et al.51 pointing out that this phenom-enon is not self-explaining and in fact different reasons shallbe discussed: (a) iron oxide seeds degrade during thereduction of hydrogen tetrachloroaurate, (b) gold overlays thediffraction peaks of iron oxide or (c) iron oxide is completelyshielded from X-rays. In favor of hypotheses (a) and (b), Loet al.38 obtained XRD-patterns of core–shell NPs with diffrac-tion peaks from both Fe3O4 and Au phases. However, uncoated
Fe3O4 NPs were also observed in their TEM micrographs and itremains unclear whether the XRD has been measured for puri-fied core–shell NPs or the as-obtained mixture containingFe3O4 NPs. One can also see that the XRD diffraction peaks ofAu do not significantly overlap with the corresponding Fe3O4
pattern (Fig. 1d), which again excludes hypothesis (b).Since electrons in the TEM can pass the NPs and X-rays
penetrate much deeper at Co-Kα energy, we also exclude (c) forour experiments. Nonetheless, hypothesis (c) is widely dis-cussed in the literature. For example, authors claimed thegrowth of core–shell NPs although the diffractogram onlyshows gold peaks originating from a shell thickness as smallas 0.7 nm.40 Another group52 questioned the presence of mag-netite signals for a gold shell thickness of 1.2 nm. A more sys-tematic study of this phenomenon is carried out in ref. 53 and54. Some authors preliminarily covered the magnetic core withgold nuclei53 and subsequently coated further to a final Authickness ranging from 5 to 15 nm. Their diffraction patternsshow the peaks of the magnetic core at the stage of coatingwith nuclei. After complete coverage, however, these disappear.Another study of the step-by-step gold coating of Fe3O4 pre-sents diffractograms with the characteristic peaks of gold andmagnetite with the latter somewhat weakened in comparisonwith the uncoated state.54 At gold shell thicknesses of 0.5 nm,1 nm, 5 nm, and 8 nm, however, the most intense Fe3O4 peak(311) is still visible.
The confirmation of a core–shell morphology based onXRD and bright-field TEM data is thus highly vulnerable andadditional information is needed. We performed high-resolu-tion electron microscopy (HRTEM), scanning transmissionelectron microscopy (STEM) in combination with the energy-dispersive X-ray spectroscopy (EDX) mapping (Fig. 2). Using asimilar set of techniques, Wagener et al. and Tymoczkoet al.35,55 have provided a solid proof of the core–shell Fe@AuNP structure. Besides this work, unambiguous proofs of adefined magnetite core surrounded by a gold shell are onlyprovided in very few studies.56,57 Yet, those measurementswere performed without the corresponding EDX analysis, sothe localization and distribution of chemical elements remainunclear.
In the present work, we were able to detect the so-calledinclusions (areas of different contrast with diameters up to8 nm) inside the fcc Au matrix using HRTEM (Fig. 2a and b).For many NPs, these inclusions are also visible in low-resolu-tion TEM images (Fig. S6†). Initially, we ascribed theseinclusions to partially dissolved Fe3O4 cores, thereforesuggesting a cluster–shell structure of our NPs. This, however,is disproved by higher magnification TEM (Fig. 2c and d)demonstrating that the crystallographic planes and atomiccolumns of Au are not distorted in regions with reduced con-trast. One of the possible explanations of this contrast insideNPs could be the presence of nanosized pores. However, theproduction of nanoporous gold usually requires a templatesynthesis and sophisticated etching protocols.58–60 Recently,an elegant way of quick nucleation and growth of Au NPs inthe stability region of cetyltrimethylammonium bromide has
Nanoscale Paper
This journal is © The Royal Society of Chemistry 2021 Nanoscale, 2021, 13, 10402–10413 | 10409
Ope
n A
cces
s A
rtic
le. P
ublis
hed
on 0
6 M
ay 2
021.
Dow
nloa
ded
on 2
/21/
2022
11:
23:3
6 A
M.
Thi
s ar
ticle
is li
cens
ed u
nder
a C
reat
ive
Com
mon
s A
ttrib
utio
n-N
onC
omm
erci
al 3
.0 U
npor
ted
Lic
ence
.View Article Online

been suggested by Depciuch et al.61 which still involves elev-ated temperatures up to 60–90 °C, and in our case, the syn-thesis was carried out at room temperature. Therefore, thepresence of nanosized pores in Au is unlikely. Another expla-nation of inner particle contrast is that the inclusions areregions of higher Fe content. If we consider these regions ofreduced contrast as the only source of Fe in the NPs, then the0.26 mass% (cf. ICP-MS data above) does not fit the mass esti-mate of Fe being only 0.02 mass% considering the average“core” size of 3.4 ± 1.0 nm and the average NP diameter of 32 ±5 nm. This brings us to the conclusion that more Fe atoms arestored in the Au matrix than that suggested by TEM. On theother hand, the 0.26 mass% of Fe in the NPs roughly half ofthe 0.6 mass% calculated assuming the initial low-resolutionTEM data: 9 nm iron oxide core, 11.5 nm Au shell thickness(derived from the total NP size) and Fe3O4 and Au densities of5.2 g cm−3 and 19.3 g cm−3, respectively.62,63 This can beexplained either by the prevalence of pure Au NPs, which is un-likely as mentioned above, or by the fact that a core–shellmodel is not (fully) applicable for our system.
More hints about NPs architecture can be obtained by EDXanalysis. Strikingly, the elemental mapping at room tempera-ture (Fig. 2e) shows the homogeneously spread signal of bothiron and gold, without oxygen. It is worth mentioning thatsimilar EDX mapping results were reported by otherauthors;51,64 however, no reasonable explanation has beengiven so far why the predominant accumulation of the Fe andO signals in the center of NPs is missing as expected for mag-netite cores. The authors51 also admit that this could indicateanother type of structure, different from a core–shell geometry.In most of the studies, the overall EDX spectrum showing Feand Au signals (which also holds for our NPs, cf. Fig. S7†), isused as a proof of the Fe3O4 core.26,38,52,65 This approach is,however, questionable since it indicates no correlationbetween the morphology of NPs and the elementaldistribution.
Thus, we assume in the following that all features describedabove – the absence of a defined magnetic core, the size ofNPs, the inclusions and the homogeneous distribution of bothFe and Au within the hybrids and the lack of oxygen – point toan AuFe solid solution. These NPs could be formed duringheterogeneous nucleation of Au NPs on the Fe ions forming ametal cluster.
To the best of our knowledge, room-temperature synthesisof such AuFe hybrid NPs has never been reported. The mostcommon methods for the synthesis of solid solution AuFe NPsinclude gas phase condensation,33,34 laser ablation,35–37 andhigh-temperature decomposition of metal–organicprecursors.66,67 Although the latter gives high NP yield and canbe performed in both water and organic solvents, it stillrequires complex laser equipment and involves extremely highcooling rates to “freeze” the metastable solid solution state athigh Fe content in an Au matrix. Nevertheless, this techniqueallows the programmed synthesis of either core–shell or solidsolution AuFe NPs depending on the target composition andthe particle diameter.35,46,55 In any case, the structure of NPs
was confirmed by HRTEM and EDX measurements, unam-biguously showing that the Fe signal is either concentrated inthe core or uniformly distributed over the entire NP.36 In thepresent study, the correlation between HRTEM and EDX is notstraightforward, most probably, due to the small size andnumber of inclusions and insufficient EDX sensitivity.Thus, we carried out an in situ annealing experiment up to700 °C (Fig. 3) demonstrating the segregation of Fe from theAu matrix. The TEM results are representative for the samplebatch as proven by VSM (Fig. 5). Notably, the final Au/Fehybrids are stable for at least 1 year of air storage (Fig. S8†)and the formation of an fcc Au–bcc Fe epitaxy in a Janusparticle is demonstrated (Fig. 4). To the best of ourknowledge, this is the first report of such an epitaxy for Au/FeJanus hybrids. A similar fcc/bcc orientation relationshipwas observed in the epitaxial growth of Fe on Au(111),68
diffusion bonding in steels,69 martensite transition in Fe70 orinterphase precipitation in low-carbon steels.71 Very recently,bcc Fe cores in Fe@Au core–shell nanoparticles have beenreported.72
Based on the final Au/Fe Janus NP geometry discovered byHRTEM after annealing, we sought to estimate the amount ofFe that can be dissolved in Au for solid solution NPs since thestructural transformation can only lead to the migration of Featoms while their total quantity remains constant.Considering the Fe and Au volumetric densities of 7.9 g cm−3
and 19.3 g cm−3, respectively, and calculating from the Fe-richprojected area the volume of a spherical sector, we end upwith 4 mass% Fe in this AuFe NP, which corresponds to thestoichiometry of Fe13Au87 in the initial solid solution NP,similar to what has been described by Amendola et al. forpulsed laser ablation in liquids.73 If more Fe could be expelledfrom Au at temperatures above 700 °C, this estimate of Fecontent should be read as a lower limit. Thus, the amount ofiron in gold for our NPs is at least twice that of the solubilityin the equilibrium state.
The AuFe solid solution investigated by TEM is naturallyrestricted to a small number of NPs while magnetometry ofmg amounts gives access to the mean values of the entirebatch. From the magnetic response, we determined the Feamount to be 0.14 mass% in the AuFe NPs (or a stoichiometryFe0.5Au99.5), which differs from the ICP-MS result (0.26 mass%and reflects the mean stoichiometry of Fe0.9Au99.1) after HCletching. Considering the very small amount of Fe, however,the deviation is acceptable. More interesting is the comparisonwith the 4 mass% estimated by the annealing experiment(Fig. 3). This shows that the choice of the NP for the TEMinvestigations is important. We have chosen this specific NPbecause the larger inclusion in the as deposited state alsosuggests a larger Fe content in this AuFe NP which in turnmeans that this result rather reflects the upper limit of Fe insolid solution.
Magnetometry revealed the expected T−1-dependence forthe isolated Fe atoms in the Au matrix above T = 50 K furthersupporting the structural and morphological investigations.After HCl etching, however, a small amount of Fe oxides
Paper Nanoscale
10410 | Nanoscale, 2021, 13, 10402–10413 This journal is © The Royal Society of Chemistry 2021
Ope
n A
cces
s A
rtic
le. P
ublis
hed
on 0
6 M
ay 2
021.
Dow
nloa
ded
on 2
/21/
2022
11:
23:3
6 A
M.
Thi
s ar
ticle
is li
cens
ed u
nder
a C
reat
ive
Com
mon
s A
ttrib
utio
n-N
onC
omm
erci
al 3
.0 U
npor
ted
Lic
ence
.View Article Online

remains, which hindered the further detailed evaluation of theAuFe solid solution at low fields and temperatures.Importantly, magnetometry at high temperatures recon-structed the TEM annealing experiment for the entire batch.We extracted two magnetic ordering temperatures, for Fe3O4
(TN = 850 K) and for the segregated Fe in Au/Fe NPs (TC =1006 K). The latter is reduced as compared to the volumetricvalue of 1043 K which we ascribed to the small size of segre-gated Fe segments in the Janus particles.
Towards the applications of the solid solution AuFe NPs, weobtained preliminary data of their optical properties (Fig. S5†),which proved the presence of the expected plasmon resonancepeak at 533 nm. Remarkably, the Fe dissolved in the Au matrixdoes not alter the Au plasmon peak significantly at similarsizes.74–76 Further investigations of the optical properties ofAu/Fe segregated NPs are certainly interesting but out-of-focusof the current work.
Besides magneto-optical and magneto-plasmonic appli-cations the biomedical use of both, solid solution AuFe andsegregated Au/Fe NPs, should be considered in the future. Inthe first step, we tested the toxicity to human cancer cell linesLNCaP and PC-3. The results indicate that the NPs are non-toxic to these cells after 48 hours of co-incubation. In order tooptimize the large-scale production of Janus Au/Fe NPs withsegregated iron and gold phases, it is conceivable to exchangethe polymeric coating on AuFe NPs with a temperature-resist-ant shell such as silica using well-established protocols.77
Such shell would withstand the necessary annealing step forsegregation. Another option would be the ex situ laserirradiation of the solid solution that could heat up the NPs toseveral hundred °C assisted by the plasmon resonance in thens time regime. This would significantly speed up the Fe segre-gation process. Therefore, we believe that this new preparationroute will allow for a variety of theranostic applications such asmagnetic hyperthermia combined with photothermal therapyand dual-mode contrast agents for magnetic resonanceimaging and computer tomography.
Conclusions
Room-temperature synthesis of solid solution fcc AuFe NPs isdemonstrated. Upon annealing to 700 °C, the elements segre-gate to form Au/Fe Janus particles with ferromagnetic bcc Feepitaxially matched to low index fcc Au planes. Based on ourfindings, previous reports using similar protocols may have tobe revisited. AuFe solid solution and Au/Fe Janus particles arevery interesting for biomedical applications and modelling theunderlying physics. Since upscaling of the synthesis methodseems achievable, this preparation route delivers new perspec-tive materials for magnetoplasmonics and theranostics.
Conflicts of interest
There are no conflicts to declare.
Acknowledgements
M. V. E. gratefully acknowledges the support from theHumboldt Research Fellowship for Postdoctoral Researchersprovided by the Alexander von Humboldt Foundation and thesupport from the Add-on Fellowship for Interdisciplinary LifeScience provided by the Joachim Herz Foundation.N. L. K. gratefully acknowledges the support from the RussianFoundation for Basic Research, grant number 18-29-09154.
References
1 S. A. Bansal, V. Kumar, J. Karimi, A. P. Singh and S. Kumar,Nanoscale Adv., 2020, 2, 3764–3787.
2 L. Dykman and N. Khlebtsov, Chem. Soc. Rev., 2012, 41,2256–2282.
3 O. N. Metelkina, R. W. Lodge, P. G. Rudakovskaya,V. M. Gerasimov, C. H. Lucas, I. S. Grebennikov,I. V. Shchetinin, A. G. Savchenko, G. E. Pavlovskaya,G. A. Rance, M. del Carmen Gimenez-Lopez, A. N. Khlobystovand A. G. Majouga, J. Mater. Chem., 2017, 5, 2167–2174.
4 S. Pshenichnikov, A. Omelyanchik, M. Efremova,M. Lunova, N. Gazatova, V. Malashchenko,O. Khaziakhmatova, L. Litvinova, N. Perov, L. Panina,D. Peddis, O. Lunov, V. Rodionova and K. Levada, J. Magn.Magn. Mater., 2021, 523, 167623.
5 Y. A. Nalench, I. V. Shchetinin, A. S. Skorikov,P. S. Mogilnikov, M. Farle, A. G. Savchenko, A. G. Majouga,M. A. Abakumov and U. Wiedwald, J. Mater. Chem. B, 2020,8, 3886–3895.
6 Q. Dong, H. Yang, C. Wan, D. Zheng, Z. Zhou, S. Xie, L. Xu,J. Du and F. Li, Nanoscale Res. Lett., 2019, 14, 235.
7 M. V. Efremova, V. A. Naumenko, M. Spasova,A. S. Garanina, M. A. Abakumov, A. D. Blokhina,P. A. Melnikov, A. O. Prelovskaya, M. Heidelmann, Z.-A. Li,Z. Ma, I. V. Shchetinin, Y. I. Golovin, I. I. Kireev,A. G. Savchenko, V. P. Chekhonin, N. L. Klyachko, M. Farle,A. G. Majouga and U. Wiedwald, Sci. Rep., 2018, 8, 11295.
8 R. A. Revia and M. Zhang, Mater. Today, 2016, 19, 157–168.9 A. Tomitaka, H. Arami, A. Raymond, A. Yndart, A. Kaushik,
R. D. Jayant, Y. Takemura, Y. Cai, M. Toborek and M. Nair,Nanoscale, 2017, 9, 764–773.
10 E. Kozenkova, K. Levada, M. V. Efremova, A. Omelyanchik,Y. A. Nalench, A. S. Garanina, S. Pshenichnikov,D. G. Zhukov, O. Lunov, M. Lunova, I. Kozenkov,C. Innocenti, M. Albino, M. A. Abakumov, C. Sangregorioand V. Rodionova, Nanomaterials, 2020, 10, 1646.
11 H. Cai, K. Li, J. Li, S. Wen, Q. Chen, M. Shen, L. Zheng,G. Zhang and X. Shi, Small, 2015, 11, 4584–4593.
12 D. Maniglio, F. Benetti, L. Minati, J. Jovicich, A. Valentini,G. Speranza and C. Migliaresi, Nanotechnology, 2018, 29,315101.
13 G. Brennan, N. D. Thorat, M. Pescio, S. Bergamino,J. Bauer, N. Liu, S. A. M. Tofail and C. Silien, Nanoscale,2020, 12, 12632–12638.
Nanoscale Paper
This journal is © The Royal Society of Chemistry 2021 Nanoscale, 2021, 13, 10402–10413 | 10411
Ope
n A
cces
s A
rtic
le. P
ublis
hed
on 0
6 M
ay 2
021.
Dow
nloa
ded
on 2
/21/
2022
11:
23:3
6 A
M.
Thi
s ar
ticle
is li
cens
ed u
nder
a C
reat
ive
Com
mon
s A
ttrib
utio
n-N
onC
omm
erci
al 3
.0 U
npor
ted
Lic
ence
.View Article Online

14 P. Guardia, S. Nitti, M. E. Materia, G. Pugliese, N. Yaacoub,J.-M. Greneche, C. Lefevre, L. Manna and T. Pellegrino,J. Mater. Chem. B, 2017, 5, 4587–4594.
15 K. C.-F. Leung, S. Xuan, X. Zhu, D. Wang, C.-P. Chak,S.-F. Lee, W. K.-W. Ho and B. C.-T. Chung, Chem. Soc. Rev.,2012, 41, 1911–1928.
16 A. Tomitaka, S. Ota, K. Nishimoto, H. Arami, Y. Takemuraand M. Nair, Nanoscale, 2019, 11, 6489–6496.
17 M. V. Efremova, M. M. Veselov, A. V. Barulin, S. L. Gribanovsky,I. M. Le-Deygen, I. V. Uporov, E. V. Kudryashova, M. Sokolsky-Papkov, A. G. Majouga, Y. I. Golovin, A. V. Kabanov andN. L. Klyachko, ACS Nano, 2018, 12, 3190–3199.
18 A. Majouga, M. Sokolsky-Papkov, A. Kuznetsov, D. Lebedev,M. Efremova, E. Beloglazkina, P. Rudakovskaya, M. Veselov,N. Zyk, Y. Golovin, N. Klyachko and A. Kabanov, ColloidsSurf., B, 2015, 125, 104–109.
19 R. Henning, F. Liebig, C. Prietzel, B. Klemke and J. Koetz,Colloids Surf., A, 2020, 600, 124913.
20 P. G. Rudakovskaya, D. N. Lebedev, M. V. Efremova,E. K. Beloglazkina, N. V. Zyk, N. L. Klyachko, Y. I. Golovin,A. G. Savchenko and A. G. Mazhuga, Nanotechnol. Russ.,2016, 11, 144–152.
21 P. Quaresma, I. Osório, G. Dória, P. A. Carvalho, A. Pereira,J. Langer, J. P. Araújo, I. Pastoriza-Santos, L. M. Liz-Marzán,R. Franco, P. V. Baptista and E. Pereira, RSC Adv., 2013, 4,3659–3667.
22 T. T. Nguyen, F. Mammeri and S. Ammar, Nanomaterials,2018, 8, 149.
23 S. V. Salihov, Y. A. Ivanenkov, S. P. Krechetov, M. S. Veselov,N. V. Sviridenkova, A. G. Savchenko, N. L. Klyachko,Y. I. Golovin, N. V. Chufarova, E. K. Beloglazkina andA. G. Majouga, J. Magn. Magn. Mater., 2015, 394, 173–178.
24 T. Härtling, T. Uhlig, A. Seidenstücker, N. C. Bigall, P. Olk,U. Wiedwald, L. Han, A. Eychmüller, A. Plettl, P. Ziemannand L. M. Eng, Appl. Phys. Lett., 2010, 96, 183111.
25 T. Uhlig, U. Wiedwald, A. Seidenstücker, P. Ziemann andL. M. Eng, Nanotechnology, 2014, 25, 255501.
26 J. L. Lyon, D. A. Fleming, M. B. Stone, P. Schiffer andM. E. Williams, Nano Lett., 2004, 4, 719–723.
27 J. Ren, F. Wang, G. Wei, Y. Yang, Y. Liu, M. Wei, Y. Huan,A. C. Larson and Z. Zhang, PLoS One, 2012, 7, e38350.
28 Y. Li, J. Liu, Y. Zhong, J. Zhang, Z. Wang, L. Wang, Y. An,M. Lin, Z. Gao and D. Zhang, Int. J. Nanomed., 2011, 6,2805–2819.
29 X. Chao, F. Shi, Y.-Y. Zhao, K. Li, M.-L. Peng, C. Chen andY.-L. Cui, Pharmazie, 2010, 65, 500–504.
30 J. Lee, Y. Lee, J. K. Youn, H. B. Na, T. Yu, H. Kim, S.-M. Lee,Y.-M. Koo, J. H. Kwak, H. G. Park, H. N. Chang, M. Hwang,J.-G. Park, J. Kim and T. Hyeon, Small, 2008, 4, 143–152.
31 C. Hui, C. Shen, J. Tian, L. Bao, H. Ding, C. Li, Y. Tian,X. Shi and H.-J. Gao, Nanoscale, 2011, 3, 701–705.
32 H. Fuse, N. Koshizaki, Y. Ishikawa and Z. Swiatkowska-Warkocka, Nanomaterials, 2019, 9, 198.
33 V. Velasco, D. Pohl, A. Surrey, A. Bonatto-Minella,A. Hernando, P. Crespo and B. Rellinghaus,Nanotechnology, 2014, 25, 215703.
34 Z. Fan and H. Zhang, Chem. Soc. Rev., 2016, 45, 63–82.35 P. Wagener, J. Jakobi, C. Rehbock, V. S. K. Chakravadhanula,
C. Thede, U. Wiedwald, M. Bartsch, L. Kienle andS. Barcikowski, Sci. Rep., 2016, 6, 23352.
36 A. Tymoczko, M. Kamp, O. Prymak, C. Rehbock, J. Jakobi,U. Schürmann, L. Kienle and S. Barcikowski, Nanoscale,2018, 10, 16434–16437.
37 D. Zhang, B. Gökce and S. Barcikowski, Chem. Rev., 2017,117, 3990–4103.
38 C. K. Lo, D. Xiao and M. M. F. Choi, J. Mater. Chem., 2007,17, 2418–2427.
39 L. Heinemann, G. R. Simpson, A. Boxall, T. Kottke,K. L. Relph, R. Vile, A. Melcher, R. Prestwich,K. J. Harrington, R. Morgan and H. S. Pandha, BMCCancer, 2011, 11, 221.
40 L. Wang, J. Luo, Q. Fan, M. Suzuki, I. S. Suzuki,M. H. Engelhard, Y. Lin, N. Kim, J. Q. Wang andC.-J. Zhong, J. Phys. Chem. B, 2005, 109, 21593–21601.
41 H. Montazeri, A. Amani, H. R. Shahverdi, E. al D. Haratifarand A. R. Shahverdi, J. Nanostruct. Chem., 2013, 3, 25.
42 F. Shi, W. Hui, Y. Cui and C. Chen, Nano, 2011, 06, 145–151.
43 S. V. Salikhov, A. G. Savchenko, I. S. Grebennikov andE. V. Yurtov, Bull. Russ. Acad. Sci.: Phys., 2015, 79, 1106–1112.
44 M. V. Efremova, Y. A. Nalench, E. Myrovali, A. S. Garanina,I. S. Grebennikov, P. K. Gifer, M. A. Abakumov, M. Spasova,M. Angelakeris, A. G. Savchenko, M. Farle, N. L. Klyachko,A. G. Majouga and U. Wiedwald, Beilstein J. Nanotechnol.,2018, 9, 2684–2699.
45 H. S. C. O’Neill and W. A. Dollase, Phys. Chem. Miner.,1994, 20, 541–555.
46 M. Kamp, A. Tymoczko, U. Schürmann, J. Jakobi,C. Rehbock, K. Rätzke, S. Barcikowski and L. Kienle, Cryst.Growth Des., 2018, 18, 5434–5440.
47 A. R. Kaufmann, S. T. Pan and J. R. Clark, Rev. Mod. Phys.,1945, 17, 87–92.
48 M. E. Gruner, J. Phys. D: Appl. Phys., 2010, 43, 474008.49 H. C. Herper, E. Hoffmann and P. Entel, Phys. Rev. B:
Condens. Matter Mater. Phys., 1999, 60, 3839–3848.50 K. M. Krishnan, Fundamentals and Applications of Magnetic
Materials, Oxford University Press, 2016.51 A. Luchini, G. Vitiello, F. Rossi, O. Ruiz De Ballesteros,
A. Radulescu, G. D’Errico, D. Montesarchio, C. de JuliánFernández and L. Paduano, Phys. Chem. Chem. Phys., 2015,17, 6087–6097.
52 I. Robinson, L. D. Tung, S. Maenosono, C. Wälti andN. T. K. Thanh, Nanoscale, 2010, 2, 2624–2630.
53 H.-Y. Xie, R. Zhen, B. Wang, Y.-J. Feng, P. Chen and J. Hao,J. Phys. Chem. C, 2010, 114, 4825–4830.
54 M. Mandal, S. Kundu, S. K. Ghosh, S. Panigrahi, T. K. Sau,S. M. Yusuf and T. Pal, J. Colloid Interface Sci., 2005, 286,187–194.
55 A. Tymoczko, M. Kamp, C. Rehbock, L. Kienle,E. Cattaruzza, S. Barcikowski and V. Amendola, NanoscaleHoriz., 2019, 4, 1326–1332.
Paper Nanoscale
10412 | Nanoscale, 2021, 13, 10402–10413 This journal is © The Royal Society of Chemistry 2021
Ope
n A
cces
s A
rtic
le. P
ublis
hed
on 0
6 M
ay 2
021.
Dow
nloa
ded
on 2
/21/
2022
11:
23:3
6 A
M.
Thi
s ar
ticle
is li
cens
ed u
nder
a C
reat
ive
Com
mon
s A
ttrib
utio
n-N
onC
omm
erci
al 3
.0 U
npor
ted
Lic
ence
.View Article Online

56 Y. Jin, C. Jia, S.-W. Huang, M. O’Donnell and X. Gao, Nat.Commun., 2010, 1, 41.
57 X. Zhao, Y. Cai, T. Wang, Y. Shi and G. Jiang, Anal. Chem.,2008, 80, 9091–9096.
58 A. G. M. da Silva, T. S. Rodrigues, S. J. Haigh andP. H. C. Camargo, Chem. Commun., 2017, 53, 7135–7148.
59 S. Pedireddy, H. K. Lee, W. W. Tjiu, I. Y. Phang, H. R. Tan,S. Q. Chua, C. Troadec and X. Y. Ling, Nat. Commun., 2014,5, 4947.
60 G. W. Nyce, J. R. Hayes, A. V. Hamza and J. H. Satcher,Chem. Mater., 2007, 19, 344–346.
61 J. Depciuch, M. Stec, A. Maximenko, J. Baran andM. Parlinska-Wojtan, J. Mater. Sci., 2020, 55, 5257–5267.
62 T. L. Brown, H. E. LeMay, B. E. Bursten and B. E. Bursten,Chemistry: the central science, Prentice Hall Englewood Cliffs,NJ, 1994, vol. 8.
63 L. Blaney, Lehigh Rev., 2007, 15, 33.64 I. Y. Goon, L. M. H. Lai, M. Lim, P. Munroe, J. J. Gooding
and R. Amal, Chem. Mater., 2009, 21, 673–681.65 T. T. Hien Pham, C. Cao and S. J. Sim, J. Magn. Magn.
Mater., 2008, 320, 2049–2055.66 H. L. Liu, J. H. Wu, J. H. Min and Y. K. Kim, J. Appl. Phys.,
2008, 103, 07D529.67 I.-C. Chiang and D.-H. Chen, Adv. Funct. Mater., 2007, 17,
1311–1316.
68 H. F. Jurca, A. Damian, C. Gougaud, D. Thiaudière,R. Cortès, F. Maroun and P. Allongue, J. Phys. Chem. C,2016, 120, 16080–16089.
69 Y. Gao, Z. Wang, Y. Liu, W. Li, C. Liu and H. Li, Metals,2018, 8, 1012.
70 L. Sandoval, H. M. Urbassek and P. Entel, New J. Phys.,2009, 11, 103027.
71 Y.-J. Zhang, G. Miyamoto, K. Shinbo and T. Furuhara, Scr.Mater., 2013, 69, 17–20.
72 M. Kamp, A. Tymoczko, R. Popescu, U. Schürmann,R. Nadarajah, B. Gökce, C. Rehbock, D. Gerthsen,S. Barcikowski and L. Kienle, Nanoscale Adv., 2020, 2, 3912–3920.
73 V. Amendola, M. Meneghetti, O. M. Bakr, P. Riello,S. Polizzi, D. H. Anjum, S. Fiameni, P. Arosio, T. Orlando,C. de Julian Fernandez, F. Pineider, C. Sangregorio andA. Lascialfari, Nanoscale, 2013, 5, 5611–5619.
74 D. L. Fedlheim and C. A. Foss, Metal Nanoparticles: Synthesis,Characterization, and Applications, CRC Press, 2001.
75 P. N. Njoki, I.-I. S. Lim, D. Mott, H.-Y. Park, B. Khan,S. Mishra, R. Sujakumar, J. Luo and C.-J. Zhong, J. Phys.Chem. C, 2007, 111, 14664–14669.
76 V. Amendola, S. Scaramuzza, S. Agnoli, S. Polizzi andM. Meneghetti, Nanoscale, 2014, 6, 1423–1433.
77 L. M. Liz-Marzán, M. Giersig and P. Mulvaney, Langmuir,1996, 12, 4329–4335.
Nanoscale Paper
This journal is © The Royal Society of Chemistry 2021 Nanoscale, 2021, 13, 10402–10413 | 10413
Ope
n A
cces
s A
rtic
le. P
ublis
hed
on 0
6 M
ay 2
021.
Dow
nloa
ded
on 2
/21/
2022
11:
23:3
6 A
M.
Thi
s ar
ticle
is li
cens
ed u
nder
a C
reat
ive
Com
mon
s A
ttrib
utio
n-N
onC
omm
erci
al 3
.0 U
npor
ted
Lic
ence
.View Article Online