romanian journal of biology plant biologymail.ibiol.ro/plant/volume 56/rom.j.biol.-plant biol... ·...
TRANSCRIPT

ROMANIAN JOURNAL OF BIOLOGY
PLANT BIOLOGY
VOLUME 56, No. 1 2011
C O N T E N T S
MARIA-MIHAELA ANTOFIE, Nagoya Protocol on Access and Benefit Sharing to the Convention on Biological Diversity – Scientific considerations for Romania........................................................................................................ 3
R. PACHIYAPPAN, K. SARAVANAN, Genetic variability and correlation for yield and fruit quality characters of bhendi................................................... 11
MATIN MIRYEGANEH, ALI MOVAFEGHI, Karyotype analysis in some species of Allium section Allium (Alliaceae) ................................................ 17
M.R. WANI, S. KHAN, M. I. KOZGAR, An assessment of high yielding M3 mutants of green gram (Vigna radiata (L.) Wilczek) ................................... 29
K.V. AJAYAN, M. SELVARAJU, Response of temperature and pH on the growth and biochemical changes in Spirulina platensis ............................... 37
I.O. EZEIBEKWE, Study of chemical constituents of citrus plantation soils and citrus plant materials under severe decline (dieback) at the Nigeria Institute of Horticultural Research (NIHORT) ........................................................... 43
M. PANCHAL, K. MURTI, M. SHAH, Preliminary phytochemical and pharmacognostical studies of Moringa oleifera roots................................... 57
R. SELVARAJU, G. THIRUPPATHI, R.G. RAMAN, D. DHAKSHANAMOORTHY, Estimation of essential and trace elements in the medicinal plant Tribulus terrestris by ICP-OES and flame photometric techniques ............................ 65
ROM. J. BIOL. – PLANT BIOL., VOLUME 56, No 1, P. 1–76, BUCHAREST, 2011


NAGOYA PROTOCOL ON ACCESS AND BENEFIT SHARING TO THE CONVENTION ON BIOLOGICAL DIVERSITY –
SCIENTIFIC CONSIDERATIONS FOR ROMANIA
MARIA-MIHAELA ANTOFIE1
Romania capacity building needs in the access to genetic resources domain are analyzed in this article. As a signatory Party to the Convention on Biological Diversity, since 1994, our country agreed in 2010 at the 10th Conference of the Parties to adopt the decision regarding the Nagoya Protocol on Access and Benefit Sharing to the Convention on Biological Diversity. This Protocol is a successful result of the Conference of the Parties to the Convention, after six years of negotiations at international level and after the adoption in 2002 of the non-legally binding Bonn Guidelines. Through this assessment we recommend that Romania should get involved in the process of capacity building analysis and development for being able to appropriately respond as a signatory Party to the Convention to all requirements imposed at the international level to all Parties through this Protocol. Key words: Access for benefit sharing, genetic resources, capacity building.
INTRODUCTION
An estimation regarding the species diversity all over the world considers that in 2000 there were described about 1.75 million species whereas the estimation of the total number of species may vary between 7 and 20 million (Groombridge & Jenkins 2000). Based on taxonomical studies started for more than 100 years before the adoption of the Convention on Biological Diversity in 1992, Romania recorded until today, according to official data, around 48.000 species (i.e. plants, animals and some fungi). However, the inventory of species is not finalized and much effort should be done in order to have scientific, technical administrative capacities to implement all Convention’s provisions. Regarding the access to genetic resources – in science – there is no capacity developed for fulfilling the third objective of the Convention, especially the provisions of Art. 15.
This article is assessing from scientific point of view the capacity building needs for Romania in order to implement a new multilateral environment agreement based on the Art. 15 of the Convention: the Nagoya Protocol on Access to Genetic Resources and the Fair and Equitable Sharing of Benefits Arising from
1 “Lucian Blaga” University from Sibiu, Faculty of Agronomy, Food Industry and Environment
Protection, 31 Oituz str., Sibiu, Romania, [email protected] ROM. J. BIOL. – PLANT BIOL., VOLUME 56, No 1, P. 3–9, BUCHAREST, 2011

4 Maria-Mihaela Antofie 2
their Utilization to the Convention on Biological Diversity (29 October 2010, during the 10th Conference of the Parties to the Convention on Biological Diversity in Nagoya, Japan).
MATERIAL AND METHODS
Based on the analysis of international multilateral environment agreements ratified or adopted by Romania and applying Albert Humphrey’ SWOT analysis (Strengths, Weaknesses, Opportunities, and Threats) of the legislation and also Negotiators’ terms of references this article is realized.
RESULTS AND DISCUSSION
The Convention on Biological Diversity – as the first and the main comprehensive multilateral environmental agreement dealing with the concept of “biodiversity” – was signed in 1992 after three years of negotiations at the global level – being ratified by Romania through the Law no. 58/1998. Still, political commitments addressed through the original text of the Convention are not easy to be implemented especially due to the not completely defined use of terms (e.g. derivatives). Among these a very important legally binding commitment is addressed through the provisions of Art. 6 of the Convention regarding the general measures for conservation and sustainable use of biodiversity. Thus, Romania is obliged starting with the year of ratification (1994) to adopt a strategic action plan for the further implementation of the Convention’s provisions. Unfortunately, Romania never adopted through a Governmental Decision such a Strategy and Action Plan making impossible to comply with the political commitments as a Party to the Convention.
The Convention developed further based on its own provisions and based on decisions adopted through the decisional body (i.e. Conference of Parties to the Convention is the decisional body of the Convention). Thus, after 8 years, based on the provisions of art. 8 g and 19 it was adopted the Cartagena Protocol on Biosafety in 2000 Montreal, Canada and after 18 years it was adopted the Nagoya Protocol on Access to Genetic Resources and the Fair and Equitable Sharing of Benefits Arising from their Utilization to the Convention on Biological Diversity (29 October 2010, COP10, Nagoya, Japan – based on the provisions of Art. 15 of the Convention).
The main objective of the Nagoya Protocol is the fair and equitable sharing of the benefits arising from the utilization of genetic resources, including by appropriate access to genetic resources and by appropriate transfer of relevant technologies, taking into account all rights over those resources and to technologies, and by appropriate funding, thereby contributing to the conservation

3 Nagoya Protocol on Access and Benefit Sharing 5
of biological diversity and the sustainable use of its components (Art. 1). Through this Protocol the Convention responds to the third objective established in 1992: fair and equitable sharing of the benefit arising from the utilization of genetic resources in support of the conservation and sustainable use of biological diversity. Considering the third objective of the Convention it can be said that the today fundamental research in genomics, proteomics and metabolomics is practicing the accession of genetic resources. Still for the future, if new innovative research in these domains will be focused for technology transfer development and benefit arising from the process of accessing genetic resources, the institutions responsible with such research will have to comply with the provisions of the Nagoya Protocol.
According to Art. 2 of the Protocol the Parties agreed to adopt couples of concepts – very much debated during the negotiation process – such as “derivatives” and “utilization of genetic resources”. Thus, according to these concepts not only genes but also biochemical compounds are of interest to be covered by the provisions of the Nagoya Protocol – when it is considered the use of genetic resources. This is due also to the last century results in science as after almost 20 years of science starting with 1992 also biological concepts developed considering only the case of “gene”, “genome”, “junk genome”, etc. and being of particular use for the Nagoya Protocol.
In Romania, the fundamental research is developing progressively and in the same manner also the applied research in biotechnology which is accessing derivatives, biochemical and genetic compounds. As a consequence the new research strategy should also focus on analysing capacity building needs for development in this domain in order to properly implement the provisions of Art. 15 of the Convention, Bonn Guidelines (adopted in 2002) and in the case Romania will ratify the new Nagoya Protocol – to comply to all provisions regarding the new international regime of access for benefit sharing.
Based on the provisions of Art. 3, this Protocol will apply also to the traditional knowledge associated with genetic resources which fall within the scope of the Convention for fair and equitable sharing of the benefits arising from the utilization of such knowledge. Thus, Nagoya Protocol is also responding to the provisions of Art. 8 j of the Convention (i.e. it targets especially the traditional knowledge preservation and maintenance). Today Romania has no legal provisions regarding the need for survey, monitoring, preservation and promotion of traditional knowledge associated with biological diversity – in terms of genetic resources (e.g. not for research, use or innovation).
Art. 5 is treating the fair and benefit sharing arising from the access of genetic resources as genes or biochemical compounds. For contracting Parties it is a legally binding commitment that in case Romania ratifies the Nagoya Protocol it shall take legislative, administrative or policy measures, as appropriate, with the aim of ensuring that benefits arising from the utilization of genetic resources that

6 Maria-Mihaela Antofie 4
are held by indigenous and local communities, in accordance with domestic legislation regarding the established rights of these indigenous and local communities over these genetic resources, are shared in a fair and equitable way with the communities concerned, based on mutually agreed terms. In our country indigenous local communities do not exist and the Romanian legislation is not covering local communities’ rights over their own genetic resources. Moreover, Romania needs to further develop scientific, technical and political measures regarding genetic resources identification and monitoring based on the provisions of Annex 1 of the Convention and also regarding the fair and equitable sharing of benefits arising from their utilization.
For “traditional knowledge” it is important to assess and survey the links and associations with biological diversity conservation and further to explore their potential use in innovations and practices based on the provisions of Art. 8 j of the Convention. This process needs investments for Romania in capacity building, especially in communication tools and methods, in order to be able to properly respond to the provisions of Art. 5 of the Nagoya Protocol. For the research strategy in our country local communities owning traditional knowledge in relation to the access of genetic resources should be involved in the research programmes for developing innovations and practices.
According to the provisions of Art. 6 “access to genetic resources” all Parties including Romania should develop their own administrative capacities for granting access to genetic resources. New administrative procedures should be in place in Romania for fulfilling the provisions of this article including the development of a Clearing-House Mechanism. It will be financially difficult to implement the provisions of Art. 6 g) of the protocol as Romania will be obliged to establish clear rules and procedures for requiring and establishing mutually agreed terms (MAT) for contracting Parties which should include, inter alia: (i) a dispute settlement clause; (ii) Terms on benefit-sharing, including in relation to intellectual property rights; (iii) Terms on subsequent third-party use, if any; and (iv) Terms on changes of intent, where applicable. Such rules will be probably harmonized at the EU level at least at political level for all the EU Member States. Still, for fundamental research the Nagoya Protocol is not an administrative burden but it becomes more in case of technology transfer for benefit arising from the accession of genetic resources.
Art. 7 is proposing the main provisions for traditional knowledge associated with access to genetic resources. Also, based on these provisions Romania should further develop new administrative and technical measures for the appropriate implementation of the prior informed consent (PIC) procedure. Specific provisions regarding traditional knowledge associated to genetic resources are further detailed in the context of Art. 12.
Special considerations are in relation with the provisions of Art. 8 – regarding research promotion, safe use of genetic resources and the importance of
5 Nagoya Protocol on Access and Benefit Sharing 7
genetic resources for food and agriculture and their special role for food security. Based on Art. 9 provisions new financial measures should be developed to support the conservation of biological diversity and the sustainable use of its components. Still, political commitments are considered here for the future Conferences of the Parties and future guidelines will be adopted for the process of harmonizing technical measures in a regional context.
Art. 10 is considering the need for developing a global multilateral benefit sharing mechanism and probably it will be based on the existing model provided through the Global Benefit Sharing Mechanism of the Plant Treaty (International Treaty on Plant Genetic Resources for Food and Agriculture, 2004). Based on the provisions of Art. 11 legal and technical measures should be developed with the aim of solving possible transboundary issues arising between Parties and specific considerations regarding the national focal points responsibilities are underlined in Art. 13 including capacity building.
Very important for Parties is Art. 17 where any signatory Party is obliged to implement a harmonized mechanism for monitoring the utilization of genetic resources and for transparency enhancement. However, this might be considered to a certain extent as being contradictory to Art. 15.1 of the Convention which states that it recognizing the sovereign rights of States over their natural resources, the authority to determine access to genetic resources rests with the national governments and is subject to national legislation. At this point the adoption of the Convention at international level creates already challenges to the Food and Agriculture Organization (FAO) which before 1991 considered that the genetic resources belong to the world heritage and as a consequence it was modified through the adoption of the FAO Resolution 3/91 based on the provisions of Art. 15. 1. of the Convention.
Actually, 1992 was the year shifting the world vision regarding the people’s rights over their natural resources creating new challenges, barriers and opportunities for the human civilization. According to the provisions of the Convention all Parties have obligations regarding their own rights to determine the conditions upon which their resources could be accessed. From political point of view we consider 2010 as a year of a new shift regarding the countries rights over genetic resources. Thus, even if countries have their own rights over their genetic resources still at the international level as they are signatory Parties to the Convention they are obliged to harmonize their regulatory framework regarding the access to genetic resources including the need for implementation of a transparent global mechanism for monitoring this.
In other words, the acceptance of Art. 17 as legally binding provisions is creating opportunities for the free global access to genetic resources and from another perspective all genetic resources become again part of the world heritage such as it was established earlier before 1991 at least for the fundamental research.

8 Maria-Mihaela Antofie 6
Based on the provisions of Art. 17, each accessed genetic resource is inventoried and it will receive from the date of accession a “unique identifier”; probably in a similar way it is now used for modern biotechnology. Only considering the needs for capacity building evaluation, development and functioning the signatory Parties to the Convention should expect to increase their costs for the effective implementation of Art. 17 provisions.
Further on in Art. 22 it is recognized the need for legislation harmonization from national to regional and international levels. This article is providing the framework for capacity building requirements from the national level up to the international level. However, being recognized the regional context for Parties it might be important for Romania to further consider the development of such capacities including the negotiation capacity in close connection with the European Union perspectives for harmonizing legislation in a regional context including Central Easter-European countries.
CONCLUSION
Through the Nagoya Protocol, the entire world is committed to properly implement the third objective of the Convention on Biological Diversity in close cooperation with Cartagena Protocol for the conservation and sustainable use of biodiversity.
Benefit sharing arising from the access to genetic resources is one of the very important tasks of the Parties which now set the main legally binding measures and guidelines at the international level for developing at national levels and harmonizing in a regional and international context their own capacities in order to implement the provisions of the Nagoya Protocol. The process will not be easy and for developing harmonized guidelines focused mainly for implementing some of the legally binding provisions it may take couples of years of intensive work and negotiations at the international and regional levels. Under such circumstances Romania should closely cooperate for the appropriate negotiation processes at scientific, technical and political levels in the European context.
Furthermore, each contracting Party should create synergies for the appropriate implementation of the Convention and its protocols and also synergies with the other two Rio Conventions (UN Framework Convention for Climate Change and UN Convention for Combating Desertification).
However, the adoption of Nagoya Protocol at the global level is a clear signal for further supporting research in genomics, proteomics and metabolomics for developing innovations and practices in supporting the conservation and sustainable use of biodiversity.

7 Nagoya Protocol on Access and Benefit Sharing 9
As a final concluding remark Romania should develop new communication tools and methods for up-dating the research strategy at national level in order to fulfil the Conventions and Nagoya Protocol requirements.
REFERENCES
1. Bonn Guidelines on Access to Genetic Resources and Fair and Equitable Sharing of the Benefits Arising out of their Utilization, 2002, http://www.cbd.int/doc/publications/cbd-bonn-gdls-en.pdf.
2. Cartagena Protocol on Biosafety to the Convention on biological diversity – text and annexes, 2000, http://www.cbd.int/doc/legal/cartagena-protocol-en.pdf.
3. Convention on biological diversity, text and annexes, 1992, http://www.cbd.int/doc/legal/cbd-en.pdf
4. Groombridge, B., M. Jenkins, 2000, Global Biodiversity, Earth's Living Resources in the 21st Century, World Conservation Monitoring Centre, World Conservation Press, Cambridge, U.K., p. 12.
5. International Treaty on Plant Genetic Resources for Food and Agriculture, 2004, http://www. planttreaty.org/texts_en.htm.
6. Nagoya Protocol on Access to Genetic Resources and the Fair and Equitable Sharing of Benefits Arising from their Utilization to the Convention on Biological Diversity, 2010 http://www.cbd.int/abs/doc/protocol/nagoya-protocol-en.pdf.
7. Resolution 3/91 Annex 3 to the International Undertaking on plant genetic resources, 1991, http://www.fao.org/docrep/x5587E/x5587e06.htm#e.%20commission%20on%20plant%20genetic%20resources%20and%20international%20undertaking:%20progress.


GENETIC VARIABILITY AND CORRELATION FOR YIELD AND FRUIT QUALITY CHARACTERS OF BHENDI
R. PACHIYAPPAN∗, K. SARAVANAN
Bhendi (Abelmoschus esculentus) is a most common vegetable crop cultivated for its tender, nutritive fruits. It is well adopted suitable for cultivation all round the year for providing continuous income to the farmer. An experiment was conducted to study the genetic variability and correlation in bhendi, involving 40 genotypes for eight important economic characters, namely days to first flowering, plant height, number of branches per plant, number of fruiting nodes, fruit length, fruit girth, fruit weight, fruit yield per plant. High PCV and GCV were observed for the traits fruit girth, fruit weight, fruit yield per plant. Majority of the traits were recorded high heritability. For fruit weight and fruit yield per plant, high heritability coupled with high genetic advance as per cent of mean were observed. The results indicated the inverse relationship between fruit weight and fruit yield per plant. Fruit yield per plant was positively and significantly correlated with fruit girth, fruit length, number of fruiting nodes, number of branches per plant and plant height, whereas, fruit yield per plant had negative and significant correlation with days to first flowering.
Key words: Bhendi, genetic variability, heritability, genetic advance, correlation.
INTRODUCTION
The progress in breeding for yield and its contributing characters of any crop is polygenetically controlled, environmentally influenced and determined by the magnitude and nature of their genetic variability (Wright, 1935 and Fisher, 1981). Genetic variability, character association and path coefficients are pre-requisites for improvement of any crop including bhendi for selection of superior genotypes and improvement of any trait (Krishnaveni et al., 2006). It is very difficult to judge whether observed variability is highly heritable or not. Moreover, knowledge of heritability is essential for selection based improvement as it indicates the extent of transmissibility of a character into future generations. Knowledge of correlation between yield and its contributing characters are basic and foremost endeavour to find out guidelines for plant selection. Keeping in view the above facts, the present investigation was undertaken to know variability and correlation among yield and its contributing characters using 40 bhendi genotypes.
Department of Genetics and Plant Breeding, Faculty of Agriculture, Annamalai University,
Annamalai Nagar – 608 002, Cuddalore District, Tamilnadu, India. ∗[email protected]
ROM. J. BIOL. – PLANT BIOL., VOLUME 56, No 1, P. 11–15, BUCHAREST, 2011
12 R. Pachiyappan, K. Saravanan 2
MATERIALS AND METHODS
The experiment comprised of 40 genotypes of bhendi grown during February 2009 at the plant breeding farm (11º24" latitude, 79º44"E longitude and + 5.79 M MSL), Faculty of Agriculture, Annamalai University located at Tamilnadu, India with soil pH of 8 to 8.5 and EC 2.51 to 2.8 dsm-1 in a randomized block design with three replications. Seeds were sown in spacing of 45 × 30 cm between and within rows respectively. All the recommended package of practices were followed to raise a good crop. For this study, genetic variability and correlation of yield contributing and fruit quality traits viz., days to first flowering, plant height, number of branches per plant, number of fruiting nodes, fruit length, fruit girth, fruit weight and fruit yield per plant were recorded on five randomly selected plants in each replication. The variability was estimated as per procedure for analysis of variance suggested by Panse and Sukhatme (1985), GVC and PCV by Burton and De Vane (1953). Heritability and genetic advance by Johnson et al. (1955). Correlation coefficient was worked as per Al-Jibouri et al. (1958).
RESULTS AND DISCUSSION
The analysis of variance revealed significant differences among the genotypes for all the characters studied (Table 1). A close relationship between GCV and PCV was observed in all characters and PCV values were slightly greater than GCV, revealing very little influence of environment for their expression. More than 60 per cent heritability was observed for four characters viz., plant height, fruit length, fruit weight and fruit yield per plant which indicated good scope of selection (Table 2). High heritability along with high values of genetic advance were observed for fruit weight and fruit yield per plant. In the present investigation, the characters, namely number of fruiting nodes, fruit length, fruit weight and fruit yield per plant had a favourable value of GCV accompanied with heritability and genetic advance as per cent of mean which indicated additive gene action and good scope for selection. Johnson et al. (1955) suggested that high GCV along with high heritability and genetic advance gave a better picture for the selection of genotypes. Similar results were also reported by Sarkar et al (2007), Anbanandan et al. (2009) and Sabesan et al. (2009).
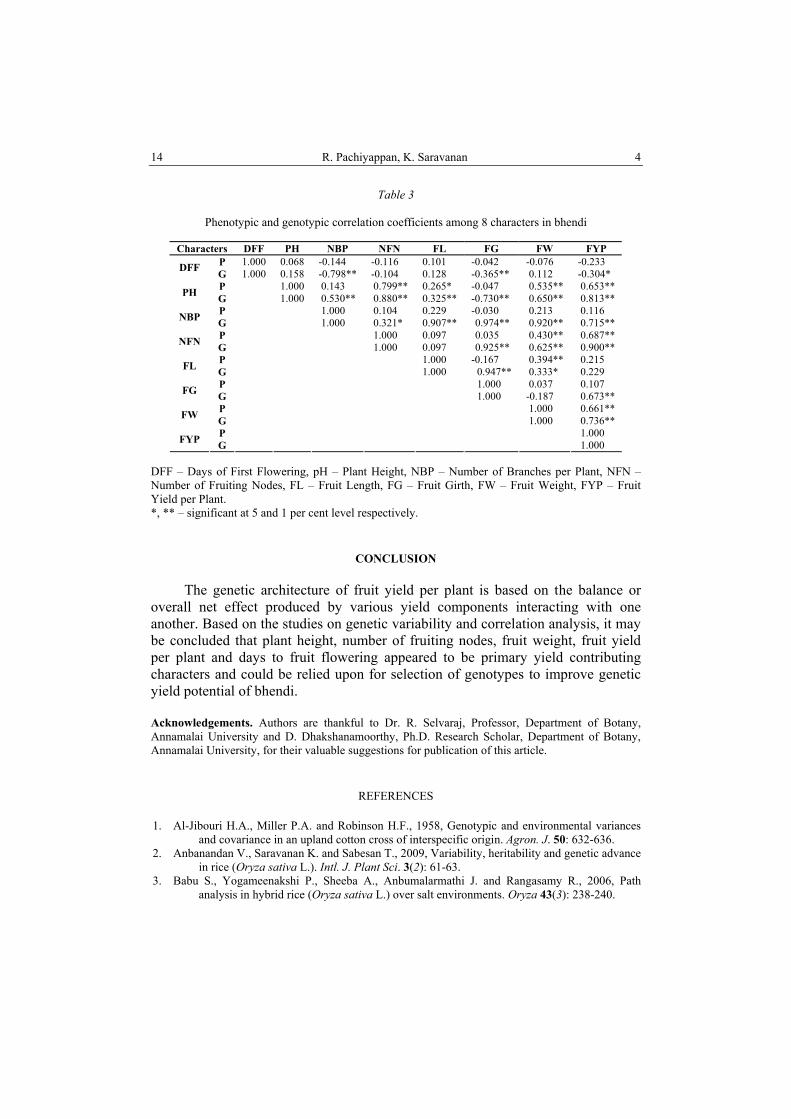
Genotypic correlations were observed to be greater than the corresponding phenotypic correlation coefficients for all the characters indicating the superiority of phenotypic expression under the influence of environmental factors (Table 3).
Fruit yield per plant recorded a positive and significant correlation with plant height (0.81), number of fruiting nodes (0.90) and fruit weight (0.74) at both genotypic and phenotypic levels while it recorded a positive correlation with the number of branches per plant (0.72) and fruit girth (0.67) at genotypic level only. This corroborates with findings of Yugandhar Reddy et al. (2008), Babu et al.

3 Genetic variability for yield and fruit quality characters of bhendi 13
(2006) and Saravanan and Sabesan (2009). It suggests that priority should be given to these traits while making selection for fruit yield improvement. Plant height recorded a significant positive correlation with the number of fruiting nodes (0.79 and 0.88), fruit length (0.27 and 0.33) and fruit weight (0.54 and 0.65) at both levels and with the number of branches per plant (0.53) at genotypic level alone. The number of fruiting nodes exhibited a significant positive correlation with fruit weight (0.43 and 0.63) at both levels and fruit girth (0.93) at genotypic level alone. It suggests that interdependency of these characters should be given due consideration in selection programme. Days to first flowering showed a negatively significant correlation that was observed between number of branches per plant, fruit girth and fruit yield per plant at genotypic level only. Fruit length exhibited a significant positive correlation with fruit weight (0.39 and 0.33) at both levels and with fruit girth (0.95) at genotypic level only.
Table 1
Analysis of variance for eight characters in bhendi
MSS
Source df Days to first
flowering
Plant height
No. of branches per plant
No. of fruiting nodes
Fruit length
Fruit girth
Fruit weight
Fruit yield per
plant Replication 1 37.82 35.19 0.05 0.31 5.41 41.62 0.63 2195.0 Genotypes 39 5.11** 44.53** 0.22* 9.97** 5.45** 54.51** 23.70** 5173.85** Error 39 1.89 4.82 0.20 2.95 1.12 52.30 2.59 817.77 * – significant at 5 per cent level. ** – significant at 1 per cent level.
Table 2
Variability, heritability and genetic advance for 8 characters in 40 genotypes of bhendi
Variability (%) Characters Range Mean PCV GCV Heritability BS
(%) Genetic advance as
% of mean Days to first
flowering 31.50-37.00 34.04 5.50 3.73 46.03 5.21
Plant height 66.85-83.90 42.41 6.86 6.15 80.47 11.37
No. of branches per plant 1.50-2.50 2.13 21.77 4.77 04.79 2.15
No. of fruiting nodes
12.50-20.00 15.24 16.69 12.30 54.31 18.67
Fruit length 9.40-17.05 12.94 13.99 11.33 65.58 18.90 Fruit girth 4.95-38.85 7.00 24.41 18.02 52.07 14.45
Fruit weight 9.45-22.65 15.73 23.05 20.66 80.33 38.14
Fruit yield per plant 186.26-401.95 287.53 19.04 16.23 72.70 28.51
14 R. Pachiyappan, K. Saravanan 4
Table 3
Phenotypic and genotypic correlation coefficients among 8 characters in bhendi
Characters DFF PH NBP NFN FL FG FW FYP P 1.000 0.068 -0.144 -0.116 0.101 -0.042 -0.076 -0.233 DFF G 1.000 0.158 -0.798** -0.104 0.128 -0.365** 0.112 -0.304* P 1.000 0.143 0.799** 0.265* -0.047 0.535** 0.653** PH G 1.000 0.530** 0.880** 0.325** -0.730** 0.650** 0.813** P 1.000 0.104 0.229 -0.030 0.213 0.116 NBP G 1.000 0.321* 0.907** 0.974** 0.920** 0.715** P 1.000 0.097 0.035 0.430** 0.687** NFN G 1.000 0.097 0.925** 0.625** 0.900** P 1.000 -0.167 0.394** 0.215 FL G 1.000 0.947** 0.333* 0.229 P 1.000 0.037 0.107 FG G 1.000 -0.187 0.673** P 1.000 0.661** FW G 1.000 0.736** P 1.000 FYP G 1.000
DFF – Days of First Flowering, pH – Plant Height, NBP – Number of Branches per Plant, NFN – Number of Fruiting Nodes, FL – Fruit Length, FG – Fruit Girth, FW – Fruit Weight, FYP – Fruit Yield per Plant. *, ** – significant at 5 and 1 per cent level respectively.
CONCLUSION
The genetic architecture of fruit yield per plant is based on the balance or overall net effect produced by various yield components interacting with one another. Based on the studies on genetic variability and correlation analysis, it may be concluded that plant height, number of fruiting nodes, fruit weight, fruit yield per plant and days to fruit flowering appeared to be primary yield contributing characters and could be relied upon for selection of genotypes to improve genetic yield potential of bhendi.
Acknowledgements. Authors are thankful to Dr. R. Selvaraj, Professor, Department of Botany, Annamalai University and D. Dhakshanamoorthy, Ph.D. Research Scholar, Department of Botany, Annamalai University, for their valuable suggestions for publication of this article.
REFERENCES
1. Al-Jibouri H.A., Miller P.A. and Robinson H.F., 1958, Genotypic and environmental variances and covariance in an upland cotton cross of interspecific origin. Agron. J. 50: 632-636.
2. Anbanandan V., Saravanan K. and Sabesan T., 2009, Variability, heritability and genetic advance in rice (Oryza sativa L.). Intl. J. Plant Sci. 3(2): 61-63.
3. Babu S., Yogameenakshi P., Sheeba A., Anbumalarmathi J. and Rangasamy R., 2006, Path analysis in hybrid rice (Oryza sativa L.) over salt environments. Oryza 43(3): 238-240.

5 Genetic variability for yield and fruit quality characters of bhendi 15
4. Burton G.W. and De Vane E.H., 1953, Estimating heritability in tall fescue (Festuca arundinaceae) from replicated clonal material. Agron. J., 45: 578-581.
5. Fisher R.A., 1981, The correlation among relative on the supposition of Mendelian inheritance. Trans. Royal Soc. Edinburgh, 52: 314-318.
6. Johnson H.W., Robinson H.E. and Comstock R.E., 1955, Estimate of genetic and environmental variability in soybean. Agron J. 47: 314-318.
7. Krishnaveni B., Shobharani N. and Ramprasad A.S., 2006, Genetic parameters for quality characteristics in aromatic rice. Oryza 43(3): 234-237.
8. Panse V.G. and Sukhatme P.V. 1985, Statistical Methods for Agricultural Workers. 4th edn. ICAR, New Delhi.
9. Sabesan T., Suresh R. and Saravanan K., 2009, Genetic Variability and correlation for yield and fruit quantity in bhendi. Electronic J. Plant Breeding 1: 56-59.
10. Saravanan K. and Sabesan T., 2009, Association analysis and path analysis for yield and its contributing traits in rice (Oryza sativa L.). 2009. Intl. J. Plant Sci. 3(2): 27-29.
11. Sarkar K.K., Bhutia K.S., Senapathi B.K. and Roy S.K., 2007, Genetic variability and characters association of quality traits in rice (Oryza sativa L.). Oryza 44(1): 64-67.
12. Wright S. 1935, The analysis of variable and correlations between relative with respect to deviations from an optimum. J. Genetics 30: 243-256.
13. Yugandhar Reddy M., Subash Chandra Yadav Suresh Reddy B., Lavanya G.R. and Suresh G., 2008, Character association and component analysis in rice. Oryza 45(3): 239-241.


KARYOTYPE ANALYSIS IN SOME SPECIES OF ALLIUM SECTION ALLIUM (ALLIACEAE)
MATIN MIRYEGANEH1, ALI MOVAFEGHI2,*
In the current investigation, karyotypes and chromosome characteristics of several species of Allium belonging to section Allium are presented. Plants were collected with their bulbs mostly from the east Azerbaijan province of Iran and cultivated in water. The root tips were rinsed and pretreated by alpha-monobromonaphthalene prior to fixation by Carnoy’s fixative and staining with Feulgen/Schiff reagent. Chromosomes characteristics were determined using photographs complemented by statistical analyses. On the basis of our observations, all chromosome results available for the section Allium were based on x = 8 and x = 7. Although satellite chromosomes were frequently seen in other sections of the genus such as Melanocrommyum, they were rarely evident in section Allium. The chromosomes were mainly metacentric, submetacentric and rarely acrocentric and differed somewhat in length. Telocentric chromosomes, which were occasionally found in other sections of the genus, did not appear in this section. Accordingly, although the general karyotype pattern in the genus Allium is relatively uniform, karyotypes of the section are usually readily identified by their distinctive chromosome features.
Key words: Allium, cytotaxonomy, karyotype, chromosome characteristics.
INTRODUCTION
Allium (Alliaceae) is one of the most diverse and taxonomically complicated groups of monocotyledons, with about 800 species (Fritsch et al., 2010). This genus is characterized by owning bulbs enclosed in membranous (sometimes finally fibrous) tunics, free or almost free tepals and often a subgynobasic style. It shows a nearly exclusive distribution across the northern hemisphere with a main centre of diversity in Southwest and Middle Asia (Fritsch & Friesen, 2002). One of the most recent classifications proposes 15 subgenera and 56 sections for the genus Allium (Friesen et al., 2006). Accordingly, the recognized Allium species in Iran are assigned in 7 subgenera and 29 sections.
Subgenus Allium is the largest group of the genus with 260-280 truly bulbous species, which are ecologically more restricted to sub-arid and arid conditions and are morphologically very variable in minor characters (Klass, 1998). As the largest
1 Department of Plant Biology, Faculty of Natural Sciences, University of Tabriz, Tabriz, Iran 2 Author for correspondence: ALI MOVAFEGHI, Department of Plant Biology, Faculty of
Natural Sciences, University of Tabriz, Tabriz, Iran, E-mail: [email protected] ROM. J. BIOL. – PLANT BIOL., VOLUME 56, No 1, P. 17–27, BUCHAREST, 2011

18 Matin Miryeganeh, Ali Movafeghi 2
section of this subgenus, section Allium comprises about 115 species worldwide, at least 30 of which including 6 endemics grow in Iran (Wendelbo, 1971). All of these species possess characteristically a well developed bulb, stem leaves, campanulate to cup-shaped flowers and filaments in two distinct whorls, the outer three nearly always simple and the inner three markedly tricuspidate (rarely 5 or 7-cuspidate) with the anther attached to the median cusp (Mathew, 1996). Interestingly, this section includes a number of economically important food crops such as A. porrum (leek), A. sativum (garlic), A. ampeloprasum var. ampeloprasum (Russian garlic or elephant garlic) and A. ampeloprasum var. kurrat (Egyptian leek or kurrat). Moreover, based on the relevant data for traditional and modern plant systematics, section Allium is a homogeneous, well-defined and probably monophyletic group and therefore it is of high taxonomic interest (Mathew, 1996; Fritsch & Astanova, 1998).
The chromosome morphology may represent a taxonomically significant character in the genus Allium. A basic chromosome number of x = 8 is dominating in most subgenera, while almost all taxa of subgen. Amerallium are characterized by x = 7 chromosomes (Mathew, 1996, Fritsch & Astanova, 1998). Deviating chromosome sets based on x = 9, 10 and 11 are also reported to be occurred infrequently in the subgenera Amerallium and Melanocrommyum (Fritsch & Friesen, 2002).
Although the general karyotype pattern in Allium is relatively uniform, the karyotypes of Allium species belonging to section Allium are usually readily identified by their distinctive nucleolus chromosomes (Mathew, 1996). Species can be distinguished by a combination of chromosome number, karyotype formulae, karyotype length, the position of satellites in a particular chromosome pair, and symmetry indices. The main scope of the present study is to provide a comprehensive karyological study in section Allium, to find characters useful in description of the species, and to contribute towards the cytotaxonomic information available on the section. Another long term goal is to examine the karyotypes of some members of the section in detail, as a basis for further cytotaxonomic studies of the genus.
MATERIALS AND METHODS
Plants were collected with their bulbs mainly in East Azerbaijan province of Iran. Voucher specimens have been deposited in the Central Herbarium of Tehran University (TUH). Information on the collection data and species studied are presented in Table 1. Chromosome studies were carried out using meristematic cells of root tips, which were obtained in autumn from potted bulbs. Root tips were pretreated for three hours with monobromonaphthalene in a cold room (4–8 ºC) and then fixed for 24 hours in Carnoy's solution (1 part glacial acetic acid and 3

3 Karyotype analysis in some species of Allium 19
parts ethanol) at 4 ºC. In order to carry out the Feulgen staining, the procedure in outline involves hydrolysis of the fixed tissue in normal HCl at 50–60 ºC, for a period varying from 4 to 20 min before immersing the material in Schiff's reagent. After hydrolysis, the root tips were stained using the routine Feulgen method. The color was developed in a short time and the chromosomes were observed after mounting in 45% acetic acid. The root tips were neatly squashed on a slide using the commonly applied method. At least five metaphases of each species were photographed using a Nikon E-1000 Microscope. The chromosomes were measured from photographs often complemented by further microscopical analysis. The data were electronically stored on a PC with Micromeasure software for statistical analyses and further processing. The software was used to take the short arm and long arm measurements and arm ratio for each chromosome pair. The classification of chromosomes follows the classes according to Fritsch and Astanova (1998):
Metacentric: short arm 50–37.5 %, long arm 50–62.5 %, Submetacentric: short arm 37.49–25 %, long arm 62.51–75 %, Subacrocentric: short arm 24.99–12.5 %, long arm 75.01–87.5 %, Acrocentric: short arm less than 12.5 %, long arm more than 87.51 % of the
entire length.
Table 1
Collection data and voucher numbers of Allium species examined
Species Collection data Voucher no.
A. atroviolaceum Azerbaijan, Maraghe, Alavian dam (NW of Maraqe) 37039-TUH
A. dictyoscordum Azerbaijan, Tabriz University 37044-TUH
A. laeve Azerbaijan, 5km North of Tabriz, Dand Mountains 37049-TUH
A. longicuspis Azerbaijan, Maraghe, Chenar village (NW of Maraghe) 37042-TUH
A . phanerantherum Azerbaijan, SW of Tabriz, basmenj road, Liqvan village Mountains. 37051-TUH
A. qaradaghense Azerbaijan, Goijabel, road of Tabriz to Ahar: 75km to Ahar 37050-TUH
A. rotundum Azerbaijan, Goijabel, road of Tabriz to Ahar: 75km to Ahar 37043-TUH
A. subvineale Azerbaijan, Tabriz to Marand, ca. 15 km to Marand, SW of Marand, Mishu-Daq
Mountain 37038-TUH

Table 2
Chromosome measures (means of given number of metaphase plates and standard errors, 0.05% level)
Species and characters Chr.1 Chr.2 Chr.3 Chr.4 Chr.5 Chr.6 Chr.7 Chr.8 B-Chr A. atroviolaceum Whole length µm Long arm µm Short arm µm Arm ratio Satell. Length µm
16.94±0.05 8.56±0.42 8.38±0.06 0.39±0.05
14.54±0.48 7.35±0.08 7.19±0.17 0.97±0.05
9.60±0.42 4.99±0.02 4.61±0.08 0.92±0.11
8.42±0.17 4.88±0.25 3.54±0.08 0.72±0.05
7.80±0.05 4.48±0.11 3.32±0.40 1.34±0.25
7.60±0.94 4.34±0.17 3.26±0.05 1.33±0.08 0.74±0.05
7.51±0.08 4.25±0.11 3.26±0.09 1.30±0.42
7.17±0.11 4.14±0.05 3.03±0.11 1.36±0.08
A. dictyoscordum Whole length µm Long arm µm Short arm µm Arm ratio
13.14±0.17 7.05±0.11 6.09±0.25 1.15±0.11
12.74±0.11 6.69±0.02 6.05±0.05 1.10±0.05
12.02±0.37 7.13±0.45 4.89±0.08 1.45±0.02
10.65±0.40 6.13±0.11 4.52±0.25 1.32±0.05
9.82±0.02 5.33±0.05 4.49±0.11 1.18±0.04
8.77±0.54 4.77±0.25 4.00±0.11 1.19±0.02
7.80±0.40 4.60±0.04 3.2±0.17 1.43±0.05
7.17±0.08 4.48±0.11 2.69±0.08 1.66±0.02
A. laeve Whole length µm Long arm µm Short arm µm Arm ratio
11.6±0.17
6.18±0.05 5.42±0.11 1.14±0.02
10.42± 0.10
5.62±0.14 4.80±0.08 1.17±0.05
9.51±0.05
5.16±0.11 4.35±0.10 1.18±0.02
9.11±0.17
5.22±0.14 3.89±0.05 0.84±0.05
8.54±0.14
4.66±0.11 3.88±0.08 0.83±0.02
8.05±0.05 4.30±0.08 3.75±0.11 0.87±0.10
7.65±0.11 4.42±0.10 3.23±0.05 0.73±0.08
6.97±0.25
3.51±0.25 3.46±0.11 0.98±0.10
2.88±0.02 and
2.34±0.02
A. longicuspis Whole length µm Long arm µm Short arm µm Arm ratio
9.00±0.11
4.77±0.10 4.23±0.25 1.12±0.05
8.51±0.05
4.76±0.42 3.75±0.37 1.26±0.10
8.40±0.05
5.37±0.08 3.03±0.25 1.77±0.02
7.97±0.11
4.34±0.25 3.63±0.10 1.19±0.08
7.40±0.02
3.82±0.05 3.58±0.11 1.06±0.10
7.22±0.05 3.82±0.10 3.40±0.11 1.12±0.17
6.34±0.11 3.38±0.43 2.96±0.11 1.14±0.05
5.54±0.05
3.08±0.10 2.46±0.11 1.25±0.05

Table 2
(continued)
A. phanerantherum
Whole length µm Long arm µm Short arm µm Arm ratio
13.25±0.17
6.96±0.11 6.29±0.10 1.10±0.05
12.57±0.34
6.71±0.25 5.86±0.14 1.14±0.08
8.31±0.14
4.99±0.11 3.32±0.17 1.50±0.28
7.68±0.17
4.53±0.10 3.15±0.08 1.43±0.05
7.00±0.14
3.51±0.11 3.49±0.25 1.01±0.11
6.31±0.08 3.48±0.10 2.83±0.28 1.22±0.10
5.88±0.08 3.45±0.05 2.43±0.05 1.41±0.02
5.31±0.17
3.28±0.10 2.03±0.17 1.61±0.10
A. qaradaghense Whole length µm Long arm µm Short arm µm Arm ratio
8.14±0.17
4.62±0.11 3.52±0.10 1.31±0.05
7.28±0.14
3.93±0.08 3.35±0.10 1.17±0.05
6.80±0.05
3.87±0.14 2.93±0.17 1.32±0.08
6.40±0.17
3.71±0.11 2.69±0.10 1.37±0.08
5.42±0.28
2.93±0.17 2.49±0.11 1.17±0.10
4.62±0.17 2.48±0.11 2.14±0.25 1.15±0.08
3.02±0.80 1.78±0.17 1.24±0.25 1.43±0.11
A. rotundum Whole length µm Long arm µm Short arm µm Arm ratio
8.91±0.08 4.85±0.05 4.06±0.10 1.19±0.11
7.94±0.31 4.56±0.25 3.38±0.17 1.34±0.10
7.02±0.20 3.75±0.25 3.27±0.37 1.14±0.08
6.51±0.11 3.76±0.14 2.75±0.17 1.36±0.10
6.14±0.05 3.28±0.08 2.86±0.05 1.14±0.02
5.91±0.08 3.31±0.11 2.60±0.17 1.27±0.05
4.02±0.25 2.56±0.17 1.46±0.10 1.75±0.05
2.8±0.11
1.91±0.10 0.89±0.17 2.14±0.08
A. subvineale Whole length µm Long arm µm Short arm µm Arm ratio
8.54±0.11 4.71±0.08 3.83±0.10 1.22±0.05
8.11±0.08 4.51±0.17 3.60±0.11 1.25±0.02
7.77±0.08 4.22±0.10 3.55±0.14 1.18±0.17
7.42±0.08 4.19±0.05 3.23±0.10 1.29±0.11
7.11±0.08 3.85±0.17 3.26±0.25 1.18±0.14
6.85±0.05 3.73±0.10 3.12±0.11 1.19±0.05
6.57±0.14 3.45±0.17 3.12±0.10 1.10±0.08

22 Matin Miryeganeh, Ali Movafeghi 6
Fig. 1. Karyotypes obtained from root-tips of: a) Allium atroviolaceum, b) A. longicuspis, c) A. phanerantherum, d) A. subvineale, e) A. rotundum, f) A. laeve, g) A. dictyoscordum,
h) A. qaradaghanse.

7 Karyotype analysis in some species of Allium 23
Fig. 2. Karyograms obtained from root-tips of: a) Allium atroviolaceum, b) A. longicuspis, c) A. phanerantherum, d) A. subvineale, e) A. rotundum, f) A. laeve, g) A. dictyoscordum,
h) A. qaradaghanse.

24 Matin Miryeganeh, Ali Movafeghi 8
RESULTS
Various somatic chromosome numbers were found in the species examined. Three of the species, i.e. A. atroviolaceum, A. dictyoscordum and A. longicuspis, have the somatic chromosome number 2n = 2x = 16, whereas two of species including A. phanerantherum and A. rotundum showed 2n = 3x = 24. The chromosome numbers of the remaining species were as follows: a) 2n = 4x = 32 + 2B for A. laeve; b) 2n = 4x = 28 for A. subvineale; and c) 2n = 3x = 21 for A. qaradaghense. These three chromosome numbers are reported for the first time, among which the presence of two B chromosomes in A. leave was extraordinary.
Figures 1 and 2 illustrate karyotypes and karyograms obtained for the species studied. Although in most of the species there is a lack of distinct size differentiation of chromosomes in the complement, still the longest chromosome always stands out from the shortest one. The relative size of the former to the latter within a complement varies from one species to another (Table 2). Based on our results, the average chromosome length varied from 2.80 µm to 16.94 µm. The shortest and the largest measured chromosome were pair no. 8 in A. rotundum (2.80 µm) and pair no. 1 in A. atroviolaceum (16.94 µm), respectively. Satellites were present on only three taxa including A. atroviolaceum, A. phanerantherum and A. laeve. According to their shape and position they were always terminal ranged in diameter from 0.74 µm to 1.74 µm and connected to the short chromosome arms. In total, karyotypes were quite symmetrical, metacentric chromosomes were the most common (6-8 pairs) and submetacentric chromosomes were often (0-2) pairs in all species. Subtelocentric or telocentric chromosomes were not observed.
DISCUSSION
Karyotype characterization may offer taxonomically important information for the genus Allium (Fritsch & Astanova, 1998; Fritsch & Friesen, 2002; Ao, 2008). Based on preceding investigations, almost all chromosome results available for section Allium are based on x = 8 (Mathew, 1996; McNeal, 1992) with the exception of one record of 2n = 14 (x = 7) for A. hedreichii (Alden, 1976). Here, we report the presence of two new somatic chromosome number for A. qaradaghense and A. subvineale based on x = 7. Although it has been pointed out that Allium species with x = 7 have usually larger chromosomes than those with x = 8 and 9 (Levan, 1935); the karyotypic characters of A. qaradaghense and A. subvineale are not in accordance with this concept.

9 Karyotype analysis in some species of Allium 25
Our observation regarding the karyotypes of A. longicuspis and A. dictyoscodum are in good agreement with previous findings (Zakirova & Nafanailova, 1988; Ved Brat, 1965; Mathew, 1996). Moreover, all studied populations of A. rotundum showed 2n = 3x = 24, as previously reported by Özhatay (1996). On the contrary, Mathew (1996) has observed the chromosome numbers of 2n = 16, 32, 48 and 64 for this species. Besides, we observed 2n = 3x = 24 for all the populations of A. phanerantherum, where De Sarker et al. (1997) reported the chromosome number of 2n = 4x = 32. Therefore, our work offers new evidence for karyotypic variation in section Allium. Intraspecific chromosomal difference and morphological variations between the chromosome sets from different populations of one species have been previously reported for the genus Allium (Fritsch & Astanova, 1998). Accordingly, there is an extensive literature on the morphological diversity of karyotypes found in populations of one species (e.g. Tzanoudakis 1992; Brullo et al. 1994; 1997; Shang et al. 1997) demonstrating that karyotypic variation is not rare in genus Allium. According to the data of Fritsch and Astanova (1998) differing karyotypes for one species or for species belonging to one section could be traced back to accidentally occurring chromosome rearrangements. Environmental factors such as herbivory, wounding, water and nutrient stress and specially temperature stimulate 2n gamete production and polyploidy formation (Karpaviciene, 2007).
Two additional considerations must be taken into account regarding the results obtained. First, we have unexpectedly seen satellite chromosomes in karyotypes of three species. Satellite chromosomes, although frequently seen in other sections of the genus, are not frequently evident in section Allium. However, it has been previously mentioned that the presence of satellites may be not consistent in species of Allium (Fritsch & Astanova, 1998). Second, in our surveys two B chromosomes have been found in the riverside population of A. laeve. There are some records of B chromosomes in the genus Allium (Holmes & Bougourd, 1991; Fritsch & Astanova, 1998; Ao, 2008), but their presence is not usual in section Allium.
B chromosomes are a major source of intraspecific variation in nuclear DNA amounts in numerous species of plants. They favor large genomes and create polymorphisms for DNA variation in natural populations (Jones & Houben, 2003; Jones et al., 2008). Therefore, in the field of population biology their presence in section Allium is of high importance.
Taken together, our results can be used in addition to the data obtained from other karyological studies of Allium species. However, it should be mentioned that

26 Matin Miryeganeh, Ali Movafeghi 10
exact karyotype data for more than 12 of its species are still missing and thus further karyological investigations in section Allium remain to be carried out.
CONCLUSION
Our work has presented new chromosome characteristics for eight species of Allium section Allium. The results obtained have contributed towards the cytotaxonomic information available on the section. We confirmed that karyotypes of section Allium are usually readily identified by their distinctive chromosome features. Above all, karyotypes are quite symmetrical including commonly metacentric as well as submetacentric chromosomes.
Acknowledgments. We are grateful to the Research Affairs of University of Tabriz for financial support. We also thank the editor and two anonymous referees for their thoughtful suggestions.
REFERENCES
1. Alden B., 1976, Floristic reports from the high mountains of Pindhos, Greece, Botaniska Notiser, 129, pp. 297-321.
2. AO C., 2008, Chromosome numbers and karyotypes of Allium przewalskianum populations, Acta Biologica Cracoviensia, 50, pp. 43-49.
3. Brullo S., P. Pavone, and C. Salmeri, 1997, Allium oporinanthum (Alliaceae), a new species from the NW Mediterranean area, Anales del Jardín Botánico de Madrid, 55, pp. 297-302.
4. Brullo S., P. Pavone, C. Salmeri, and A. Scrugli, 1994, Cytotaxonomical notes on Allium savii Parl. (Alliaceae), a misappreciated Tyrrhenian element, Candollea, 49, pp. 271-279.
5. De Sarker D., M.A.T. Johnson, A. Reynolds, and P.E. Brandham, 1997, Cytology of the highly polyploidy disjunct species, Allium dregeanum (Alliaceae) and some Eurasian relatives, Botanical Journal of the Linnean Society, 124, pp. 361-373.
6. Friesen N., R.M. Fritsch, and F.R. Blattner, 2006, Phylogeny and new intrageneric classification of Allium L. (Alliaceae) based on nuclear rDNA ITS sequences, Aliso, 22, pp. 372-395.
7. Fritsch R.M., and S.B. Astanova, 1998, Uniform karyotypes in different sections of Allium L. subgen. Melanocrommyum, Feddes Repertorium, 109, pp. 539-549.
8. Fritsch R.M., F.R. Blattner, and M. Gurushidze, 2010, New classification of Allium L. subg. Melanocrommyum (Webb & Berthel.) Rouy (Alliaceae) based on molecular and morphological characters, Phyton, 49, pp. 145-320.
9. Fritsch R.M., and N. Friesen, 2002, Evolution, domestication and taxonomy, In: H.D. Rabinowitch and L. Currah, Editors, Allium crop science: Recent advances, CAB International, pp 5–30.
10. Holmes D.S., and S.M. Bougourd, 1991, B chromosome selection in Allium schoenoprasum. II. Experimental populations, Heredity, 67, pp. 117-122.
11. Jones R.N., and A. Houben, 2003, B chromosomes in plants: escapees from the A chromosome genome?, Trends in Plant Science, 8, pp. 417-423.
12. Jones, R.N., Viegas W., and Houben A., 2008, A Century of B Chromosomes in Plants: So What?, Annals of Botany, 101, pp. 767-775.
13. Karpaviciene B., 2004, Allium genties rusiu paplitimas Lietovoje, Botanica Lithuanica suppl., 6, pp. 19-30.

11 Karyotype analysis in some species of Allium 27
14. Klass M., 1998, Application and impact of molecular markers on evolutionary and diversity studies in the genus Allium, Plant Breeding, 117, pp. 297-308.
15. Levan A., 1935, Cytological studies in Allium. VI. The chromosome morphology of diploid species of Allium, Hereditas, 20, pp. 289-330.
16. Mathew B., 1996, A review of Allium Sect. Allium, Royal Botanic Gardens Kew, pp. 1-176. 17. McNeal D.S., 1992, Taxonomy of north American species of Allium, pp. 195-204. In: P. Hanelt,
K. Hammer, & H. Knüpffer, (eds.), The genus Allium. Taxonomic problems and genetic resources. Institute für Pflanzengenetik, Gatersleben.
18. Özhatay N., 1996, Cytology of Allium section Allium. In: B. Mathew (Editor), A review of Allium section Allium, Royal Botanic Gardens, Kew, pp. 17-40.
19. Shang Z.Y., R.J. Li, and T.C. Cui, 1997, Studies on chromosomes of eight species of Allium from China, Acta Phytotaxonomica Sinica, 35, pp. 434-444.
20. Stearn W. T., 1992, How many species of Allium are known?, Kew Magazine, 9, 180-182. 21. Tzanoudakis D., 1992, Karyotype variation and evolution in the Greek Allium, In: P. Hanelt et
al., (Editors), The genus Allium. Taxonomic problems and genetic resources, Institute für Pflanzengenetik, pp. 305–320.
22. Ved Brat S., 1965, Genetic systems in Allium I. Chromosome variation, Chromosoma, 16, pp. 486-499.
23. Wendelbo P., 1971, Alliaceae, In: K. H. Rechinger (Editor), Flora Iranica, vol. 76. Akademishce Druck und Verlagsanstalt, pp. 1-100.
24. Zakirova R.O., and I.I. Nafanailova, 1988, Chromosome numbers in members of some families of Kazakhstan flora, Botanical Zhurnal, 73, pp. 452–453.


AN ASSESSMENT OF HIGH YIELDING M3 MUTANTS OF GREEN GRAM (VIGNA RADIATA (L.) WILCZEK)
M.R. WANI1, S. KHAN2, M.I. KOZGAR2
An experiment was conducted to evaluate the extent of genetic variability for quantitative traits in M3 mutants of green gram following mutagenesis with EMS, HZ and SA. A considerable increase in mean values for fertile branches per plant, pods per plant and total plant yield (g) was noticed among the isolated mutant lines in M3 generation. Estimates of genotypic coefficient of variation, heritability and genetic advance for yield and yield components were also recorded to be higher in the treated population. Increase in mean values coupled with an increase in genetic variability for yield contributing traits of these mutants suggest further possibilities of selecting more promising lines with high yield potential. Positive and significant correlations among various character pairs of the mutants were observed. The protein content showed a negative correlation with plant yield, indicating the independent genetic control of protein content and the seed yield.
Key words: green gram, chemical mutagens, high yielding mutants, protein content.
INTRODUCTION
Pulses, belonging to family Fabaceae (Paplionaceae), occupy a most demanding and essential place among Indian agricultural system because of their valuable peculiar qualities. They play a very vital role in overcoming the protein caloric malnutrition especially in a developing country like India, where majority of population is vegetarian. They also have a superior mineral profile which makes them nutritionally more balanced.
Genetic improvement for higher production and better quality of crop plants has remained pivotal to agriculture. The two components involved in this improvement activity are creation of genetic variability and devising methodologies of combining characteristics of different individuals into a superior cultivar. The breeding potential of a crop plant is to exploit the existing variability through selection or created variability through hybridization or spontaneous mutation. However, in pulses the genetic variability has been exhausted due to the natural selection and hence conventional breeding methods are not much fruitful.
1 Department of Botany, Government Degree College (Boys), Anantnag 192 231, Jammu and Kashmir, India
2 Mutation Breeding Laboratory, Department of Botany, Aligarh Muslim University, Aligarh 202 002, Uttar Pradesh, India, [email protected]
ROM. J. BIOL. – PLANT BIOL., VOLUME 56, No 1, P. 29–36, BUCHAREST, 2011

30 M.R. Wani, S. Khan, M.I. Kozgar 2
Mutation breeding technique is the best method to enlarge the genetic conditioned variability of a species considerably within a short time and when sufficient genetic variability is developed, induced mutations can be of value in the rectification of several kinds of defects. Induced variability which can be most useful in breeding programmes is generally obtained through the use of mutagens which are known to react with particular bases of DNA molecule (Singh et al., 1997). Any agent which can change the base sequence, either in resting state or during subsequent DNA metabolism, has the potential to produce a mutant or changed organism. Interest in induced mutagenesis has been revived in recent years due to the fact that mutant organisms are an indispensable tool for the science of genetics.
Green gram, being a self fertilized crop, has limited genetic variability leading to little progress in crop improvement. Artificial induction of variability by means of mutations would be helpful to generate new variability. The present study was, therefore, undertaken to estimate the extent of induced genetic variability and to establish correlations among the quantitative traits including the yield in the M3 mutants of green gram.
MATERIALS AND METHODS
A field experiment was conducted during kharif season of 2004, 2005 and 2006 at the Agricultural Farm, Aligarh Muslim University, Aligarh, India. Uniform and healthy seeds of green gram (Vigna radiata (L.) Wilczek) var. NM-1, presoaked in distilled water for 9 hours, were treated with chemical mutagens, viz., 0.2% and 0.3% EMS (ethylmethane sulphonate), 0.02% HZ (hydrazine hydrate) and 0.02% SA (sodium azide) for 6 hours. The untreated seeds presoaked in distilled water for 15 hours were sown as control. The solutions of EMS and HZ were prepared in phosphate buffer of pH 7, whereas SA solution was prepared in phosphate buffer adjusted to pH 3. Chemically treated seeds were thoroughly washed in running tap water to remove the residue mutagens from the seed surface.
One hundred seeds for every treatment and control were sown in the field in a randomized complete block design to raise M1 generation. The distance between the seeds in a row and between the rows was kept at 30 and 60 cm, respectively. Seeds harvested from individual M1 plants were sown as M2 families in three replicates in the field. For rising M3 generation, 10 M2 progenies were selected which showed significant deviations in mean values in the positive direction from the mean values of the control, particularly for the yield and yield components of the M2 generation. Seeds from each selected M2 progeny were bulked by taking an equal amount of seeds from each M2 progeny and thoroughly mixed. A random sample of this bulk was sown to obtain M3 progeny. Data collected for fertile branches per plant (counted at maturity as the number of branches which bore more than one pod), pods per plant (number of pods borne on a whole plant) and total

3 Assessment of high yielding M3 mutants of green gram 31
plant yield (weight in grams of total number of seeds harvested per plant) of the mutants isolated in M3 generation were subjected to statistical analysis in order to assess the extent of induced variation. Significant differences were identified using the Least Significance Difference (LSD) estimated from the error mean square and tabulated ‘t’ values at the 5% and 1% levels of significance. Parameters estimated were the phenotypic coefficient of variation (PCV), genotypic coefficient of variation (GCV), broad-sense heritability (h2) and expected genetic advance (GA). Standard statistical procedures were adopted to estimate genetic parameters. Genetic advance (expressed as a percentage of the mean) with an assumed 1% selection intensity was computed by the formula of Allard (1960).
GA = K.σp.h2
100ΧX
GA)Xof(%GA =
where, σp = phenotypic standard deviation of the mean
performance of the treated population h2 = broad-sense heritability
k = 2.64, constant for 1% selection intensity (i.e. the highest performing 1% are selected).
The protein content of the seeds was determined by the method of Lowry
et al. (1951).
RESULTS AND DISCUSSION
The mutants viz., NM-1-A, NM-1-B, NM-1-C and NM-1-D which showed distinct superiority with regard to yield and yield components over the untreated control population were evaluated in M3 generation. The mean values of quantitative traits such as fertile branches per plant, pods per plant and yield per plant of the mutants exhibited a manifold increase over control (Tables 1 and 2). The range was fairly wide among mutant progenies and varied from trait to trait. The maximum increase in mean plant yield (18.67 g) associated with 11.16 mean number of fertile branches per plant and 79.90 mean number of pods per plant was exhibited by the mutant NM-1-A (0.2% EMS).
While in control population, number of fertile branches, number of pods and plant yield did not exhibit much of variability, it was too large in the mutants. Increase in variability following mutagenic treatments was also reported by Kharkwal (2000), Waghmare and Mehra (2000), Sheeba et al. (2003), Kozgar and Khan (2009), Khan and Goyal (2009). Selection for number of fertile branches,

32 M.R. Wani, S. Khan, M.I. Kozgar 4
number of pods and seed yield per plant in M3 generation was found to be effective in mutants, as is evident from the manifold increase in the values of the genotypic coefficient of variation, heritability and genetic advance as compared to the control, indicating that these traits can be transmitted to the future generations and further improvement of these quantitative traits is possible in subsequent generations. In order to know the breeding utility of this variability and selection value of various quantitative traits, it is essential to determine various components and heritable proportion of variability (Gottschalk and Kaul, 1980). Johnson et al. (1955) suggested that heritability estimates coupled with the estimated genetic advance are more helpful than the heritability values alone. This is because the heritability estimates are subjected to certain estimation errors (Lin et al., 1979) and genotype – environment interaction (Kaul and Garg, 1979). Frey (1969) reported that mutagen derived variability for quantitative characters in crop plants is heritable and that the response to selection is good. Delayed selection is preferred as deleterious mutations are generally eliminated in early generations.
The degree of association of plant characters has been helpful as a basis for selection. A comparison of mutated and control population revealed that a significant increase in positive correlations between the number of fertile branches and pods, the number of fertile branches and the total plant yield and the number of pods and the total plant yield were observed in the mutants isolated in M3 generation (Table 3). It was also observed that the negative correlation between the number of fertile branches and the total plant yield in the control population was broken down in the mutants. This was highly desirable from the point of view of improvement of more than one trait. Such desirable changes in correlation with yield contributing traits have also been reported in Cicer arietinum by Kharkwal (2003). The correlation among yield contributing traits in a population is a composite of the effects of selection, gene linkage and pleiotropy. The usefulness of mutations in weakening, strengthening or altering character association has been reported earlier (Kaul and Garg, 1982; Agarwal et al., 2001; Yadav et al., 2002). If the nature of selection practiced in the control and treated population is the same, any difference in the correlation coefficient in the two populations will be due to the effect of mutagens or altered pleiotropic effects of newly mutated genes. However, according to Gottschalk (1987), climatic factors can also influence a pleiotropic pattern positively or negatively. Such alterations in correlation among various traits may be utilized to enhance the rate of selection response in quantitative traits. Since the number of fertile branches and the number of pods have shown a significant relationship with yield, it would be desirable to direct selection for these traits. The results show clearly that the mutagenic treatments have succeeded in generating more favourable associations between various components of yield.

Table 1
Brief description of the mutants isolated in M3 generation of green gram
Strain Treatment Duration of treatment Remarks NM-1 Control - -
1. NM-1-A 0.2% EMS 6 h High yield 2. NM-1-B 0.3% EMS 6 h High yield 3. NM-1-C 0.02% HZ 6 h High yield 4. NM-1-D 0.02% SA 6 h High yield
Table 2
Estimation of genetic parameters for quantitative traits of the mutants isolated in M3 generation of green gram
Strain Treatment Mean±S.E. Range Shift in X PCV(%) GCV(%) h2(%) GA(% of X ) Fertile branches per plant
NM-1 Control 6.10±0.07 6-8 - 7.32 3.60 24.96 4.74 1. NM-1-A 0.2% EMS 11.16±0.27 9-14 +5.06 21.24 18.92 79.50 44.57 2. NM-1-B 0.3% EMS 10.26±0.29 8-14 +4.16 24.01 21.14 78.91 49.94 3. NM-1-C 0.02% HZ 10.76±0.24 9-13 +4.66 23.24 20.13 75.04 46.01 4. NM-1-D 0.02% SA 10.05±0.21 8-12 +3.95 18.72 15.13 65.62 32.43 LSD at 5% 0.87 LSD at 1% 1.27
Pods per plant NM-1 Control 47.17±0.51 42-52 - 6.79 3.18 21.20 3.81
1. NM-1-A 0.2% EMS 79.90±0.98 71-94 +32.73 12.48 11.38 83.15 27.36 2. NM-1-B 0.3% EMS 72.36±1.18 67-92 +25.19 15.57 14.09 82.01 33.68 3. NM-1-C 0.02% HZ 76.60±1.10 68-89 +29.43 14.87 13.42 81.53 31.99 4. NM-1-D 0.02% SA 69.13±1.02 65-87 +21.96 14.53 13.47 85.89 32.93 LSD at 5% 3.77 LSD at 1% 5.50
Total plant yield (g) NM-1 Control 9.66±0.09 8.70-10.10 - 6.01 3.05 25.81 4.09
1. NM-1-A 0.2% EMS 18.67±0.42 13.70-19.50 +9.01 20.78 18.59 79.88 43.83 2. NM-1-B 0.3% EMS 17.42±0.45 13.50-19.10 +7.76 23.74 20.99 81.52 50.02

Table 2 (continued)
Strain Treatment Mean±S.E. Range Shift in X PCV(%) GCV(%) h2(%) GA(% of X ) 3. NM-1-C 0.02% HZ 18.21±0.47 14.40-18.90 +8.55 21.94 19.26 80.28 45.52 4. NM-1-D 0.02% SA 16.19±0.34 13.50-17.60 +6.50 19.27 17.14 78.93 40.14 LSD at 5% 0.80 LSD at 1% 1.17
± S.E. – Standard error, PCV – Phenotypic coefficient of variation, GCV – Genotypic coefficient of variation, h2 – Heritability, GA – Genetic advance.
Table 3
Phenotypic correlation coefficient between different pairs of characters in M3 mutants of green gram
Strain Treatment Fertile branches per plant Vs.
Pods per plant
Fertile branches per plant Vs.
Total plant yield (g)
Pods per plant Vs.
Total plant yield (g) NM-1 Control 0.20 -0.16 0.20
1. NM-1-A 0.2% EMS 0.59* 0.74* 0.55* 2. NM-1-B 0.3% EMS 0.31 0.61* 0.17 3. NM-1-C 0.02% HZ 0.53* 0.11 0.46* 4. NM-1-D 0.02% SA 0.48* 0.19 0.62*
* Significant at 1% level. Table 4
Range, mean, coefficient of variation and correlation coefficient for seed protein content in M3 mutants of green gram
Strain Treatment Seed protein content (%) Range Mean±S.E. Shift in Χ
CV(%) Seed protein Vs.
Yield/plant (r) NM-1 Control 24.30-25.50 24.72±0.13 - 1.62 -0.071
1. NM-1-A 0.2% EMS 24.70-25.70 25.01±0.11 +0.29 1.36 -0.339 2. NM-1-B 0.3% EMS 25.10-26.90 25.68±0.27 +0.96 3.31 -0.410 3. NM-1-C 0.02% HZ 25.50-27.50 26.47±0.30 +1.75 3.59 -0.170 4. NM-1-D 0.02% SA 24.90-26.10 25.42±0.12 +0.70 1.46 -0.116
CV – Coefficient of variation.

7 Assessment of high yielding M3 mutants of green gram 35
Data on range, mean, coefficient of variation and correlation coefficient for total seed protein content of M3 mutants are presented in Table 4. There was slight enlargement in the range of seed protein content in the mutants as compared to the control. The maximum increase (26.47%) in seed protein content was observed in the mutant NM-1-C (0.02% HZ) in comparison to the control (24.72%). Seed protein content is generally considered to be a complex character of a crop controlled by many genes located on several chromosomes (Frey, 1977). Results on the estimates of total seed protein content of high yielding mutants isolated in M3 generation showed that the mean protein content of the mutants did not differ significantly as compared to the control. In different mutants, the coefficient of variation for total seed protein content has not greatly altered over the control indicating that further improvement is difficult to achieve. Seed protein showed a non significant negative correlation with yield in different mutant lines. Hence simultaneous improvement of these traits is not possible in this crop. A similar negative correlation between yield and seed protein content has been reported earlier (Gottschalk and Muller, 1982; Khan and Wani, 2005). Protein content is influenced by the interactions of gene(s) and environment factor(s) as has been reported in chickpea (Singh et al., 1990). In the present study, variation in total seed protein in the mutants and the control population may be due to change in environmental factors as the experiments were conducted in the field.
CONCLUSION
The results reported in this communication decisively demonstrated the usefulness and the effective potential of the induced mutational approaches in genetic improvement of the mungbean for recovering superior mutant plant types having high seed yield, besides higher protein content. Little information has been reported so far about the correlation between seed protein content and yield per plant which is the point of concern for nutritionists. As mungbean is a nutritious legume in human diet, its high yielding mutants coupled with higher protein content would assume substantial economic importance. Though a number of reports are available on EMS mutagenesis on various crops, a little information exists regarding the effects of HZ and SA in inducing genetic variability particularly in mungbean. The isolated mutants possessed a desirable plant architecture associated with high yield and slightly higher seed protein content than the control. They can be evaluated in future generations and after multi-locational trials may be released as new varieties. Thus the genetic variability induced by chemical mutagens can effectively be exploited for the improvement of mungbean in terms of yield and nutritional balance.
Acknowledgement. We are grateful to the Chairman, Department of Botany, Aligarh Muslim University, Aligarh, India for providing necessary research facilities.

36 M.R. Wani, S. Khan, M.I. Kozgar 8
REFERENCES
1. Agarwal A.P., S.A. Patil, P.M. Salimath, 2001, Correlation of some quantitative characters with seed yield in soybean, J. Maharashtra Agric. Univ., 26, pp. 291-293.
2. Allard R.W., 1960, Principles of Plant Breeding, John Wiley & Sons, Inc., New York. 3. Frey K.J., 1969, Release of mutagen induced genetic variability in oats by out crossing, Japan J.
Genet., 44, pp. 396-403. 4. Frey K.J., 1977, Protein of oats, Zeitschrift Pflanzenzuchtung, 78, pp. 185-215. 5. Gottschalk W., 1987, The genetic basis of variation. In: Improving Vegetatively Propagated
Crops, Academic Press Limited, pp. 317-334. 6. Gottschalk W., H.P. Muller, 1982, Seed protein of Pisum mutants and recombinants, Qualitas
Plantarum, 31, pp. 296-306. 7. Gottschalk W., M.L.H. Kaul, 1980, Gene ecological investigation in Pisum mutants, Part II,
Comparative performance in Germany and Northern India, Theoretical and Applied Genetics, 56, pp. 71-79.
8. Johnson H.W., H.F. Robinson, R.F. Comstock, 1955, Estimates of genetic and environmental variability in soybean, Agronomy Journal, 47, pp. 314-318.
9. Kaul M.L.H., R. Garg, 1979, Population performance and genetic parameters of some promising pea lines. Pisum Newsletter, 11, pp. 15-16.
10. Kaul M.L.H., R. Garg, 1982, Radiation genetic studies in garden pea, XIII, Genetic variability, interrelationships and path analysis in protein rich genotypes, Biol. Zbl., 101, pp. 271-282.
11. Khan S., M.R. Wani, 2005, Genetic variability and correlations studies in chickpea mutants, J. Cytol. Genet., 6, pp. 155-160.
12. Khan S., S. Goyal, 2009, Improvement of mungbean varieties through induced mutations, African J. Plant Science, 3, pp. 174-180.
13. Kharkwal M.C., 2000, Induced mutations in chickpea (Cicer arietinum L.), IV, Types of macromutations induced, Indian J. Genet., 60, pp. 305-320.
14. Kharkwal M.C., 2003, Induced mutations in chickpea (Cicer arietinum L.), VI, Significance of induced altered correlations, Indian J. Genet., 63, pp. 219-224.
15. Kozgar M.I., S. Khan, 2009, Genetic improvement of chickpea through induced mutation, J. Phytology, 1, pp. 422-424.
16. Lin C.Y., I. Pevzner, G.W. Friars, 1979, Experimental investigation of errors of heritability estimates in index selection, Canadian J. Genet., 21, pp. 303-308.
17. Lowry O.H., N.J. Rosebrough, A.L. Farr, R.J. Randall, 1951, Protein measurement with folin phenol reagent, J. Biol. Chem., pp. 193-265.
18. Sheeba A., S.M. Ibrahim, P. Yogameenakshi, S. Babu, 2003, Effect of mutagens on quantitative traits in M2 generation in sesame (Sesamum indicum L.), Indian J. Genet., 63, pp. 173-174.
19. Singh K.B., G. Begiga, R.S. Malhotra, 1990, Association of some characters with seed yield in chickpea collection, Euphytica, 49, pp. 83-88.
20. Singh V.P., S.N. Chaturvedi, A. Srivastava, 1997, Genetic improvement in pulse crops through mutation breeding. In: Plant Breeding Advances and In Vitro Culture, Edited by: Siddiqui BA, Khan S: CBS Publishers and Distributors, New Delhi, pp. 27-42.
21. Waghmare V.N., R.B. Mehra, 2000, Induced genetic variability for quantitative characters in grasspea (Lathyrus sativus L.), Indian J. Genet., 60, pp. 81-87.
22. Yadav V.S., D. Singh, S.S. Yadav, J. Kumar, 2002, Correlation and path analysis in chickpea, Indian J. Pulses Research, 15, pp. 19-22.

RESPONSE OF TEMPERATURE AND pH ON THE GROWTH AND BIOCHEMICAL CHANGES IN SPIRULINA PLATENSIS
K.V. AJAYAN, M. SELVARAJU1,*
The effect of temperature and pH on growth pattern and biochemical composition of Spirulina platensis was studied under controlled conditions. The chemical constituents were analyzed in terms of lipid, protein, carbohydrate and photosynthetic pigments. The combination of 32 oC and pH 10.0 supports the biomass and biochemicals respectively. The effect of pH was modulated by temperature and vice versa during biomass production.
Key words: Temperature, pH, biomass production, optimization, spirulina.
INTRODUCTION
Photosynthesis is the basis of all primary production of organic matter in land and water. It derives energy needed for the process directly from sunlight and uses elementary substances like water carbon dioxide and minerals. The biomass produced contains valuable organic materials needed for all living organisms. Spirulina is a planktonic filamentous cyanobacterium found in tropical and subtropical bodies of water which have high levels of carbonate and bicarbonate. It is an ideal nutritional supplement and can be the answer to malnutrition problems in developing countries (Vonshak, 1997). The chemical composition of spirulina reflects its potential as human food, animal fed and as a source of natural products. Commercially important pigments can be extracted from spirulina. The carotenoid pigments including β-carotene are increasingly used in foods particularly vitamin-C. Spirulina contains three biliproteins, phycocyanin, allophycocyanin and phycoerythrin (Cifferi, 1983). Phycocyanin pigment stimulates the immune system in general (Landau, 1992; Cohen et al., 1993; Tanticharoen et al., 1994). The merits of an organism for commercial exploitation are maximum yield and utility of cellular constituents (Fatma et al., 1994). The influence of growth conditions on the chemical composition of spirulina has been studied by many researchers. Temperature manipulates the photosynthetic activity, which reflects on the growth and chemical composition such as pigment, lipid content (Jensen and Knutsen, 1993). Growth and lipid content of S. platensis was affected in temperature ranging
1,* Corresponding author: M. SELVARAJU Department of Botany, Annamalai University, Annamalainagar, Tamil Nadu, India-608 002, E-mail*: [email protected]
ROM. J. BIOL. – PLANT BIOL., VOLUME 56, No 1, P. 37–42, BUCHAREST, 2011

38 K.V. Ajayan, M. Selvaraju 2
from 25 to 38 oC (Tedesco and Duerr, 1989). One of the recent approaches is the selection of efficient strains available naturally. Many spirulina strains differ in their optimal growth temperature as well as their sensitivity to extreme ranges (Vonshak, 1997). Tomaselli et al., (1987) reported that maximum biomass yield was obtained when spirulina is grown at the optional temperature of 35 oC. This study aims to scrutinize the widely used S. platensis growth characteristics and biochemical changes under light fluctuation and different pH conditions.
MATERIALS AND METHODS
Algal Strains. The algal strains were obtained from the National Centre for Conservation and Utilization of Blue-green Algae, IARI, New Delhi. The freshwater Spirulina platensis inoculums were maintained in Zarrouk’s medium.
Culture Medium. A modified Zarrouks medium (Kaushik,1987) containing the following constituents (all in g litre_1) NaHCO3 16.8 g; K2HPO4 0.5 g; NaNO3 2.5 g; NaCl 1.0 g; MgSO4.7H2O 0.2 g; FeSO4.7H2O 0.01 g; K2SO4 1.0 g; CaCl2. 2H2O 0.04 g; EDTA 0.08 g was used to grow the S.platensis cultivation.
Culture Conditions and Growth. The S. platensis was cultivated in 500 ml Erlenmeyer flasks containing 250 ml sterilized Zarrouk’s medium. Ten percent (v/v) of the prepared inoculums (0.07 O.D.) were added to the flasks, i.e., 25 ml of the inoculums. The flasks were covered perfectly by cotton wool and aluminum foil. The flasks were vigorously shaken manually thrice per day (morning, noon and at night). The culture was incubated in a lighted chamber (with two 4 ft white fluorescent tubes placed at 30 cm from the bench top, giving a light output of ca 15 µEm –2 s–1 per tube) for the organism to grow and multiply. The cultures were incubated at the appropriate temperature (25, 28, 32, 35 and 37 °C) and periodically replenished with the growth medium to prevent drying up of the cultures. Aeration was provided by an aerator, which was used to pump air at 150 bubbles per minute through a drip set (plastic tubing) fitted with a regulator (Anaga and Abu, 1996). Growth was monitored spectrophotometrically at 560 nm. As pH is important for the growth of S. platensis for biomass, different pH levels viz. 8, 9, 10 and 11 were set for the experiment. The pH was maintained by the help of NaOH and HCl solution.
Biomass Analysis. Biomass concentrations in the culture suspension as 10ml of homogenized algal suspension were filtered through a Whatman GF/C filter paper that had been dried in an oven for 24 hrs at constant temperature of 60 oC. The biomass yield was determined by the method of Vonshak (1997). Biomass yield (g/100 ml) = final weight of the filter paper with dried culture – Initial weight of the filter paper without culture.
Protein, Lipid and Carbohydrate Determination. Protein concentration in samples was determined by the method of Bradford (1976) using bovine serum

3 Response of temperature and pH in Spirulina platensis 39
albumin as a standard. Total Lipid determination was done based on the method of Bligh and Dyer (1959). Carbohydrate was determined based on the method of Kochart (1978) using glucose as a standard.
Estimation of Pigments. Chlorophyll content was determined spectrophotometrically, following extraction of the cells with 80% methanol using the equation by Mackinney (1941). The method used for estimating total carotenoids was spectrophotometry after extracting the cells in 90% acetone (Vonshak, 1997). Phycobiliproteins were extracted by subjecting the cells to mild sonication in 50 mM phosphate buffer pH 6.8 and repeated freezing and thawing; the amounts of Phycocyanin (PC), Allophycocyanin (AC) and Phycoerythrin (PE), absorption maxima of the supernatant were determined spectrometrically and a quantitative estimation was done according to Bennett and Bogorad (1973).
RESULTS AND DISCUSSION
The physico-chemical profile of S. platensis describes the relationship between growth and environmental factors especially irradiance flux, pH and temperature (Vonshak and Tomaselli, 2000) which are important in the evolution of microalgae and cyanobacteria for biomass production as well as their general characterization. High alkalinity is mandatory for the growth of spirulina and bicarbonate is used to maintain high pH (Belkin and Boussiba, 1971; Grant et al., 1990). The S.platensis growth was recorded maximum at 30-35 oC. The optimal growth temperature for spirulina is between 30-35 oC (Danesi et al., 2001). The specific growth rates of S. platensis at different temperature are presented in Figure 1. At 20 oC culture was collapsed, after 8 days having a long lag phase with negligible growth. Similar results happened at 40 oC and culture was collapsed after 6 days. S. platensis showed the maximum growth rate at 32 oC. Fatma et al. (1994) also reported a high growth rate of 9.83 mg 100 ml per day in the same species, which might be due to the difference in specific growth rate of the cultures (Fig. 1). The results of biochemical constituents of S. platensis are reported in Table 1. The results indicated that at the highest temperature the protein content was decreased while the carbohydrate and lipid content were increased. Maximum protein content of 62.3 % was obtained at 32 oC with pH of 9.0 (Carvalho et al., 2002; Kim et al., 2007 and Rafiqul et al., 2005). The solubility of CO2 and other mineral compounds are affected by pH. For spirulina, high alkalinity is a requisite for optimal growth. Carbohydrate synthesis was stimulated with the decreasing of protein (De Oliveira et al., 1999). The maximum carbohydrate was obtained at 37 oC. Quantity of lipid content was increased at the temperature of 37 oC. Tomaselli et al. (1993) reported that lipid and fatty acid content were found high at optimum temperature and salinity in spirulina. All photosynthetic pigment concentrations are reported in Table 2. A net increase in phycocyanin occurred

40 K.V. Ajayan, M. Selvaraju 4
when cultures were grown at the suboptimal temperature of 25 oC (134.1 mg/g). Phycocyanin has been reported to vary with nitrogen concentration and pH of the medium (Boussiba and Richmond, 1980 and Sarada et al., 1999). Phycocyanin is used as colorant in food and cosmetics in various countries (Dainippon, 1985). The maximum values of carotenoids (2.31 mg/g) and allophycocyanin (54 mg/g) were observed below 32 oC, whereas phycoerythrin (9.7 mg/g) was found high at 32 oC. Zuber (1983) reported that the number of phycobilin pigment molecules increases from allophycocyanin to phycocyanin. S. platensis had more ability to harvest light energy and transfer to allophycocyanin (Cohen, 1997). The maximum content of chlorophyll-a (16.4 mg/g) was observed at temperature of 320C. Variable contents of phycobilins and chlorophyll-a were also reported in different species of cyanobacteria (Shivaprakash et al., 2002). The relationship between chlorophyll and growth of the cyanobacteria was reported by Bogorad, 1967. The results of the temperature and pH taken together on the biomass production of the organism are presented in Table 3. At pH 8 and 9, the highest biomass of the organism was produced and the temperature was 35 oC, whereas at pH values of 10.0 the highest biomass production occurred at 32 oC. The organism produced the highest biomass at the temperature of 32 oC (Fig. 1). Rafiqul et al., (2005) reported 32 oC and pH 9.0 as optimal conditions for biomass production in S. platensis. In conclusion, in the present work, the optimal temperature and pH conditions for biomass production and biochemical synthesis were demonstrated for S. platensis. These environmental growth conditions, namely pH, temperature and aeration, are among the critical factors (Rafiqul et al., 2005) for commercial production.
Acknowledgement. The author expresses his sincere thanks to Prof. Dr. R. Panneerselvam (HOD) Annamalai University, Tamilnadu for providing lab facilities.
REFERENCES
1. Anaga A. and G.O. Abu, 1996, A laboratory-scale cultivation of Chlorella and Spirulina using waste effluent from a fertilizer company in Nigeria. Bioresour. Technol. 58:73-95.
2. Bennett A. and L. Bogorad, 1973, Complementary chromatic adaptation in a filamentous blue-green alga, J Cell Biol, 58:419-435.
3. Belkin S. and S. Boussiba, 1971, Resistance of Spirulina platensis (Cyanophyta) to high pH values. Plant cell Physiol. 32:953-9589.
4. Bligh E.G. and W.J. Dyer, 1959, A rapid method of total lipid extraction and purification. Can. J. Miochem. Physiol. 37:911-917.
5. Bogorad L., 1967, Chlorophylls. In: Physiology and Biochemistry of Algae, Ed. by Lewin R.A., Academic Press, London, pp. 385-408.
6. Boussiba S. and A.E. Richmond, 1980, C-phycocyanin as a storage protein in blue-green alga Spirulina platensis. Arch Microbiol 120:155-159.
7. Bradford M.M., 1976, A rapid and sensitive method for quantitation of microgram quantities of protein utilizing the principle of protein-dye binding, Anal Biochem, 72:248-54.

5 Response of temperature and pH in Spirulina platensis 41
8. Carvalho J.C.M., S. Sato, I.O. Moraes, DE O. and L.H. Pelizer, 2002, Spirulina platensis growth estimation by pH determination at different cultivation conditions. Electronic J.Biotech. 5(3):251- 257.
9. O. Cifferi, 1983, Spirulina, the edible microorganism. Microbiol. Reviews 47(4):551-578. 10. Cohen Z., 1997, Chemistry of Spirulina. In: Vonshak, A. (ed). Spirulina platensis (Arthospira)
physiology, cell biology and biotechnology. London: Taylor and Francis. pp. 175-204. 11. Cohen Z. M., Reungjitchachawali, W. Angdung, and M. Tanticharoen, 1993, Production and
partial purification of gamma-linolenic acid and some pigments from Spirulina platensis. J. Appl. Phycol. 5:109-115.
12. Dainippon Ink and Chemicals, 1985, Lina blue (Natural blue colorant of Spirulina origin) Technical information. Tokyo, Japan: Dainippon Ink and Chemicals.
13. Danesi E.D.G., C.O. Rangel, L.H. Pelizer, J.C.M. Carvalho, S. Sato, and I.O. Moraes, 2001, Production of Spirulina platensis under different temperatures and urea feeding regimes for chlorophyll attainment. In: Proceedings of the Eighth International Congress on Engineering and Food. 2:1978-1982.
14. De Oliveira M.A.C.L., M.P.C. Monteiro, P.G. Robbs, and S.G.F. Leite, 1999, Growth and chemical composition of Spirulina maxima and Spirulina platensis biomass at different temperature. J. Aqua. Intl. 7(4):261-275.
15. Fatma T., R. Sarada and L.V. Venkataraman, 1994, Evaluation of selected strains of Spirulina for their constituents. Phykos 33:89-97.
16. Grant W.D., W.E. Mwatha, and B.E. Jones, 1990, Alkaliphiles: ecology, diversity and application. FEMS Microbiol rev. 75:225-270.
17. Jensen S. and G. Knutsen, 1993, Influence of light and temperature on photoinhibition of photosynthesis in Spirulina platensis. J. Appl. Phycol. 5:495.
18. Kaushik B.D., 1987, Laboratory Methods for Blue-Green Algae. Associated Publishing Co, New Delhi, pp. 35-69.
19. Kim M.K., J.W. Park, C.S. Park, S.J. Kim, K.H. Jeune, M.U. Chang, J. Acreman, 2007, Enhanced production of Scenedesmus sp. (green microalgae) using a new medium containing fermented swine wastewater. Bioresour. Technol., 98:2220-2228.
20. Kochart A.G., 1978, Carbohydrate determination by the phenolsulphuric acid method. In: Hellebust, J.A. and Craigie, J.S. (eds). Handbook of Phycological and Biochemical Methods. Cambridge University Press, pp. 95-97.
21. Landau M., 1992, An introduction to aquaculture. London: John Wiley and Sons. 22. Mackinney G., 1941, Absorption of light by chlorophyll solution. J. Biol. Chem. 140:466-469. 23. Rafiqul I.M., K.C.A. Jalal, and M.Z. Alam, 2005, Environmental factors for optimization of
Spirulina biomass in laboratory culture. Biotechnology, 4:19-22. 24. Sarada R., G. Manoj G.A. Pillai, Ravishankar, 1999, Phycocyanin from Spirulina sp: influence of
processing of biomass on phycocyanin yield, analysis of efficacy of extraction methods and stability studies on phycocyanin. Process Biochemistry 34:795-801.
25. Shivaprakash M.K., V. Kulkarni and B. Koshy, 2002, Pigment content of akinetes and vegetative cells of four different cyanobacteria. J. Ecobiol., 14:95-98.
26. Tanticharoen M., M. Reungjitchachawali, B. Boonag, P. Vondtaveesuk, A. Vonshak, and Z. Cohen, 1994, Optimization of gamma-linolenic acid (GLA) production in Spirulina platensis. J. Appl. Phycol. 6: 295-300.
27. Tedesco M.A. and E.O. Duerr, 1989, Light, temperature and nitrogen starvation effect on the total lipid and fatty acid content and composition of Spirulina platensis UTEX 1928. J. Appl. Phycol. 1: 201-209.
28. Tomaselli L., G. Torzillo, L. Giovanetti, F. Bocci, M.R. Tredici, B. Puspharaj, T. Papuazzo, W. Balloni, and R. Meterassi, 1987, Recent research of Spirulina in Italy. Hydrobiol. 151/152, pp. 79-82.
29. Tomaselli L., L. Giovanetti and G. Torzillo, 1993, Physiology of stress response in Spirulina spp. Bulletin de l’ Institut Oceanographique (Monaco) 12, pp. 65-70.

42 K.V. Ajayan, M. Selvaraju 6
30. Vonshak A., 1997, Spirulina, Growth, Physiology and Biochemistry. In: Vonshak, A. (ed) Spirulina platensis (Arthospira) Physiology, Cell biology and Biotechnology. London: Taylor and Francis, pp. 43-66.
31. Vonshak A. and L. Tomaselli, 2000, Arthrospira (Spirulina): Systematics and ecophysiology. In: Whitton, A., Potts, M., Eds. The Ecology of Cyanobacteria. Kluwer Academic Publishers, The Netherlands, pp. 505-522.
32. Zuber H., 1983, Structure and function of the light harvesting phycobiliproteins from the cyanobacterium Mastigocladus laminosus, in: Photosynthetic Prokaryotes Cell Differentiation and Function, Ed. by Papageorgiou G.C. and Packer L. Elsevier Biomedical, Amsterdam, pp. 23-42.

STUDY OF CHEMICAL CONSTITUENTS OF CITRUS PLANTATION SOILS AND CITRUS PLANT MATERIALS UNDER SEVERE DECLINE (DIEBACK) AT THE NIGERIA INSTITUTE OF HORTICULTURAL RESEARCH (NIHORT)
I.O. EZEIBEKWE1
The study of the chemical constituents (analysis) of the soil and Citrus plant materials at the Citrus orchards of the National Institute of Horticultural Research, Mbato, Okigwe in Imo state, Nigeria showed that mineral nutrients (calcium, sodium, nitrogen, potassium, phosphorus, magnesium, copper and zinc) were present at low proportions (0.003 mg/100 g–4.75 mg/100 g) in both the dry season and wet season soil samples when compared with standard permissible limits of mineral elements. Iron was high (1.01–1.23 mg/100 g). Analyzed citrus plant parts also showed that nutrients were at low levels (0.10 mg/100 g–5.58 mg/100 g) when compared with minimum standard requirements. The mineral status of the rhizosphere of diseased fruits compared to that of seemingly unaffected plants and the soil from the unplanted portion of the orchard showed low levels. The soil was strongly acidic pH 94.00–5.58) with low Cation Exchange Capacity (0.06–4.51) indicating very low exchangeable bases and poor in nutrients.
Key words: Study, Chemical Constituents, Citrus, Plantation, Soil, NIHORT.
INTRODUCTION
There has remained a persistent decline in Citrus growth and productivity associated with high level chlorosis, and shoot dieback at the National Institute of Horticultural Research, Mbato, Okigwe. There is therefore an urgent need to revamp the Citrus industry in Nigeria, in view of its numerous uses and demand for both local consumption and exportation.
Citrus, a tropical and subtropical crop, belongs to the family Rutaceae of the tribe Citrae. All the members are fruit bearing possessing juice filled vesicles known as hesparidium. They are thorny aromatic shrubs or small trees with leathery evergreen leaves. The white or purple flowers are often very fragrant (Fig. 1).
According to Okwulehie (1998), Citrus may have originated from the history of the cultivated species and cultivated from 15oN–35oS between sea level and 1,000 m. They also require 100 cm of rainfall. Citrus plants include large varietal 1 Imo State University. P.M.B. 2000, Owerri, Imo State, Nigeria, [email protected]
ROM. J. BIOL. – PLANT BIOL., VOLUME 56, No 1, P. 43–55, BUCHAREST, 2011
44 I.O. Ezeibekwe 2
collection of Sweet orange (Citrus sinensis), Tangerine/Mandarin (Citrus reticulate), Grape (Citrus paradisi), Lemon (Citrus limon), Lime (Citrus aurantifolia), Pumelo (Citrus grandis).
Citrus is one of the most important fruit tree crops in Nigeria utilized for fresh consumption and for fruit industry. It surpasses all other fruits as raw materials in fruit drink industry.
The total world population of Citrus is estimated at 36 metric tons with Nigeria producing 0.3 metric tons of the world production.
In spite of the high demand of Citrus fruits in Nigeria, its production level is low due to pests and diseases. Many microorganisms have been known to cause various diseases of Citrus trees, IITA (2003), NIHORT, (2003). These include many genera of fungi, bacteria and viruses. In the last five years or more, the decline of Citrus trees at NIHORT has drastically reduced the yield of these crops.
The fertility of the soils is generally evaluated from chemical characteristics of the soil. In the South-eastern zone of Nigeria where the climatic factors are severe thus causing an intense weathering of the rocks, the chemical characteristics of the soils tend to reflect the nature of the parent rocks which include sandstones, shale, basalt, acid crystalline rocks and alluvium (Igbokwe et al. 1981). These soils are strongly weathered, have little or no contents of weatherable rocks in the sand the silt fractions and have predominantly kaolinite in the clay fractions. They have therefore low CEC, low nutrient deficiency. They are acidic soils that have low Cation Exchangeable Capacity (CEC), low base saturation and low fertility level, usually suffering from multiple nutrient deficiencies.
The aim of this work is to analyze the NIHORT soils to assess their nutrient content which includes the ions in true solution and the proportion of these held by clay and organic colloids. Soil analysis results will be matched against known standard values to ascertain the sufficiency, excess or deficiency.
MATERIALS AND METHODS
The NIHORT citrus orchards occupy 80 hectares out of 160 hectares establishment. The area was subdivided into four establishments, namely A, B, C and D, with each establishment divided into four plots of one hectare each (10,000 square meters). The experimental plots were designated by year of establishment as follows: 1976 (A), 1978 (B), 1983 (C) and 1988 (D). Each experimental plot has 204 citrus plants at 7 × 7 espacement. The experimental design used was a Complete randomized Design (CRD).
Sample Collection: 40 samples were collected with soil auger into clean polythene bags from the rhizosphere of citrus plants (diseased and apparently healthy) and from points outside the citrus plants at depths of 15–30 cm. The

3 Chemical constituents of citrus plantation soils and plants 45
samples were randomly collected from the plots A, B, C, and D on a randomized complete block design arrangement. 30 samples from the exploited areas, i.e. from rhizospheres of diseased and apparently healthy plants and 10 samples from non-exploited soils, i.e. where citrus plants were not growing. Each sample was a mean of three different samples. The soil samples were collected during the month of March (dry season) and July (wet season) for analysis.
Soil Analysis. pH Determination: The pH of the soil samples were assessed using the electrometric method (pH meter). Determination of Minerals: Total Exchangeable Bases. The Neutral Ammonium Acetate Extraction Method (Udoh Ogunwale, 1986) was used to extract total exchangeable metals like calcium, magnesium, potassium and sodium. Determination of Calcium and Magnesium: Calcium and magnesium were determined by the vasanate Ethylene Diamine Tetraacetic Acid (EDTA), Complexiometric titration A. Determination of Heavy Metals: The acid extraction method as described by Udoh and Ogunwale (1986) was used to determine the heavy metals. Determination of Nitrogen in the soil samples: The kjeldahl titrimetric method described by Udoh and Ogunwale (1986) was used to determine the nitrogen content in the soil samples.Determination of Phosphorus: The molybdenum blue spectrometric method of Murphy and Rilay as described by Udoh and Ogunwale (1986) was used to determine phosphorus content in the soil samples. Determination of Organic Matter: The Walkey Black Titrametric Method described by Udoh and Ogunwale (1986) was used in the determination. The results of the determinations were recorded.
Analysis of Citrus Plant Materials. Samples of roots, stem and leaves were randomly selected from the blocks and labeled A, B, C, and D.
The samples were each crushed to powder and subsequently treated to Perch Ionic Acid Digestion (Wet Oxidation) of plant materials and analysed for calcium, potassium, sodium, magnesium, nitrogen, phosphorus, iron, copper and zinc according to the methods mentioned earlier. The results were recorded.
RESULTS
Results of chemical analysis of samples of citrus plantation soils of NIHORT at Mbato show chemical properties indicating the presence of mineral elements (macro nutrients and micro nutrients) including heavy metals at various levels and rates, Tables 1 and 2.
The macro nutrients investigated included Calcium (Ca), Potassium (K), Sodium (Na), Phosphorus (P) and Nitrogen (N). The micro-nutrients were Iron (Fe), Zinc (Zn), Copper (Cu), Manganese (Mn).
Results of the dry season soil samples (Table 1) show that iron was high (1.01–1.22 m/100 g) in all plots. Soils from healthy trees and samples outside

46 I.O. Ezeibekwe 4
Citrus plants also have low values of mineral elements ranging from 0.003 to 1.23 mg/100 g.
Results from the wet season soil sample indicated the same trend in low nutrient values as in the dry season sample the total nitrogen in the wet season sample was also high (0.10–0.14 mg/100 g). Organic carbon and organic matter levels are moderate within acceptable limits as in the dry season sample. The pH was strongly acidic (4.21–4.50), the Cation Exchange capacity (CEC) was low with values ranging from 1.82 to 4.51 mg/100 g (Table 2).
Results from chemical analysis of Citrus plant parts (leaf, root and stem) showed that the macro and micro elements were present at various levels and values. The heavy metals Lead (Pb), Nickel (Ni), Copper (Cu), Cadmium and Chromium in the plant parts were determined and found to have been present at various levels and values ranging from 0.06–0.90 mg/100 mg (Table 3).
Results of the analysis to determine the presence or otherwise of the macro and micro elements in Citrus parts showed that calcium (Ca) was low 93.46–5.88 mg/100 g but with the highest level in the leaves (4.6–5.88 mg/100 g), iron (Fe) was high (1.78–4.27 mg/100 g) and greater in the leaf (5.20 mg/100 g) and in normal healthy citrus plant (stem).
Fig. 1. Citrus tree (Sweet orange).

Table 1
Chemical Constituents of NIHORT Orchard Soils (Dry Season) (Exptal Fields)
Soil Sampled
Fe
Ca
Pb
Mg
Cu
K mg/100g P
PPM
Na Zn Mg/100g
OC %
OM %
TN % pH C.E.C
Mg/100
1976 A
DEPT
0–15 cm
1.12 0.22 0.14 0.10 0.12 0.24 2.50 0.12 0.07 1.56 2.34 0.34 5.58 0.68
1978 B 0–15 cm 1.21 0.31 0.09 0.05 0.15 0.28 3.00 0.10 0.08 1.56 2.68 0.31 4.60 0.74
1983 C 0–15 cm 1.20 0.08 0.10 0.06 0.18 0.22 2.50 0.14 0.07 1.53 2.63 0.31 5.60 0.74
1988 D 0–15 cm 1.22 0.21 0.07 0.08 0.16 0.25 3.20 0.12 0.08 1.48 2.65 0.29 4.83 0.66
Healthy tree 0.15 1.10 0.15 0.08 1.00 0.08 0.18 1.50 0.16 0.003 1.49 2.70 0.40 4.70 1.49

Table 1
(continued)
No trees outside Citrus plant 1976 A
0–15 cm 1.20 0.17 0.08 0.08 0.15 0.28 2.50 0.16 0.08 1.60 2.75 0.36 5.20 0.69
1978 B 0–15 cm 1.23 0.16 0.05 0.05 0.13 0.34 3.50 0.14 0.06 1.36 2.34 0.36 4.10 0.69
1983 C 0–15 cm 1.01 0.18 0.07 0.07 0.13 0.28 2.00 0.12 0.06 1.38 2.89 0.34 4.00 0.65
1988 D 0–15 cm 1.01 0.13 0.07 0.07 0.12 0.28 3.00 0.12 0.07 1.36 2.34 0.28 4.20 0.60
Permissible levels by Enwezor et al. (1989)
Fe – 0.2 mg/100 g P = 15.0 mg/100 g
Ca – 9.0 mg/100 g Na = 0.50 mg/100 g
Organic matter = 2.5%
Mg – 10.0 mg/100 g Rb = 0.43 mg/kg Lin (1991)
K – 17.0 mg/100 g Zinc = 0.35 mg/kg Lin (1991)

Table 2
Chemical Constituents of Citrus Orchard Soils at NIHORT (Wet Season) (Exptal Fields)
Soil
Sampled
Fe Ca Pb Mg Cu
K mg/100g P
PPM
Na Zn Mg/100g
OC %
OM %
TN % pH C.E.C
Mg/100g
1976 A
DEPT
0–15 cm
1.52 0.54 0.45 0.26 0.07 2.00 0.13 0.21 2.91 1.54 2.65 0.13 4.27 3.84
1978 B 0–15 cm 1.40 0.50 0.50 0.18 0.67 4.75 0.30 0.22 3.53 1.74 2.99 0.13 4.16 4.51
1983 C 0–15 cm 1.32 0.20 0.61 0.15 0.10 4.75 0.31 0.03 2.85 1.72 2.96 0.13 4.23 3.51
1988 D 0–15 cm 1.28 0.53 0.70 0.16 0.06 4.72 0.30 0.23 2.77 1.72 2.89 0.13 4.21 3.54
Around Healthy tree
0.15
1.30
0.64
0.55
0.19
1.33
4.50
0.30
0.04
2.92
1.76
3.03
0.14
4.96
3.87

Table 2
(continued)
No trees outside Citrus plant 1976 A
0–15 cm 1.55 0.40 0.47 0.13 0.10 3.75 0.20 0.18 2.68 1.38 2.38 0.12 4.49 3.39
1978 B 0–15 cm 1.18 0.23 0.52 0.50 0.17 2.80 0.20 0.14 1.98 1.35 2.23 0.11 4.30 2.91
1983 C 0–15 cm 1.00 0.09 0.40 0.60 0.13 2.56 0.23 0.16 1.77 1.20 2.25 0.13 4.50 2.69
1988 D 0–15 cm 1.09 0.15 0.30 0.12 0.11 2.37 0.10 0.21 1.45 1.54 2.70 0.10 4.35 1.82
Permissible levels by Enwezor et al. (1989)
Fe – 0.2 mg/100 g P. = 15.0 mg/100 g Pb = 0.43 mg/kg Lin (1991)
Ca – 9.0 mg/100 g Na = 0.50 mg/100 g Zn = 0.35 mg/kg Lin (1991)
Organic matter = 2.5%
Mg – 10.0 mg/100 g
K – 17.0 mg/100g Zinc = 0.35 mg/kg Lin (1991)

Table 3
Chemical Constituents of Citrus Plants at NIHORT Orchard (Exptal Fields)
Sampled Ca Fe K mg/100g Na Mg Zn P PPM Cu Mg/100g Mn Pb Ni Cd Cr
Young Citrus Seedlings
Leaf 4.17 5.20 2.22 0.12 0.45 0.08 2.80 0.10 0.71 0.60 0.20 0.12 0.04
Root 2.58 3.20 4.44 0.14 0.17 0.20 1.04 0.30 0.29 0.50 0.30 0.09 0.80
Stem 2.63 1.33 4.44 0.16 0.15 0.24 1.14 0.10 0.43 0.11 0.60 0.80 0.72
Old Citrus trees
1976 Leaf
4.67
2.93
3.44
0.10
0.50
0.28
3.01
0.35
0.57
0.14
0.70
0.08
0.90
Root 4.33 3.47 4.44 0.10 0.23 0.22 0.69 0.15 0.29 0.80 0.20 0.10 0.75
Stem 5.42 2.67 2.44 0.14 0.28 0.24 1.11 0.20 0.29 0.90 0.12 0.07 0.09
1978 Leaf 5.88 1.87 2.44 0.12 0.46 0.12 2.36 0.20 0.59 0.90 0.40 0.14 0.27
Root 4.58 3.60 2.44 0.10 0.29 0.16 1.88 0.15 0.21 0.80 0.20 0.10 0.75
Stem 4.50 1.73 3.89 0.80 0.26 0.16 3.29 0.10 0.36 0.60 0.08 0.75 0.38
1983 Leaf 5.58 2.27 4.50 0.20 0.48 0.12 2.84 0.20 0.43 0.50 0.09 0.13 0.11

Table 3
(continued)
Root 3.46 1.73 3.00 0.80 0.22 0.10 2.30 0.15 0.21 0.60 0.20 0.10 0.10 Stem 3.71 4.40 2.00 0.90 0.19 0.22 2.33 0.20 0.50 0.70 0.40 0.06 0.80 1988 Leaf 5.58 2.27 4.50 0.20 0.48 0.12 2.84 0.20 0.43 0.50 0.09 0.13 0.11 Root 4.17 1.78 3.22 0.14 0.20 0.10 1.49 0.10 0.36 0.60 0.10 0.80 0.92 Stem 3.50 4.40 4.22 0.12 0.34 0.14 2.21 0.25 0.14 0.50 0.20 0.10 0.12 Normal healthy Leaf
4.46 2.27 4.00 0.12 0.48 0.24 2.50 0.20 0.37 0.52 0.06 0.06 0.09
Root 4.0 1.78 3.00 0.80 0.22 0.22 1.35 0.20 0.48 0.60 0.36 0.07 0.15 Stem 3.71 4.40 3.00 0.90 0.19 0.12 1.70 0.15 0.20 0.51 0.21 0.06 0.10
Permissible levels by Enwezor et al. (1989) By Lin 1991
Fe – 0.2 mg/100 g P = 15.0 mg/100 g Pb = 0.43 mg/kg 1991
Ca – 9.0 mg/100 g Na = 0.50 mg/100 g Zn = 0.35 mg/kg 1991
Nickel = 0.54 mg/kg 1991
Mg – 10.0 mg/100 g Cadmium = 0.05 mg/kg 1991
K – 17.0 mg/100 g Chromium = 0.16 mg/kg 1991

11 Chemical constituents of citrus plantation soils and plants 53
DISCUSSION
Results in Tables 1, 2 and 3 show results of chemical analysis of citrus plantation soils and plant parts (root, stem and leaf) of NIHORT citrus plantation of Mbato, Okigwe. Table 1 shows soil analysis result of the dry season sample presents a trend of low nutrient values (generally) of the soil even from the soil samples around healthy plants and from soils outside citrus plants. The overall values ranged from 0.003–1.23 mg/100 g, Calcium was low (0.13–0.31). Magnesium was low all through with range (0.05–1.00), Copper was also low (0.08–0.15 mg/100 g), Potassium was low (0.08–0.28), Phosphorus was low with values ranging from (1.50–3.5 ppm), Zinc was also low even in healthy tree 0.003–0.08 mg/100 g. Organic carbon level was low (1.36–1.68%), organic matter was of medium value (2.34–2.89%), organic matter was also of medium value (2.34–2.89%) and CEC (Cation Exchange Capacity) (0.60–1.49) was very low and the pH value was highly acidic (4.00–5.58), nitrogen level was moderately high (0.28–0.40).
The wet season sample analysis results in Table 1 followed the same trend of low nutrient returns except that nitrogen values of 0.10–0.14 range in all observations were moderately high as in the dry season sample results (0.28 0.40). The organic carbon and organic matter levels were moderate within acceptable limit as in dry season sample (Tables 1 and 2), 1.36–1.60% organic carbon level and 2.34–2.75% organic matter for dry season sample, Table 1 and 1.20–1.76 organic carbon and 2.23–3.03% organic matter, for wet season sample. The pH value was of highly acidic range (4.21–4.50) and very low Cation Exchange capacity of (1.82–4.51), Table 2.
The criteria for these fertility classifications were developed from known critical values or levels of each nutrient as determined by trials according to Udoh (1987) on important chemical properties of typical acid soils of South-eastern Nigeria and Udo (1987) on some properties of five surface soils from South-eastern Nigeria from various parent rocks. The results were also compared to the critical levels obtained by Lin (1991) and Enwezor (1981), as presented in the foot notes (permissible levels) on Tables 1, 2 and 3. The results showed low nutrients deficiencies in all sample plots, 1976, 1978, 1983 and 1988 and even from soils obtained from the rhizosphere of healthy plants, and from soils obtained from the rhizosphere of healthy plants, and from those obtained from soils with no citrus growth. The soils are highly acidic and have low Cation Exchange Capacity, Tables 1 and 2.
Enwezor et al. (1989) stated that soil acidity is a major factor influencing the natural distribution of plants, macro and micro fauna and micro flora. The adverse effects of soil acidity on plant nutrition are usually the deficiency of essential plant nutrients (e.g. Ca, Mg, Mg and P) and toxicity of minor elements (e.g. Al, Fe, and Mn). Acid soils limit food production in Nigeria-the leached acid soil.

54 I.O. Ezeibekwe 12
This situation agrees with the findings of Enwezor et al. (1989) and Udoh (1987) the soils of the South-eastern Nigeria formed mainly of sandstones are acidic soils, with low Cation Exchange Capacity (CEC), low base saturation and low fertility level, usually suffering from multiple nutrient deficiencies. The implication is that these soils will require liming in order to achieve high crop yields. Low total nitrogen in soil may amount to low (less vigour) growth of plants making them easily vulnerable to pathogenic attack. This situation is more pronounced with low potassium level observed in the soil and plant parts (Table 3).
The low cation exchange observed in the soil analysis indicates the inability of the soil to retain soluble cations introduced in the soil through rain water, fertilizer application, through mineralization and weathering processes resulting in leaching effect rendering the mineral nutrients unavailable to the plants, i.e. plants and microorganisms cannot easily get them through ionic exchange. There is also the danger of serious fluctuations in cation concentrations which is a disturbing factor in plant growth. Enwezor et al. (1989) confirmed this in their leaf analysis of the oil palm. Leaf analysis appears to be the best diagnostic tool for determining plant nutrient needs. Low levels of mineral values in citrus nutrients were observed as shown by the leaf analysis (Table 3), when compared with the soil analysis results confirm a build up of iron, in the leaf analysis result. The levels of iron could accumulate with time to become toxic to plant (Enwezor, et al., 1989). The levels of total nitrogen, organic carbon and organic matter are appreciably high enough to sustain the citrus plants though their functions depend on the levels of other minerals especially the exchangeable bases.
Table 3 shows the result of analysis of plant parts. Calcium, phosphorus, potassium, sodium, magnesium, (macro minerals) were found to be present at various levels. Heavy metals like chromium, cadmium, lead, nickel were also analyzed for their presence and were also found to be present at some critical levels. Calcium was low in all sample plots and plant parts but more on the leaves and in both young diseased and healthy plants at the range of 2.58–5.58 mg/100 g. The value of iron was high (1.47–5.20), potassium was low (2.00–4.50), sodium was slightly high (0.2–0.90 mg/100 g) than critical values of 0.50 mg/100 g. Manganese, phosphorus, iron, zinc and copper were present in low concentration, but higher in both the leaf and soil (Tables 1, 2 and 3). Lead, cadmium, chromium and nickel (heavy metals) were present in low concentrations although they have the tendency to build up into worrisome proportions. The criteria for these fertility classifications were developed from known critical values and acceptable standards and levels of each nutrient as determined by trials Udoh (1987) and Lin (1991), as shown in permissible nutrient levels on foot notes in Tables 1, 2 and 3 with the exception of zinc which was low in the leaf analysis under discussion the rest were of little higher mean values when compared with Lin (1991) standards.
The results of these analyses reveal nutritional imbalances and slight heavy metal build up that can reach toxic proportions if remedial measures are not taken

13 Chemical constituents of citrus plantation soils and plants 55
(Tables 1, 2 and 3). The ratio of potassium and sodium to calcium and magnesium was slightly higher in affected than in normal tissues.
CONCLUSION
Soil and plant analyses help to show nutrient deficiencies and imbalances and help the farmer to employ proper and adequate management and fertilizer usage. Deficiency of minerals could weaken crops and dispose them to pathogenic attacks.
It is hereby recommended that such an analysis be conducted for such plantations for timely application of remedial measures, since deficiencies of these mineral elements could be responsible for some of the symptoms observed on the trees like yellowing and chlorosis.
REFERENCES
1. Enwezor, W.O., Udoh, V.A., and Sobuto, R.A. (1989). Fertility Status and productivity of Acid Soils, in: Acids of South Eastern Nigeria. Monograph No 1. Soil Sci. Soc of Nigeria 56-73.
2. Igbokwe, M.C., Ene, S.O., Nzewi, O.I. (1981). A Review of Soil Fertility Investigations in the Eastern States of Nigeria, 1923-1981. Fed Dept of Agric Land Resources Tech. Report No 5.
3. IITA (2003). International Institute of Tropical Agriculture. Information Support for Agric Growth in Nigeria. No. 11, 10 p.
4. Lin, H.J. (1991). A Study of Establishment of Heavy Metals Tolerance in Soils by Crops. Unpublished M.Sc Thesis. Research Institute of Soil Sci. National Chring Hsina University, Taiwan, pp. 70-75.
5. NIHORT (2003). Nigerian Institute of Horticultural Research. Commercial Crop Production Guide Series in Nigeria, No. 8, 10 p.
6. Okwulehie, I.C. (1998). A Handbook to Tropical Permanent Crops in Nigeria. Alphabet Publishers, Owerri, 212 p.
7. Udoh, E.J. and Ogunwale, J.A. (1986). Laboratory Manual for Analysis of Soil, Plant and Water Samples. University of Ibadan Press, Ibadan.
8. Udoh, E.J. (1987). Soil Acidity and Productivity. Workshop on the Lifeline of Agric Productivity held at Univ. of Jos, Markurdi Campus. June 9th–11th, 1987.


PRELIMINARY PHYTOCHEMICAL AND PHARMACOGNOSTICAL STUDIES
OF MORINGA OLEIFERA ROOTS
M. PANCHAL*1, K. MURTI, M. SHAH
Micromorphological characters for Moringa oleifera roots are not reported. Moringa oleifera Lam (synonym: Moringa pterygosperma Gaertner) belongs to an onogeneric family of shrubs and trees, Moringaceae, and is considered to have its origin in Agra and Oudh, in the northwest region of India, south of the Himalayan Mountains. Although the name “Shigon” for M. oleifera is mentioned in the “Shushruta Sanhita” which was written in the beginning of the first century A.D., there is evidence that the cultivation of this tree in India dates back many thousands of years. It is characterized by the presence of a thick walled cork, several layered regularly arranged. Epidermis is thin walled and single layered, cortex and hypodermis are distinct, fibers and vessels are lignified, medullar rays are thick walled and lignified. Centre is occupied by the pith which is thin walled and has parenchymatous cells. Phytochemical investigation of root shows total ash (7.5 % w/w), acid insoluble ash (2.5 % w/w), and water soluble ash (5.0 % w/w). Loss on drying is (0.9078 % w/w). Alcohol soluble extractive value (17.6% w/w), water soluble extractive value (16.8 % w/w), Rf value of TLC is 0.63, pH is 7.21 ± 0.01. The alcoholic and aqueous extracts obtained from the plant are 8.7 % w/w and 9.2 % w/w. In alcoholic extract and in aqueous extract, alkaloids and essential oils are present in major amount. Other constituents including resins, amines, glycosides, phenolic compounds and gums and mucilage were present, and saponins, alkaloids, phytosterols, fixed oils, fats, proteins, amino acids, volatile oils were absent.
Key words: Moringa oleifera Lam., Saragavo, phytochemical investigation.
INTRODUCTION
Since ancient times, plants have been an exemplary source of medicine. Ayurveda and other Indian literature mention the use of plants in the treatment of various human ailments. Plants have been the major source of drugs in Indian system of medicine and other ancient systems in the world. Earliest description of curative properties of medicinal plants is found in Rig-Veda. Charaka Samhita and Sushrusha Samhita give an extensive description on various medicinal herbs. Information on medicinal plants in India has been systematically organized (Kirtikar and Basu, 1989; Ram P, et al., 1989; Satyavati et al., 1976; Satyavati, et al., 1987). India has an ancient heritage of traditional medicine. The materia
1
*Author for correspondence: Dept. of Pharmacognosy, Vidyabharti Trust College of Pharmacy, Umrakh, India.
ROM. J. BIOL. – PLANT BIOL., VOLUME 56, No 1, P. 57–64, BUCHAREST, 2011

58 M. Panchal, K. Murti, M. Shah 2
medica of India provides a great deal of information on the folklore practices and traditional aspects of therapeutically important natural products. Indian traditional medicines based on various systems including Ayurveda, Siddha, Unani and Homeopathy.
The evaluation of these drugs is primarily based on phytochemical, pharmacological and allied approaches including various instrumental techniques such as chromatography, microscopy and others. With the emerging worldwide interest in adopting and studying traditional systems and exploiting their potential based on different health care systems, the evaluation of the rich heritage of traditional medicine is essential.
Drumstick tree, also known as horseradish tree and ben tree in English, is a small to medium-sized, evergreen or deciduous tree native to northern India, Pakistan and Nepal. It is cultivated and has become naturalized well beyond its native range, including throughout South Asia, and in many countries of Southeast Asia, the Arabian Peninsula, tropical Africa, Central America, the Caribbean and tropical South America. The tree usually grows to 10 or 12 m in height, with a spreading, open crown of drooping, brittle branches, feathery foliage of tripinnate leaves, and thick, corky, deeply fissured whitish bark. It is valued mainly for its edible fruits, leaves, flowers, roots, and seed oil, and is used extensively in traditional medicine throughout its native and introduced ranges. Drumstick tree is indigenous to the Himalayan foothills of South Asia from northeastern Pakistan to northern West Bengal State in India and northeastern Bangladesh where it is commonly found from sea level to 1,400 m on recent alluvial land or near riverbeds and streams (Kirtikar and Basu, 1975).
Moringa oleifera is a small, fast-growing evergreen or deciduous tree that usually grows up to 10 or 12 m in height. It has a spreading, open crown of drooping, fragile branches, feathery foliage of tripinnate leaves, and thick, corky, whitish bark. This rapidly-growing tree (also known as the horseradish tree, drumstick tree, benzolive tree, kelor, marango, mlonge, moonga, mulangay, nébéday, saijhan, sajna or Ben oil tree), was utilized by the ancient Romans, Greeks and Egyptians; it is now widely cultivated and has become naturalized in many locations in the tropics. It is a perennial softwood tree with timber of low quality, but which for centuries has been advocated for traditional medicinal and industrial uses. It is already an important crop in India, Ethiopia, the Philippines and the Sudan, and is being grown in West, East and South Africa, tropical Asia, Latin America, the Caribbean, Florida and the Pacific Islands. All parts of the Moringa tree are edible and have long been consumed by humans. The root is laxative, expectorant, diuretic, and good for inflammations, throat, bronchitis, piles, cures stomatitis, urinary discharges and obstinate asthma.
The tree is uprooted and the roots grated like horseradish. Alicia Ray says to one cup grated root add 1/2 cup white vinegar and 1/4 t. salt. “Chill for one hour.

3 Preliminary studies of Moringa oleifera 59
This sauce can be stored for a long time in the refrigerator.” The following caution quotes from a recent review by Dr. Julia Morton in Economic Botany.
The Indians knew that the seeds contain edible oil and they used them for medicinal purposes. It is probable that the common people also knew of its value as a fodder or vegetable. Juice from the leaves is believed to have a stabilizing effect on blood pressure and is used to treat anxiety. It is believed to control glucose levels in cases of diabetes. Mixed with honey and followed by a drink of coconut milk 2 or 3 times a day, leaves are used as a remedy for diarrhea, dysentery and colitis. Leaf juice, sometimes with carrot juice added, is used as a diuretic. Eating leaves is recommended in cases of gonorrhea because of the diuretic action. Leaves and buds are rubbed on the temples for headache. A poultice is made from fresh leaves and applied to reduce glandular swelling. Leaf juice is used as a skin antiseptic. Leaves are used to treat fevers, bronchitis, eye and ear infections, scurvy, and catarrh (inflammation of the mucus membrane). Leaves are considered to be anthelminthic (able to kill intestinal worms). Leaves are used as a purgative. Eating leaves is believed to increase a woman's milk production and is sometimes prescribed for anemia. It is best known as an excellent source of nutrition and natural energy booster. This energy boost is not based on sugar so it is sustained. Moringa is also soothing. It helps lower blood pressure and is a sleep aid. Its detoxifying effect may come from Moringa's ability to purify water. Moringa acts as a coagulant attaching itself to harmful material and bacteria. It is believed that this process is taking place in the body as well.
Roots of M. oleifera have a high concentration of both 4-(a-Lrhamnopyranosyloxy)-benzylglucosinolate and benzylglucosinolate. The stem of plant contains: 4-hydroxymellein, vanillin, ß- sitosterone, octacosanic acid and ß-sitosterol and the bark contains 4-(a-L rhamno-pyranosyloxy) – benzylglucosinolate. benzyl isothiocyanate, 4-(a-L-rhamnopyranosyloxy) benzyl-isothiocyanate, niazimicin, pterygospermin, benzyl isothiocyanate, and 4(a-L-rhamno-pyranosyloxy) benzyl glucosinolate (Bennett RN, et al., 2003; Bhattacharya SB, et al., 1982; Faizi S, et al., 1995).
The root, best known in India and the Far East, is extremely pungent. When the plant is only 60 cm tall, it can be pulled up, its root scraped, ground up and vinegar and salt added to make a popular condiment much like true horseradish. The root bark must be completely removed since it contains two alkaloids allied to ephedrine-benzylamine (moringine), which is not physiologically active, and the toxic moringinine which acts on the sympathetic nerve endings as well as on the cardiac and smooth muscles all over the body. Also present is the potent antibiotic and fungicide, pterygospermin. The alkaloid, spirachin (a nerve paralyzant) has been found in the roots. Even when free of bark, the condiment, in excess, may be harmful. (The key words are “in excess” – the body can detoxify small amounts of a great many things).

60 M. Panchal, K. Murti, M. Shah 4
So, in the traditional system of medicine, the plant is used for various health problems and diseases. However, no phytochemical and pharmacological investigations of the fresh roots have been conducted so far to substantiate this practice. Therefore, the aim of this paper is to present an overview of traditional, pharmacognostical, phytochemical investigations carried out on the roots of plant Moringa oleifera Lam.
MATERIALS AND METHODS
Collection and identification. The proposed material for study was identified and submitted as Moringa oleifera roots and it was authenticated by Associate Professor Dr. M. S. Jangid, Department of Botany, College campus, Modasa, Hemchandracharya North Gujarat University, Patan (Gujarat). The roots were collected, washed with water, dried in sunlight and stored properly. The dried roots was powdered and passed through the sieve no. 60. Coarse powder was used for phytochemical work.
Morphological studies. The morphological characters like condition, type, size, shape, apex, margin, base, surface, color, odor and taste of Moringa oleifera roots were studied (Wallis, 2001).
Microscopical studies. The required samples of Moringa oleifera roots were sectioned with the help of fresh blade. The sections were first cleared with chloral hydrate and then stained with Phloroglucinol and concentrated HCl. Sections were also stained with Iodine solution (I-KI) for starch.
Physicochemical constants. Ash values were used to determine the quality and purity of the crude drugs. Procedure given in Indian Pharmacopoeia was used to determine the different ash values such as total ash and acid insoluble ash. Alcohol soluble and water soluble value was also determined as per procedure given in Indian Pharmacopoeia (Indian Pharmacopoeia, 1985).
Phytochemical analysis. The dried powder material was extracted with ethanol and water successively in a soxhlet apparatus. The extracts were filtered while hot and concentrated under reduced pressure. The practical and % yields of the extracts were calculated. The concentrated ethanolic and aqueous extracts of the leaves were subjected to qualitative chemical test for the identification of various active constituents (Mohammed, 1994; Agrawal OP, 2000; Divakar, 2002).
RESULTS
Morphological characters. Seedlings develop a swollen, tuberous, white taproot which has a characteristic pungent odor, and very sparse lateral roots. Trees grown from seeds develop a deep, stout taproot with a wide-spreading system of

5 Preliminary studies of Moringa oleifera 61
thick, tuberous lateral roots. Taproots do not develop on trees propagated from cuttings.
Microscopic characters. It is characterized by the presence of thick walled cork, several layered regularly arranged. Epidermis is thin walled and single layered, cortex and hypodermis are distinct, fibres and vessels are lignified, medullary rays are thick walled and lignified. Centre is occupied by the pith which is thin walled and has parenchymatous cells. The fixed, sectioned and stained plant materials as well as powder and macerated materials were studied using a light microscope according to the usual microscopic techniques. The results of microscopic feature of Moringa oleifera were systematically described and illustrated. The root had thick walled cork; cortex and hypodermis were distinct; fibres, vessels and medullary rays were lignified. Centre was occupied by pith in root section, presence of thick walled cork, several layered regularly arranged. Epidermis is thin walled and single layered, cortex and hypod were seen.
Epidermis is distinct, fibres and vessels are lignified, and medullary rays are thick walled and lignified. Centre is occupied by the pith which is thin walled and has parenchymatous cells.
Transverse section of root.

62 M. Panchal, K. Murti, M. Shah 6
Fig. 1.
Glandular trichomes
Fig. 2.
Fig. 3.
Fig. 4.
Microscopical characters of Moringa oleifera roots
Powder microscopy. Powdered samples of Moringa oleifera were examined for their organoleptic properties. Microscopical evaluation of powder of roots of Moringa oleifera shows different characters. Powder sample is light brown in colour with characteristic odour and taste. Results of powder microscopy were found to be as follows.
Fibres: cylindrical, lignified with simple pits, aseptate, about 40-50 µ diameter (Fig. 1).
Starch grains. Single and compounded with characteristic shapes. Xylem Vessels. Lignified xylem vessels, tracheids with pitted wall shows
pink when treated with phloroglucinol and conc. HCl. Stone cells. Stone cells with different shapes were also seen (Fig. 4).

7 Preliminary studies of Moringa oleifera 63
Cork cells. Brownish, thin walled, wavy cells containing oil globules and having several layered, regularly arranged cells.
Calcium oxalate crystals. Several calcium oxalate crystals with characteristic shapes (Fig. 3).
Trichomes. Glangular typed trichomes also seen in microscopy (Fig. 2). Physicochemical parameters. Phytochemical investigation of root shows
total ash (7.5 % w/w), acid insoluble ash (2.5 % w/w), and water soluble ash (5.0 % w/w). Loss on drying is (0.9078 % w/w), Alcohol soluble extractive value (17.6% w/w), water soluble extractive value (16.8 % w/w). Rf value of TLC is 0.63, pH is 7.21 ± 0.01. The alcoholic and aqueous extracts obtained from the plant are 8.7 % w/w and 9.2 % w/w. Other constituents including carbohydrates, glycosides, phenolic compounds and also gums and mucilage were present and saponins, alkaloids, phytosterols, fixed oils, fats, proteins, amino acids, volatile oils were absent.
DISCUSSION
Drumstick tree, also known as horseradish tree and ben tree in English, is a small to medium-sized, evergreen or deciduous tree native to northern India, Pakistan and Nepal. The root of young trees and also the root bark are considered rubefacient, vesicant carminative, stomachic, and abortifacient; among other uses, they are commonly applied externally to cure inflammatory swellings. The flowers and roots contain pterogospermin, an antibiotic that is highly effective in the treatment of cholera. The fixed, sectioned and stained plant materials as well as powder and macerated materials were studied using a light microscope according to the usual microscopic techniques. The results of microscopic features of Moringa oleifera were systematically described and illustrated. The root had thick walled cork; cortex and hypodermis were distinct; fibres, vessels and medullary rays were lignified. Centre was occupied by pith in root section. presence of thick walled cork, several layered regularly arranged. In alcoholic extract and aqueous extract carbohydrate, glycosides, tannins, phenolic compounds and gums and mucilage were present in good quantity and saponins, alkaloids, phytosterols, fixed oils, fats, proteins, amino acids, volatile oils were absent.
CONCLUSION
In these present investigations, various pharmacognostical standization parameters such as macroscopy, microscopy, and preliminary phytochemical screening were carried out which could be helpful in authentication of Moringa oleifera. The result of the present study will also serve as reference material in the preparation of herbal monograph.

64 M. Panchal, K. Murti, M. Shah 8
REFERENCES
1. Agrawal O.P., Advanced Practical Organic Chemistry, Goel Publishing House, 2002; pp. 43-59. 2. Bennett R.N., Mellon F.A., Foidl N., Du pont MS, Perkins L and Kroon PA. Profiling
glucosinolates and phenolics in vegetative and reproductive tissues of the multi-purpose trees Molinga oleifera L. (Horseradish tree) and Moringa stenopetala L. J Agric Food Chem., 2003; 51(12): 3546-3553.
3. Bhattacharya S.B., Das A.K. and Banerji N., Chemical investigations on the gum exudates from Sajna (Moringa oleifera). Carbohydr Res., 1982; 102: 253-262.
4. Divakar M.C. Plant Drug Evaluation, CD Remedies Publication, 2002; pp. 49-89. 5. Faizi S., Siddiqui B.S., Saleem R., Siddiqui S., Aftab K and Gilani A.H., Fully acetylated
carbamate and hypotensive thiocarbamate glycosides from Moringa oleifera. Phytochemistry, 1995; 38(4): 957-963.
6. Fuglie L.J., New Uses of Moringa Studied in Nicaragua. ECHO Development Notes #68, June, 2000.
7. Harbone J.B., Phytochemical Method, Chapman Hall, 1988; pp. 117-119. 8. Indian Pharmacopoeia, 1985, Ministry of Health and Family Welfare, Government of India,
Controller of Publication, pp. 310. 9. Kirtikar K.R. and Basu B.D., Indian medicinal plants, Dehra Dun, 1975; 35(1): 676-683.
10. Kirtikar K.R. and Basu B.D., Indian medicinal plants, Dehra Dun, 1989; 2(2): 2389. 11. Mohammed A. Textbook of Pharmacognosy, CBS Publishers and Distributors, 1994; pp. 81-447. 12. Ram P., Rastogi and B.N., Malhotra. Indian medicinal plants Central Drug Research Institute,
Lucknow, Council for Scientific and Industrial Research, New Delhi, vol. IV, 1989. 13. Satyavati and Gupta AK., Medicinal Plants of India Indian Council of Medical Research, New
Delhi: vol. II, 1987. 14. Satyavati G.V., Raina M.K. and Sharma M., Medicinal Plants of India Indian Council of Medical
Research, New Delhi: vol. IV, 1976. 15. Wallis T.E., Text book of Pharmacognosy. CBS Publisher and Distributors, 2001; pp. 68-78.

ESTIMATION OF ESSENTIAL AND TRACE ELEMENTS IN THE MEDICINAL PLANT TRIBULUS TERRESTRIS BY ICP-OES
AND FLAME PHOTOMETRIC TECHNIQUES
R. SELVARAJU*,1, G.THIRUPPATHI1, R.G. RAMAN1, D. DHAKSHANAMOORTHY2
The selected essential and trace elements like Ca, Cr, Cu, Fe, K, Mg, Na and Zn in the tissues (leaf, flower and fruit) of medicinal plants were determined by using Inductive Coupled Plasma -Optical Emission Spectroscopy (ICP-OES) and Flame Photometry (FP) techniques. The concentrations of elements were correlated with the soil where plant was growing. The result shows that the tissues of Tribulus terrestris plants are the best sources of nutrient element. The elemental statuses in flowers are higher than other tissues of the plant studied.
Key words: Elemental status, Flame photometry, ICP-OES and Tribulus terrestris.
INTRODUCTION
Tribulus terrestris is a traditional Asiatic medicinal plant, commonly used for skin disease, gonorrhoea, heart disease, liver and urinary tract infection (Hussain et al., 2005), treating eye trouble, edema, skin itch, high blood pressure, and cardiovascular diseases (Xiao, 2001), sexual dysfunction and veiling (Su et al., 2009). The crude extract of the T. terrestris showed a significant effect for many diseases (Tunhai Xu et al., 2009). It also has been used as a medicine in India, South Africa and Japan (Su et al., 2009). Traditional medicines have been used to treat various diseases for more than thousand years. The World Health Organization reported that 80% of world population relies on traditional medicine for their primary health care needs (WHO, 2003). The medicinal value of plants lies in some chemical substances that produce a definite physiological action in a human body. Medicinal plants contain both the organic and inorganic constituents. Bioactive compounds like alkaloids, flavanoids, fannies and phenolic compounds are present in plants. The pharmacological properties of the medicinal plants have been attributed to the presence of active chemical constituents which are responsible for important physiological function in living organisms (Serror-Armah
1
*,1 Department of Engg. Physics, 2Department of Botany, Annamalai University, Annamalainagar-608 002, Tamilnadu, India Author for correspondence: R. Selvaraju,
1Department of Engg. Physics, Annamalai University, Annamalainagar – 608 002, Tamilnadu, India. Email address: [email protected]
ROM. J. BIOL. – PLANT BIOL., VOLUME 56, No 1, P. 65–75, BUCHAREST, 2011

66 R. Selvaraju, G. Thiruppathi, R.G. Raman, D. Dhakshanamoorthy 2
et al., 2001). Trace elements concentrations present in medicinal plants are of great importance to understand their pharmacological actions (Serror-Armah et al., 2002). T. terrestris is a perennial plant, grown predominantly in India and Africa. The chemical constituents in plants, including metal ions, are particularly responsible for medical and nutritional properties and for toxicity as well. The metals also play an important role in plants themselves, e.g. bioactive constituents are present in medicinal plants.
The heavy metals can be directly influenced by impairing mental and neurological function, influencing neurotransmitter production, utilization and altering numerous metabolic body processes. The system in which toxic metal elements can induce impairment and dysfunction include the blood and cardiovascular detoxification pathways (colon, liver, kidney, and skin), endocrine energy production pathways, enzymatic, gastrointestinal, immune, nervous, reproductive and urinary system.
Medicinal plants come into preparation of various modern drugs or even they have been used as the principal source of raw materials for conventional drugs in the developing countries; these plants are easily found in local market. They are available in the mixture of medicinal plants extracts and in capsule forms; therefore, they are easy to use and the industry promises more quick effects. There is great interest in tracing the essential elements and the composition in medicinal science; it is believed that the great majority of elements are as key components of an essential enzyme system or vital bio-chemical function.
Trace elements play a very important role in the formation of the active chemical constituents present in medicinal plants. The quantitative estimation of various trace element concentrations is important for determining the effectiveness of the medicinal plants in treating various diseases and also to understand their pharmacological action. Due to increasing industrialization and environmental pollution, the study was also extended to estimate the level of elements present in these medicinal plants in the growing soil.
In some developing countries, communities rely heavily on traditional health practitioners and medicinal plants to meet their primary health care needs. In many industrialized countries herbal medicines are gaining popularity as alternative and complementary therapies. Therefore, scientific studies of medicinal plants are required to judge their efficacy and medicinal properties. Medicinal plants are the oldest known health-care products. Their importance is still growing although it varies depending on the ethnological, medical and historical background of each country. Medicinal plants are also important for pharmacological research and drug development, not only when plant constituents are used directly as therapeutic agents, but also when they are used as basic materials for the synthesis of drugs or as models for pharmacologically active compounds. Elemental analyses of herbals are keen for therapeutic importance. The aim of this investigation is to analyse the elemental concentration of medicinally important herbals tissues of T. terrestris.

3 Essential and trace elements in Tribulus terrestris 67
In the present paper, elemental distribution of plant tissues and their respective growing soils have also been analysed. Many herbal products are traditionally being used as medicines and nutraceuticals in different regions of the world. A large proportion (70-80%) of the world population, particularly in developing countries, prefers to use the non-conventional medicines, mainly from herbal sources (Soriani et al., 2005). These elements are essential for the normal growth of plants. Medicinal plants contain both organic and inorganic constituents, and many medicinal plants are found to be rich in one or more individual elements, thereby providing a possible link to the therapeutic action of medicine (Singh and Garg, 1997). Although the direct link between elemental content and curative capability is still to be established, such studies are vital for understanding the pharmacological action of herbs.
MATERIALS AND METHODS
The leaf, flower and fruits of T. terrestris were collected from road side in five different places of Chidambaram in Tamilnadu (India). Taxonomic identification was verified by a resident botanist. Surface contaminations of the samples were removed by washing with deionised water. Samples were shadow dried in a clean drying chamber and then dried at 80 °C overnight in an oven. After constant weight attained, samples were powdered using pestle and mortar. In the present work, selected elements Ca, Cr, Cu, Fe, K, Mg, Na and Zn were quantified in all samples by ICP-OES and FP techniques. In the past 20 years, ICP has become a widely used technique for routine multi-element analysis. ICP is used to determine the levels of elements in plant samples after acid dissolution and provides fast analysis and acceptable accuracy and precision. Standard stock solutions of Cr, Cu, Fe, Mg, and Zn at a concentration of 1 mg mL−1 were obtained from Merck (Darmstadt, Germany), and working solutions were prepared by dilution of stock solutions in 5% (v/v) HNO3 immediately before use. All chemicals and reagents employed were of Analar grade. To avoid contamination, all containers and glassware were soaked in 20% (v/v) HNO3 for 48 h and rinsed several times with ultra-pure water before use.
Sample preparation for elemental analysis. Accurately measured 0.5g of powdered samples were used for elemental analysis by digestion. 0.5 g of oven dried powdered plant samples were transferred to a Teflon beaker and 10 ml concentrated nitric acid and 2.5 ml concentrated perchloric acid are added. The sample is then brought very slowly to boiling on a hot plate and heated to dryness. If sample blackening occurred during the fuming stages, nitric acid is added dropwise. The solution is then cooled, re-dissolved in 10 ml deionised water and 1 ml concentrated hydrochloric acid and brought to a volume of 25 ml in a volumetric flask by adding deionised water. Solutions were left to cool to room temperature, transferred to a calibrated flask and diluted to a final volume of 25 ml

68 R. Selvaraju, G. Thiruppathi, R.G. Raman, D. Dhakshanamoorthy 4
with bidistilled deionised water (Milli-Q purifier system, Millipore). The solution is then analyzed against calibration curves established. Elemental analysis of soil samples was followed in the procedure described by Sheded et al., 2006. Solution was filtered using Whatman filter paper (Whatman International Ltd., Maidstone, England). The samples were analyzed in replicates and statistically analyzed.
Statistical analysis. Statistical analysis is carried throughout the study using Statistical Package for Social Science (SPSS) for windows version 11.5. This analysis is carried out with 95% confidence level.
Instrumentation and calibrations. This increasing demand for trace elements analyses thus creates a need for more efficient, sensitive and fast analytical methods. ICP-OES is widely used in the analysis of various trace elements. Electrically generated flames, i.e. plasma, have proved that simultaneous multi element analysis can be successfully carried out with better determination limits and precision than before (6). This is mainly due to the introduction of ICP
(Greenfield et al., 1975; Barnes, 1978) as excitation source for the emission spectrometry. The intensity of the emission lines is directly proportional to the concentration of the analyzed solution. The optima 2100 DV Inductive coupled plasma optical emission spectroscopy uses a unique double – Spectrometer optical system. This design results in a high-speed, high light – throughput optical system offering excellent resolution, all in a compact system. The sample solution is then used for the determination of elements like Cr, Cu, Fe, Mg and Zn using ICP-OES (Optima 2100 DV). All the samples taken for the investigation were processed CAS in marine biology, Faculty of Marine Biology, Annamalai University. The sample solution used for the determination of elements like Na, K and Ca using Flame Photometer (CL-360 model) is available at CISL, Annamalai University.
ICP-OES instrumental (model: Optima 2100 DV) parameters employed determination of elements.
RF Power 1450 W Nebulizer Flow 0.8 L/min Auxiliary Flow 0.4 L/min Plasma Flow 17 L/min Sample Flow 1.5 ml/min Source Equilibration Time 15 seconds Number of Replicates 2 Frequency 40 MHz, free-running Shear Gas 18–20 lit/min. Detector Charged Coupled Device (CCD array detector)
Special care was taken while choosing the wavelength to minimise
interruption. For Mg: 279.506 nm, Fe: 238.204 nm, Cu: 324.754 nm, Zn: 213.856

5 Essential and trace elements in Tribulus terrestris 69
nm, Cr: 284.325 nm, Na: 588.990 nm, K: 766.400 nm, Ca: 422.673 nm were selected.
Calibration and statistics. For calibration, mixed standard solutions were prepared from the stock standard solution of 1000 µg/mL by dilution with the artificial sweat solution and with 7 M nitric acid. The ranges of the calibration curves were selected to match the expected concentrations (0-5 µg/mL) for all the elements of the samples investigated. Linearity and detection limits were also calculated.
RESULTS AND DISCUSSION
The aim of the study was to quantify the content of metals present in different tissues of the plant materials by digestion experiments. Relatively high levels of essential elements, such as Fe, Mn, Zn, and Ca, have been demonstrated to influence the retention of toxic elements in animals and human beings (Wang et al., 1996). An assessment of these elements could thus be helpful in regulating their use.
The elements Cu, Fe, and Zn present in all the plants samples are necessary for maintaining healthy metabolism (Singh and Garg, 1997). The mineral content of plant, however, varies according to the composition of the soil on which the plants are grown. However, a large variation in the elemental composition was observed among the different tissues of plants, which is shown in Table 1. The variation in elemental concentration is mainly attributed to the differences in botanical structure, as well as in the mineral composition of the soil in which the plants are cultivated.
Table 1
The concentration of essential and trace elements found in tissue of Tribulus terrestris plant
and growing soil samples
Elemental Concentration in ppm (mean ± SD) Sample
Cr Cu Fe Mg Zn Ca* K* Na*
Soil 2.3± 0.40
6.61± 1.43
749.06± 229.45
132.68± 27.24
11.79± 0.16
229.85± 17.69
44.55± 10.78
37.48± 5.80
T.T leaf 15.44± 4.16S
116.00± 29.43S
346.77± 54.69S
4201.40 ± 251.81S’
74.02 ± 9.29S’
48420.00 ± 3256.26S’
39420.00± 2177.04S’
15.88± 4.73NS
T.T flower 34.32± 4.94 S’
251.92± 45.47S’
2637.20± 983.23S
3922.20 ± 168.65S’
248.60± 102.80S
41390.00 ± 2671.70S’
31780.00± 3222.11S’
38.62± 4.13NS

70 R. Selvaraju, G. Thiruppathi, R.G. Raman, D. Dhakshanamoorthy 6
T.T fruit 15.04± 3.11S’
160.87± 24.79S’
252.73± 77.96S’
4795.10± 749.80S’
77.45± 5.51S’
45810.00± 4171.54S’
35720± 4028.12S’
19.00± 3.71S’
* calculated from flame photometer S – significant, NS – not significant at P < 0.05 S’– significant at p < 0.001
Cr plays an important role in diabetes treatment. It is an important element
required for the maintenance of normal glucose metabolism. The function of Cr is directly related to the function of insulin, which plays a very important role in diabetes. Cr deficiencies in diet produce elevated circulating insulin concentrations, hyperglycemia, hypercholesterolemia, elevated body fat, decrease sperm counts, reduce fertility, and shorten life span. Cr is found in the pancreas, which produces insulin. One usable form of Cr is the Glucose Tolerance Factor (GTF) (Zetic et al., 2001). The important constituent of GTF is Cr which helps in potentiating of insulin. These data indicate that the presence of Cr in spices and aromatic herbs is higher than Cr in other foods and beverages; and additional studies, including bioavailability assays, are also necessary to estimate its contribution to the dietary intake of Cr. Concentration of Cr was found to be higher in flower than in the leaf and fruit samples. Chronic exposure to Cr may result in the liver, kidney and lung damage (Zayed and Terry, 2003). Several authors reported that the soil Cr content is an important factor contributing to total Cr concentration in plant tissues. Samples taken from plants growing on high-Cr soils contained higher Cr concentrations than similar plants growing on low-Cr soils (Cary and Kubota, 1990). In the present study, a higher amount of Cr is found in selected area. Cr inflow in the flower is high but lower in leaf and fruit. Accumulation of heavy metals in body tissues and binding to enzymes may disrupt the functioning of cells, which may also lead to the development of tumours or cancers. Generally, there is a positive correlation between the elements. Cr is one of the known environmental toxic pollutants in the world. The problems that are associated with Cr are skin rashes, upset of stomach, ulcers, weakened immune systems, kidney and liver damage, alteration of genetic material, lung cancer and ultimately death.
Cu is an essential enzymatic element for normal plant growth and development but it can be toxic at excessive level (Gupta, 1975), besides, Cu enzymes have been reported to be uniquely important in catalysing the reduction of molecular oxygen to water. In humans, Cu deficiency can cause anaemia and congenital inability to excrete Cu may result in Wilson’s disease (Alikhan et al., 2008). Cu is also involved in the functioning of the nervous system, in maintaining the balance of other useful metals in the body (Failla et al., 1988). Fe is a very essential element for plants and animals. Its deficiency can cause problems in metabolism such as haemoglobin, ferredoxin and various diseases. And the same deficiency is the most prevalent nutritional deficiency in human. It facilitates the

7 Essential and trace elements in Tribulus terrestris 71
oxidation of carbohydrates, protein and fat to control body weight (Alikhan et al., 2008). However, its high concentration also affects plant growth (Hussain et al., 2005). Fe occupies a unique role in the metabolic process. The role of Fe in the body is clearly associated with the transfer of oxygen from lungs to the tissue cells (Sigel, 1978). According to national research council, the maximum tolerable level for cattle is suggested as 1000 ppm. In the present study, flower samples of T. terrestris exceed the tolerable limit. Mg deficiencies encourage deposits of unabsorbed minerals upon heart muscles, kidneys and arteries. The leaves of T. terrestris may control this. Hence, the intakes of T. terrestris leaves are recommended as they reduce the excretions of Mg in urine. The kidneys are very efficient at maintaining body levels, but not in cases where the diet is deficient (Reddy and Reddy, 1997). Mg concentration is higher in fruit samples. Mg acts in the cells of all the soft tissues, where it is part of the protein-making machinery and is necessary for the release of energy. A fair amount of information on these elements and their roles in various physiological processes, their ways of functioning and necessity would be of paramount importance to understand the progression of various diseases and their remedies. Zn is another essential, relatively non toxic and enzymatic metal for both plant and animal. Elements like Zn, Fe and Cr are essential trace elements (micro nutrients) for living organisms. Zn is necessary for the growth and multiplication of cells (enzymes responsible for DNA and RNA synthesis), for skin integrity, bone metabolism and functioning of taste and eyesight. Zn plays an important role in production, storage, and regulation of insulin (Scott and Fischer, 1938). Zn deficiency is characterized by recurrent infections, lack of immunity and poor growth. Growth retardation, male hypogonadism, skin changes, poor appetite and mental lethargy are some of the manifestations of chronically Zn-deficient human subjects (Prasad, 1982). The high concentration of Zn in flowers suggests its possible use in sex tonic, treatment of worms, eye trouble and skin disease. Zn is essential for the function of the immune system cells and Zn has been shown to be effective in the treatment of common cold (Kumari, 1993; Mossad et al., 1996). Zn is also required for the activity of more than 100 enzymes associated with carbohydrate and energy metabolism, protein degradation and synthesis, nucleic acid synthesis, heme biosynthesis and CO2 transport (Kumari, 1993). Zn deficiency impedes host defence systems (Fraker et al., 2000), leading to increased susceptibility to a variety of pathogens and a deficiency of Zn is known to occur in many diseased states that involve the immune system (Prasad, 1998). It has been reported that oral Zn gluconate over the period of illness (13.3 mg every 2 h while awake) significantly reduced the duration of symptoms of the common cold (Mossad et al., 1996). Conforming to the beneficial effects of supplemental Zn in elevating human immune system, our results suggest that the presence of a good amount of Zn may be responsible for the cold relief property of these plants. Several studies have shown the important role of Fe in the human immune system (Van der Strate and Beljaars, 2001). It is well

72 R. Selvaraju, G. Thiruppathi, R.G. Raman, D. Dhakshanamoorthy 8
documented that Fe regulates the function of T-lymphocytes and many studies (in vivo and in vitro) reported that a deficiency in Fe results in impaired cell-mediated immunity (Beard, 2001). Ca is essential for healthy bones, teeth and blood (Charles, 1992; Hughes, 1972), since the health of the muscles and nerves depends on it. It is required for the absorption of dietary vitamin B, for the synthesis of the neurotransmitter acetylcholine, for the activation of enzymes such as the pancreatic lipase. It acts in the process of coagulation, regulation of heart beat, cellular permeability, muscular contraction, transmission of the nerve impulses and enzymatic activity. Ca and K concentration is higher in leaf than in seed and flower. Cr, Cu, Fe, Na and Zn concentration is higher in flower than in leaf and seed. Ca is the most abundant mineral in the human body. The kidney excretes 250 mM a day in pro-urine and resorts 245 mM. Intake of the T. terrestris leaves is recommended as they reduce the excretions of Ca in urine (Reddy and Reddy, 1997). Minerals such as Fe, Mg, Cu and Zn are building blocks of plant bodies. They act as co-factors, catalyst, or inhibitors of all enzymes. Trace elements play an important role in the metabolism of the human body and plants. The presence of trace elements in T. terrestris plants has a same elemental concentration such as Mg (29.60 mg/kg), K (56.20 g/kg), Zn (95.20 mg/kg), and Cr (5.12 mg/kg) (Reddy and Reddy, 1997). The concentration of K and Ca is relatively high in all parts of the samples. Na and K take part in ionic balance of the human body and maintain tissue excitability. Because of the solubility of salts, Na plays an important role in the transport of metabolites. K is of importance as a diuretic. K is an essential element for macronutrients, which are essential for human health and nutrition. It is an important element for the maintenance of acid-base equilibrium and of osmotic pressure of body fluids. Individuals suffering from kidney diseases may suffer adverse health effects from consuming large quantities of dietary K (Malik and Srivastava, 1982). K and Ca are multifunctional nutrients and form an essential part of many important enzymes. In particular, the relatively high Na concentration may pose some dangers for patients who suffer from hypertension, because Na is known to favour and enhance high blood pressure in man. Na is an essential element for macronutrients to human health and nutrition (Martin et al., 1985). The urinary Na play important roles in medicine, both in the maintenance of Na and total body fluid homeostasis and in the diagnosis of disorders causing homeostatic disruption of salt/Na and water balance. Elements are in the order, Ca, K, leaf > seed > flower; Cr, Cu, Fe flower > leaf > seed; Mg: seed > leaf > flower; Na, Zn: flower > seed > leaf. More or less similar concentrations were found in the leaf and fruit of T. terrestris but they differ from flowers. Although the concentrations of Cr, Cu, Fe, Mg, Zn and K in soils were low, we observed higher concentrations in tissues of selected plant. The Na concentration of the plant is lesser than that of the soil. It shows a lower absorption of Na and a higher absorption of other elements. Toxic effects of heavy metals on human health are very well known: damages of organs, disorders in the respiratory

9 Essential and trace elements in Tribulus terrestris 73
tract and lung diseases, dysfunction of heart, blood and blood producing organs, disorders in nervous system, skin diseases, abnormalities in fertility and pregnancy. However, the direct link between the essential elemental content and their curative capacity is not yet established. This information could be used to identify which tissues of plants are more effective for therapeutic use. The data obtained in this work could serve as an important resource for further studies on these medicinal plants.
CONCLUSION
Scientific query and cultural history indicate that the modern therapeutic sciences have been evolved from the folk remedies. The elemental status of plant is necessary for new drug development research in raw herb. Therefore, proper scientific investigations are required to explore the exact medicinal potential of plants. This is very important not only for the safety of consumers, but also for medical advisors. In India, most of the people believe the herbal medicines are safe and non toxic, unlike modern chemotherapeutic agents and who are unaware of what type of metals are present in medicinal plants. The increasing heavy metals in the soil may be the main reason for various types of pollution. By accumulating metals in both the roots and above ground tissue, plants can transfer heavy metal pollutants from soils into the food chain; and this accumulation is one of the most serious environmental concerns of the present day, not only because of potential harmful effects that toxic metal could have on animal and human health. The special care during the administration of routine used medicinal plant may protect the consumer from toxicity. Elemental study on plant will help in deciding the proportion of various active constituents and in managing the dose of a particular formulation. The present study gives a new picture about the presence of some major and trace elements in T. terrestris plants and the soils they grow in. The differences in the concentrations of the elements are not only attributed to the composition of the soil in which the plant grows, but may also depend on the interactions of elements or the plant genotype. Plants are considered as potential source for providing supplemental amounts of trace elements to those in the regular diet. The present study on the presence and concentration of elements in these medicinal plants should prove useful in setting standards for prescribing dosage and duration in the administration of these herbal medicines. The concentration of elements in these tissues of plants showed a different distribution in each part. This information could be used to identify which tissues of plants are more effective for therapeutic use, i.e. the required availability of such element to the particular disease may be chosen from particular part of the plant material. This study reveals that the investigated medicinal plants are good source of Na, K, Ca, Mg and Fe. The plant part of the flowers has excess of some heavy metals.

74 R. Selvaraju, G. Thiruppathi, R.G. Raman, D. Dhakshanamoorthy 10
Acknowledgement. We thank Dr. R.Venkatachalapathy, Reader and in-charge, ICP-OES laboratory, Faculty of Marine Biology, Annamalai University for having given permission for sample analysis. RG, one of the authors, is thankful to the UGC, India, for the financial assistance through RFSMS scheme.
REFERENCES
1. Alikhan S., and Lajbarkhan, 2008, Profile of Heavy Metals in Selected Medicinal Plants. Pakistan Journal of Weed Science Research, 14(1-2), pp. 101-110.
2. Barnes R.M., 1978, Recent advances in emission spectroscopy: Inductively coupled plasma discharges for spectrochemical analysis. CRC Critical Reviews in Analytical Chemistry, 7, pp. 203-296.
3. Beard J.L., 2001, Iron biology in immune function, muscle metabolism and neuronal functioning. Journal of Nutrition, 131, pp. 568S-580S.
4. Cary E.E., and J. Kubota, 1990, Chromium concentration in plants: effects of soil chromium concentration and tissue contamination by soil. Journal of Agricultural and Food Chemistry, 38, pp. 108-114.
5. Charles P., 1992, Calcium absorption and calcium bioavailability. Journal of Internal Medicine, 231(2), pp. 161-165.
6. Failla M.L., and K.E. Seidel, 1988, Total body content of copper and other essential metals in rats fed fructose or starch. Nutrition of Research, 8, pp. 1379-1389.
7. Fraker P.J., L.E. King, T. Laakko, and T.L. Vollmer, 2000, The dynamic link between the integrity of the immune system and zinc status. Journal of Nutrition, 130, pp. S1399–S1406.
8. Greenfield S., H.Mc.D. McGeachin, and P.B. Smith, 1975, A Plasma emission sources in emission spectroscopy I. Talanta, 22, pp. 1-15.
9. Gupta U., 1975, Copper in the Environment. In: Nariagu JO editor, John Wiley and Sons, New York.
10. Hughes M.N., 1972, The Inorganic Chemistry of Biological Processes, Wiley, London. 11. Hussain I., I. Khan, and Wali-Ullah, 2005, Comparative study on the investigation of heavy
metals in Tribulus terrestris growing in polluted and unpolluted areas of Peshawar Pakistan. Journal of Chemical Society of Pakistan, 27, pp. 5-11.
12. Kumari B.S., and R.K. Chandra, 1993, Over nutrition and immune responses. In: R. Ditoro, & R. K. Chandra, (Eds.). Obesity, dietary lipids and hyperlipidemia. Nutrition Research, 13(1), pp. S3-S18.
13. Malik C.P., and A.K. Srivastava, 1982, Text book of Plant Physiology, New Delhi, Ludhiana. 14. Martin Jr., D.W. Mayers, P.A. Rodwell, V.W. Granna, and D.K., Harper’s, 1985, Review of
Biochemistry. 20th ed. Lange Medical Publication, California, pp. 651-660. 15. Mossad SB., 1996, Zinc gluconate lozenges for treating the common cold. Annals Internal
Medicine, 125(2), pp. 81-88. 16. Prasad A.S., 1982, Clinical, Biochemical and Nutritional Aspects of Trace Elements. Alan R.
Liss, Inc, New York. 17. Prasad A.S., 1998, Zinc and immunity. Molecular and Cellular Biochemistry, 188, pp. 63-69. 18. Reddy R.K.P. and J.S. Reddy, 1997, Elemental concentrations in medicinally important leaf
materials. Chemosphere, 34, pp. 2193-2212. 19. Scott D.A., and A.M. Fischer, 1938, The insulin and zinc content of normal and diabetic
pancreas. Journal of Clinical Investigation, 17, pp. 725-728. 20. Serror-Armah Y., B.J.B. Nyarko, E.H.K. Akaho, A.W.K. Kyere, and S. Osae, K. Oppong-
Boachie, and E.K.J. Osea, 2001, Activation analysis of some essential elements in five

11 Essential and trace elements in Tribulus terrestris 75
medicinal plants used in Ghana. Journal of Radioanalytical and Nuclear Chemistry, 250(1), pp. 173-176.
21. Serror-Armah Y., B.J.B. Nyarko, E.H.K. Akaho, A.W.K. Kyere, S. Osae, and K. Oppong-Boachie, 2002, Multielemental analysis of some traditional plant medicines used in Ghana. Journal of Trace and Microprobe Techniques, 20(3), pp. 419-427.
22. Sheded G.M., I.D. Pulford, and I.A. Hamed, 2000, Presence of major and trace elements in seven medicinal plants growing in the South-Eastern Desert Egyptian. Journal of Arid Environments, 66, pp. 210-217.
23. Sigel H.Ed., 1978, Iron in model and natural compounds. Metals in Biological Systems, Marcel Dekker, New York, 7.
24. Singh V., and A. N. Garg, 1997, Availability of essential trace elements in Ayurvedic Indian medicinal herbs using instrumental neutron activation analysis. Applied Radiation and Isotopes, 48(1), pp. 97-101.
25. Soriani R.R., L.C. Satomi, and T.J.A. Pinto, 2005, Effect of ionizing radiation in ginkgo and guarana. Radiation Physics and Chemistry, 73, pp. 239-242.
26. Su L., G. Chen, S. Feng, W. Wang, Z. Li, H. Chen, Y. Liu, and Y. Pei, 2009, Steroidal saponins from Tribulus terrestris. Steroids, 74, pp. 399-403.
27. Tunhai Xu., Xu. Yajuan, Yue Liu, Xie. Shengxu, Si. Yunshan, and Xu. Dongming, 2009, Two new furostanol saponins from Tribulus terrestris L. Fitoterapia xxx. Fitoterapia, 80(6), pp. 354-357.
28. Van der Strate B., and L. Beljaars, 2001, Antiviral activities of lactoferrin. Antiviral Research, 52, pp. 225-239.
29. Wang C.F., M. J. Duo, E. E. Chang, and J. Y. Yang, 1996, Essential and toxic trace elements in the Chinese medicine. J. Radioanal. Nuclear Chemistry. 211(2), pp. 333-347.
30. WHO-World Health Organization, 2003, Traditional Medicine, Fact sheet No. 134. 31. Xiao P.G., 2001, Modern Chinese Materia Medica: (I). Beijing: Chemical Industry Press,
pp. 481. 32. Zayed A.M., and N. Terry, 2003, Chromium in the environment: factors affecting biological
remediation. Plant and Soil, 249, pp. 139-156. 33. Zetic V.G., V. Stehlik-Tomas, S. Grba, L. Lutilsky, and D. Kozlek, 2001, Chromium uptake by
Saccharomyces cerevisiae and isolation of glucose tolerance factor from yeast biomass. Journal of Biosciences, 26(2), pp. 217-223.
