romania general transport master plan - ministerul … · romania general transport master plan ......
TRANSCRIPT

Transportation
Government of Romania Ministry of Transport
February 2015
Romania General Transport
Master Plan
Summary of the Entire Project

Prepared by: Checked by: Iain Mobbs, Frank Mohan, Geoff Clarke Craig Bell Johan Els Regional Director
Approved by: Martin Bright Director
Romania General Transport Master Plan
Summary of the Entire Project
Rev No Comments Checked by Approved by Date
1 First Draft for Client Comment CB MJB 12/02/2015
Strada Polona, Nr. 68-72, Sector 1, Bucuresti, Romania Telephone: +4 021 316 1163 Website: http://www.aecom.com Job No: 60268467 Reference: Executive Summary Date Created: February 2015 This document has been prepared by AECOM Ingenieria SRL for the sole use of our client (the “Client”) and in accordance with
generally accepted consultancy principles, the budget for fees and the terms of reference agreed between AECOM Ingenieria
SRL and the Client. Any information provided by third parties and referred to herein has not been checked or verified by AECOM
Ingenieria SRL, unless otherwise expressly stated in the document. No third party may rely upon this document without the prior
and express written agreement of AECOM Ingenieria SRL.
IMPORTANT NOTE The current draft document should be read strictly from the perspective of the following:
CAVEATS
Status of current document 1. The current document is a working draft of the Master Plan Report. This version is not final and will be
updated with the results of more detailed analysis which is being carried out in particular for the rail, ports, airports and intermodal transport sectors. The updating process will be done in parallel with the incoroporation of the feed-back collected from the public consultation process.
2. The Strategic Environmental Assessment (SEA) procedure (including the Appropriate Assessment) is ongoing. Upon completion its conclusions will be incorporated in the final version of the Master Plan report.
Coverage of the Master Plan 3. The Master Plan refers to the major objectives of the national transport system. Therefore it is a high-
level planning instrument relevant for major interventions (projects and other actions) with significance for the objectives of the national transport system – which are suitable for modelling, apprasial and prioritisation at Master Plan level. This means a range of small scale interventions are not within the scope of the Master Plan, which does not mean they shouldn’t be financed by the Ministry of Transport, but that the Master Plan is not a proper instrument for planning it and therefore that there should be a different process of defining, planning and prioritising such interventions. Typical interventions outside the scope of the Master Plan are:
(i) Actions required for the day-to-day running of business (regular operations and maintenance activities of the various entities under MoT), e.g. administrative buildings,office equipment, consumables, operating costs, regular maintenance, etc.
(ii) Investments of nature of such small size and detailed nature that goes well below the Master Plan level, e.g. small scale renewals/rehabilitations of small rail stations, small scale safety interventions, small scale intra-zone interventions which cannot be modelled, etc.
4. In addition, there is another group of projects not evaluated within the Master Planning exercise. These are the “Reference Case” projects i.e. those already committed investments which had finacing already decided (and often were already under construction) at the time of defining the “Reference Case” for the purpose of the National Transport Model (year 2013). The list and map of the committed “Reference Case” projects assumed to continue to be implemented “by default” is provided in Annex …
Time horizon of the Master Plan 5. The Master Plan planning horizon is the year 2030. Given the level of uncertainty associated with long-
term forecasting, any action beyond the year 2030 should be reconfirmed on the basis of an updated plan (e.g. carried out within 10 years time i.e. in 2025).
6. However, for more volatile sectors, especially airports – where the level of uncertainty in the traffic forecast is much higher than e.g. for roads sector, the Master Plan horizon to be taken up for implementation should not exceed the year 2020, whilst any projects beyond 2020 should be re-confirmed on the basis of the actual market (demand/traffic) developments.
Level of analysis and relation with Feasibility Studies 7. The level of the Master Plan analysis is high by its very nature. Consequently and in order to ensure a
fair comparison basis across projects and thus a relevant comparison of their economic performance indicators, high-level uniform assumptions have been made on the project costs (based on average values per km/type of infrastructure/type of terrain). This means the cost estimates used in the Master Plan do not necessarily match precisely more detailed estimates from e.g. existing Feasibility Studies (FS), which is not an error but a methodological choice. However, normally the difference between the

Master Plan estimates and FS values should not exceed <25-30%>, which is the usual approximation margin for this level of analysis.
8. Inherent from the high level of analysis is the approximation of the economic performance, which because of (i) the margin in the cost estimation and (ii) the scale of the economic benefits (i.e. some local benefits –e.g. intra-zone- might not be captured by the National Transport Model) should be considered preliminary until a more detailed analysis at the level of each project is carried out further at FS level. A methodological consequence was the choice of not excluding projects at the usual threshold of the economic discount rate (5%) but lowering the pass/fail bar to 3% EIRR at this level, whilst the final decision on the economic acceptance of any project would be (re-)confirmed on the basis of the more detailed analysis of both the costs and benefits at FS level.
9. The same logic applies to the technical solutions. The Master Plan defined generic measures (interventions) to serve the specific operational objectives defined in response to the problems identified – e.g. “Improve travel speeds on Bucharest – West Road Corridor”. To enable model testing, costing and economic appraisal, certain preliminary technical solutions have been defined e.g. 2x2 motorway/express-way, rehabilitation of a rail section to a specific speed, extension of a passenger terminal to a certain capacity, etc. Such technical solutions will need to be however reconfirmed at the level of each particular project within the FS on the basis of a detailed options analysis including more detailed cost, capacity, economic and environmental impact analyses. In this respect it is imperative that the ToR for the new Feasibility Studies launched for the Master Plan projects includes clear and explicit provisions for such capacity and options analysis.
10. Similarly, the recommended approach - which will have to be reconfirmed for each case within Feasibility Studies - is that the infrastructure should be designed in such a way as to allow future development (for example from an expressway profile to a motorway profile, from 2 lanes to 3 lanes per direction, etc) if and when such developments are justified by the demand and covered by funding sources.
Conclusions 11. In summary, this Master Plan has been produced at a point in time based upon the best information
available at that time and underpinned by a robust process which has been used to appraise the various schemes being proposed. There will be changes which occur over time which will impact upon the costs, standards and performance of each individual infrastructure scheme proposed. These include, inter alia:
(i) Changes in the timetable for implementation of other schemes, across all modes, which impact upon the scheme in question;
(ii) Improved information as a consequence of feasibility, or other, studies in to the particular scheme; and
(iii) External factors, such as changes in the macro level economic performance of the country, which impact upon forecast demand for a particular scheme.
12. Each of these will potentially affect the required standard of the improvement, the costs of implementation and the economic merit of an individual scheme. It is important therefore that the Master Plan is seen as a live document which provides a robust platform for moving the transport sector forward, but which also needs to be maintained and reviewed over time in order to ensure that the objectives for improving the transport sector are met.
13. This Master Plan Report will be supported by a separate Implementation Plan which will outline the schedule for when projects will be delivered. The Implementation Plan will take into account project maturity and eligibility for alternative funding streams, criteria which have not been included in the multi criteria assessment which has been used to develop the Master Plan list of projects. It is therefore possible that in the Implementation Plan projects will be delivered in a different order to that indicated in the prioritised list of projects in this Master Plan Report.
AECOM Summary of the Entire Project 5
Glossary and Terminology ............................................................................................................................................................ 6
Introduction ..................................................................................................................................................................................... 7
1. Introduction ....................................................................................................................................................................... 8
2 Existing Situation ............................................................................................................................................................ 10 2.1 Introduction .......................................................................................................................................................... 10 2.2 Rail Transport ...................................................................................................................................................... 10 2.3 Road Transport .................................................................................................................................................... 11 2.4 Ports and Waterways ........................................................................................................................................... 12 2.5 Aviation ................................................................................................................................................................ 14 2.6 Intermodal Transport ........................................................................................................................................... 16
3 Overall Objectives ........................................................................................................................................................... 19 3.1 High-Level Objectives .......................................................................................................................................... 19 3.2 Interventions ........................................................................................................................................................ 20
4 Testing projects .............................................................................................................................................................. 22
5 Project Appraisal Role of CBA and MCA ...................................................................................................................... 25
6 ES and EES Scenarios .................................................................................................................................................... 30 6.1 Economically Sustainable (“ES”) Scenario .......................................................................................................... 30 6.2 Appraisal of the ES and EES Scenarios .............................................................................................................. 38 6.3 Economic Indicators ............................................................................................................................................ 39
7 Funding Analysis ............................................................................................................................................................ 43
8 Public Consultation......................................................................................................................................................... 48
9 Cross-Sectional Analysis ............................................................................................................................................... 50 9.2 Operational Performance of the EES Scenario ................................................................................................... 50 9.3 Allocation of resources per mode: € per pass km, € per tonne km ...................................................................... 53 9.4 Heavy Goods Vehicle Road User Charge (RUC) ................................................................................................ 54 9.5 Accessibility ......................................................................................................................................................... 56
10 Implementation Strategy ................................................................................................................................................ 62 10.1 Introduction .......................................................................................................................................................... 62 10.2 Road projects Implementation Programme ......................................................................................................... 66 10.3 Rail Projects Implementation Programme ........................................................................................................... 73 10.4 Ports and Waterways Implementation Programme.............................................................................................. 78 10.5 Aviation Projects Implementation Plan ................................................................................................................ 83 10.6 Intermodal Transport Projects ............................................................................................................................. 85
Table of Contents
AECOM Summary of the Entire Project 6
ACN The Administration of Navigable Channels in Romania AIS Automatic Information System to track ships APDF The Administration of the River Ports in Romania, located in Giurgiu Base Year 2011, the year for which the National Transport Model was calibrated. CESTRIN The Centre of Research and Road Technical Studies in Romania, part of CNADNR CFR Calatori The publicly-owned passenger train operating company
CFR Infrastructure (also CFR SA)
The publicly-owned rail infrastructure company
CFR Marfa The publicly-owned freight train operating company CNADNR The Administration of National Roads and Motorways in Romania Desiro Train A modern diesel multiple unit train DMU Diesel multiple unit: typically a 2 or 4 car set that can be coupled together and can be
driven from either end. ECR AECOM Existing Conditions Report EMU Electric multiple unit Euro RAP European Road Assessment Programme, an international organisation dealing with
road safety Fairway The navigable part of the River Danube GDP Gross Domestic Product GJT Generalised Journey Time. It includes waiting, access time and fares (converted to
time equivalents) GTMP General Transport Master Plan ILS Instrument Landing System Intermodal Transport
Transport that uses two or more modes, for example road and rail, or water and road.
Inter-Regio Limited stop passenger rail services NAPA North Adriatic Ports Association NTM National Transport Model Passenger kms The aggregate distance travelled by passengers PCN Pavement Classification a measure of the loading capacity of runways and taxiways PSC Public Service Contract, the agreement between the government and rail operators to
provide socially necessary rail services Push-pull A type of loco-hauled train operation where the train can be driven from either end Push Tug The type of tug used on the River Danube to push barges Reference Case The transport networks that would exist if existing committed projects were
completed. It forms a reference against which “new” projects can be assessed. Regio Stopping passenger rail services Tonne kms The aggregate distance freight is carried UNTRR National Union of Road Hauliers from Romania UTI Unité du Transport Intermodal, a container or unit load
Glossary and Terminology

Introduction
AECOM Summary of the Entire Project 8
1.1.1 The General Transport Master Plan (GTMP) represents a unique opportunity for Romania. For
the first time Romania will have a soundly-based, comprehensive plan for all the major modes of
transport, for the period up to 2030. It provides a staged programme of interventions which
encompass not only proposals to improve the transport infrastructure, but also dealing with
maintenance, management and operations, and safety.
1.1.2 The Master Plan also provides the justification for projects to be included in the Sectoral
Operational Programme for Transport (SOPT) for the period 2014 – 2020 in detail, and for
projects promoted under the Connecting Europe Facility (CEF). It will also provide the basis for
projects to be financed in the period beyond 2020, although the precise nature of the successor
programmes to the SOPT have yet to be decided.
1.1.3 The Master Plan will only succeed in its objectives if there is continuous, whole-hearted support
for its programme over the medium and long term. Major transport investments take 6-10 years
to plan, two – four years to build, and have an economic life of 30-50 years. This applies not
only to the organisations who are responsible for implementation of the projects and policies, but
also to the successive Governments and key Ministries such as Transport, European Funds, and
Finance.
1.1.4 Providing good-quality transport is not an end in itself. Efficient transport is a critical component
of economic development, both nationally and globally. Transport availability affects global
development patterns and can be a boost or a barrier to economic growth within individual
nations. Transportation investments link factors of production together in a web of relationships
between producers and consumers to create a more efficient division of production, leverage
geographical comparative advantage, and provide the means to expand economies of scale and
scope.
1.1.5 The overall process for creating the Master Plan is shown on Figure 1.1. The process has three
main elements
a Policy input which determines the overall objectives, the funds available to implement the
Master Plan; the Strategic Environmental Assessment (SEA), and feedback from Public
Consultation;
the Appraisal Process, which determines how projects are selected, tested, and the criteria
for inclusion in the Master Plan and Implementation Strategy; and
the Analytical Tools for testing and quantifying the impact of projects. The most important
are the National Transport Model (NTM) and the Cost-Benefit Analysis (CBA) Tool.
1.1.6 At various stages in the Project key Reports were produced which describe the important
processes in more detail. These are also shown on Figure 1.1.
1. Introduction

AECOM Summary of the Entire Project 9
Figure 1.1 Master Plan Processes

AECOM Summary of the Entire Project 10
2 Existing Situation
2.1 Introduction
2.1.1 The Plan involved a thorough investigation of the existing conditions, problems and their
underlying causes. Across all modes, four common themes emerged:
Romania has a serious infrastructure deficit, in terms of its quality: coverage of the
transport networks is generally good.
Inadequate Maintenance and Renewals, particularly of the rail networks has been
inadequate leading to a decline in level of service and reliability, and contributing to a
substantial decline in passenger volumes especially, and to a lesser extent, freight volumes.
This situation is largely a result of inadequate finance over a long period of time, but it is
exacerbated by Management and Operating practices, which affect rail, road and water
transport, but again rail is particularly adversely affected.
Safety is a concern, particularly on the road network where Romania has the worst safety
record in Europe.
2.1.2 In the following paragraphs we give an overview of the current status of each mode of transport,
the most serious issues to be addressed, and a summary of the Master Plan approach in
addressing these problems. There is a discussion in detail in each of the modal chapters in the
Master Plan Report (Chapters 4-8), and a detailed analysis of the problems of each mode in the
Problem Definition Report, available on the Ministry of Transport’s website.1 The connection
between Problems, Objectives and Interventions is described in a series of Technical Notes.
2.1.3 The availability of funds constrains investment in transport in Romania, as it does in all European
countries. Therefore, the Master Plan cannot contain solutions for all the identified problems and
still remain a realistic plan. Therefore, the final list of interventions is a list of priorities for public
sector investment for the foreseeable future.
2.2 Rail Transport
2.2.1 In our opinion, it is no exaggeration to say that Romanian Railways are in a crisis situation.
Several steps are required. These include:
serious reforms to the structure of the railway and the PSC, in order to encourage decisions
which have a commercial return;
substantially increased spending on maintenance and renewals to achieve European
standards, to deal with the backlog of repairs, and maintain the primary route network in good
condition;
increased investment in rehabilitation to current design speeds on the main national and
international lines, and
the introduction of regular interval timetable, convenient for passenger needs.
Unless these steps are taken, it is our view that within 10 years the railway will cease to play a
national role in Romania.
2.2.2 Since 1990 passenger kilometres have fallen by 90%, and freight kilometres by 70%, although
the position with rail freight has stabilised. Average speeds for passenger trains have fallen to
45kph in 2012 from 60kph in 1990, and the average speed of freight trains is a mere 23kph. 1 http://www.ampost.ro/pagini/master-plan-general-de-transport

AECOM Summary of the Entire Project 11
Between 60-80% of the track-related assets are life expired, there were 1,800 temporary speed
restrictions in 2012, and we estimate that current speeds are 20-30% below the design speed of
the track. The track and other fixed assets are under-utilised: about 90% of traffic (both
passengers and freight) is transported on 54% of the routes (63% of track-km), whilst about 20%
of the routes (14% of track-km) carry only 1% of the traffic. 1,000 stations generate less than 50
trips per day and 533 stations have less than 10 passengers per day.
2.2.3 A trend-based forecast suggests that passenger kilometres would decline by a further 75% by
2030, while the NTM analysis suggests a decline of 22% by 2020 and 40% by 2030. Whichever
forecast is assumed, the future is bleak without drastic action.
2.2.4 These reductions are primarily due to three factors:
inadequate maintenance which leads to longer, and therefore uncompetitive, journey times;
a timetable which is not commercially driven (the PSC is mainly dependant on train kms
rather than timetables which meet customer needs); and
demographic changes such as the dispersion of population and the increase in car
ownership.
2.2.5 Tests using the National Model suggest that inadequate maintenance is responsible for a large
proportion of the forecast 22% decline in passenger kilometres.
2.2.6 The Master Plan proposals concentrate largely on the first two elements,that of increasing
maintenance spend to European norms, and comprehensive rehabilitation of the mainline
network, combined with introducing a regular interval timetable for Inter-Regio services operated
by modern rolling stock. At current (low) levels of car ownership, there is little that Government
can do to limit car ownership, but there are many interventions which can be introduced to make
rail more attractive and increase rail useage.
2.2.7 There are also institutional changes that can be made which will help to make the rail industry in
Romania more dynamic. These are included in the Master Plan interventions.
2.3 Road Transport
2.3.1 Road maintenance is also inadequate, although the situation is not as serious as that of rail.
Only 50% of the National Road network in good condition, and approximately 65% of the
national network is beyond its service life. The estimate using the method developed for the
World Bank suggests that regular maintenance and renewals expenditure should increase by
€560m and rehabilitation and modernisation by €650m per annum to clear the backlog by 2020.
2.3.2 The Master Plan therefore contains a larger financial allocation for road maintenance and
renewals that will, over time, keep the national network in a mostly good condition. The Plan
also makes a recommendation regarding the organisation of the maintenance contracts which
will improve the quality and efficiency of maintenance.
2.3.3 Slow journey times lead to inefficient use of both working and non-working time and have an
adverse impact on national and regional economies, and reduce employment, commercial,
shopping and leisure activities. Romania is a large country with many regional centres, and the
economic competitiveness of these centres is adversely affected by the poor level of service
offered by the road network.
2.3.4 The level of service provided by the road network is generally poor, in terms of average speeds.
These are 66 kph on the National Road network, 44% below the target of 100kph for the EU

AECOM Summary of the Entire Project 12
Core and Comprehensive Networks. Romania has the lowest provision of motorway-standard
road in the EU per head of population.
2.3.5 The Master Plan therefore contains proposals to develop a network of motorways which will link
the main economic regions of Romania, and its main trading partners, with a motorway standard
network. This will be supplemented by a modern expressway-standard (ie 2*2 lanes with grade-
separated junctions) network which will complete a national network of high quality roads.
2.3.6 Romanian has the worst road safety record in the EU. In terms of the following Key
Performance Indicators:
Fatalities per million inhabitants: 94 against an EU average of 60, rank 24th out of 28
Fatalities per 10 billion passenger kilometres: 259 versus an EU average of 61, rank 28th
out of 28; and
Fatalities per million passenger cars: 466 versus an EU average of 126, rank 28th out of 28.
2.3.7 While motorways and expressways have a much lower accident rate than single-carriageway
roads, it is not feasible, or economic, to replace all single carriageway roads by these safer
roads. Therefore, the Master Plan also contains proposals for low cost safety improvements at
138 worst locations (“blackspots”) for accidents across the country. These projects give a very
good return in economic terms, and will provide safer environments for both pedestrians and
drivers before the much more expensive road building programme is completed.
2.4 Ports and Waterways
2.4.1 Romania has three main maritime ports, Constanta, Galati and Braila. The latter two are located
on the maritime section of the River Danube, while Constanta is a deep water port on the Black
Sea. It is connected with the River Danube via a man-made channel, and has good road and rail
connections with Bucharest, and thence the south and west of the country and Hungary.
2.4.2 Connections of these three ports with central, and Northern Romania are less good and the road
and rail projects adress this issue.
2.4.3 There are also smaller maritime ports of Mangalia and Midia on the Black Sea, and a series of
ports on the River Danube, the largest of which are Giurgiu, Oltenita and Drobeta Turnu-Severin.
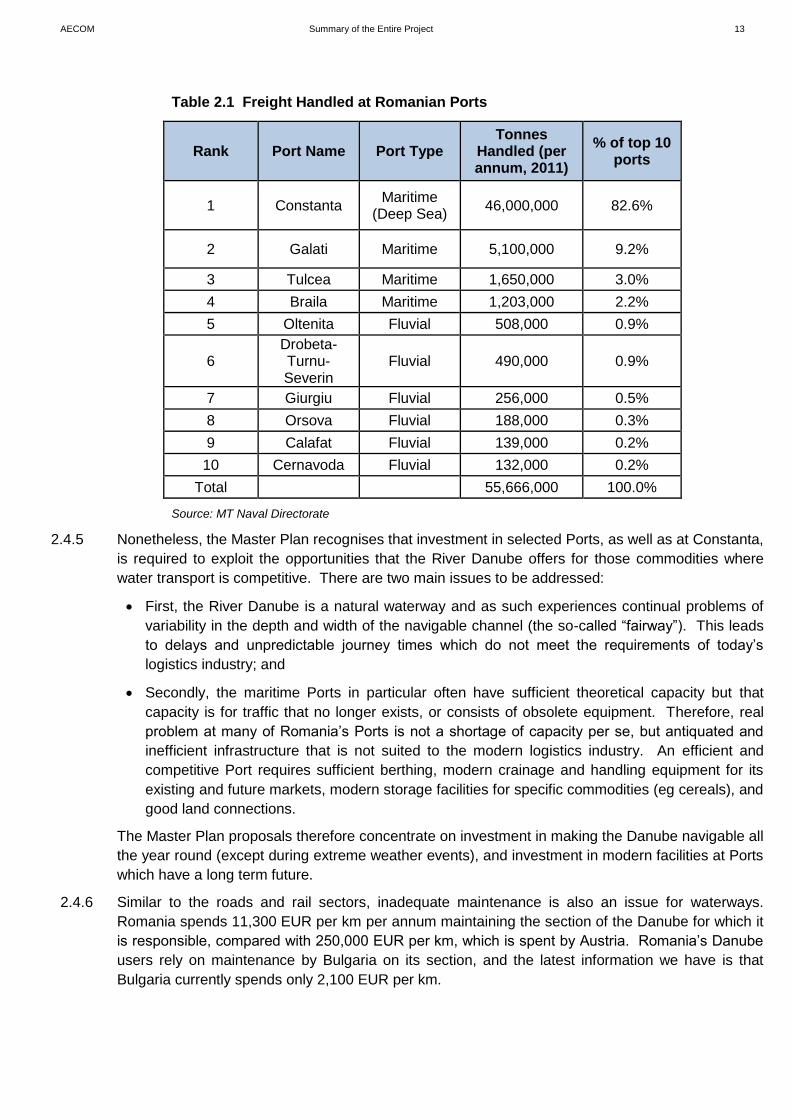
2.4.4 Constanta is by far the largest Port in Romania. Table 2.1 shows data of tonnes handled in 2011
for the top 10 ports in Romania. Constanta handled 83% of the total freight in these ports, the
next highest being Galati with 9%. These data demonstrate the importance of Constanta as the
main maritime gateway for Romania’s imports and exports.
AECOM Summary of the Entire Project 13
Table 2.1 Freight Handled at Romanian Ports
Rank Port Name Port Type Tonnes
Handled (per annum, 2011)
% of top 10 ports
1 Constanta Maritime
(Deep Sea) 46,000,000 82.6%
2 Galati Maritime 5,100,000 9.2%
3 Tulcea Maritime 1,650,000 3.0%
4 Braila Maritime 1,203,000 2.2%
5 Oltenita Fluvial 508,000 0.9%
6 Drobeta-Turnu-Severin
Fluvial 490,000 0.9%
7 Giurgiu Fluvial 256,000 0.5%
8 Orsova Fluvial 188,000 0.3%
9 Calafat Fluvial 139,000 0.2%
10 Cernavoda Fluvial 132,000 0.2%
Total 55,666,000 100.0%
Source: MT Naval Directorate
2.4.5 Nonetheless, the Master Plan recognises that investment in selected Ports, as well as at Constanta,
is required to exploit the opportunities that the River Danube offers for those commodities where
water transport is competitive. There are two main issues to be addressed:
First, the River Danube is a natural waterway and as such experiences continual problems of
variability in the depth and width of the navigable channel (the so-called “fairway”). This leads
to delays and unpredictable journey times which do not meet the requirements of today’s
logistics industry; and
Secondly, the maritime Ports in particular often have sufficient theoretical capacity but that
capacity is for traffic that no longer exists, or consists of obsolete equipment. Therefore, real
problem at many of Romania’s Ports is not a shortage of capacity per se, but antiquated and
inefficient infrastructure that is not suited to the modern logistics industry. An efficient and
competitive Port requires sufficient berthing, modern crainage and handling equipment for its
existing and future markets, modern storage facilities for specific commodities (eg cereals), and
good land connections.
The Master Plan proposals therefore concentrate on investment in making the Danube navigable all
the year round (except during extreme weather events), and investment in modern facilities at Ports
which have a long term future.
2.4.6 Similar to the roads and rail sectors, inadequate maintenance is also an issue for waterways.
Romania spends 11,300 EUR per km per annum maintaining the section of the Danube for which it
is responsible, compared with 250,000 EUR per km, which is spent by Austria. Romania’s Danube
users rely on maintenance by Bulgaria on its section, and the latest information we have is that
Bulgaria currently spends only 2,100 EUR per km.

AECOM Summary of the Entire Project 14
2.5 Aviation
2.5.1 The aviation sector in Romania is well developed with a number of major airlines serving
destinations across Europe, particularly the major national and international airport at Bucharest,
but also from the west of Romania. The sector is well developed with a number of major airlines
serving destinations across Europe.
2.5.2 Airports play an important role in the economic development of a region, as well as the nation as a
whole. Airports facilitate the rapid movement of people and high value, time-sensitive goods and
therefore foster trade and commerce. Tourism is relatively undeveloped in Romania. Airports,
together with services by low-cost operators in particular, offer increased accessibility, which in turn
fuels the tourism sector. Increasing the number of visitors and airport users means more money
flows into the local economy.
2.5.3 The numbers of passengers using Romanian airports is set out in Table 2.2 below. Bucharest
(Henri Coanda) is the national air gateway for international travelers, and it accounts for
approximately 67% of all passenger traffic. Together with Timisoara and Cluj, these three airports
accounts for 89% of passenger traffic.
Table 2.2 Passengers at Romanian Airports, 2012
Airport Domestic International TOTAL
Bucharest (Henri Coanda)
649,682 6,670,884 7,320,566
Timisoara 336,152 1,019,867 1,356,019
Cluj-Napoca 189,139 815,682 1,004,821
Bacau 21,106 306,308 327,414
Targu Mures 10,477 216,361 226,838
Iasi 139,185 45,298 184,483
Sibiu 26,482 150,424 176,906
Constanta 11,647 64,817 76,464
Oradea 58,887 1,659 60,546
Craiova 19,397 11,872 31,269
Suceava 26,224 984 27,208
Satu Mare 19,534 3,207 22,741
Baia Mare 18,017 551 18,568
Arad 0 0 0
Brasov 0 0 0
TOTAL 1,525,929 9,307,914 10,833,843
Source: Civil Aviation Authority
2.5.4 In a country with the size, and topography of Romania there is potential for air to play an increasing
role. The Master Plan identifies a hierarchy of airports to give regional access to international air
travel, as well as domestic connectivity to more localised catchments. The designations are as
follows:
Major International Airport - airport with international routes serviced by national carriers, low
cost carriers, chartered flights (above 5 million passengers per annum)

AECOM Summary of the Entire Project 15
International Hub Airports - airports that serves as hubs with European and regional routes
served by national carriers, low cost carriers and chartered flights (between 1 million and 5
million passengers per annum)
Regional Airports - airports mostly served by low cost carriers and chartered flights within
Romania and adjacent countries (between 30,000 and 1 million passengers per annum)
Smaller Regional Airports - airports that is mainly served by domestic and chartered flights
(below 30,000 passengers per annum).
2.5.5 Figure 2.1 show the future designation of airports in Romania.
Source: AECOM Analysis
Figure 2.1: Location and Future Classification of Airports in Romania
Further details are given in Chapter 7 of the Master Plan Report.
2.5.6 That said there are a number of issues to be addressed in order to ensure continued growth and
competitiveness of the sector. These are:
Upgrading of navigational equipment, and aircraft de-icing equipment, to enable all the year
round operations except during extreme weather events;
Lengthening and strengthening runways to enable airports to handle the types of aircraft
typically used by European operators, and to perform their designated roles;
Increasing taxiway and apron capacity where there is sufficient demand;

AECOM Summary of the Entire Project 16
Increasing passenger terminal capacity to meet forecast demand;
Improvements to surface access (fixed public transport links such as metro and heavy rail)
where demand is sufficient to justify these projects; and
More detailed assessments of the demand for air cargo terminals, especially at regional
airports
2.5.7 The air sector differs from other modes in that demand is heavily dependent on both terminal
facilities and services. An airport without appropriate flights does not generate air traffic, but in turn
an airline will not start services unless suitable facilities are available on the ground. This reality
has two practical consequences for the Master Plan:
Our forecasts for air passenger traffic are asessments of potential demand if the airport can
attract services, particularly international flights, commensurate with its designation; and
Our recommendations for investment in increased capacity are conditional upon airports having
agreements with operators for additional flights in place, if the airport improves its facilities. We
regognise the practical problems with such a policy but the master Plan cannot support
speculative investments.
2.6 Intermodal Transport
2.6.1 Intermodal transport, by which we mean road/rail and water/rail where the trunk haul is made by
rail, represents the future for modern rail freight transport. Since the 1960s there has been a global
trend of increased containerisation of goods. Containers are unitised in a standard format which
allows global shipping companies (as well as other transport companies) to effectively and
efficiently plan their loads. It also means that handling equipment is the same, and handling costs
are far below those of traditional methods. Containerisation reduces the chance of theft and
spillage as containers are sealed at source, reducing insurance costs. It means that turnround time
of ships and loaded trains has more than halved and transport costs have reduced sharply.
Containers can be used transport most types of commodities including re-frigerated goods and
liquids.
2.6.2 However, the degree of containerisation in Romania transports is far below that of many other
European countries (although greater than in neighbouring Bulgaria). The data in table 10.4 shows
that containerisation is particularly advanced in Italy, Turkey, Austria and Germany but Bulgaria and
Romania are lagging behind. The volume and percentage in countries like Austria are high due to
the Alpine effect where on certain routes it is compulsory to use rail services and there is a
considerable volume of transit traffic. But the sheer size of Romania, and the potential for transit
traffic, means that intermodal transport should have a bright future.
2.6.3 The low level of containerisation in Romania is due to a number of factors. These include historic
working practices, relatively cheap labour, lack of investment in inland terminals including cranage
and secure storage, lack of modern supply chains, lack of modern rail wagons designed for efficient
container operation, and very slow, unreliable journey times by rail.
2.6.4 The Master Plan prposals address these issues in several ways. We have identified locations
where intermodal terminals will be successful in atttracting viable throughput of more than 7,500
TEU per annum by 2030. Once this network is established we are cofident that our forecasts are at
the lower end, since in Romania intermodal transport is essentially a „new Mode” and therefore
forecasting is inherently uncertain. In chapter 8 of the Master Plan report we also set out potential
throughputs which are considerably in excess of our base forecasts.

AECOM Summary of the Entire Project 17
2.6.5 These terminals will provide a network of intermodal terminals across Romania. There are four
major „tri-modal” terminals located at Constanta and the major river ports, six existing terminals
which are operating successfully, and 10 new terminals which could either be re-furbishments of
existing terminals, or, more likely, new builds with modern facilities. Some of these could be
integrated into commercial developments such as „freight villages” with other wharehousing and
distribution facilities, haulage companies businesses and vehicle servicing, but we have assesed
and costed only the intermodal elements.
2.6.6 The network of major intermodal terminals is shown on Figure 2.2.
Source: AECOM Ports and Inland Intermodal Terminal Analysis and NTM
Figure 2.2 Proposed Network of Intermodal Terminals
2.6.7 The operation of intermodal terminals is closely integrated with the logistics industry, which is 100%
privately run. Having consulted existing and potential operators of intermodal facilities, our
recommendation is that the intermodal terminals should be designed, built and operated by the
private sector in order to fully exploit their potential. However, as we point out, operating intermodal
terminals is virtually a start-up industry in Romania and in many cases a small amount of public
invstment may be required.
2.6.8 We recommend that, at a minimum, the public sector contributes planning permits, land purchase,
and the connections to the national, or local road and rail networks.
2.6.9 The rail rehabilitation proposals described outlined above will also benefit rail freight transport,
because the reabilitation will include re-signalling, regenerative braking .and increases in axle loads
to 22.5 tonnes, the European standard. But for block container trains in particular we also
recommend raising the speed limit to 120 kph and to change the protocols of train control so that
these trains are given higher priority.

AECOM Summary of the Entire Project 18
Overall Objectives
AECOM Summary of the Entire Project 19
3.1 High-Level Objectives
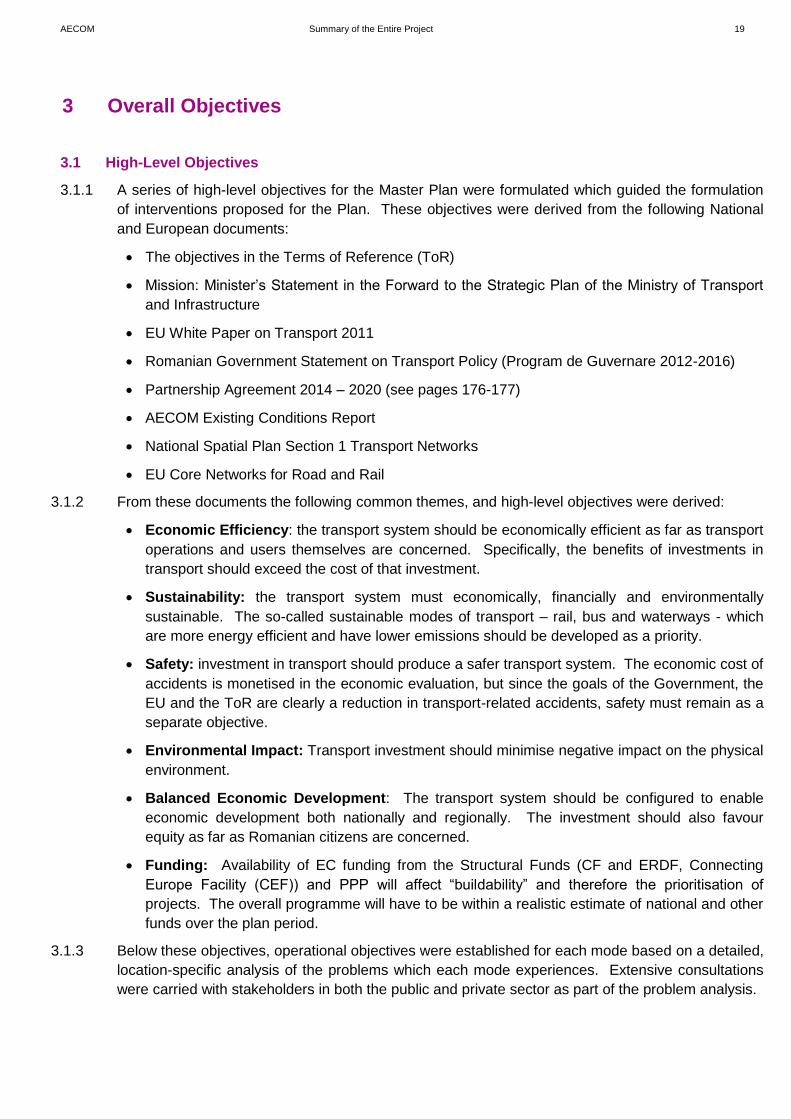
3.1.1 A series of high-level objectives for the Master Plan were formulated which guided the formulation
of interventions proposed for the Plan. These objectives were derived from the following National
and European documents:
The objectives in the Terms of Reference (ToR)
Mission: Minister’s Statement in the Forward to the Strategic Plan of the Ministry of Transport
and Infrastructure
EU White Paper on Transport 2011
Romanian Government Statement on Transport Policy (Program de Guvernare 2012-2016)
Partnership Agreement 2014 – 2020 (see pages 176-177)
AECOM Existing Conditions Report
National Spatial Plan Section 1 Transport Networks
EU Core Networks for Road and Rail
3.1.2 From these documents the following common themes, and high-level objectives were derived:
Economic Efficiency: the transport system should be economically efficient as far as transport
operations and users themselves are concerned. Specifically, the benefits of investments in
transport should exceed the cost of that investment.
Sustainability: the transport system must economically, financially and environmentally
sustainable. The so-called sustainable modes of transport – rail, bus and waterways - which
are more energy efficient and have lower emissions should be developed as a priority.
Safety: investment in transport should produce a safer transport system. The economic cost of
accidents is monetised in the economic evaluation, but since the goals of the Government, the
EU and the ToR are clearly a reduction in transport-related accidents, safety must remain as a
separate objective.
Environmental Impact: Transport investment should minimise negative impact on the physical
environment.
Balanced Economic Development: The transport system should be configured to enable
economic development both nationally and regionally. The investment should also favour
equity as far as Romanian citizens are concerned.
Funding: Availability of EC funding from the Structural Funds (CF and ERDF, Connecting
Europe Facility (CEF)) and PPP will affect “buildability” and therefore the prioritisation of
projects. The overall programme will have to be within a realistic estimate of national and other
funds over the plan period.
3.1.3 Below these objectives, operational objectives were established for each mode based on a detailed,
location-specific analysis of the problems which each mode experiences. Extensive consultations
were carried with stakeholders in both the public and private sector as part of the problem analysis.
3 Overall Objectives

AECOM Summary of the Entire Project 20
Operational Objectives
3.1.4 The operational objectives were derived from the in-depth analysis of the problems of each mode of
transport. Care was taken in the problem analysis to ensure that each defined problem was
specific, identified the underlying cause, and was geographically precise wherever possible. The
operational objectives are therefore specific to each problem, but were grouped under the high-level
objectives described above.
3.1.5 The operational objectives are set out in the modal chapters (chapters 4-8 of the Master Plan
report), and in the Problems /Objectives /Interventions Technical Notes.
3.2 Interventions
3.2.1 The definition of interventions follow the setting of operational objectives. This procedure ensures
there is a clear and identifiable connection between high-level objectives, the identified problems
and the corresponding operational objectives, and the interventions themselves. This approach
also ensures that the interventions address real, transport-related problems. The use of the
National Model, and associated data, ensures that there is a quantitative basis for the problem
definition, objectives, and interventions.
3.2.2 We invited the Ministry of Transport and stakeholders to submit their proposals and aspirations for
their own areas of responsibility. The value of the interventions they proposed, which were
predominantly for new or improved infrastructure, amounted to €74.8 bn. The funds available for
infrastructure projects are €9.5 bn to 2020, and €24.7 to 2030. Thus the available funds represent
less than half of the aspirations of the project sponsors.
3.2.3 The Master Plan cannot generate additional funding, but it can ensure that, in a situation where
funding is limited, the available funds are allocated to areas where they provide the greatest benefit.
The AECOM team, in conjunction with the Ministry of Transport and JASPERS, developed a series
of interventions which include, but are not limited to, infrastructure interventions. In some cases
these corresponded to projects proposed by stakeholders, but in many cases the projects were
different, or scaled back in scope to meet the specific problem, or the forecast demand.
3.2.4 The analysis of the existing and future situations highlighted the serious shortcomings in
maintenance and renewals on the railways and roads. The overall strategy therefore has two main
pillars:
The protection of existing assets by ring-fencing long term financing for improved maintenance
and renewals. This will benefit all Romanian citizens (and visitors) who use the countries’
transport systems; and
Selected infrastructure improvements, which gave the best value for money, and met the
operational objectives.
3.2.5 The Master Plan also contains a series of so-called “soft” measures for each mode such as
institutional reforms, changes in the Public Service Contracts (PSC) of rail operators, changes to
the size and duration of road maintenance contracts and so on. These all have the common
objective of increasing efficiency and encouraging commercial behaviour, and should, therefore,
have a net financial gain.
3.2.6 Interventions to increase safety, particularly on roads, and allow flights to operate safely in adverse
weather conditions, were also included.

AECOM Summary of the Entire Project 21
Testing Projects
AECOM Summary of the Entire Project 22
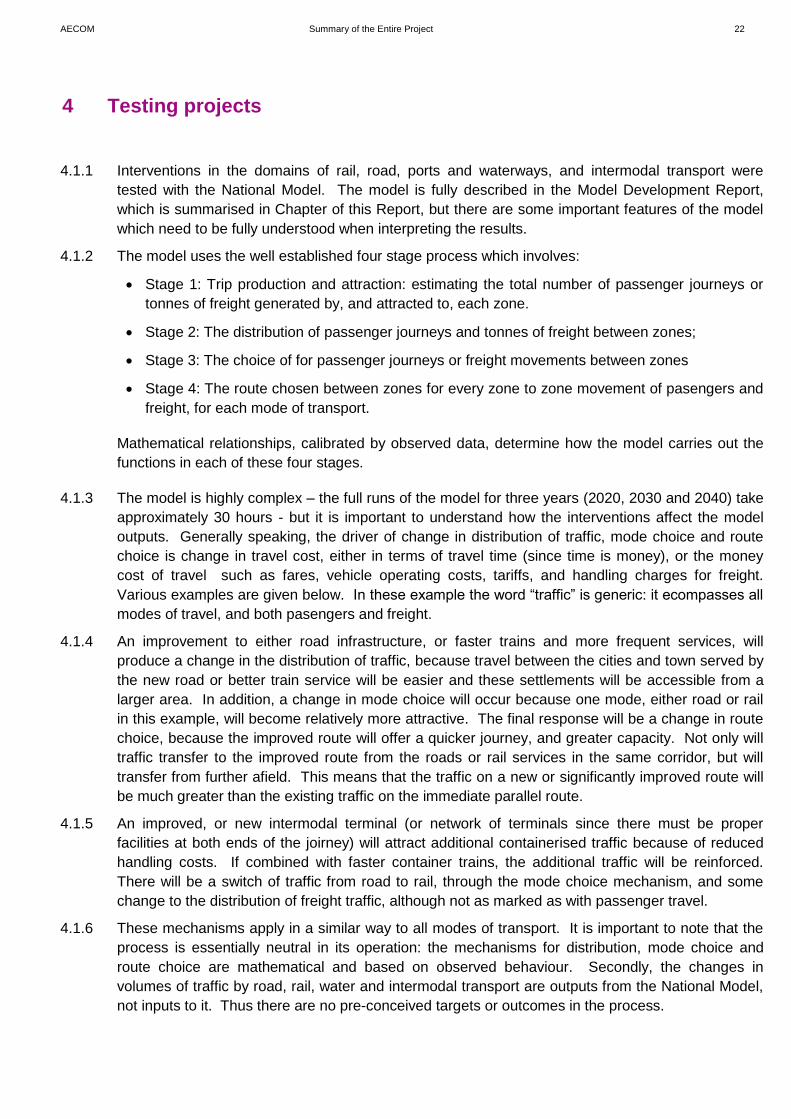
4.1.1 Interventions in the domains of rail, road, ports and waterways, and intermodal transport were
tested with the National Model. The model is fully described in the Model Development Report,
which is summarised in Chapter of this Report, but there are some important features of the model
which need to be fully understood when interpreting the results.
4.1.2 The model uses the well established four stage process which involves:
Stage 1: Trip production and attraction: estimating the total number of passenger journeys or
tonnes of freight generated by, and attracted to, each zone.
Stage 2: The distribution of passenger journeys and tonnes of freight between zones;
Stage 3: The choice of for passenger journeys or freight movements between zones
Stage 4: The route chosen between zones for every zone to zone movement of pasengers and
freight, for each mode of transport.
Mathematical relationships, calibrated by observed data, determine how the model carries out the
functions in each of these four stages.
4.1.3 The model is highly complex – the full runs of the model for three years (2020, 2030 and 2040) take
approximately 30 hours - but it is important to understand how the interventions affect the model
outputs. Generally speaking, the driver of change in distribution of traffic, mode choice and route
choice is change in travel cost, either in terms of travel time (since time is money), or the money
cost of travel such as fares, vehicle operating costs, tariffs, and handling charges for freight.
Various examples are given below. In these example the word “traffic” is generic: it ecompasses all
modes of travel, and both pasengers and freight.
4.1.4 An improvement to either road infrastructure, or faster trains and more frequent services, will
produce a change in the distribution of traffic, because travel between the cities and town served by
the new road or better train service will be easier and these settlements will be accessible from a
larger area. In addition, a change in mode choice will occur because one mode, either road or rail
in this example, will become relatively more attractive. The final response will be a change in route
choice, because the improved route will offer a quicker journey, and greater capacity. Not only will
traffic transfer to the improved route from the roads or rail services in the same corridor, but will
transfer from further afield. This means that the traffic on a new or significantly improved route will
be much greater than the existing traffic on the immediate parallel route.
4.1.5 An improved, or new intermodal terminal (or network of terminals since there must be proper
facilities at both ends of the joirney) will attract additional containerised traffic because of reduced
handling costs. If combined with faster container trains, the additional traffic will be reinforced.
There will be a switch of traffic from road to rail, through the mode choice mechanism, and some
change to the distribution of freight traffic, although not as marked as with passenger travel.
4.1.6 These mechanisms apply in a similar way to all modes of transport. It is important to note that the
process is essentially neutral in its operation: the mechanisms for distribution, mode choice and
route choice are mathematical and based on observed behaviour. Secondly, the changes in
volumes of traffic by road, rail, water and intermodal transport are outputs from the National Model,
not inputs to it. Thus there are no pre-conceived targets or outcomes in the process.
4 Testing projects

AECOM Summary of the Entire Project 23
4.1.7 A large number of projects were tested with the National Model. The panel below gives the
approximate number. Many of the projects were tested several times due to variations in the
project specifrication, or in combination with other projects, so the numbers given below are
conservative:
Mode Road Rail Ports and
Waterways
Intermodal
Transport
Number of
Projects
92 34 12 13
The rail projects comprised three elements, infrastructure re-habilitation on a complete long
distance route, revised timetables, and new rolling stock, so each rail project is in effect a whole
route strategy.
4.1.8 Aviation projects were not tested with the National Model, but with a specially developed aviation
model, which reflects the additional traffic which would arise if an airport attracts additional services
as well as improves its own facilities. The model uses a combination of non-overlapping catchment
areas and trip rates for different levels of flights to forecast potential passenger traffic. However, the
aviation model does use data from the National Model in the CBA analysis.
4.1.9 As discussed in section 10.2, and in greater detail in Chapter 4 and the Problem Definition Report,
road safety is a serious concern in Romania. A bespoke model was developed which identified the
locations on the National road network with the most serious accident problems, identified the
causes, and proposed the most appropriate solutions from a menu of proven safety treatments.
The model also performs a CBA. 138 high-priority sites were identified by these means.

Project Appraisal – Role of Cost-
Benefit Analysis (CBA) and Multi-
Criteriate Analysis (MCA)

AECOM Summary of the Entire Project 25
5 Project Appraisal Role of CBA and MCA
5.1.1 As described in the National Assessment Guidelines, Volume 1, and summarised in Section 2.6 of
the Master Plan Report, projects were initially sorted according to their economic performance.
5.1.2 For road projects, this was a two stage process: first, the individual projects which met each
operational objective were assessed using CBA, and secondly, the individual projects were
assembled into two alternative “Level 1” strategies which made a coherent network; these were
again subject to a CBA, with the best performing strategy and the projects within it being carried
forward to an MCA. Further residual problems were identified assuming the preferred Level 1
strategy was in place, and so-called “Level 2” projects were identified to address these problems.
5.1.3 Strictly speaking, the CBA pass/fail criteria were that projects should have an EIRR greater than 5%
(the discount rate), and a Benefit-Cost Ratio (BCR) greater than 1. However, these criteria were
relaxed for rail projects, for a number of reasons:
As we have shown earlier, rail passenger transport in particular has been in decline for a
number of years, with the result that existing rail traffic is not always sufficient to justify the large
investments required in rail improvements. If CBA criteria were to be strictly applied it would
reinforce this situation by rejecting rail improvements in favour of road projects, which would
add further to railway decline to the point where, in our opinion, rail would cease to play a
worthwhile role in national transport;
Because of under-investment in railways over a long period, the scale of investment required is
larger than it would have been under a “normal” investment programme; this means investment
costs are higher; reducing the EIRR and BCR for rail projects.
Rail infrastructure has to be built to meet exacting construction and safety standards; gradients
cannot be severe, high speed running requires good horizontal alignment without severe
curves, and there are EU standards for minimum line speeds on the Core TEN-T network. This
means that there is limited scope for adjusting standards and therefore costs, in order to
improve economic performance.
5.1.4 Following the assessment using CBA, projects were assembled into two scenarios using Multi-
Criteriate Analysis (MCA) techniques. The two scenarios are characterised as follows:
5.1.5 Economically Sustainable (“ES”) Scenario: This scenario emphasises projects which perform
well in economic terms, with the economic efficiency criteria having the largest weighting (70%)
having the highest weighting. Projects on the Core TEN-T were given 30% weighting.
5.1.6 Economic and Environmentally Sustainable (“EES”) Scenario: This scenario gives additional
weighting to the physical environmental impacts, especially the impact of Natura 2000 sites, with
less on economic efficiency. The weighting for economic efficiency was reduced to 50%, physical
impact on the environment 20%, and whether or not the project was located on the Core Ten-T
network, 20%. An additional criterion, with 10% weighting, namely “balanced economic
development”, was introduced. This latter criterion gave some weighting to projects which would
assist economic development in Romania’s regions.
AECOM Summary of the Entire Project 26
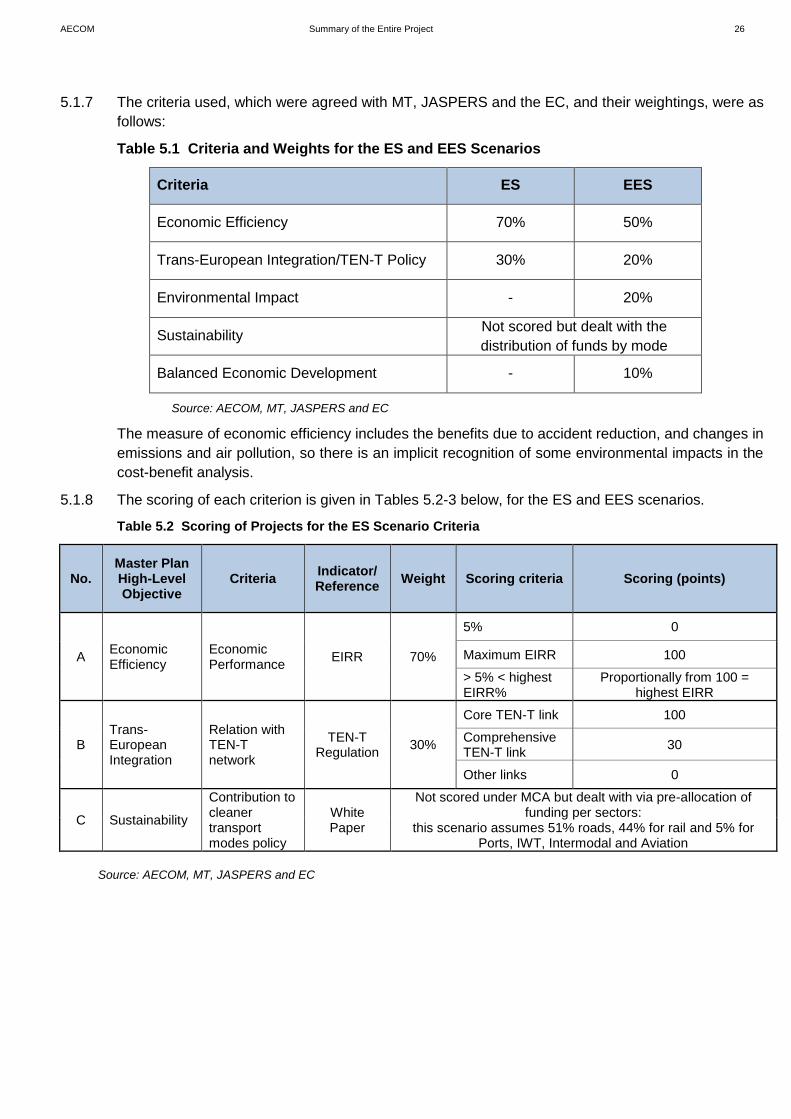
5.1.7 The criteria used, which were agreed with MT, JASPERS and the EC, and their weightings, were as
follows:
Table 5.1 Criteria and Weights for the ES and EES Scenarios
Criteria ES EES
Economic Efficiency 70% 50%
Trans-European Integration/TEN-T Policy 30% 20%
Environmental Impact - 20%
Sustainability Not scored but dealt with the
distribution of funds by mode
Balanced Economic Development - 10%
Source: AECOM, MT, JASPERS and EC
The measure of economic efficiency includes the benefits due to accident reduction, and changes in
emissions and air pollution, so there is an implicit recognition of some environmental impacts in the
cost-benefit analysis.
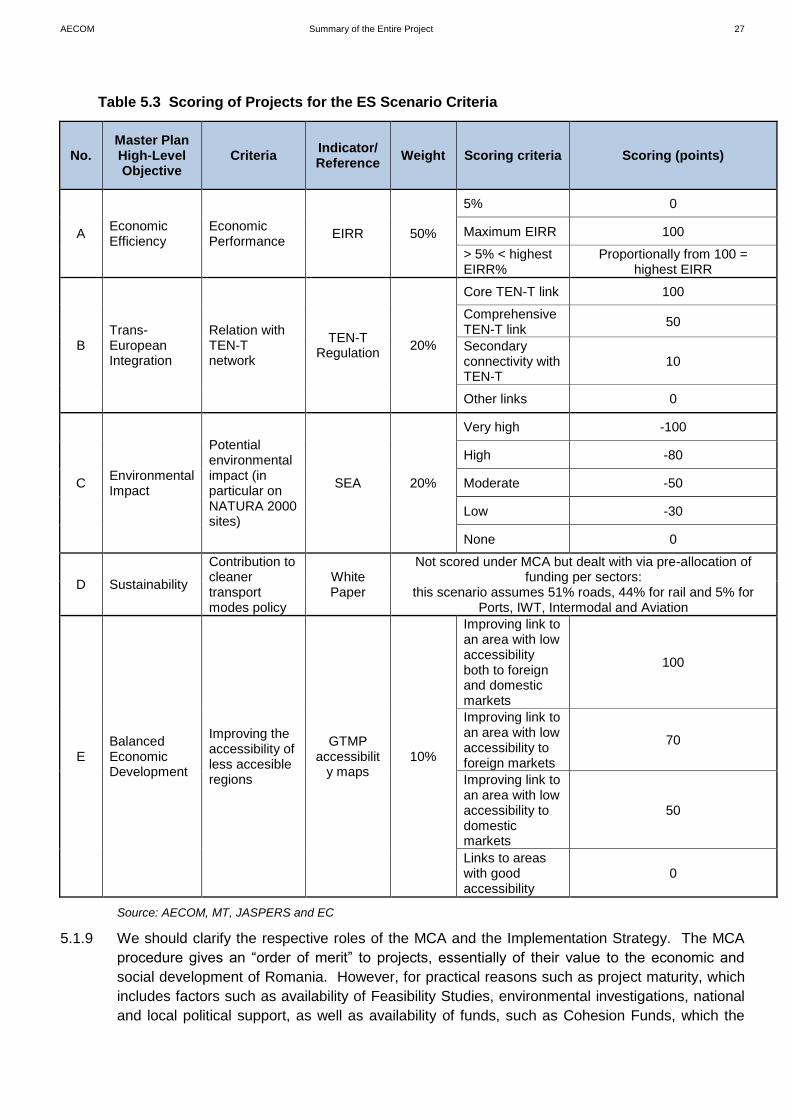
5.1.8 The scoring of each criterion is given in Tables 5.2-3 below, for the ES and EES scenarios.
Table 5.2 Scoring of Projects for the ES Scenario Criteria
No. Master Plan High-Level Objective
Criteria Indicator/ Reference
Weight Scoring criteria Scoring (points)
A Economic Efficiency
Economic Performance
EIRR 70%
5% 0
Maximum EIRR 100
> 5% < highest EIRR%
Proportionally from 100 = highest EIRR
B Trans-European Integration
Relation with TEN-T network
TEN-T Regulation
30%
Core TEN-T link 100
Comprehensive TEN-T link
30
Other links 0
C Sustainability
Contribution to cleaner transport modes policy
White Paper
Not scored under MCA but dealt with via pre-allocation of funding per sectors:
this scenario assumes 51% roads, 44% for rail and 5% for Ports, IWT, Intermodal and Aviation
Source: AECOM, MT, JASPERS and EC
AECOM Summary of the Entire Project 27
Table 5.3 Scoring of Projects for the ES Scenario Criteria
No. Master Plan High-Level Objective
Criteria Indicator/ Reference
Weight Scoring criteria Scoring (points)
A Economic Efficiency
Economic Performance
EIRR 50%
5% 0
Maximum EIRR 100
> 5% < highest EIRR%
Proportionally from 100 = highest EIRR
B Trans-European Integration
Relation with TEN-T network
TEN-T Regulation
20%
Core TEN-T link 100
Comprehensive TEN-T link
50
Secondary connectivity with TEN-T
10
Other links 0
C Environmental Impact
Potential environmental impact (in particular on NATURA 2000 sites)
SEA 20%
Very high -100
High -80
Moderate -50
Low -30
None 0
D Sustainability
Contribution to cleaner transport modes policy
White Paper
Not scored under MCA but dealt with via pre-allocation of funding per sectors:
this scenario assumes 51% roads, 44% for rail and 5% for Ports, IWT, Intermodal and Aviation
E Balanced Economic Development
Improving the accessibility of less accesible regions
GTMP accessibilit
y maps 10%
Improving link to an area with low accessibility both to foreign and domestic markets
100
Improving link to an area with low accessibility to foreign markets
70
Improving link to an area with low accessibility to domestic markets
50
Links to areas with good accessibility
0
Source: AECOM, MT, JASPERS and EC
5.1.9 We should clarify the respective roles of the MCA and the Implementation Strategy. The MCA
procedure gives an “order of merit” to projects, essentially of their value to the economic and
social development of Romania. However, for practical reasons such as project maturity, which
includes factors such as availability of Feasibility Studies, environmental investigations, national
and local political support, as well as availability of funds, such as Cohesion Funds, which the

AECOM Summary of the Entire Project 28
EC has stipulated must be used first for projects on the currently-defined Core TEN-T the
Implementation Strategy will have a different order to the projects to that produced by the MCA
procedure. In other words, the MCA procedure determines which projects should be in the
Preferred Strategy, but the overall strategy will remain the same.
5.1.10 In Chapter 6 below we give the results of the MCA process and the resulting composition of the
ES and EES scenarios.

Environmentally Sustainable (ES)
Scenario and Economical and
Environmentally Sustainable (EES)
Scenario
AECOM Summary of the Entire Project 30
6 ES and EES Scenarios
6.1 Economically Sustainable (“ES”) Scenario
6.1.1 This section describes the projects included in the ES Scenario following the application of the
MCA. Table 6.1 sets out the ES Scenario road projects according to their scores from the MCA.

AECOM Summary of the Entire Project 31
Table 6.1 List of road investments – ES Scenario
Source: AECOM GTMP MCA Scoring of Projects
6.1.2 Table 6.2 sets out the EES Scenario road projects according to their scores from the MCA.
Project Description TEN-T Score EIRRCost (2014
prices)
Cumulated
Cost
H0 Safety Interventions n/a n/a 18.5% 150.0 150.0
1 H7 Sibiu-Brasov Motorway Comprehensive TEN-T link 74.3 17.3% 817.3 817.3
2 H8 Ploiesti-Comarnic Motorway Comprehensive TEN-T link 48.7 12.5% 310.4 1,127.7
3 H6 Craiova-Pitesti Motorway Comprehensive TEN-T link 47.3 12.2% 870.3 1,998.0
4 H1 Comarnic-Brasov Motorway Comprehensive TEN-T link 29.3 8.8% 1,117.0 3,115.0
5 H12 Brasov-Bacau Motorway Comprehensive TEN-T link 20.1 7.1% 2,067.6 5,182.6
1 OR18B Bucharest Southern Ring Road Upgrade Core TEN-T link 100.0 14.5% 175.7 5,358.3
2 OR7A Bacau-Suceava Expressway Core TEN-T link 86.3 12.6% 645.4 6,003.7
3 OR15 Sibiu-Pitesti Motorway Core TEN-T link 82.3 12.1% 2,471.2 8,474.9
4 OR19 Bucharest-Alexandria Expressway Core TEN-T link 79.8 11.8% 369.6 8,844.5
5 OR7B Suceava-Siret Expressway Core TEN-T link 79.1 11.7% 186.1 9,030.6
6 OR13C Buzau-Focsani Expressway Core TEN-T link 74.5 11.0% 282.0 9,312.6
7 OR13D Targu Neamt-Iasi-Ungheni Motorway Core TEN-T link 72.7 10.8% 700.0 10,012.6
8 OR12 Nadaselu - Suplacu de Barcau Motorway Comprehensive TEN-T link 69.3 13.2% 550.0 10,562.6
9 OR10 Lugoj- Craiova Expressway Core TEN-T link 66.6 10.0% 1,810.9 12,373.5
10 OR9B Turda-Halmeu Expressway Other links 63.0 13.5% 975.4 13,348.9
11 OR19D Henri Coanda Airport connection to A3 Core TEN-T link 61.9 9.3% 125.6 13,474.5
12 OR17 Gaesti-Ploiesti-Buzau-Braila Expressway Comprehensive TEN-T link 60.0 11.9% 1,279.6 14,754.1
13 OR13 Targu Mures-Targu Neamt Motorway Core TEN-T link 55.0 8.4% 3,400.0 18,154.1
14 OR6B Bacau-Focsani-Braila-Galati Expressway Comprehensive TEN-T link 54.4 11.2% 1,024.2 19,178.3
15 OR21 A1 Widening Bucharest-Pitesti Core TEN-T link 49.1 7.6% 442.0 19,620.3
16 OR8 Bacau-Piatra Neamt Expressway Other links 41.2 10.6% 335.1 19,955.4
17 OR14 Brasov-Pitesti Expressway Comprehensive TEN-T link 39.0 9.1% 1,842.6 21,798.0
18 OR18A Bucharest Ring Road Motorway Core TEN-T link 35.2 5.7% 1,683.8 23,481.8
19 OR7C Suceava-Botosani Expressway Other links 28.4 8.9% 345.8 23,827.6
20 OR11Constanta-Tulcea-Braila Expressway (including Braila
Bridge)Comprehensive TEN-T link 11.9 5.4% 1,369.3 25,196.9
1 BP12 Adjud Core TEN-T link 85.4 19.0% 46.2 46.2
2 BP10 Targoviste Comprehensive TEN-T link 79.0 22.7% 78.0 124.2
3 BP4 Roman Core TEN-T link 73.2 15.9% 62.0 186.1
4 BP11 Filiasi Core TEN-T link 71.8 15.6% 27.7 213.8
5 BP15 Falticeni Core TEN-T link 62.4 13.2% 41.3 255.1
6 BP5 Focsani Core TEN-T link 62.1 13.1% 76.1 331.2
7 BP25 Vatra Dornei Comprehensive TEN-T link 60.2 17.9% 18.3 349.4
8 BP3 Sighisoara Comprehensive TEN-T link 51.8 15.8% 47.7 397.1
9 BP28 Timisoara South Core TEN-T link 48.5 9.7% 127.4 524.5
10 BP7 Buzau Core TEN-T link 39.7 7.5% 104.8 629.3
11 BP21 Giurgiu Core TEN-T link 39.3 7.4% 72.0 701.4
12 BP6 Ramnicu Sarat Core TEN-T link 37.1 6.8% 37.0 738.4
13 BP9 Ramnicu Valcea Core TEN-T link 34.8 6.2% 195.4 933.8
14 BP20 Sfântu Gheorghe Comprehensive TEN-T link 34.3 11.4% 34.0 967.8
15 BP14 Ludus Comprehensive TEN-T link 33.5 11.2% 102.5 1,070.3
16 BP23 Bârlad Comprehensive TEN-T link 33.3 11.1% 51.1 1,121.4
17 BP16 Caransebes Core TEN-T link 32.6 5.7% 80.8 1,202.2
18 BP24 Slobozia Comprehensive TEN-T link 31.1 10.6% 23.3 1,225.6
19 BP13 Mizil Core TEN-T link 30.0 1.9% 36.0 1,261.5
20 BP22 Vaslui Comprehensive TEN-T link 23.4 8.6% 72.9 1,334.5
21 BP17 Beclean Comprehensive TEN-T link 22.6 8.4% 42.2 1,376.7
22 BP27 Mangalia Comprehensive TEN-T link 18.9 7.5% 44.1 1,420.8
23 BP18 Bistriţa Comprehensive TEN-T link 15.1 6.5% 157.0 1,577.8
24 BP19 Miercurea Ciuc Comprehensive TEN-T link 9.0 4.8% 110.5 1,688.3
25 BP26 Câmpulung Moldovenesc Comprehensive TEN-T link 9.0 2.5% 99.3 1,787.6
Code
Level
2B
yp
asses
Sele
cte
d L
evel
1

AECOM Summary of the Entire Project 32
Table 6.2 EES Scenario Road Projects
Source: AECOM GTMP MCA Scoring of Projects
6.1.3 Some of the identified bypasses are part of larger Level 1 or Level 2 projects. The decision to
advance these proposals as separate projects will be determined within the Implementation
Project Description TEN-T Score EIRRCost (2014
prices)
Cumulated
Cost
H0 Safety Interventions n/a n/a 18.5% 150.0 150.0
1 H7 Sibiu-Brasov Motorway Comprehensive TEN-T link 57.6 17.3% 817.3 817.3
2 H8 Ploiesti-Comarnic Motorway Comprehensive TEN-T link 39.4 12.5% 310.4 1,127.7
3 H6 Craiova-Pitesti Motorway Comprehensive TEN-T link 34.4 12.2% 870.3 1,998.0
4 H1 Comarnic-Brasov Motorway Comprehensive TEN-T link 15.5 8.8% 1,117.0 3,115.0
5 H12 Brasov-Bacau Motorway Comprehensive TEN-T link 14.9 7.1% 2,067.6 5,182.6
1 OR18B Bucharest Southern Ring Road Upgrade Core TEN-T link 71.0 14.5% 175.7 5,358.3
2 OR7A Bacau-Suceava Expressway Core TEN-T link 70.2 12.6% 645.4 6,003.7
3 OR12 Nadaselu - Suplacu de Barcau Motorway Comprehensive TEN-T link 57.0 13.2% 550.0 6,553.7
4 OR19 Bucharest-Alexandria Expressway Core TEN-T link 56.6 11.8% 369.6 6,923.3
5 OR13C Buzau-Focsani Expressway Core TEN-T link 55.8 11.0% 282.0 7,205.4
6 OR7B Suceava-Siret Expressway Core TEN-T link 52.1 11.7% 186.1 7,391.5
7 OR13D Targu Neamt-Iasi-Ungheni Motorway Core TEN-T link 51.5 10.8% 700.0 8,091.5
8 OR15 Sibiu-Pitesti Motorway Core TEN-T link 51.3 12.1% 2,471.2 10,562.6
9 OR6B Bacau-Focsani-Braila-Galati Expressway Comprehensive TEN-T link 46.5 11.2% 1,024.2 11,586.8
10 OR9B Turda-Halmeu Expressway Other links 44.0 13.5% 975.4 12,562.2
11 OR19D Henri Coanda Airport connection to A3 Core TEN-T link 43.8 9.3% 125.6 12,687.8
12 OR17 Gaesti-Ploiesti-Buzau-Braila Expressway Comprehensive TEN-T link 43.4 11.9% 1,279.6 13,967.4
13 OR10 Lugoj- Craiova Expressway Core TEN-T link 40.1 10.0% 1,810.9 15,778.3
14 OR21 A1 Widening Bucharest-Pitesti Core TEN-T link 34.7 7.6% 442.0 16,220.3
15 OR7C Suceava-Botosani ExpresswaySecondary connectivity with
TEN-T32.3 8.9% 345.8 16,566.1
16 OR13 Targu Mures-Targu Neamt Motorway Core TEN-T link 31.9 8.4% 3,400.0 19,966.1
17 OR14 Brasov-Pitesti Expressway Comprehensive TEN-T link 25.4 9.1% 1,842.6 21,808.7
18 OR18A Bucharest Ring Road Motorway Core TEN-T link 24.7 5.7% 1,683.8 23,492.5
19 OR8 Bacau-Piatra Neamt Expressway Other links 19.4 10.6% 335.1 23,827.6
20 OR11Constanta-Tulcea-Braila Expressway (including Braila
Bridge)Comprehensive TEN-T link 17.1 5.4% 1,369.3 25,196.9
1 BP10 Targoviste Comprehensive TEN-T link 57.0 22.7% 78.0 78.0
2 BP12 Adjud Core TEN-T link 56.6 19.0% 46.2 124.2
3 BP4 Roman Core TEN-T link 47.9 15.9% 62.0 186.1
4 BP11 Filiasi Core TEN-T link 46.9 15.6% 27.7 213.8
5 BP25 Vatra Dornei Comprehensive TEN-T link 43.6 17.9% 18.3 232.1
6 BP15 Falticeni Core TEN-T link 40.1 13.2% 41.3 273.3
7 BP5 Focsani Core TEN-T link 39.9 13.1% 76.1 349.4
8 BP3 Sighisoara Comprehensive TEN-T link 37.6 15.8% 47.7 397.1
9 BP28 Timisoara South Core TEN-T link 33.2 9.7% 127.4 524.5
10 BP20 Sfântu Gheorghe Comprehensive TEN-T link 25.1 11.4% 34.0 558.5
11 BP14 Ludus Comprehensive TEN-T link 24.5 11.2% 102.5 661.0
12 BP23 Bârlad Comprehensive TEN-T link 24.3 11.1% 51.1 712.1
13 BP7 Buzau Core TEN-T link 23.9 7.5% 104.8 817.0
14 BP21 Giurgiu Core TEN-T link 23.7 7.4% 72.0 889.0
15 BP24 Slobozia Comprehensive TEN-T link 22.8 10.6% 23.3 912.3
16 BP6 Ramnicu Sarat Core TEN-T link 22.0 6.8% 37.0 949.4
17 BP9 Ramnicu Valcea Core TEN-T link 20.5 6.2% 195.4 1,144.8
18 BP16 Caransebes Core TEN-T link 18.9 5.7% 80.8 1,225.6
19 BP22 Vaslui Comprehensive TEN-T link 17.3 8.6% 72.9 1,298.5
20 BP13 Mizil Core TEN-T link 17.0 1.9% 36.0 1,334.5
21 BP17 Beclean Comprehensive TEN-T link 16.7 8.4% 42.2 1,376.7
22 BP27 Mangalia Comprehensive TEN-T link 14.1 7.5% 44.1 1,420.8
23 BP18 Bistriţa Comprehensive TEN-T link 11.4 6.5% 157.0 1,577.8
24 BP19 Miercurea Ciuc Comprehensive TEN-T link 7.0 4.8% 110.5 1,688.3
25 BP26 Câmpulung Moldovenesc Comprehensive TEN-T link 7.0 2.5% 99.3 1,787.6
Code
Sele
cte
d L
evel
1L
evel
2B
yp
asses

AECOM Summary of the Entire Project 33
Strategy which will examine the funding opportunities and the maturity of each project. If the larger
Level 1 or Level 2 project appears as feasible early in the implementation plan, then a separate
bypass will not be needed. A value for money analysis based on the lifetime forecast for the
bypass as an individual entity will determine the best solution.
6.1.4 Tables 6.3-4 set out the ES and EES Scenario rail projects according to their scores from the
MCA
Table 6.3 ES Scenario Rail Projects
Source: AECOM GTMP MCA Scoring of Projects
Project Description TEN-T Score EIRRCost (2014
prices)
Cumulated
CostCode
1 DS10REmergency interventions for section Bucharest to
Giurgiu via GradisteaCore TEN-T link 100.0 49.0% 0.0 0.0
2 DS02ABucharest to Constanta. New rolling stock and re-
timetablingCore TEN-T link 99.9 48.9% 28.8 28.8
3 DS01REmergency interventions for section Bucharest to
Hungary via Brasov + Teius to ClujCore TEN-T link 69.0 29.5% 67.7 96.5
4 DS11R Emergency interventions for section Craiova to Calafat Core TEN-T link 58.7 23.0% 1.5 98.0
5 DS03REmergency interventions for section Bucharest to Arad
via Craiova and TimisoaraCore TEN-T link 56.9 21.9% 73.2 171.2
6 DS04REmergency interventions for section Bucharest to Iasi
via Bacau + Buzau to Galati + Pascani to UkraineCore TEN-T link 51.6 18.6% 90.7 261.8
7 DS06REmergency interventions for section Cluj-Napoca to
IasiCore TEN-T link 51.3 18.4% 52.5 314.3
8 DS10ABucharest to Giurgiu via Gradistea. Rehabilitation to
design speed.Core TEN-T link 45.4 14.7% 132.1 446.4
9 DS04ABucharest to Iasi via Bacau + Buzau to Galati +
Pascani to Ukraine. Rehabilitation to design speed.Core TEN-T link 31.8 6.2% 3,093.2 3,539.7
10 DS01ABucharest to Hungary via Brasov + Teius to Cluj.
Rehabilitation to design speed.Core TEN-T link 30.7 5.5% 2,784.9 6,324.6
11 DS03ABucharest to Arad via Craiova and Timisoara.
Rehabilitation to design speed.Core TEN-T link 30.5 5.3% 2,242.5 8,567.1
12 DS11A Craiova to Calafat. Rehabilitation to design speed. Core TEN-T link 30.0 4.5% 168.6 8,735.7
13 DS06A Cluj-Napoca to Iasi. Rehabilitation to design speed. Core TEN-T link 30.0 0.3% 2,580.7 11,316.4
14 DS03S Freight test Filiasi - Tg Jiu Comprehensive TEN-T link 27.7 16.7% 6.1 11,322.4
15 DS05BBucharest to Sibiu via Pitesti and Ramnicu Valcea.
New link, rehabilitation to design speed and Comprehensive TEN-T link 14.0 8.1% 1,159.9 12,482.4
16 DS08A Oradea to Timisoara. Rehabilitation to design speed. Comprehensive TEN-T link 9.0 2.8% 358.8 12,841.2
17 DS09AOradea to Cluj-Napoca via Satu Mare and Baia Mare.
Rehabilitation to design speed.Comprehensive TEN-T link 9.0 -1.4% 1,110.7 13,951.8
18 DS07BCluj-Napoca to Oradea. Rehabilitation to enhanced
speed, line doubling and electrification.Comprehensive TEN-T link 9.0 -0.1% 1,473.4 15,425.2
Rail

AECOM Summary of the Entire Project 34
Table 6.4 EES Scenario Rail Projects
Source: AECOM GTMP MCA Scoring of Projects
6.1.5 Table 10.5 sets out the ES and EES Scenario Ports and Waterways projects according to their
scores from the MCA.
1 DS10REmergency interventions for section Bucharest to
Giurgiu via GradisteaCore TEN-T link 80.0 49.0% 0.0 0.0
2 DS02ABucharest to Constanta. New rolling stock and re-
timetablingCore TEN-T link 73.9 48.9% 28.8 28.8
3 DS11R Emergency interventions for section Craiova to Calafat Core TEN-T link 50.5 23.0% 1.5 30.3
4 DS03REmergency interventions for section Bucharest to Arad
via Craiova and TimisoaraCore TEN-T link 49.2 21.9% 73.2 103.5
5 DS04REmergency interventions for section Bucharest to Iasi
via Bacau + Buzau to Galati + Pascani to UkraineCore TEN-T link 45.4 18.6% 90.7 194.2
6 DS06REmergency interventions for section Cluj-Napoca to
IasiCore TEN-T link 45.2 18.4% 52.5 246.7
7 DS10ABucharest to Giurgiu via Gradistea. Rehabilitation to
design speed.Core TEN-T link 35.0 14.7% 132.1 378.7
8 DS03S Freight test Filiasi - Tg Jiu Comprehensive TEN-T link 33.3 16.7% 6.1 384.8
9 DS01REmergency interventions for section Bucharest to
Hungary via Brasov + Teius to ClujCore TEN-T link 30.0 29.5% 67.7 452.5
10 DS04ABucharest to Iasi via Bacau + Buzau to Galati +
Pascani to Ukraine. Rehabilitation to design speed.Core TEN-T link 25.3 6.2% 3,093.2 3,545.7
11 DS01ABucharest to Hungary via Brasov + Teius to Cluj.
Rehabilitation to design speed.Core TEN-T link 24.5 5.5% 2,784.9 6,330.7
12 DS03ABucharest to Arad via Craiova and Timisoara.
Rehabilitation to design speed.Core TEN-T link 24.4 5.3% 2,242.5 8,573.1
13 DS11A Craiova to Calafat. Rehabilitation to design speed. Core TEN-T link 24.0 4.5% 168.6 8,741.7
14 DS06A Cluj-Napoca to Iasi. Rehabilitation to design speed. Core TEN-T link 24.0 0.3% 2,580.7 11,322.4
15 DS05BBucharest to Sibiu via Pitesti and Ramnicu Valcea.
New link, rehabilitation to design speed and Comprehensive TEN-T link 17.6 8.1% 1,159.9 12,482.4
16 DS08A Oradea to Timisoara. Rehabilitation to design speed. Comprehensive TEN-T link 14.0 2.8% 358.8 12,841.2
17 DS09AOradea to Cluj-Napoca via Satu Mare and Baia Mare.
Rehabilitation to design speed.Comprehensive TEN-T link 14.0 -1.4% 1,110.7 13,951.8
18 DS07BCluj-Napoca to Oradea. Rehabilitation to enhanced
speed, line doubling and electrification.Comprehensive TEN-T link 14.0 -0.1% 1,473.4 15,425.2
Rail

AECOM Summary of the Entire Project 35
Table 10.5 Ports and Waterways Projects, ES and EES Scenarios
Source: AECOM GTMP MCA Scoring of Projects
6.1.6 The Bucharest – Danube Channel could have commenced construction in the period 2020 –
2030. However, we are reluctant to recommend this project at this time, for several reasons:
Bucharest is already well-connected to the east and west by rail and road, and one of the
primary objectives of the Master Plan is to re-invigorate the railway. Testing with the
National Model showed that the channel would have a significant, adverse impact on the
Constanta – Bucharest – Craiova – Hungary rail corridor.
The proposals for improvements to the Ports at Giurgiu and Oltenita gave very good
economic value, with EIRR of 24% and 30% respectively, for modest investments of €4.3m
and €5.6m respectively. If the Bucharest – Danube Channel were to be implemented, it
would jeopardise these investments.
The Channel is expensive and barely economically viable. It has an estimated cost of
€1.5bn, and an EIRR of only 4.7%.
6.1.7 For these reasons we recommend that the viability of the Channel is re-examined in the mid
2020s when the impact of the Port improvements, and rail improvements, would become clearer.
6.1.8 Tables 6.6-7 set out the ES and EES Scenario Aviation projects according to their scores from
the MCA.
1 P-GL-S Galati Port Core TEN-T link 74.0 39.9% 17.6 17.6
2 P-GR-S Giurgiu Port Core TEN-T link 51.7 24.3% 4.3 22.0
3 P-DBOV-S Orsova/Drobeta Core TEN-T link 50.9 23.8% 25.1 47.1
4 P-OT-S Oltenita Port Comprehensive TEN-T link 50.0 30.1% 5.6 52.7
5 P-DB-S Drobeta Turnu Severin Port Core TEN-T link 49.4 22.8% 17.3 70.0
6 P-CV-S Cernavoda Port Core TEN-T link 48.9 22.4% 6.9 76.9
7 P-OV-S Orsova Port Comprehensive TEN-T link 42.4 24.8% 7.8 84.7
8 P-CB-S Corabia Port Other links 32.8 25.1% 4.5 89.2
9 W1Dredging of the joint Romanian-Bulgarian sector of the
DanubeCore TEN-T link 30.9 19.6% 206.7 295.9
10 P-All-S Sulina Channel Improvements Core TEN-T link 30.4 9.5% 20.0 315.9
11 P-CO-S Constanta Port Core TEN-T link 29.5 8.9% 351.1 667.0
12 P-CF-S Calafat Port Core TEN-T link 24.0 2.4% 19.7 686.8
13 P-MV-S Moldova Veche Port Comprehensive TEN-T link 17.2 7.2% 3.7 690.4
14 P-TL-S Tulcea Port Comprehensive TEN-T link 14.0 -1.1% 16.0 706.4
15 W36 Bucharest to Danube Canal Connection Core TEN-T link 10.0 4.7% 1,500.8 2,207.2
16 P-BS-S Basarabi Port Other links 4.0 1.2% 5.6 2,212.8
Po
rts a
nd
Wate
rways
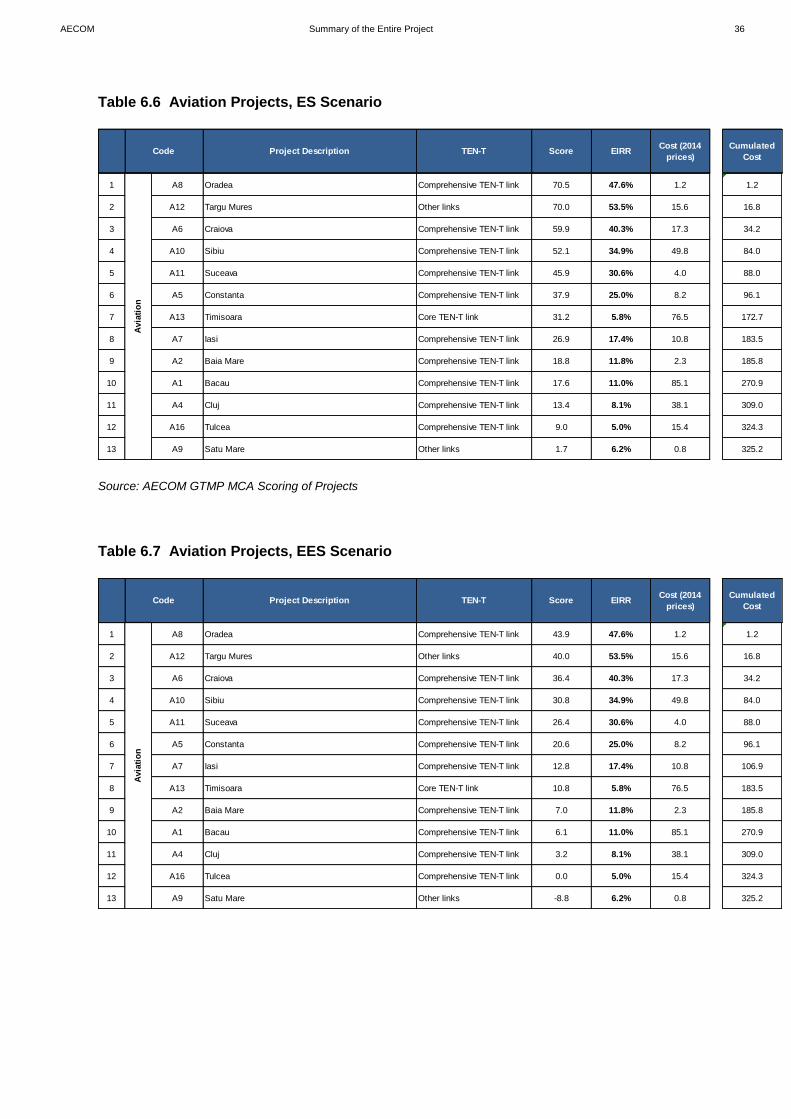
AECOM Summary of the Entire Project 36
Table 6.6 Aviation Projects, ES Scenario
Source: AECOM GTMP MCA Scoring of Projects
Table 6.7 Aviation Projects, EES Scenario
Project Description TEN-T Score EIRRCost (2014
prices)
Cumulated
CostCode
1 A8 Oradea Comprehensive TEN-T link 70.5 47.6% 1.2 1.2
2 A12 Targu Mures Other links 70.0 53.5% 15.6 16.8
3 A6 Craiova Comprehensive TEN-T link 59.9 40.3% 17.3 34.2
4 A10 Sibiu Comprehensive TEN-T link 52.1 34.9% 49.8 84.0
5 A11 Suceava Comprehensive TEN-T link 45.9 30.6% 4.0 88.0
6 A5 Constanta Comprehensive TEN-T link 37.9 25.0% 8.2 96.1
7 A13 Timisoara Core TEN-T link 31.2 5.8% 76.5 172.7
8 A7 Iasi Comprehensive TEN-T link 26.9 17.4% 10.8 183.5
9 A2 Baia Mare Comprehensive TEN-T link 18.8 11.8% 2.3 185.8
10 A1 Bacau Comprehensive TEN-T link 17.6 11.0% 85.1 270.9
11 A4 Cluj Comprehensive TEN-T link 13.4 8.1% 38.1 309.0
12 A16 Tulcea Comprehensive TEN-T link 9.0 5.0% 15.4 324.3
13 A9 Satu Mare Other links 1.7 6.2% 0.8 325.2
Avia
tio
n
Project Description TEN-T Score EIRRCost (2014
prices)
Cumulated
CostCode
1 A8 Oradea Comprehensive TEN-T link 43.9 47.6% 1.2 1.2
2 A12 Targu Mures Other links 40.0 53.5% 15.6 16.8
3 A6 Craiova Comprehensive TEN-T link 36.4 40.3% 17.3 34.2
4 A10 Sibiu Comprehensive TEN-T link 30.8 34.9% 49.8 84.0
5 A11 Suceava Comprehensive TEN-T link 26.4 30.6% 4.0 88.0
6 A5 Constanta Comprehensive TEN-T link 20.6 25.0% 8.2 96.1
7 A7 Iasi Comprehensive TEN-T link 12.8 17.4% 10.8 106.9
8 A13 Timisoara Core TEN-T link 10.8 5.8% 76.5 183.5
9 A2 Baia Mare Comprehensive TEN-T link 7.0 11.8% 2.3 185.8
10 A1 Bacau Comprehensive TEN-T link 6.1 11.0% 85.1 270.9
11 A4 Cluj Comprehensive TEN-T link 3.2 8.1% 38.1 309.0
12 A16 Tulcea Comprehensive TEN-T link 0.0 5.0% 15.4 324.3
13 A9 Satu Mare Other links -8.8 6.2% 0.8 325.2
Avia
tio
n

AECOM Summary of the Entire Project 37
6.1.9 The 2020 and 2030 proposals for intermodal transport are shown on Tables 6.8-9, for the
ES, and EES scenarios respectively.
Table 6.8 Intermodal Projects, ES Scenarios
Source: AECOM GTMP MCA Scoring of Projects
Table 6.9 Intermodal Projects, EES Scenarios
Source: AECOM GTMP MCA Scoring of Projects
6.1.10 In each of these three scenarios there will be included the interventions on rehabilitation and
modernisation of national roads. The selected road sections will be modernised using the
budget set aside for renewals, and included in the funding analysis. The rehabilitation of these
roads does not result in an increase in capacity, or connectivity, but is rather a structured
Project Description TEN-T Score EIRRCost (2014
prices)
Cumulated
CostCode
1 I-BU-S Bucuresti IMT Core TEN-T link 100.0 13.8% 18.0 18.0
2 I-TM-S Timisoara IMT Core TEN-T link 42.7 6.6% 18.0 36.0
3 I-CR-S Craiova IMT Core TEN-T link 42.7 6.6% 18.0 54.0
4 I-BC-S Bacau IMT Core TEN-T link 41.1 6.4% 18.0 72.0
5 I-SU-S Suceava IMT Core TEN-T link 41.1 6.4% 18.0 90.0
6 I-CJ-S Cluj-Napoca IMT Core TEN-T link 40.3 6.3% 18.0 108.0
7 I-DB-S Drobeta Turnu Severin IMT Core TEN-T link 34.9 5.6% 8.0 116.0
8 I-GL-S Galati IMT Core TEN-T link 30.0 4.7% 23.0 139.0
9 I-GR-S Giurgiu IMT Core TEN-T link 30.0 1.4% 10.0 149.0
10 I-IS-S Iasi IMT Core TEN-T link 30.0 3.9% 18.0 167.0
11 I-TU-S Turda IMT Core TEN-T link 30.0 0.1% 18.0 185.0
12 I-OR-S Oradea IMT Comprehensive TEN-T link 9.0 3.8% 18.0 203.0
Inte
rmo
dal
Project Description TEN-T Score EIRRCost (2014
prices)
Cumulated
CostCode
1 I-BU-S Bucuresti IMT Core TEN-T link 80.0 13.8% 18.0 18.0
2 I-TM-S Timisoara IMT Core TEN-T link 39.1 6.6% 18.0 36.0
3 I-CR-S Craiova IMT Core TEN-T link 39.1 6.6% 18.0 54.0
4 I-SU-S Suceava IMT Core TEN-T link 37.9 6.4% 18.0 72.0
5 I-BC-S Bacau IMT Core TEN-T link 37.9 6.4% 18.0 90.0
6 I-CJ-S Cluj-Napoca IMT Core TEN-T link 37.4 6.3% 18.0 108.0
7 I-DB-S Drobeta Turnu Severin IMT Core TEN-T link 33.5 5.6% 8.0 116.0
8 I-GL-S Galati IMT Core TEN-T link 30.0 4.7% 23.0 139.0
9 I-GR-S Giurgiu IMT Core TEN-T link 30.0 1.4% 10.0 149.0
10 I-TU-S Turda IMT Core TEN-T link 30.0 0.1% 18.0 167.0
11 I-IS-S Iasi IMT Core TEN-T link 24.0 3.9% 18.0 185.0
12 I-OR-S Oradea IMT Comprehensive TEN-T link 20.0 3.8% 18.0 203.0
Inte
rmo
dal
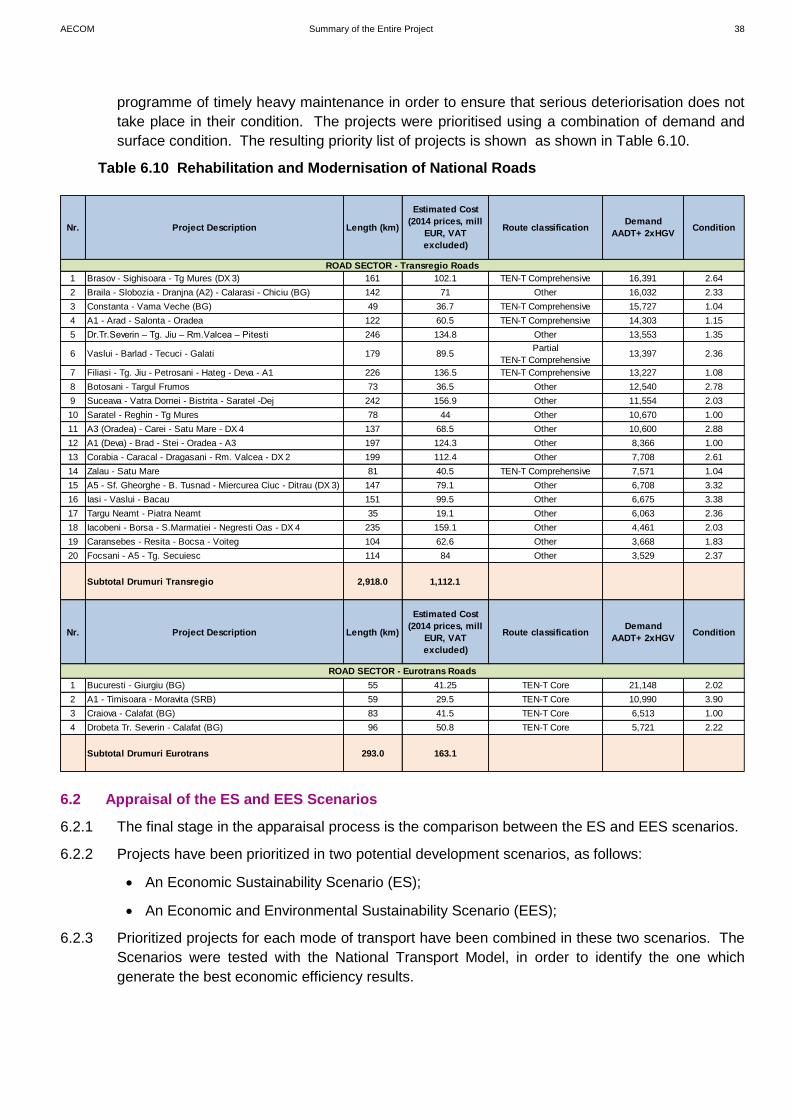
AECOM Summary of the Entire Project 38
programme of timely heavy maintenance in order to ensure that serious deteriorisation does not
take place in their condition. The projects were prioritised using a combination of demand and
surface condition. The resulting priority list of projects is shown as shown in Table 6.10.
Table 6.10 Rehabilitation and Modernisation of National Roads
6.2 Appraisal of the ES and EES Scenarios
6.2.1 The final stage in the apparaisal process is the comparison between the ES and EES scenarios.
6.2.2 Projects have been prioritized in two potential development scenarios, as follows:
An Economic Sustainability Scenario (ES);
An Economic and Environmental Sustainability Scenario (EES);
6.2.3 Prioritized projects for each mode of transport have been combined in these two scenarios. The
Scenarios were tested with the National Transport Model, in order to identify the one which
generate the best economic efficiency results.
Nr. Project Description Length (km)
Estimated Cost
(2014 prices, mill
EUR, VAT
excluded)
Route classificationDemand
AADT+ 2xHGVCondition
1 Brasov - Sighisoara - Tg Mures (DX 3) 161 102.1 TEN-T Comprehensive 16,391 2.64
2 Braila - Slobozia - Dranjna (A2) - Calarasi - Chiciu (BG) 142 71 Other 16,032 2.33
3 Constanta - Vama Veche (BG) 49 36.7 TEN-T Comprehensive 15,727 1.04
4 A1 - Arad - Salonta - Oradea 122 60.5 TEN-T Comprehensive 14,303 1.15
5 Dr.Tr.Severin – Tg. Jiu – Rm.Valcea – Pitesti 246 134.8 Other 13,553 1.35
6 Vaslui - Barlad - Tecuci - Galati 179 89.5Partial
TEN-T Comprehensive13,397 2.36
7 Filiasi - Tg. Jiu - Petrosani - Hateg - Deva - A1 226 136.5 TEN-T Comprehensive 13,227 1.08
8 Botosani - Targul Frumos 73 36.5 Other 12,540 2.78
9 Suceava - Vatra Dornei - Bistrita - Saratel -Dej 242 156.9 Other 11,554 2.03
10 Saratel - Reghin - Tg Mures 78 44 Other 10,670 1.00
11 A3 (Oradea) - Carei - Satu Mare - DX 4 137 68.5 Other 10,600 2.88
12 A1 (Deva) - Brad - Stei - Oradea - A3 197 124.3 Other 8,366 1.00
13 Corabia - Caracal - Dragasani - Rm. Valcea - DX 2 199 112.4 Other 7,708 2.61
14 Zalau - Satu Mare 81 40.5 TEN-T Comprehensive 7,571 1.04
15 A5 - Sf. Gheorghe - B. Tusnad - Miercurea Ciuc - Ditrau (DX 3) 147 79.1 Other 6,708 3.32
16 Iasi - Vaslui - Bacau 151 99.5 Other 6,675 3.38
17 Targu Neamt - Piatra Neamt 35 19.1 Other 6,063 2.36
18 Iacobeni - Borsa - S.Marmatiei - Negresti Oas - DX 4 235 159.1 Other 4,461 2.03
19 Caransebes - Resita - Bocsa - Voiteg 104 62.6 Other 3,668 1.83
20 Focsani - A5 - Tg. Secuiesc 114 84 Other 3,529 2.37
Subtotal Drumuri Transregio 2,918.0 1,112.1
Nr. Project Description Length (km)
Estimated Cost
(2014 prices, mill
EUR, VAT
excluded)
Route classificationDemand
AADT+ 2xHGVCondition
1 Bucuresti - Giurgiu (BG) 55 41.25 TEN-T Core 21,148 2.02
2 A1 - Timisoara - Moravita (SRB) 59 29.5 TEN-T Core 10,990 3.90
3 Craiova - Calafat (BG) 83 41.5 TEN-T Core 6,513 1.00
4 Drobeta Tr. Severin - Calafat (BG) 96 50.8 TEN-T Core 5,721 2.22
Subtotal Drumuri Eurotrans 293.0 163.1
ROAD SECTOR - Transregio Roads
ROAD SECTOR - Eurotrans Roads

AECOM Summary of the Entire Project 39
6.2.4 Following the economic evaluation, the two scenarios were assessed using an Appraisal
Summary Table (AST). The outcomes of economic, and wider apparaisal, for the two scenarios
is given below.
6.3 Economic Indicators
6.3.1 Tables 6.11 shows the key economic performance indicators for the ES and EES scenarios.
Table 6.11 Key Economic Indicators, ES and EES Scenario
Project Title EES Final Strategy ES Final Strategy Difference (EES - ES)
Undiscounted Costs (million EUR in 2010 prices) 31,550.65 32,441.85 -891.19
CAPEX (million EUR) 31,290.57 32,181.76 -891.19
OPEX (million EUR) 260.08 260.08 0.00
Discount year 2010 2010 -
Incremental Cost or Benefit
(Million EUR) counted
Share in Total
Costs / Benefits
Incremental Costor
Benefit(Million EUR)
Discounted
Share in Total
Costs / Benefits
Absolute Difference
% of Total Difference in Costs/ Benefits
Cost to Infrastructure Manager
CAPEX 18,503.78 100% 18,980.22 100% -
476.44 100%
OPEX 40.55 0% 40.55 0% 0.00 0%
Cost to Operator
CAPEX 0.00 0% 0.00 0% 0.00 0%
OPEX 17.84 0% 17.84 0% 0.00 0%
Benefit To Users
Value of Time 30,346.49 60.75% 28,671.32 59.28% 1,675.17
105.98%
Vehicle Operating Costs 815.36 1.63% 1,349.44 2.79% -
534.09 -33.79%
External Impacts
Accidents (Safety) 12,932.99 25.89% 12,570.52 25.99% 362.47 22.93%
Noise 359.53 0.72% 360.25 0.74% -0.72 -0.05%
Air Pollution 6,425.50 12.86% 6,160.33 12.74% 265.18 16.78%
Climate Change -912.19 -1.83% -724.82 -1.50% -
187.37 -11.85%
Present Value of Costs 18,544.33 19,020.76 -476.44
Present Value of Benefits
49,950.45 48,369.81 1,580.64
Net Present Value (NPV) 31,406.12 29,349.04 2,057.07
EIRR 10.86% 10.50% 0.36%
Benefit/Cost Ratio 2.69 2.54 0.15
6.3.2 The underlying purpose of the Master Plan is to contribute to Romania’s economic growth. The
undiscounted benefits from the Master Plan total some €179bn, which equates to approximately
2% of Romania’s GDP in the period 2020 – 2050.
AECOM Summary of the Entire Project 40
6.3.3 The two scenarios were also compared using more comprehensive criteria, which included
Environment (physical impacts), Policy with regard to the TEN-T, and Accessibilty.

AECOM Summary of the Entire Project 41
Table 6.11 ES and EES Scenarios: Appraisal Summary Table (AST) (to be modified)
Attribute Description
ES Scenario EES Scenario ES Scenario EES
Scenario
Economy
Economic
Internal Rate of
Return: (EIRR)
EIRR is the discount rate that needs to be applied so that the
discounted value of the total stream of net economic benefits
is equal to the initial capital investment. It is independent of
project size and is effectively the economic return on the inves
10.5% 10.9% 47 50
NPV The value of discounted benefits less discounted costs over
the economic life of the programme.
29,349 31,406 47 50
Time Savings The economic value of time savings to passengers and freight
produced by the investment in transport.
28,671 30,346
Operating Costs The economic value of operating costs produced by the
investment in transport discounted over the economic life of
the programme. In practice, can be positive or negative.
1,349 815
Safety The economic value of the savings in human life produced by
the investment in transport discounted over the economic life
of the programme.
12,571 12,933
External Impacts:
Noise, Air
Pollution, Climate
Change
The economic value of the changes in noise levels, air
pollution, and climate change produced by the investment in
transport discounted over the economic life of the programme.
5,795 5,874
Noise 360 360
Air Pollution 6,160 6,426
Climate Change -725 -912
Overall Score,
Economic
Performance
94 100
Environment
Impact on
Conservation
Areas/Natura
2000
Physical impact of the programme on Natura 2000 areas
Impact on
Landscape
Physical Impact on other areas of landscape quality
Overall Score,
Environmental
Performance
Policy
Strategic
Connectivity – on
TEN-T Core
/Comprehensive
or National
Routes
The degree to which the programme adds to the TEN-T
network in Romania
% kms of Road projects on Core TEN-T (L1 +L2)
% of Rail Projects on Core TEN-T
Overall Score
Policy
Performance
Accessibility
Accessibility –
Improves the
connectivity of
Romania’s
regions and
increases
accessibility to
economic activity
The methodology uses the sum of employment opportunities
from each zone to every other zone, divided by the generalized
cost of travel, weighted by mode, between each zone. The
measure is best used in a comparative way, ie the difference
between each sce
16.10% 17.90% 90 100
Overall Score
Accessibility
Performance
90 100
Overall Score
(unweighted)
184 200
Overall Score
(weighted)
Value Score
6.3.4 The conclusion is that the Economic and Environmentally Sustainable scenario performed better,
and that this strategy should be the long term plan for Romania.

Funding Analysis

AECOM Summary of the Entire Project 43
7.1.1 Whilst the process of problems analysis, setting objectives and defining interventions, and the
subsequent testing and appraisal of projects gives an order of merit of the projects, it does not
generate the funds needed to implement them. It is a Government responsibility to allocate
funds to the various sectors for which it is responsible, and the responsibility of Ministries,
including of course the Ministry of Transport, to spend that allocation wisely. The role of the
Master Plan is thus to ensure that the funds available are spent on projects that give the best
return.
7.1.2 The funding analysis is based on a certain percentage of GDP to be allocated to maintenance
and capital investment. It is recognised that there will, in reality, be other costs incurred by the
Government and other parties involved in implementing the Master Plan, but the “rules of the
game” are that these two elements are those which should provide the constraint in which the
Master Plan projects will be implemented. These two elements make up the majority of
expenditure by the Government.
7.1.3 The so-called “soft measures” will require some financing to implement, but the costs involved
are small compared with the maintenance and investment budgets, and in any case most of the
soft measures should be self-financing over time.
7.1.4 To prevent uncertainty regarding the long-term funding assurance for the pipeline of projects
included in the Master Plan, a commitment from the Government of Romania is needed to
allocate a certain percentage of GDP for the transport sector, seen as an ex-ante conditionality
for the European Commission to approve the Master Plan and, further on, the Large
Infrastructure Operational Programme (POIM) for the 2014-2020 period.
7.1.5 As an immediate action to this requirement, a decision of the Romanian Government was issued
in December 2013 on the commitment of 2% of GDP for the transport sector2. It is clearly
specified in this commitment that the allocation of 2% of GDP shall be allocated only for
investments and maintenance works for the transport infrastructure, on all modes of transport.
7.1.6 In addition to this, the European Commission has specified that the Master Plan should be
developed based on a hierarchical approach to allocation of funds to expenditure items, with
expenditure on essential items, such as the maintenance of the rail and road networks, to be
guranteed. The remaining funds (after these commitments have been fully funded) are then
available for new investment and maintenance. Following these requirements, a spreadsheet
model was produced to quantify the available funds for Master Plan projects to be implemented
by 2020 and 2030. Its key assumptions and the considered methodology are described below.
7.1.7 One of the particular aspects of the assumptions regarding the financial plan for the Master Plan
was that the net EU funding (Cohesion Funds, European Regional Development Funds and
Connecting Europe Facility funds) are included in the allocation of 2% of GDP. This means that
there is a direct correlation between the required national contributions to sustain the EU funded
projects and the available remaining budgets.
7.1.8 Based on the this approach and the estimations for the up-front committed expenditures (related
mainly to maintenance, renewals and rehabilitations for road and rail network) the total available
2 Romanian Government letter no. 57338 submitted to European Commission on 09/12/2013
7 Funding Analysis

AECOM Summary of the Entire Project 44
budgets for investments in the transport sector, by mode, are estimated for the timelines 2020
and 2030. The headline figures are included in Table 7.1.
Table 7.1 Distribution of expenditures in the transport sector for 2014-2020 and 2021-2030 (mill Eur, 2014 fixed prices)
2014-2020 2021-2030 2014-2030
2% from GDP available for the transport sector
A 22,599 43,216 65,815
Maintenance and lifecycle costs
B1 7,260 32.1% 20,650 47.8% 27,910 42.4%
Rehabilitation works for the viable road network
B2 4,578 20.3% 0 0.0% 4,578 7.0%
Available Public Funds for investments, including EU and National Contribution, from which
C =A-B1-B2 10,761 47.6% 22,566 52.2% 33,327 50.6%
EU Contribution C1 6,332 9,046 15,379
National Co-financing C2 1,923 2,747 4,669
Sustainability indicator/Net National Funds
D =C-C1-C2 2,506 10,773 13,279
Phased projects and Bucharest Metro
E 1,911 3,200 5,111
Available for GTMP projects (total inc. EU + national)
F =C-E 8,850 39.2% 19,366 44.8% 28,216 42.9%
+ 30% Over commitment G =F*1.3 11,505 25,176 36,680
Roads 5,867 51% 12,840 51% 18,707 51%
Rail 5,062 44% 11,077 44% 16,139 44%
Ports, Inland Waterways 324 56% 732 66% 1,056 58%
Aviation 188 33% 357 28% 545 30%
Intermodal 63 11% 170 14% 233 13%
Source: GTMP Funding Analysis
7.1.9 One of the key figures in the above financial plan is line D, the Sustainability Indicator. This
shows the available net national funds after the deduction from the remaining funds (after the up-
front allocations for maintenance, renewals and rehabilitations) of the EU funds and of the
corresponding national contribution to sustain the EU funded projects. These represents the net
national funds available to sustain projects which are a priority on short term (2020) but which:
a) are not eligible for EU funding; or
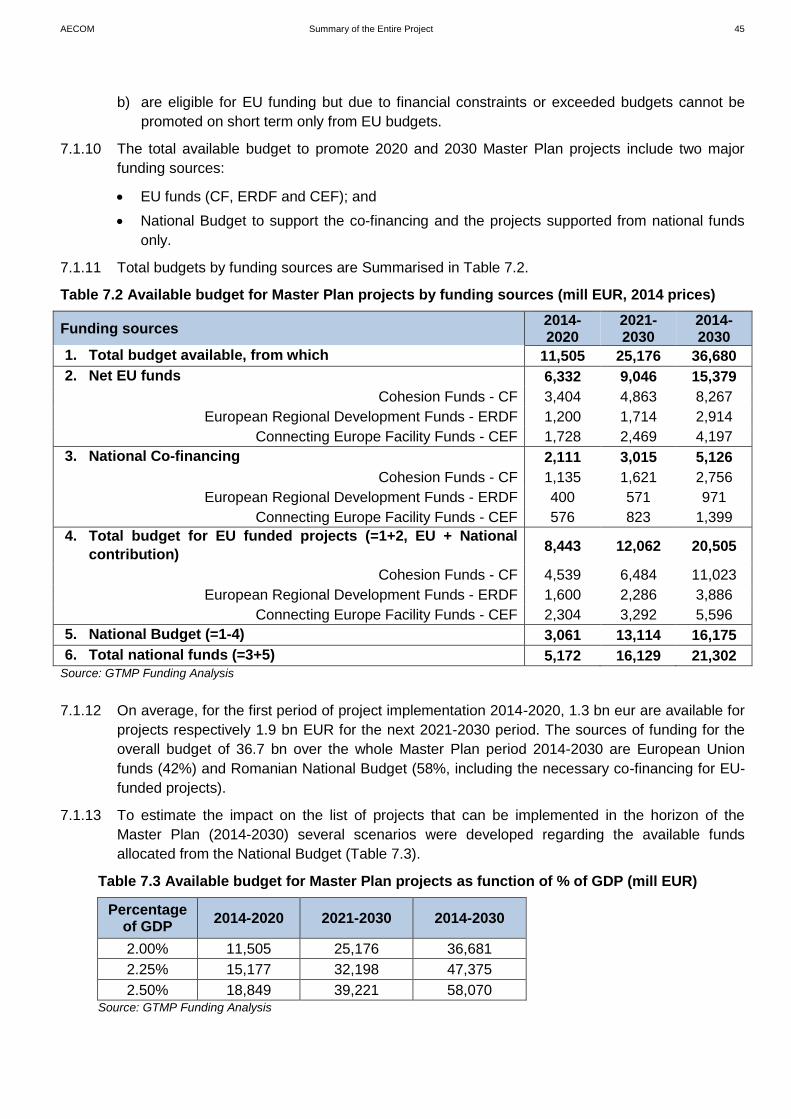
AECOM Summary of the Entire Project 45
b) are eligible for EU funding but due to financial constraints or exceeded budgets cannot be
promoted on short term only from EU budgets.
7.1.10 The total available budget to promote 2020 and 2030 Master Plan projects include two major
funding sources:
EU funds (CF, ERDF and CEF); and
National Budget to support the co-financing and the projects supported from national funds
only.
7.1.11 Total budgets by funding sources are Summarised in Table 7.2.
Table 7.2 Available budget for Master Plan projects by funding sources (mill EUR, 2014 prices)
Funding sources 2014-2020
2021-2030
2014-2030
1. Total budget available, from which 11,505 25,176 36,680
2. Net EU funds 6,332 9,046 15,379
Cohesion Funds - CF 3,404 4,863 8,267
European Regional Development Funds - ERDF 1,200 1,714 2,914
Connecting Europe Facility Funds - CEF 1,728 2,469 4,197
3. National Co-financing 2,111 3,015 5,126
Cohesion Funds - CF 1,135 1,621 2,756
European Regional Development Funds - ERDF 400 571 971
Connecting Europe Facility Funds - CEF 576 823 1,399
4. Total budget for EU funded projects (=1+2, EU + National
contribution) 8,443 12,062 20,505
Cohesion Funds - CF 4,539 6,484 11,023
European Regional Development Funds - ERDF 1,600 2,286 3,886
Connecting Europe Facility Funds - CEF 2,304 3,292 5,596
5. National Budget (=1-4) 3,061 13,114 16,175
6. Total national funds (=3+5) 5,172 16,129 21,302 Source: GTMP Funding Analysis
7.1.12 On average, for the first period of project implementation 2014-2020, 1.3 bn eur are available for
projects respectively 1.9 bn EUR for the next 2021-2030 period. The sources of funding for the
overall budget of 36.7 bn over the whole Master Plan period 2014-2030 are European Union
funds (42%) and Romanian National Budget (58%, including the necessary co-financing for EU-
funded projects).
7.1.13 To estimate the impact on the list of projects that can be implemented in the horizon of the
Master Plan (2014-2030) several scenarios were developed regarding the available funds
allocated from the National Budget (Table 7.3).
Table 7.3 Available budget for Master Plan projects as function of % of GDP (mill EUR)
Percentage of GDP
2014-2020 2021-2030 2014-2030
2.00% 11,505 25,176 36,681
2.25% 15,177 32,198 47,375
2.50% 18,849 39,221 58,070 Source: GTMP Funding Analysis

AECOM Summary of the Entire Project 46
7.1.14 Total investment cost for projects identified in the Master Plan process, across all modes, is 45.3
bn EUR in fixed 2014 prices. A sensitivity analysis shows that an allocation of 2.2% of GDP is
enough to support the full list of identified interventions.

Public Consultation
AECOM Summary of the Entire Project 48
8.1.1 Reference has already been made to the wide-ranging consultations which took place while the
Master Plan was being formulated, particularly with respect to the specification of interventions.
8.1.2 Following the publication of the Master Plan at the end of August, a series of Public
Consultations on the Master Plan took place at the Ministry of Transport in October and
November, where presentations were given by the Ministry followed by question and answer
sessions from the audience. Each consultatioin was on a particular mode of transport, namely
Roads, Railways, Ports, Aviation and Intermodal Transport. A wide range of interests were
represented at the consultations, including industry representatives, trade bodies, councillors,
special interest groups, company representatives, journalists, and members of the public.
8.1.3 A number of written submissions were received, 51 in total. These were analysed and, and if the
points made were relevant these were taken into account in the final plan.
8 Public Consultation

Cross-Sectional Analysis

AECOM Summary of the Entire Project 50
9.1.1 Although all of the analysis and modelling for the Master Plan has been undertaken on a
multi-modal basis, much of the analysis in this Report has been described on a modal basis.
In this section we describe the main issues at a cross-sectoral level.
9.2 Operational Performance of the EES Scenario
9.2.1 The NTM produces a large volume of data which demonstrate how the transport network is
performing. In this section, the performance of the EES is compared with the Reference
Scenario, which represents the future situation that would exist without the Master Plan
projects, that is with financially committed projects only. This is the most valid comparison
because it shows on a like for like basis what difference the Master Plan is forecast to make.
9.2.2 Comparisons with the Base situation (2011) are also shown but these also contain changes
that would occur in transport demand between the different years, regardless of the Master
Plan projects.
9.2.3 Figure 9.1 shows the forecast changes in passenger transport in 2020 and 2030.
Source: AECOM, National Transport Model
Figure 9.1 Evolution of Passenger Transport in 2020 and 2030 EES vs. Ref Case
9.2.4 The results show that, with the investments in improved maintenance, and in line speeds
and service improvements, substantial increases in rail passenger traffic could be achieved.
The forecast increase is a 42% increase in rail passengers, and 73% increase in passenger
kms by 2020, rising to 88% and 110% by 2030 when the full strategy should be in place.
9.2.5 By contrast, the forecast increases in road traffic are modest, with a small decrease in car
passenger traffic and a modest rise in passenger kms. The rail investments lead to a
decrease in bus passenger kms of 11% and 17% in 2020 and 2030 respectively.
9.2.6 One feature of the forecast impacts is the increase in average journey lengths – passenger
kms grow to a larger extent than passenger numbers, and this is to be expected given the
9 Cross-Sectional Analysis
Passengers Passenger kms
Car -0.6% 3.9%
Bus -6.4% -10.7%
Rail 42.1% 72.7%
Air -6.1% -3.2%
Total -0.1% 5.4%
Change in Passenger Demand 2020 Ref Case - 2020 EES
Passengers Passenger kms
Car -0.7% 8.9%
Bus -11.0% -17.2%
Rail 87.7% 110.0%
Air -17.4% -8.3%
Total -0.3% 6.7%
Change in Passenger Demand 2030 Ref Case - 2030 EES

AECOM Summary of the Entire Project 51
higher speeds, shorter journey times, and greater connectivity, that the Master Plan
interventions will provide.
9.2.7 Figure 9.2 provides similar information for freight traffic.
Source: AECOM, National Transport Model
Figure 9.2 Evolution of Freight Transport in 2020 and 2030 EES vs. Ref Case
9.2.8 The same pattern for freight traffic is evident, although the impact is less, for two reasons.
First, the relative improvement in freight train speeds is less than for passenger services,
and secondly, the transit time is only one element of the cost of moving freight.
9.2.9 Freight tonne kms grow at roughly twice the rate of tonnes lifted.Here the largest increases
in tonnes carried and tonne kms are again in rail freight, where tonne kms are forecast to
increase by 6% in both 2020 and 2030. Waterborne freight is also forecast to increase in
both 2020 and 2030, as a result of investment in increasing the navigability of the Danube,
and port improvements.
9.2.10 Figure 10.3 shows the change in mode choice.
Tonnes Tonne Kms
Road -0.9% -2.1%
Rail 2.9% 6.2%
Water 2.7% 2.1%
Totals 0.1% -0.2%
Change in Freight Demand2020 Ref Case - 2020 EES
Tonnes Tonne Kms
Road -1.5% -3.0%
Rail 4.1% 5.5%
Water 9.8% 5.3%
Totals 0.1% -0.8%
Change in Freight Demand2030 Ref Case - 2030 EES
78%
17% 3.7%1.00%
78%
16%
5.3%0.94%
Passenger Trip Mode Share (%)(Centre: 2020 Ref Case Outer: 2020 EES)
Car
Bus
Rail
Air
82%
15%2.4%1.11%
81%
13%
4.5%0.92%
Passenger Trip Mode Share (%)(Centre: 2030 Ref Case Outer: 2030 EES)
Car
Bus
Rail
Air
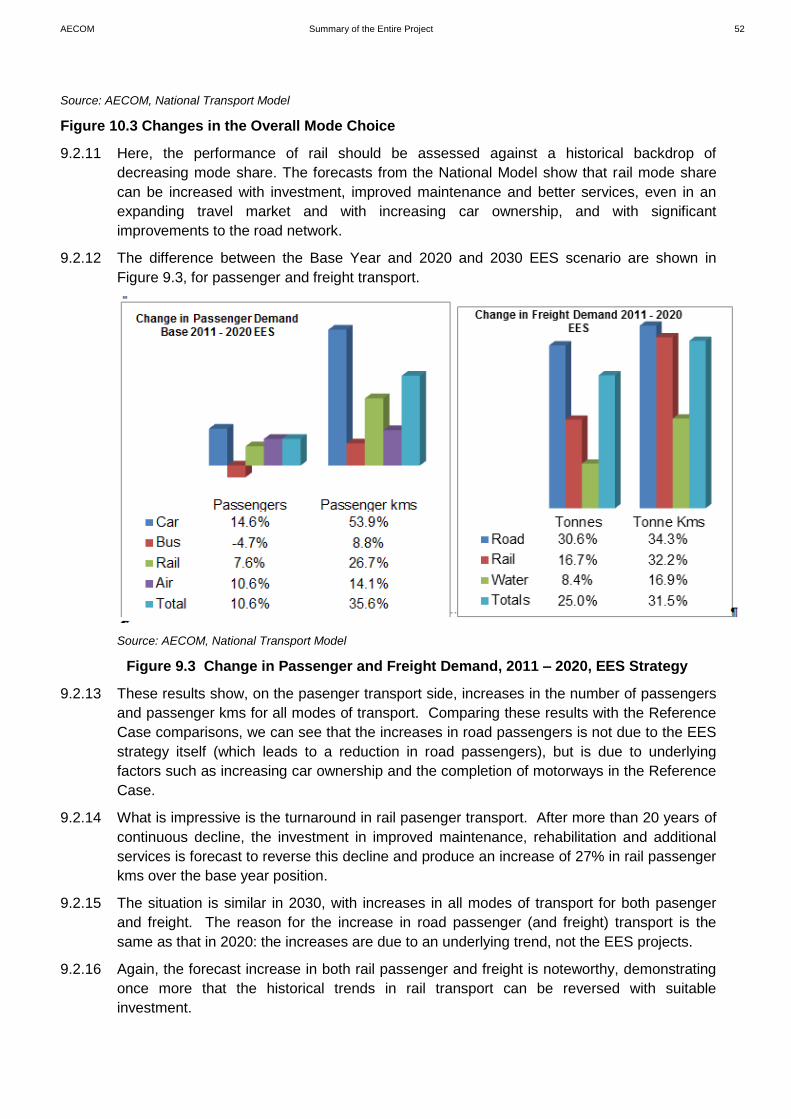
AECOM Summary of the Entire Project 52
Source: AECOM, National Transport Model
Figure 10.3 Changes in the Overall Mode Choice
9.2.11 Here, the performance of rail should be assessed against a historical backdrop of
decreasing mode share. The forecasts from the National Model show that rail mode share
can be increased with investment, improved maintenance and better services, even in an
expanding travel market and with increasing car ownership, and with significant
improvements to the road network.
9.2.12 The difference between the Base Year and 2020 and 2030 EES scenario are shown in
Figure 9.3, for passenger and freight transport.
Source: AECOM, National Transport Model
Figure 9.3 Change in Passenger and Freight Demand, 2011 – 2020, EES Strategy
9.2.13 These results show, on the pasenger transport side, increases in the number of passengers
and passenger kms for all modes of transport. Comparing these results with the Reference
Case comparisons, we can see that the increases in road passengers is not due to the EES
strategy itself (which leads to a reduction in road passengers), but is due to underlying
factors such as increasing car ownership and the completion of motorways in the Reference
Case.
9.2.14 What is impressive is the turnaround in rail pasenger transport. After more than 20 years of
continuous decline, the investment in improved maintenance, rehabilitation and additional
services is forecast to reverse this decline and produce an increase of 27% in rail passenger
kms over the base year position.
9.2.15 The situation is similar in 2030, with increases in all modes of transport for both pasenger
and freight. The reason for the increase in road passenger (and freight) transport is the
same as that in 2020: the increases are due to an underlying trend, not the EES projects.
9.2.16 Again, the forecast increase in both rail passenger and freight is noteworthy, demonstrating
once more that the historical trends in rail transport can be reversed with suitable
investment.

AECOM Summary of the Entire Project 53
Source: AECOM, National Transport Model
Figure 9.4 Change in Passenger and Freight Demand, 2011 – 2030, EES Strategy
9.3 Allocation of resources per mode: € per pass km, € per tonne km
9.3.1 One measure of the contribution of each mode to the national transport picture is
passeneger and tonne kms. We have analysed the investments in the road, rail and
waterways sector in relationship to the contribution each make in terms of these measures.
The results are presented below:
Table 9.1 EES Scenario: Spending per Passenger km and tonne km
Expenditure in the Master Plan
(m. euro)
Passenger kms/day
Tonne kms/day
€/passenger km day
€/tonne km/day
Roads 18,707 156,721,866 194,257,197 119 96
Rail + Intermodal 16,139 19,096,378 43,614,918 845 370
Waterways 1,056
41,717,021
25
Source: Funding Analysis and national Model
9.3.2 The table must be interpreted with care. The two measures are not an indication of what
each mode deserves to receive. The projects in each mode are justified in a logical,
structured manner, from problem identification through to intervention and appraisal, and
each investment stands on its own merit. The road and rail networks are starting from
different points with regard to their development. Water transport is largely provided by the
River Danube, which is resource provided by nature, and is not entirely man-made like roads
or railways.
9.3.3 Nevertheless, the data do illustrate a conscious intention in the Master Plan to address the
decline in the railway network and attempt to re-vitalise the railway so that it again plays a
significant role in national transport, and to safeguard its future.

AECOM Summary of the Entire Project 54
9.4 Heavy Goods Vehicle Road User Charge (RUC)
9.4.1 One means of icreasing revenue from road users, and hence income to the Ministry of
Transport to help make good the transport infrastructure deficit in Romania, would be to
introduce road user charging. Such a policy would be consistent with the EU 2011
Transport White Paper.
9.4.2 There are two principles to establish in designing an RUC scheme:
a) What will be the justification for the charge? For example, will it contribute to
maintenance and environmental costs, and will it replace other charges such as fuel
tax or vignettes?
b) To which roads will the charge apply? If the charge is applied only to motorways and
national roads, there will be a transfer of HGV traffic to the less suitable County
roads.
c) How much revenue will be allocated to transport expenditure?
The scheme as tested by AECOM has the following features
9.4.3 A RUC rate of 0.66 Lei (€0.15) per HGV km has been used; this has been calculated to
reimburse the average annual CNADNR maintenance deficit between 2014-2020 and the
environmental impact of HGV traffic in 2020. It also includes a 20% uplift to cover the
administration and operating costs of the RUC scheme. It has been assumed that the 20%
administration cost will not be available to CNADNR for activities other than administration of
the RUC. Thus the justification for the charge is essentially an environmental one, and the
charge could be described as an ecotax.
9.4.4 In order to avoid diversion of HGV traffic to County roads, the charge was applied to all
roads. This implies that the technology to be used would be GIS-based.
9.4.5 How revenue is used is a vital part of gaining public and industry acceptance for charges. In
the analysis which follows, we have assumed two scenarios, one in which all revenue from
road users, net of maintenance and re-habilitation costs, are retained by MT/CNADNR, and
the other in which fuel tax goes into general government taxt revenues via the Ministry of
Finance. This latter scenario seems a more likely outcome.
9.4.6 The introduction of a HGV Road User Charge (RUC) will result in a change in revenue to
CNADNR. This note outlines the estimated cash flows (costs and revenues) to CNADNR
after 2020 if HGV RUC is introduced.
9.4.7 The Annual costs expected to be incurred by CNADNR have been taken from the cost
recovery work done by for the World Bank in 2013. It has been assumed that when a HGV
RUC is introduced the existing vignette scheme will stop, therefore vignette revenues to
CNADNR will also cease.
For comparison, the rates in other European countries in June 2014 were as follows:
Country Rate/km
Austria 0.16 - 0.44
Poland 0.20 - 0.40
Germany 0.14 – 0.29
Sources: http://roadpricing.gw-world.com/en/RoadPricingAustria.aspx; http://www.gddkia.gov.pl/en/1126/motorway-tolls http://www.ages.de/en/hgv-toll-germany-tariffs.html

AECOM Summary of the Entire Project 55
The RUC rates in these countries varies by size and weight of vehicle, and also by emission
category, to encourage cleaner vehicles. If an HGV charging scheme were introduced in
Romania a similar tariff should operate.
9.4.8 The CNADNR share of RUC revenue has been calculated from the number of HGV km on
the CNADNR network. It is assumed that RUC generated on non- CNADNR network will be
allocated elsewhere.
9.4.9 The calculation of RUC revenues and fuel duty revenues take into account that once RUC is
implemented HGV vehicle km will reduce over the ‘without RUC’ case. In 2020 total HGV
vehicle km on the CNADNR network are predicted to reduce by ~4% relative to a situation
without RUC.
9.4.10 The table below shows the annual costs and revenues to CNADNR between 2020-2030 in
m euro.
Table 9.2 Potential Revenues from an HGV Charging Scheme
2020 2021 2022 2023 2024 2025
CNADNR Revenues (excluding Vignette) 75 78 81 83 86 89
CNADNR share of HGV fuel duty 900 932 964 998 1033 1069
CNADNR share of HGV RUC 1305 1367 1429 1491 1553 1616
Total Revenue (excluding fuel duty) 1380 1445 1510 1575 1640 1705
Total Revenue (including fuel duty) 2280 2376 2474 2573 2673 2774
364 267 1287 9459 339 242
1916 2110 1186 -6887 2334 2532
1016 1178 222 -7884 1301 1463
Total
2026 2027 2028 2029 2030
CNADNR Revenues (excluding Vignette) 93 96 99 103 106 989
CNADNR share of HGV fuel duty 1106 1145 1185 1227 1270 11829
CNADNR share of HGV RUC 1678 1740 1802 1864 1926 17772
Total Revenue (excluding fuel duty) 1770 1836 1901 1967 2033 18761
Total Revenue (including fuel duty) 2877 2981 3086 3194 3302 30590
820 249 819 249 2756 16852
2057 2732 2267 2944 546 13738
950 1587 1082 1718 -724 1909
Revenue
Surplus (if fuel duty goes to CNADNR)
Surplus (if fuel duty does NOT go to CNADNR)
CNADNR Costs
Surplus (if fuel duty goes to CNADNR)
Surplus (if fuel duty does NOT go to CNADNR)
Revenue
CNADNR Costs
AECOM Analysis using World Bank Study Cost Recovery Study and the National Model
9.4.11 In our view, the most realistic assumption regarding the potential surplus to CNADNR is the
lower figure of €1.9bn over the period 2020 – 2030. This assumes that the revenue from
fuel duty is part of the Government’s overall tax revenue, and will not be available to
CNADNR or MT to spend on transport projects.
9.4.12 However, at this stage HGV RUC is not a recommendation of the Master Plan. We present
the results here to show what could be achieved by this initiative, but we recognise that it is
a controversial policy which would be unpopular with industry as it increases their costs.
France has recently abandoned its scheme (the ecotaxe) because of opposition from the
haulage industry, despite all-party support.
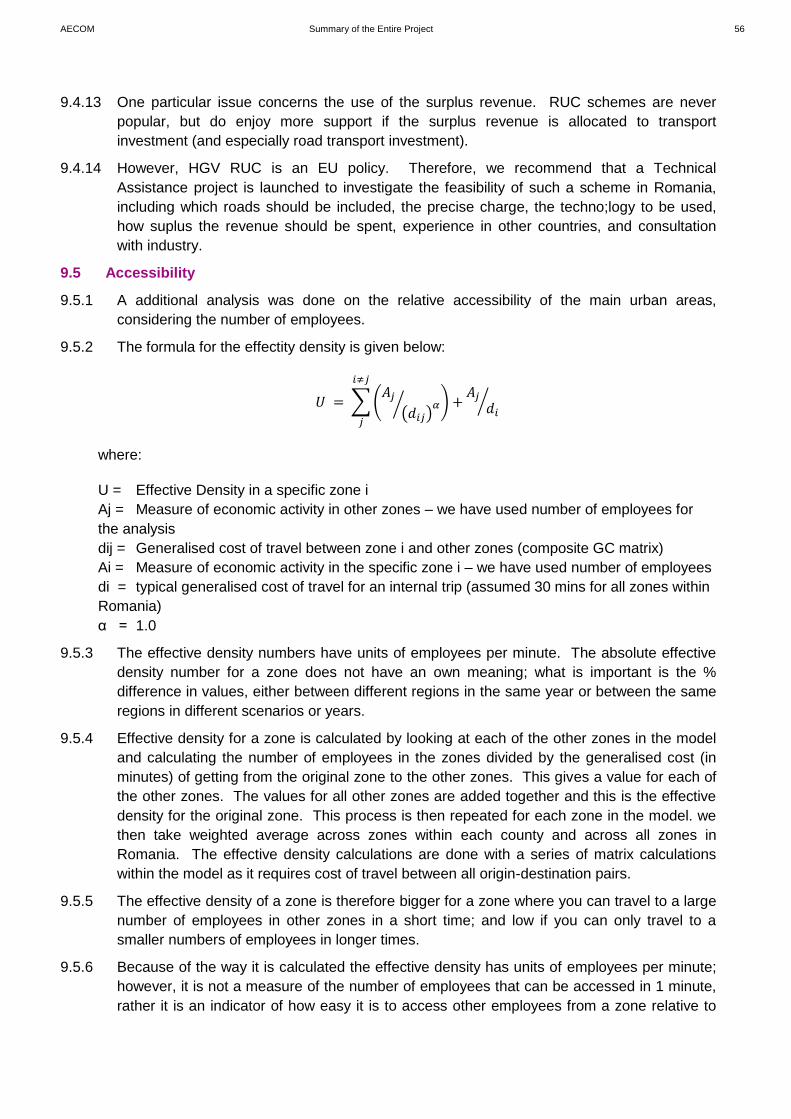
AECOM Summary of the Entire Project 56
9.4.13 One particular issue concerns the use of the surplus revenue. RUC schemes are never
popular, but do enjoy more support if the surplus revenue is allocated to transport
investment (and especially road transport investment).
9.4.14 However, HGV RUC is an EU policy. Therefore, we recommend that a Technical
Assistance project is launched to investigate the feasibility of such a scheme in Romania,
including which roads should be included, the precise charge, the techno;logy to be used,
how suplus the revenue should be spent, experience in other countries, and consultation
with industry.
9.5 Accessibility
9.5.1 A additional analysis was done on the relative accessibility of the main urban areas,
considering the number of employees.
9.5.2 The formula for the effectity density is given below:
𝑈 = ∑ (𝐴𝑗
(𝑑𝑖𝑗)𝛼⁄ ) +
𝐴𝑗𝑑𝑖
⁄
𝑖≠𝑗
𝑗
where:
U = Effective Density in a specific zone i
Aj = Measure of economic activity in other zones – we have used number of employees for
the analysis
dij = Generalised cost of travel between zone i and other zones (composite GC matrix)
Ai = Measure of economic activity in the specific zone i – we have used number of employees
di = typical generalised cost of travel for an internal trip (assumed 30 mins for all zones within
Romania)
α = 1.0
9.5.3 The effective density numbers have units of employees per minute. The absolute effective
density number for a zone does not have an own meaning; what is important is the %
difference in values, either between different regions in the same year or between the same
regions in different scenarios or years.
9.5.4 Effective density for a zone is calculated by looking at each of the other zones in the model
and calculating the number of employees in the zones divided by the generalised cost (in
minutes) of getting from the original zone to the other zones. This gives a value for each of
the other zones. The values for all other zones are added together and this is the effective
density for the original zone. This process is then repeated for each zone in the model. we
then take weighted average across zones within each county and across all zones in
Romania. The effective density calculations are done with a series of matrix calculations
within the model as it requires cost of travel between all origin-destination pairs.
9.5.5 The effective density of a zone is therefore bigger for a zone where you can travel to a large
number of employees in other zones in a short time; and low if you can only travel to a
smaller numbers of employees in longer times.
9.5.6 Because of the way it is calculated the effective density has units of employees per minute;
however, it is not a measure of the number of employees that can be accessed in 1 minute,
rather it is an indicator of how easy it is to access other employees from a zone relative to

AECOM Summary of the Entire Project 57
other zones. This is why % changes in effective density are used to assess impacts rather
than at absolute values.
9.5.7 The Base Year, and 2030 Accessibility plots, for domestic travel are shown on Figures 9.5-6
below.
Source: AECOM National Travel Model
Figure 9.5 Base Year Accessibility, Domestic Travel.

AECOM Summary of the Entire Project 58
Source: AECOM National Travel Model
Figure 9.6 Base Year Accessibility, Domestic Travel.
9.5.8 A comparison between the two plots shows that accessibility to the peripheral parts of
Romania, such as the north-eastern areas of the country in the Buzau – Iasi corridor has
increased, and also to the north-west in the Cluj/Targu Mures area, and to the west around
Timisoara.
9.5.9 Figures 9.7 and 9.8 show the accessibility of Romania to neighbouring countries, for the
Base Year and the 2030 EES scenario.
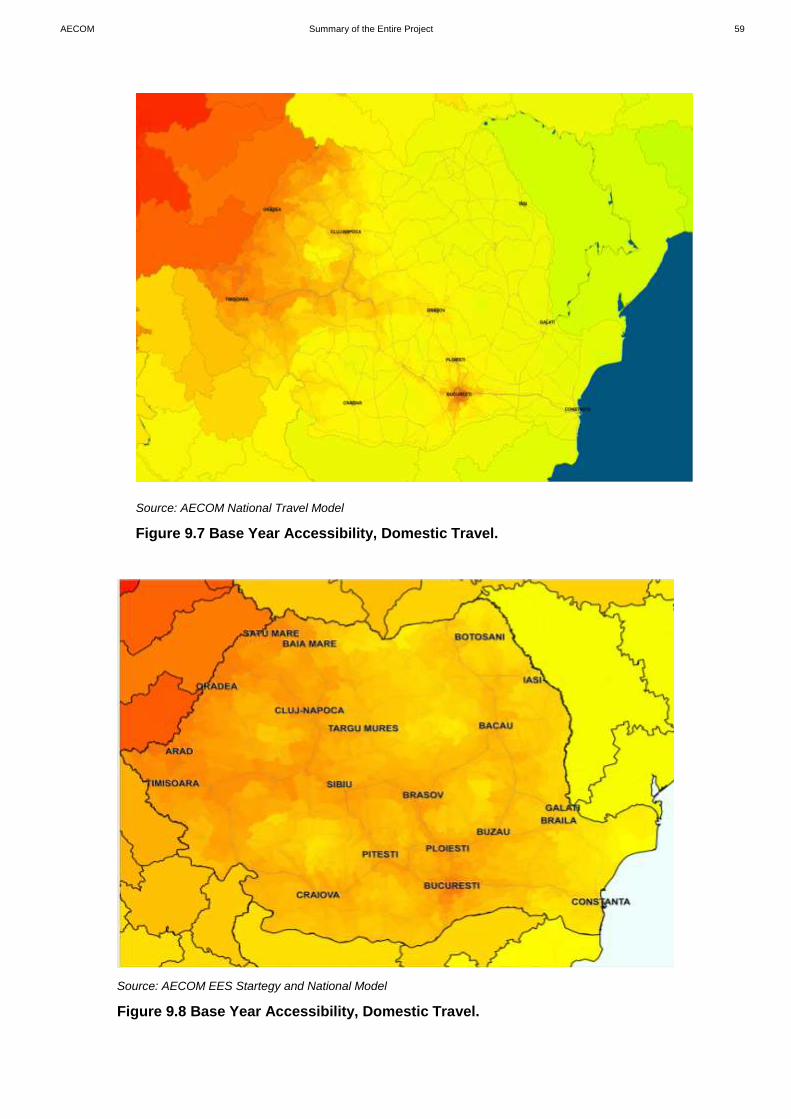
AECOM Summary of the Entire Project 59
Source: AECOM National Travel Model
Figure 9.7 Base Year Accessibility, Domestic Travel.
Source: AECOM EES Startegy and National Model
Figure 9.8 Base Year Accessibility, Domestic Travel.

AECOM Summary of the Entire Project 60
9.5.10 The contrast between the base year and 2030 is marked. Most of the Western and Central
areas of Romania will experience a significant increase in accessibility to external
employment and markets, demonstrating the success that the Master Plan will have in
helping Romania to improve its competitiveness in the wider, global market place.

Implementation Strategy

AECOM Summary of the Entire Project 62
10.1 Introduction
10.1.1 The Master Plan proposals were developed following the logical process of problem analysis and
identification, objective setting, and then defining and appraising interventions. This was
followed by multi-criteriate analysis to rank the major interventions. This process is summarised
in Chapters 1-6 of this report.
10.1.2 The Implementation Plans for each Sector take into account further issues, particularly the
constraints imposed by the eligibility of projects for particular EU funds, and the maturity of
projects. The Implementation Plans consider the following issues, as part of the coordinated
approach to realising the full potential of the Master Plan.
Recommendations for Institutional Reform, including recommendations for changes in
Management and Operating practices;
Maintenance and renewals expenditure required to ensure that the sustainably sized
transport networks are maintained to appropriate international standards;
Targeted safety interventions, in particular for the roads sector where Romania has the worst
road fatality record of all EU member states;
Master Plan project’s eligibility for alternative funding sources, including Cohesion Funds,
ERDF so that the Implementation Plan seeks to make best of limited available funds;
State of readiness for delivery of Master Plan projects. This includes an analysis of length of
time likely to be required to complete the design/feasibility stages of the project delivery
process, taking into account that for a number of Master Plan projects this phase of work is
already underway or tenders have been launched for these services.
10.1.3 Table 10.1 shows an overview of the current status of each mode of transport, with respect to
the most serious issues to be addressed, and a summary of the Master Plan approach in
addressing these problems. There is a discussion in detail in each of the modal chapters in the
Master Plan Report (Chapters 4-8), and a detailed analysis of the problems of each mode in the
Problem Definition Report (available on the Ministry of Transport’s AM POS-T website3). The
connection between Problems, Objectives and Interventions is described in a series of Technical
Notes.
10.1.4 The implementation Strategies for each mode are presented in subsequent sections.
3 http://www.ampost.ro/fisiere/pagini_fisiere/Raport_privind_definirea_problemelor.pdf
10 Implementation Strategy

AECOM Summary of the Entire Project 63
Table 10.1 Main issues and proposed solutions for each mode of transport
General theme Mode of
Transport Main issues identified Proposed solution in the Master Plan
Inadequate Maintenance
Roads Inadequately maintained existing and future assets on the national network
Adopt best practice PMS approach to prioritization of roads maintenance and perform detailed review of the existing assets and O&M funding requirements
Railways The current network size faces a substantial and growing disparity against both the demand and the financial resources available to maintain and operate it.
Focus the scarce maintenance and development resources on a reduced sustainable network.
Ports and Waterways
Inconsistent maintenance spend along the Danube which has led to an inconsistent navigational experience
Increasing maintenance budgets to match consistently across borders
Intermodal Poor locations/quality of the intermodal terminals Replace of refurbish existing facilities and improve operations
Management & Operations
Roads
Institutional capacity issues Improved institutional & organization stability and capacity to ensure efficient and effective management
Significant damage to roads assets (pavements and structures predominantly) by excessive axel loads
Review appropriateness of axle load legislation and ensure sufficient monitoring and checking procedures
High administrative costs on local and national hauliers from complex and uncoordinated charging regimes
Introduce single coordinated system for charging covering the entire road network
Excessive delays at certain Border Crossings Use of ITS to provide alternative route information coupled with improved management of border crossing arrangements
Railways
The rail sector in Romania in is a generalized crisis A comprehensive reform package to be implemented as soon as possible
The passenger services rail business is uncompetitive and largely uncommercial
Define clear level of service requirements (limited to the primary network), increase frequency on the competitive corridors, introduce regular-interval service timetable and purchase of new rolling stock
The regulatory, organization and management systems currently in place fail to ensure efficiency, competitiveness and accountability
The relations between the public transport authority, CFR Infrastructure and the operators to be restructured
The management of the public rail companies is inefficient.
Re-launch private management techniques with a proper selection process of an efficient business management profile
Intermodal
Low Average Commercial Speed of Freight Trains Establish a contract between infrastructure provider and train operators which requires compensation for delays and dedicated measures implemented by CFR Infrastructure
Poor operation of the existing terminals Increase efficiency of operations by adopting best practices and privatization of facilities
CFR Marfa’s delayed privatization Remove uncertainty over the future of CFR Marfa and privatize as soon as possible
Ports and Limited operating hours Advise authorities to be flexible in opening times/days so
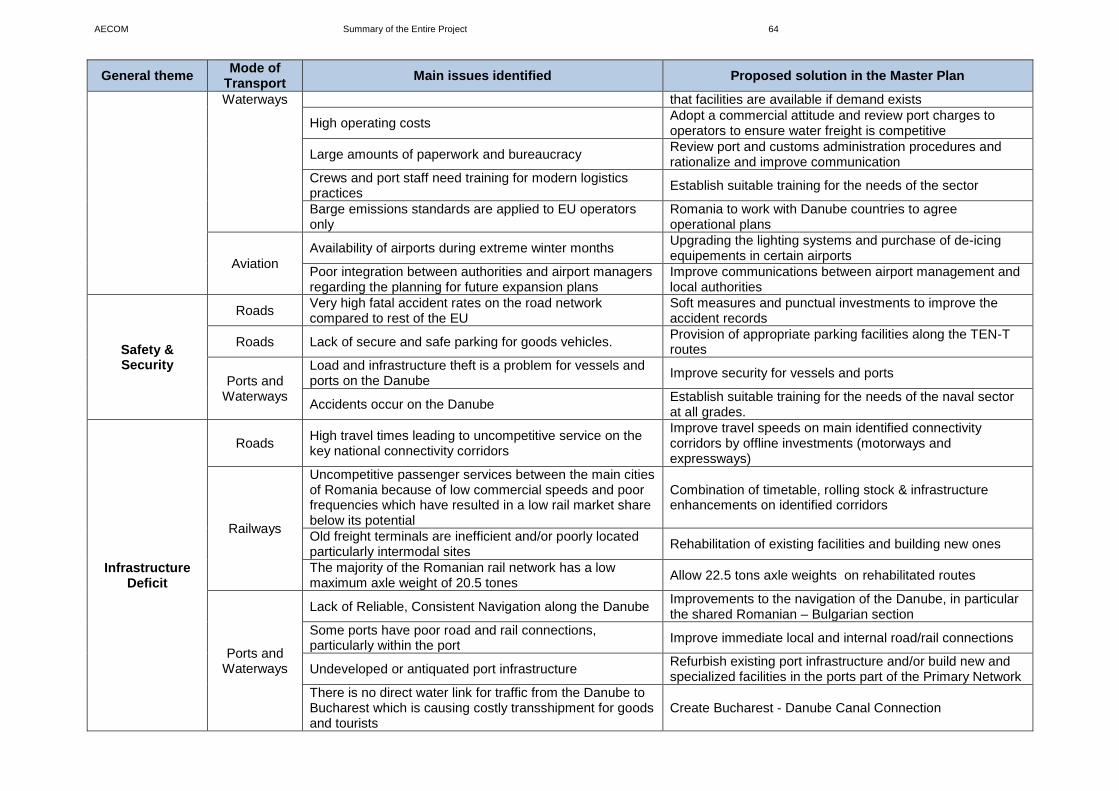
AECOM Summary of the Entire Project 64
General theme Mode of
Transport Main issues identified Proposed solution in the Master Plan
Waterways that facilities are available if demand exists
High operating costs Adopt a commercial attitude and review port charges to operators to ensure water freight is competitive
Large amounts of paperwork and bureaucracy Review port and customs administration procedures and rationalize and improve communication
Crews and port staff need training for modern logistics practices
Establish suitable training for the needs of the sector
Barge emissions standards are applied to EU operators only
Romania to work with Danube countries to agree operational plans
Aviation
Availability of airports during extreme winter months Upgrading the lighting systems and purchase of de-icing equipements in certain airports
Poor integration between authorities and airport managers regarding the planning for future expansion plans
Improve communications between airport management and local authorities
Safety & Security
Roads Very high fatal accident rates on the road network compared to rest of the EU
Soft measures and punctual investments to improve the accident records
Roads Lack of secure and safe parking for goods vehicles. Provision of appropriate parking facilities along the TEN-T routes
Ports and Waterways
Load and infrastructure theft is a problem for vessels and ports on the Danube
Improve security for vessels and ports
Accidents occur on the Danube Establish suitable training for the needs of the naval sector at all grades.
Infrastructure Deficit
Roads High travel times leading to uncompetitive service on the key national connectivity corridors
Improve travel speeds on main identified connectivity corridors by offline investments (motorways and expressways)
Railways
Uncompetitive passenger services between the main cities of Romania because of low commercial speeds and poor frequencies which have resulted in a low rail market share below its potential
Combination of timetable, rolling stock & infrastructure enhancements on identified corridors
Old freight terminals are inefficient and/or poorly located particularly intermodal sites
Rehabilitation of existing facilities and building new ones
The majority of the Romanian rail network has a low maximum axle weight of 20.5 tones
Allow 22.5 tons axle weights on rehabilitated routes
Ports and Waterways
Lack of Reliable, Consistent Navigation along the Danube Improvements to the navigation of the Danube, in particular the shared Romanian – Bulgarian section
Some ports have poor road and rail connections, particularly within the port
Improve immediate local and internal road/rail connections
Undeveloped or antiquated port infrastructure Refurbish existing port infrastructure and/or build new and specialized facilities in the ports part of the Primary Network
There is no direct water link for traffic from the Danube to Bucharest which is causing costly transshipment for goods and tourists
Create Bucharest - Danube Canal Connection
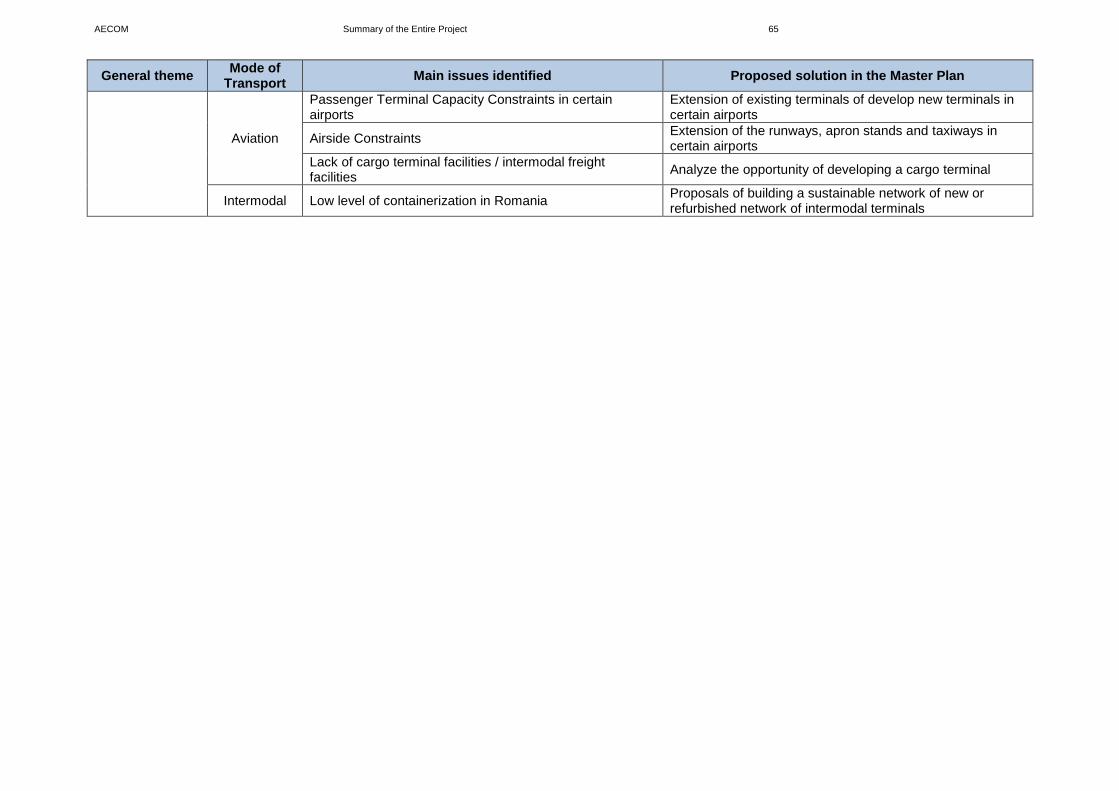
AECOM Summary of the Entire Project 65
General theme Mode of
Transport Main issues identified Proposed solution in the Master Plan
Aviation
Passenger Terminal Capacity Constraints in certain airports
Extension of existing terminals of develop new terminals in certain airports
Airside Constraints Extension of the runways, apron stands and taxiways in certain airports
Lack of cargo terminal facilities / intermodal freight facilities
Analyze the opportunity of developing a cargo terminal
Intermodal Low level of containerization in Romania Proposals of building a sustainable network of new or refurbished network of intermodal terminals
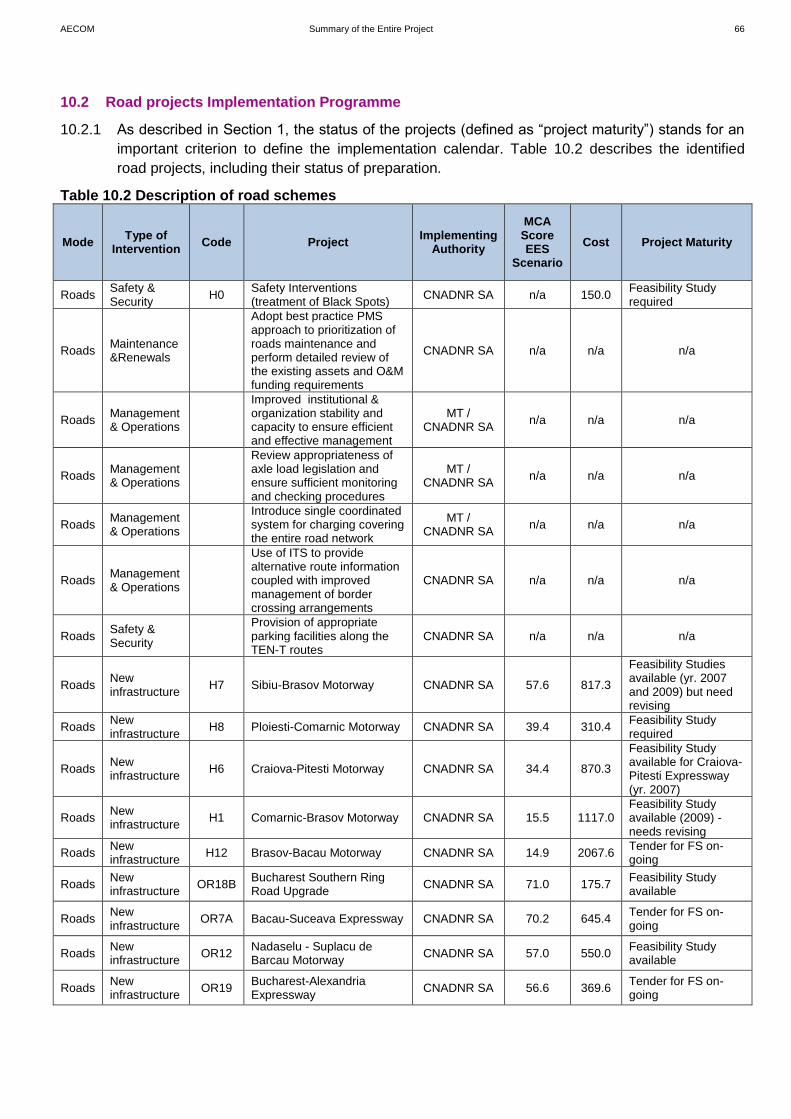
AECOM Summary of the Entire Project 66
10.2 Road projects Implementation Programme
10.2.1 As described in Section 1, the status of the projects (defined as “project maturity”) stands for an
important criterion to define the implementation calendar. Table 10.2 describes the identified
road projects, including their status of preparation.
Table 10.2 Description of road schemes
Mode Type of
Intervention Code Project
Implementing Authority
MCA Score EES
Scenario
Cost Project Maturity
Roads Safety & Security
H0 Safety Interventions (treatment of Black Spots)
CNADNR SA n/a 150.0 Feasibility Study required
Roads Maintenance &Renewals
Adopt best practice PMS approach to prioritization of roads maintenance and perform detailed review of the existing assets and O&M funding requirements
CNADNR SA n/a n/a n/a
Roads Management & Operations
Improved institutional & organization stability and capacity to ensure efficient and effective management
MT / CNADNR SA
n/a n/a n/a
Roads Management & Operations
Review appropriateness of axle load legislation and ensure sufficient monitoring and checking procedures
MT / CNADNR SA
n/a n/a n/a
Roads Management & Operations
Introduce single coordinated system for charging covering the entire road network
MT / CNADNR SA
n/a n/a n/a
Roads Management & Operations
Use of ITS to provide alternative route information coupled with improved management of border crossing arrangements
CNADNR SA n/a n/a n/a
Roads Safety & Security
Provision of appropriate parking facilities along the TEN-T routes
CNADNR SA n/a n/a n/a
Roads New infrastructure
H7 Sibiu-Brasov Motorway CNADNR SA 57.6 817.3
Feasibility Studies available (yr. 2007 and 2009) but need revising
Roads New infrastructure
H8 Ploiesti-Comarnic Motorway CNADNR SA 39.4 310.4 Feasibility Study required
Roads New infrastructure
H6 Craiova-Pitesti Motorway CNADNR SA 34.4 870.3
Feasibility Study available for Craiova-Pitesti Expressway (yr. 2007)
Roads New infrastructure
H1 Comarnic-Brasov Motorway CNADNR SA 15.5 1117.0 Feasibility Study available (2009) - needs revising
Roads New infrastructure
H12 Brasov-Bacau Motorway CNADNR SA 14.9 2067.6 Tender for FS on-going
Roads New infrastructure
OR18B Bucharest Southern Ring Road Upgrade
CNADNR SA 71.0 175.7 Feasibility Study available
Roads New infrastructure
OR7A Bacau-Suceava Expressway CNADNR SA 70.2 645.4 Tender for FS on-going
Roads New infrastructure
OR12 Nadaselu - Suplacu de Barcau Motorway
CNADNR SA 57.0 550.0 Feasibility Study available
Roads New infrastructure
OR19 Bucharest-Alexandria Expressway
CNADNR SA 56.6 369.6 Tender for FS on-going
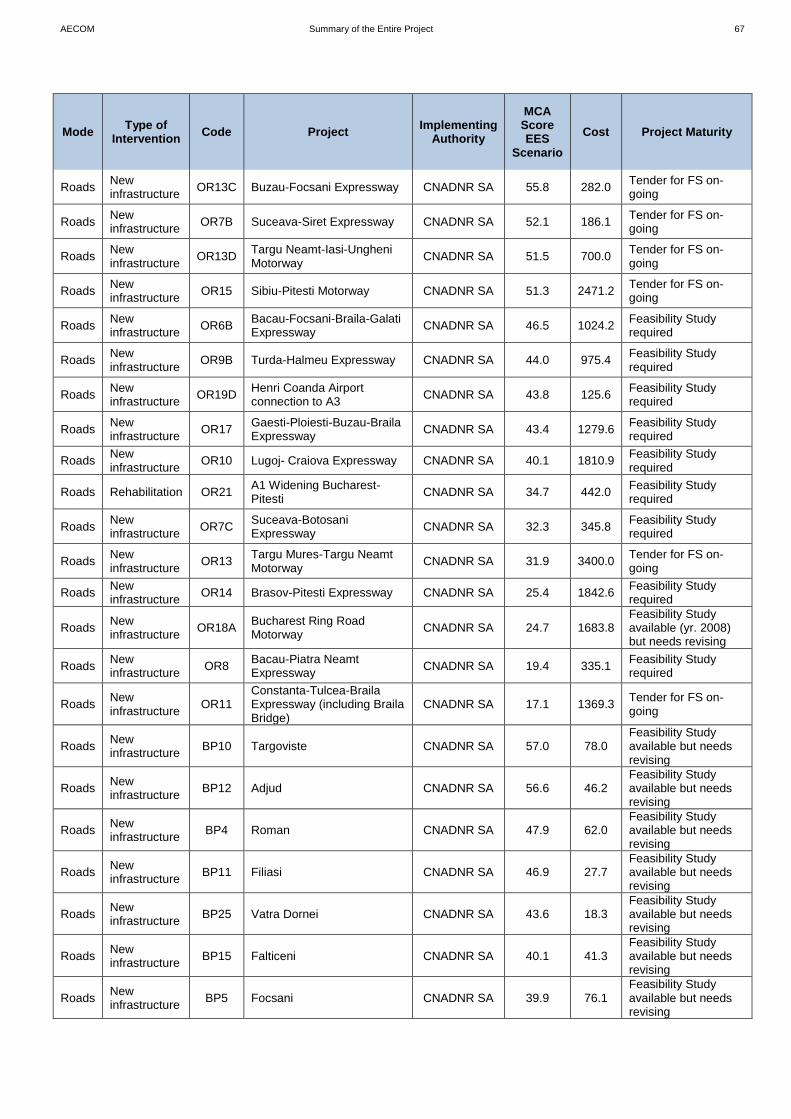
AECOM Summary of the Entire Project 67
Mode Type of
Intervention Code Project
Implementing Authority
MCA Score EES
Scenario
Cost Project Maturity
Roads New infrastructure
OR13C Buzau-Focsani Expressway CNADNR SA 55.8 282.0 Tender for FS on-going
Roads New infrastructure
OR7B Suceava-Siret Expressway CNADNR SA 52.1 186.1 Tender for FS on-going
Roads New infrastructure
OR13D Targu Neamt-Iasi-Ungheni Motorway
CNADNR SA 51.5 700.0 Tender for FS on-going
Roads New infrastructure
OR15 Sibiu-Pitesti Motorway CNADNR SA 51.3 2471.2 Tender for FS on-going
Roads New infrastructure
OR6B Bacau-Focsani-Braila-Galati Expressway
CNADNR SA 46.5 1024.2 Feasibility Study required
Roads New infrastructure
OR9B Turda-Halmeu Expressway CNADNR SA 44.0 975.4 Feasibility Study required
Roads New infrastructure
OR19D Henri Coanda Airport connection to A3
CNADNR SA 43.8 125.6 Feasibility Study required
Roads New infrastructure
OR17 Gaesti-Ploiesti-Buzau-Braila Expressway
CNADNR SA 43.4 1279.6 Feasibility Study required
Roads New infrastructure
OR10 Lugoj- Craiova Expressway CNADNR SA 40.1 1810.9 Feasibility Study required
Roads Rehabilitation OR21 A1 Widening Bucharest-Pitesti
CNADNR SA 34.7 442.0 Feasibility Study required
Roads New infrastructure
OR7C Suceava-Botosani Expressway
CNADNR SA 32.3 345.8 Feasibility Study required
Roads New infrastructure
OR13 Targu Mures-Targu Neamt Motorway
CNADNR SA 31.9 3400.0 Tender for FS on-going
Roads New infrastructure
OR14 Brasov-Pitesti Expressway CNADNR SA 25.4 1842.6 Feasibility Study required
Roads New infrastructure
OR18A Bucharest Ring Road Motorway
CNADNR SA 24.7 1683.8 Feasibility Study available (yr. 2008) but needs revising
Roads New infrastructure
OR8 Bacau-Piatra Neamt Expressway
CNADNR SA 19.4 335.1 Feasibility Study required
Roads New infrastructure
OR11 Constanta-Tulcea-Braila Expressway (including Braila Bridge)
CNADNR SA 17.1 1369.3 Tender for FS on-going
Roads New infrastructure
BP10 Targoviste CNADNR SA 57.0 78.0 Feasibility Study available but needs revising
Roads New infrastructure
BP12 Adjud CNADNR SA 56.6 46.2 Feasibility Study available but needs revising
Roads New infrastructure
BP4 Roman CNADNR SA 47.9 62.0 Feasibility Study available but needs revising
Roads New infrastructure
BP11 Filiasi CNADNR SA 46.9 27.7 Feasibility Study available but needs revising
Roads New infrastructure
BP25 Vatra Dornei CNADNR SA 43.6 18.3 Feasibility Study available but needs revising
Roads New infrastructure
BP15 Falticeni CNADNR SA 40.1 41.3 Feasibility Study available but needs revising
Roads New infrastructure
BP5 Focsani CNADNR SA 39.9 76.1 Feasibility Study available but needs revising
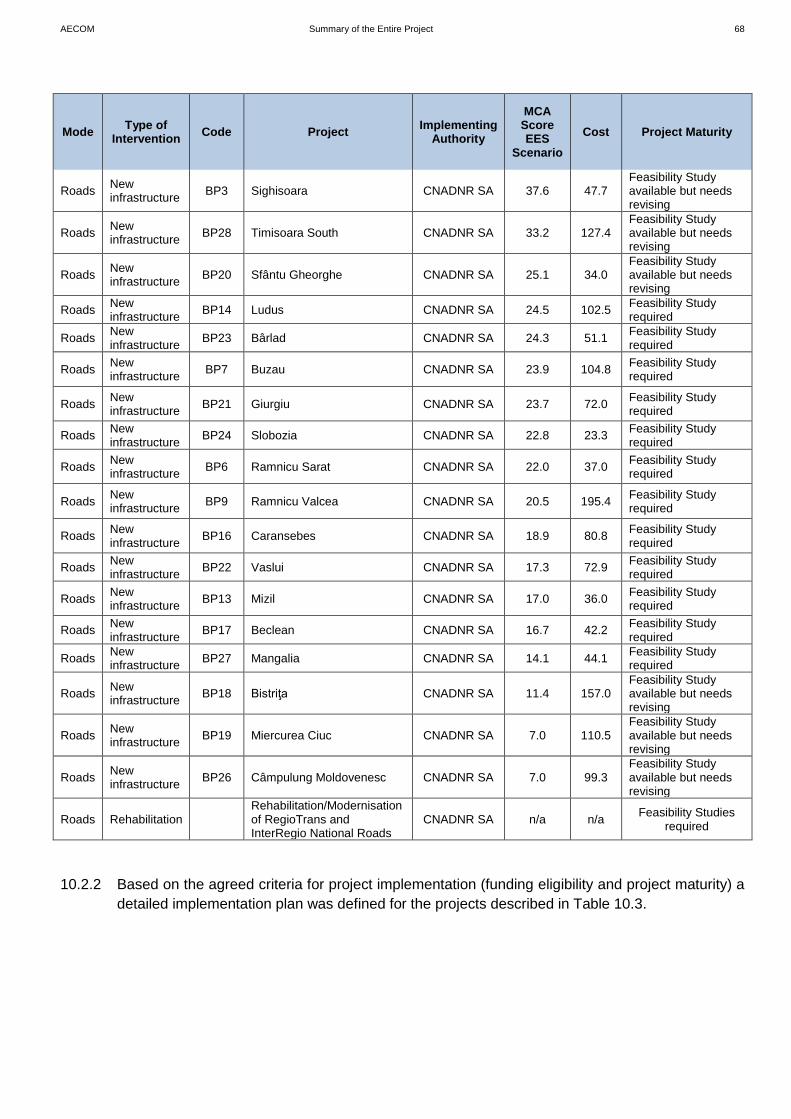
AECOM Summary of the Entire Project 68
Mode Type of
Intervention Code Project
Implementing Authority
MCA Score EES
Scenario
Cost Project Maturity
Roads New infrastructure
BP3 Sighisoara CNADNR SA 37.6 47.7 Feasibility Study available but needs revising
Roads New infrastructure
BP28 Timisoara South CNADNR SA 33.2 127.4 Feasibility Study available but needs revising
Roads New infrastructure
BP20 Sfântu Gheorghe CNADNR SA 25.1 34.0 Feasibility Study available but needs revising
Roads New infrastructure
BP14 Ludus CNADNR SA 24.5 102.5 Feasibility Study required
Roads New infrastructure
BP23 Bârlad CNADNR SA 24.3 51.1 Feasibility Study required
Roads New infrastructure
BP7 Buzau CNADNR SA 23.9 104.8 Feasibility Study required
Roads New infrastructure
BP21 Giurgiu CNADNR SA 23.7 72.0 Feasibility Study required
Roads New infrastructure
BP24 Slobozia CNADNR SA 22.8 23.3 Feasibility Study required
Roads New infrastructure
BP6 Ramnicu Sarat CNADNR SA 22.0 37.0 Feasibility Study required
Roads New infrastructure
BP9 Ramnicu Valcea CNADNR SA 20.5 195.4 Feasibility Study required
Roads New infrastructure
BP16 Caransebes CNADNR SA 18.9 80.8 Feasibility Study required
Roads New infrastructure
BP22 Vaslui CNADNR SA 17.3 72.9 Feasibility Study required
Roads New infrastructure
BP13 Mizil CNADNR SA 17.0 36.0 Feasibility Study required
Roads New infrastructure
BP17 Beclean CNADNR SA 16.7 42.2 Feasibility Study required
Roads New infrastructure
BP27 Mangalia CNADNR SA 14.1 44.1 Feasibility Study required
Roads New infrastructure
BP18 Bistriţa CNADNR SA 11.4 157.0 Feasibility Study available but needs revising
Roads New infrastructure
BP19 Miercurea Ciuc CNADNR SA 7.0 110.5 Feasibility Study available but needs revising
Roads New infrastructure
BP26 Câmpulung Moldovenesc CNADNR SA 7.0 99.3 Feasibility Study available but needs revising
Roads Rehabilitation Rehabilitation/Modernisation of RegioTrans and InterRegio National Roads
CNADNR SA n/a n/a Feasibility Studies
required
10.2.2 Based on the agreed criteria for project implementation (funding eligibility and project maturity) a
detailed implementation plan was defined for the projects described in Table 10.3.
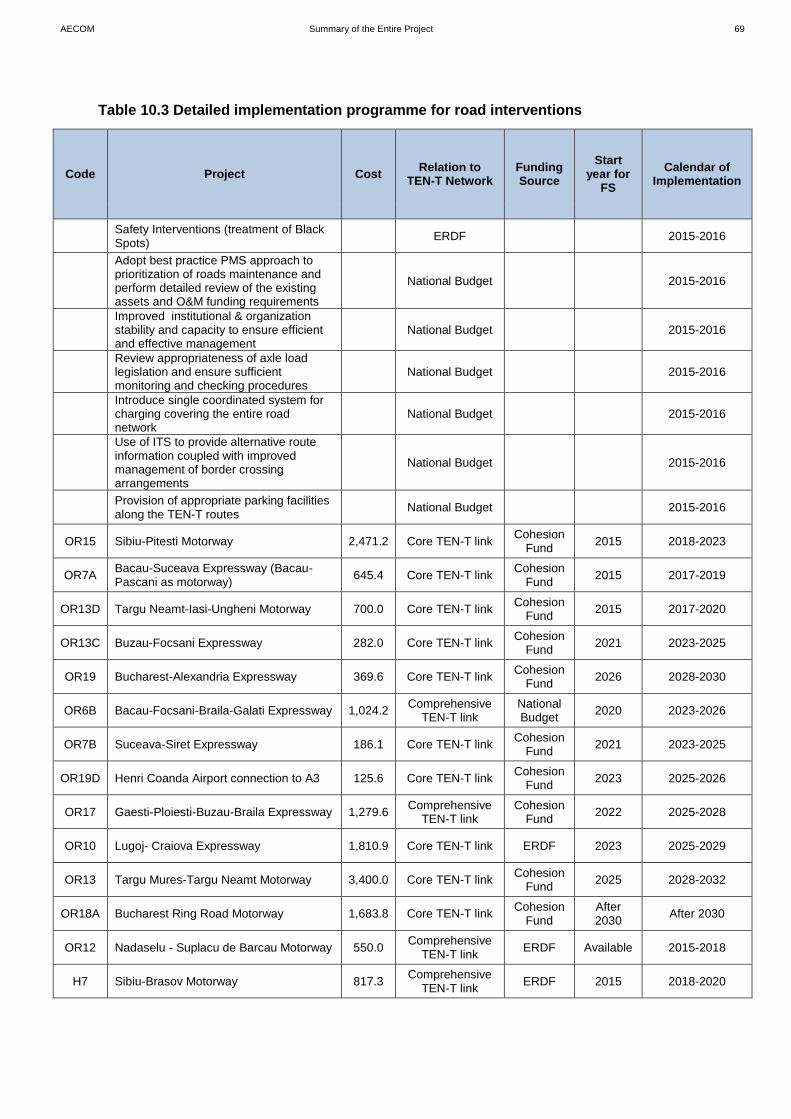
AECOM Summary of the Entire Project 69
Table 10.3 Detailed implementation programme for road interventions
Code Project Cost Relation to
TEN-T Network Funding Source
Start year for
FS
Calendar of Implementation
Safety Interventions (treatment of Black Spots)
ERDF 2015-2016
Adopt best practice PMS approach to prioritization of roads maintenance and perform detailed review of the existing assets and O&M funding requirements
National Budget 2015-2016
Improved institutional & organization stability and capacity to ensure efficient and effective management
National Budget 2015-2016
Review appropriateness of axle load legislation and ensure sufficient monitoring and checking procedures
National Budget 2015-2016
Introduce single coordinated system for charging covering the entire road network
National Budget 2015-2016
Use of ITS to provide alternative route information coupled with improved management of border crossing arrangements
National Budget 2015-2016
Provision of appropriate parking facilities along the TEN-T routes
National Budget 2015-2016
OR15 Sibiu-Pitesti Motorway 2,471.2 Core TEN-T link Cohesion
Fund 2015 2018-2023
OR7A Bacau-Suceava Expressway (Bacau-Pascani as motorway)
645.4 Core TEN-T link Cohesion
Fund 2015 2017-2019
OR13D Targu Neamt-Iasi-Ungheni Motorway 700.0 Core TEN-T link Cohesion
Fund 2015 2017-2020
OR13C Buzau-Focsani Expressway 282.0 Core TEN-T link Cohesion
Fund 2021 2023-2025
OR19 Bucharest-Alexandria Expressway 369.6 Core TEN-T link Cohesion
Fund 2026 2028-2030
OR6B Bacau-Focsani-Braila-Galati Expressway 1,024.2 Comprehensive
TEN-T link National Budget
2020 2023-2026
OR7B Suceava-Siret Expressway 186.1 Core TEN-T link Cohesion
Fund 2021 2023-2025
OR19D Henri Coanda Airport connection to A3 125.6 Core TEN-T link Cohesion
Fund 2023 2025-2026
OR17 Gaesti-Ploiesti-Buzau-Braila Expressway 1,279.6 Comprehensive
TEN-T link Cohesion
Fund 2022 2025-2028
OR10 Lugoj- Craiova Expressway 1,810.9 Core TEN-T link ERDF 2023 2025-2029
OR13 Targu Mures-Targu Neamt Motorway 3,400.0 Core TEN-T link Cohesion
Fund 2025 2028-2032
OR18A Bucharest Ring Road Motorway 1,683.8 Core TEN-T link Cohesion
Fund After 2030
After 2030
OR12 Nadaselu - Suplacu de Barcau Motorway 550.0 Comprehensive
TEN-T link ERDF Available 2015-2018
H7 Sibiu-Brasov Motorway 817.3 Comprehensive
TEN-T link ERDF 2015 2018-2020
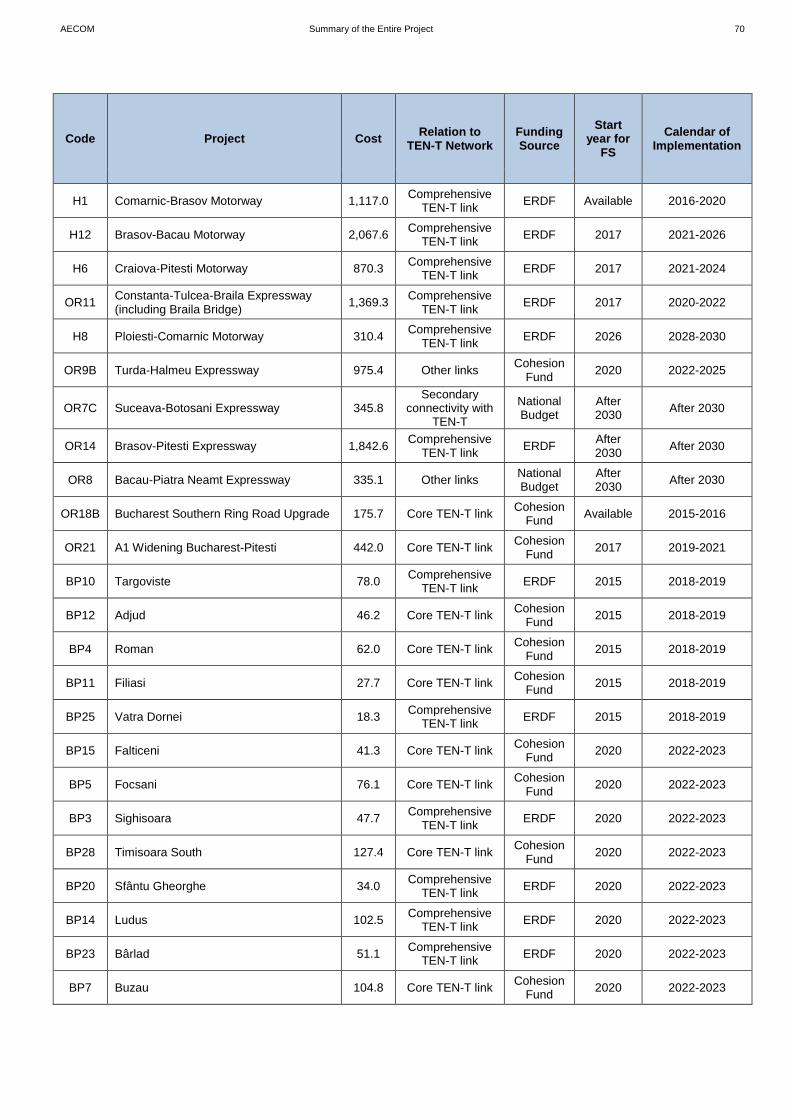
AECOM Summary of the Entire Project 70
Code Project Cost Relation to
TEN-T Network Funding Source
Start year for
FS
Calendar of Implementation
H1 Comarnic-Brasov Motorway 1,117.0 Comprehensive
TEN-T link ERDF Available 2016-2020
H12 Brasov-Bacau Motorway 2,067.6 Comprehensive
TEN-T link ERDF 2017 2021-2026
H6 Craiova-Pitesti Motorway 870.3 Comprehensive
TEN-T link ERDF 2017 2021-2024
OR11 Constanta-Tulcea-Braila Expressway (including Braila Bridge)
1,369.3 Comprehensive
TEN-T link ERDF 2017 2020-2022
H8 Ploiesti-Comarnic Motorway 310.4 Comprehensive
TEN-T link ERDF 2026 2028-2030
OR9B Turda-Halmeu Expressway 975.4 Other links Cohesion
Fund 2020 2022-2025
OR7C Suceava-Botosani Expressway 345.8 Secondary
connectivity with TEN-T
National Budget
After 2030
After 2030
OR14 Brasov-Pitesti Expressway 1,842.6 Comprehensive
TEN-T link ERDF
After 2030
After 2030
OR8 Bacau-Piatra Neamt Expressway 335.1 Other links National Budget
After 2030
After 2030
OR18B Bucharest Southern Ring Road Upgrade 175.7 Core TEN-T link Cohesion
Fund Available 2015-2016
OR21 A1 Widening Bucharest-Pitesti 442.0 Core TEN-T link Cohesion
Fund 2017 2019-2021
BP10 Targoviste 78.0 Comprehensive
TEN-T link ERDF 2015 2018-2019
BP12 Adjud 46.2 Core TEN-T link Cohesion
Fund 2015 2018-2019
BP4 Roman 62.0 Core TEN-T link Cohesion
Fund 2015 2018-2019
BP11 Filiasi 27.7 Core TEN-T link Cohesion
Fund 2015 2018-2019
BP25 Vatra Dornei 18.3 Comprehensive
TEN-T link ERDF 2015 2018-2019
BP15 Falticeni 41.3 Core TEN-T link Cohesion
Fund 2020 2022-2023
BP5 Focsani 76.1 Core TEN-T link Cohesion
Fund 2020 2022-2023
BP3 Sighisoara 47.7 Comprehensive
TEN-T link ERDF 2020 2022-2023
BP28 Timisoara South 127.4 Core TEN-T link Cohesion
Fund 2020 2022-2023
BP20 Sfântu Gheorghe 34.0 Comprehensive
TEN-T link ERDF 2020 2022-2023
BP14 Ludus 102.5 Comprehensive
TEN-T link ERDF 2020 2022-2023
BP23 Bârlad 51.1 Comprehensive
TEN-T link ERDF 2020 2022-2023
BP7 Buzau 104.8 Core TEN-T link Cohesion
Fund 2020 2022-2023

AECOM Summary of the Entire Project 71
Code Project Cost Relation to
TEN-T Network Funding Source
Start year for
FS
Calendar of Implementation
BP21 Giurgiu 72.0 Core TEN-T link Cohesion
Fund 2020 2022-2023
BP24 Slobozia 23.3 Comprehensive
TEN-T link ERDF 2020 2022-2023
BP6 Ramnicu Sarat 37.0 Core TEN-T link Cohesion
Fund 2020 2022-2023
BP9 Ramnicu Valcea 195.4 Core TEN-T link Cohesion
Fund 2020 2022-2023
BP16 Caransebes 80.8 Core TEN-T link Cohesion
Fund 2030 After 2030
BP22 Vaslui 72.9 Comprehensive
TEN-T link ERDF 2030 After 2030
BP13 Mizil 36.0 Core TEN-T link Cohesion
Fund 2030 After 2030
BP17 Beclean 42.2 Comprehensive
TEN-T link ERDF 2030 After 2030
BP27 Mangalia 44.1 Comprehensive
TEN-T link ERDF 2030 After 2030
BP18 Bistriţa 157.0 Comprehensive
TEN-T link ERDF 2030 After 2030
BP19 Miercurea Ciuc 110.5 Comprehensive
TEN-T link ERDF 2030 After 2030
BP26 Câmpulung Moldovenesc 99.3 Comprehensive
TEN-T link ERDF 2030 After 2030
Rehabilitation/Modernisation of RegioTrans and InterRegio National Roads
Core /
Comprehensive TEN-T link
CF/ERDF 2014-2030
10.2.3 The source of funding for road projects is summarised in Table 10.4 below.
Table 10.4 Sources of Funding for Road Projects (m eur, 2014 prices)
Funding Source
Period Investment
Cohesion Fund
2014-2020 3,310.8
2021-2030 8,531.8
ERDF 2014-2020 3,036.9
2021-2030 6,230.7
National Budget
2014-2020
2021-2030 1,024.2
Private Funds
2014-2020
2021-2030
Total 2014-2020 6,347.7
Total 2021-2030 15,786.7

AECOM Summary of the Entire Project 72
Figure 10.1 Road Interventions in the Master Plan

AECOM Summary of the Entire Project 73
10.3 Rail Projects Implementation Programme
10.3.1 The rail projects in the master Plan, and their current status, sre set out in Table 10.5 below.
Table 10.5 Description and current status of rail interventions
Type of Intervention
Code Project Implementing
Authority
MCA Score EES
Scenario Cost
Project Maturity
Maintenance Focus the scarce maintenance and development resources on a reduced sustainable network.
MT / CFR SA n/a n/a Feasibility Study required
Management & Operations
A comprehensive reform package to be implemented as soon as possible
MT / CFR SA n/a n/a Feasibility Study required
Management & Operations
Define clear level of service requirements (limited to the primary network), increase frequency on the competitive corridors, introduce regular-interval service timetable and purchase of new rolling stock
MT / CFR SA n/a n/a Feasibility Study required
Management & Operations
The relations between the public transport authority, CFR Infrastructure and the operators to be restructured
MT / CFR SA n/a n/a n/a
Management & Operations
Re-launch private management techniques with a proper selection process of an efficient business management profile
MT / CFR SA n/a n/a n/a
Maintenance &Renewals
DS10R Emergency interventions for section Bucharest to Giurgiu via Gradistea
CNCF CFR SA 80.0 0.0 Feasibility Study required
Rehabilitation DS02A Bucharest to Constanta. New rolling stock and re-timetabling
CNCF CFR SA 73.9 28.8 Feasibility Study required
Maintenance &Renewals
DS11R Emergency interventions for section Craiova to Calafat
CNCF CFR SA 50.5 1.5 Feasibility Study required
Maintenance &Renewals
DS03R Emergency interventions for section Bucharest to Arad via Craiova and Timisoara
CNCF CFR SA 49.2 73.2 Feasibility Study required
Maintenance &Renewals
DS04R Emergency interventions for section Bucharest to Iasi via Bacau + Buzau to Galati + Pascani to Ukraine
CNCF CFR SA 45.4 90.7 Feasibility Study required
Maintenance &Renewals
DS06R Emergency interventions for section Cluj-Napoca to Iasi
CNCF CFR SA 45.2 52.5 Feasibility Study required
Rehabilitation DS10A Bucharest to Giurgiu via Gradistea. Rehabilitation to design speed.
CNCF CFR SA 35.0 132.1 Feasibility Study required
Rehabilitation DS03S Freight test Filiasi - Tg Jiu CNCF CFR SA 33.3 6.1 Feasibility Study required
Rehabilitation DS01R Emergency interventions for section Bucharest to Hungary via Brasov + Teius to Cluj
CNCF CFR SA 30.0 67.7 Feasibility Study required
Rehabilitation DS04A Bucharest to Iasi via Bacau + Buzau to Galati + Pascani to Ukraine. Rehabilitation to design speed.
CNCF CFR SA 25.3 3093.2 Feasibility Study required
Rehabilitation DS01A Bucharest to Hungary via Brasov + Teius to Cluj. Rehabilitation to design speed.
CNCF CFR SA 24.5 2784.9 Feasibility Study available
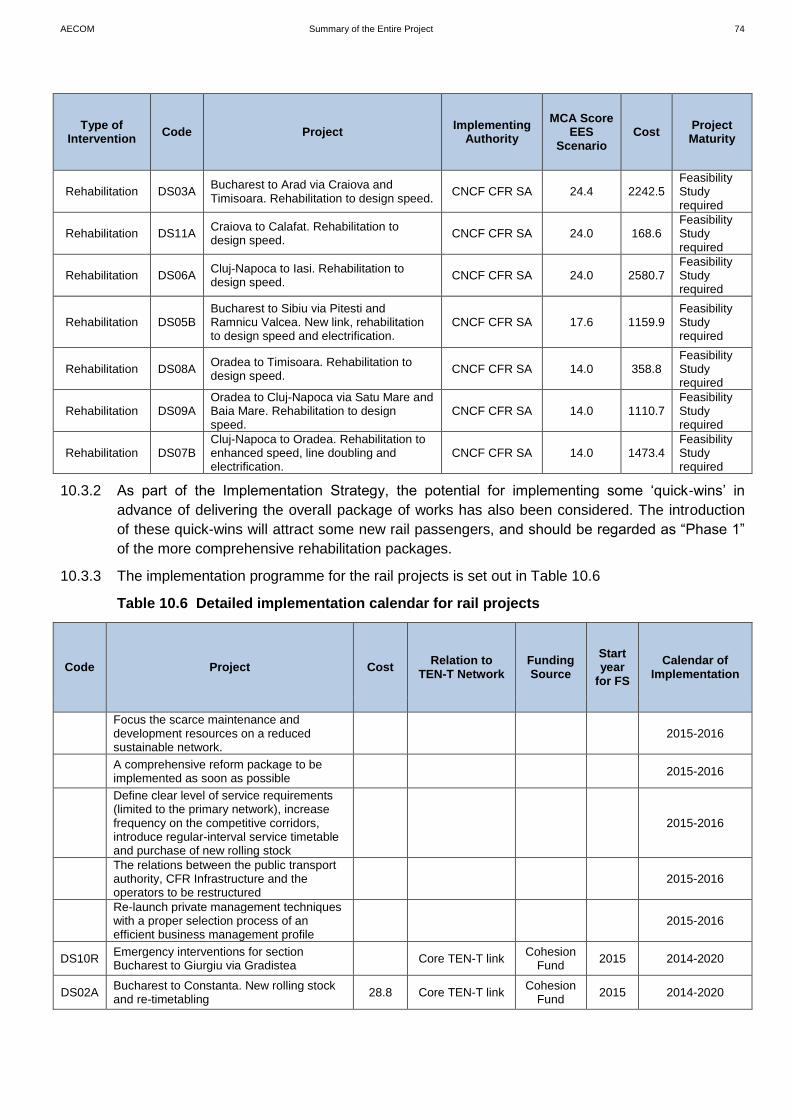
AECOM Summary of the Entire Project 74
Type of Intervention
Code Project Implementing
Authority
MCA Score EES
Scenario Cost
Project Maturity
Rehabilitation DS03A Bucharest to Arad via Craiova and Timisoara. Rehabilitation to design speed.
CNCF CFR SA 24.4 2242.5 Feasibility Study required
Rehabilitation DS11A Craiova to Calafat. Rehabilitation to design speed.
CNCF CFR SA 24.0 168.6 Feasibility Study required
Rehabilitation DS06A Cluj-Napoca to Iasi. Rehabilitation to design speed.
CNCF CFR SA 24.0 2580.7 Feasibility Study required
Rehabilitation DS05B Bucharest to Sibiu via Pitesti and Ramnicu Valcea. New link, rehabilitation to design speed and electrification.
CNCF CFR SA 17.6 1159.9 Feasibility Study required
Rehabilitation DS08A Oradea to Timisoara. Rehabilitation to design speed.
CNCF CFR SA 14.0 358.8 Feasibility Study required
Rehabilitation DS09A Oradea to Cluj-Napoca via Satu Mare and Baia Mare. Rehabilitation to design speed.
CNCF CFR SA 14.0 1110.7 Feasibility Study required
Rehabilitation DS07B Cluj-Napoca to Oradea. Rehabilitation to enhanced speed, line doubling and electrification.
CNCF CFR SA 14.0 1473.4 Feasibility Study required
10.3.2 As part of the Implementation Strategy, the potential for implementing some ‘quick-wins’ in
advance of delivering the overall package of works has also been considered. The introduction
of these quick-wins will attract some new rail passengers, and should be regarded as “Phase 1”
of the more comprehensive rehabilitation packages.
10.3.3 The implementation programme for the rail projects is set out in Table 10.6
Table 10.6 Detailed implementation calendar for rail projects
Code Project Cost Relation to
TEN-T Network Funding Source
Start year
for FS
Calendar of Implementation
Focus the scarce maintenance and development resources on a reduced sustainable network.
2015-2016
A comprehensive reform package to be implemented as soon as possible
2015-2016
Define clear level of service requirements (limited to the primary network), increase frequency on the competitive corridors, introduce regular-interval service timetable and purchase of new rolling stock
2015-2016
The relations between the public transport authority, CFR Infrastructure and the operators to be restructured
2015-2016
Re-launch private management techniques with a proper selection process of an efficient business management profile
2015-2016
DS10R Emergency interventions for section Bucharest to Giurgiu via Gradistea
Core TEN-T link Cohesion
Fund 2015 2014-2020
DS02A Bucharest to Constanta. New rolling stock and re-timetabling
28.8 Core TEN-T link Cohesion
Fund 2015 2014-2020

AECOM Summary of the Entire Project 75
Code Project Cost Relation to
TEN-T Network Funding Source
Start year
for FS
Calendar of Implementation
DS11R Emergency interventions for section Craiova to Calafat
1.5 Core TEN-T link Cohesion
Fund 2015 2014-2020
DS03R Emergency interventions for section Bucharest to Arad via Craiova and Timisoara
73.2 Core TEN-T link Cohesion
Fund 2015 2014-2020
DS04R Emergency interventions for section Bucharest to Iasi via Bacau + Buzau to Galati + Pascani to Ukraine
90.7 Core TEN-T link Cohesion
Fund 2015 2014-2020
DS06R Emergency interventions for section Cluj-Napoca to Iasi
52.5 Core TEN-T link Cohesion
Fund 2015 2014-2020
DS10A Bucharest to Giurgiu via Gradistea. Rehabilitation to design speed.
132.1 Core TEN-T link Cohesion
Fund 2015 2014-2020
DS03S Freight test Filiasi - Tg Jiu 6.1 Comprehensive
TEN-T link ERDF 2015 2014-2020
DS01R Emergency interventions for section Bucharest to Hungary via Brasov + Teius to Cluj
67.7 Core TEN-T link Cohesion
Fund 2015 2014-2020
DS01A Bucharest to Hungary via Brasov + Teius to Cluj. Rehabilitation to design speed.
2,784.9 Core TEN-T link Cohesion
Fund 2015 2014-2020
DS04A Bucharest to Iasi via Bacau + Buzau to Galati + Pascani to Ukraine. Rehabilitation to design speed.
3,093.2 Core TEN-T link Cohesion
Fund 2018 2021-2030
DS03A Bucharest to Arad via Craiova and Timisoara. Rehabilitation to design speed.
2,242.5 Core TEN-T link Cohesion
Fund 2018 2021-2030
DS11A Craiova to Calafat. Rehabilitation to design speed.
168.6 Core TEN-T link Cohesion
Fund 2018 2021-2030
DS06A Cluj-Napoca to Iasi. Rehabilitation to design speed.
2,580.7 Core TEN-T link Cohesion
Fund 2020 2021-2030
DS05B Bucharest to Sibiu via Pitesti and Ramnicu Valcea. New link, rehabilitation to design speed and electrification.
1,159.9 Comprehensive
TEN-T link ERDF 2020 2021-2030
DS08A Oradea to Timisoara. Rehabilitation to design speed.
358.8 Comprehensive
TEN-T link ERDF 2020 2021-2030
DS09A Oradea to Cluj-Napoca via Satu Mare and Baia Mare. Rehabilitation to design speed.
1,110.7 Comprehensive
TEN-T link ERDF 2020 2021-2030
DS07B Cluj-Napoca to Oradea. Rehabilitation to enhanced speed, line doubling and electrification.
1,473.4 Comprehensive
TEN-T link ERDF 2020 2021-2030
10.3.4 The rail proposals are shown on Figures 10.2 and 10.3
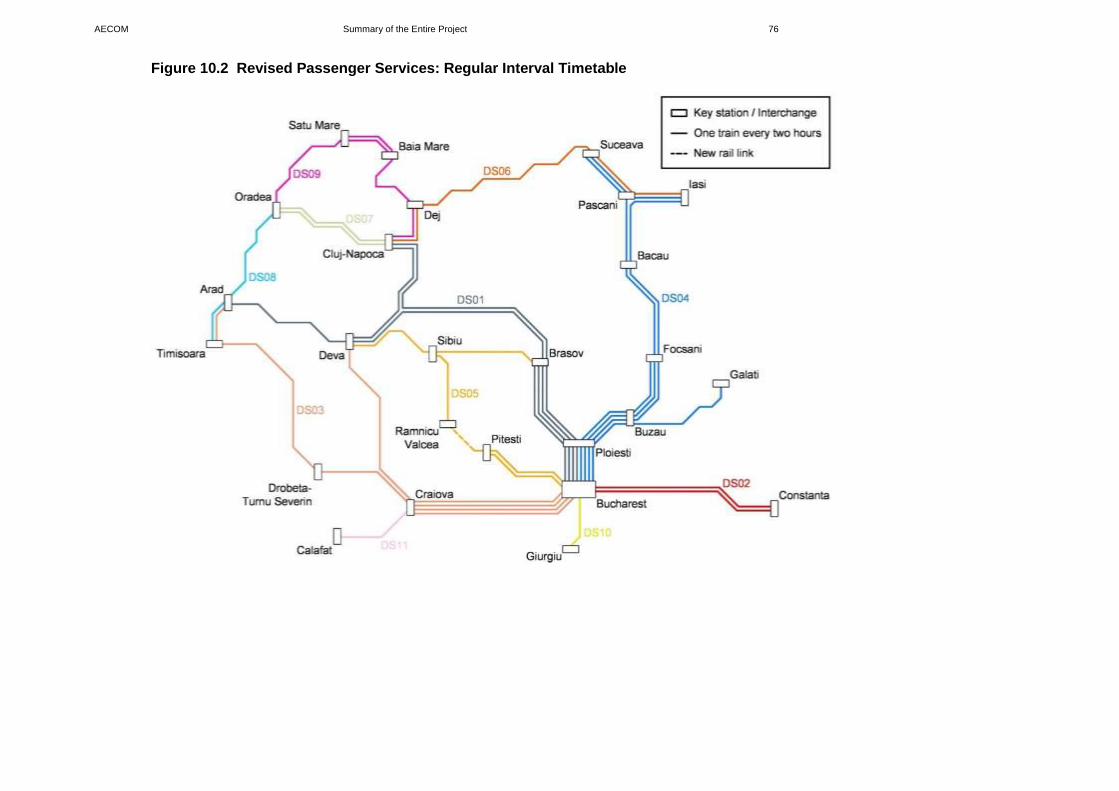
AECOM Summary of the Entire Project 76
Figure 10.2 Revised Passenger Services: Regular Interval Timetable
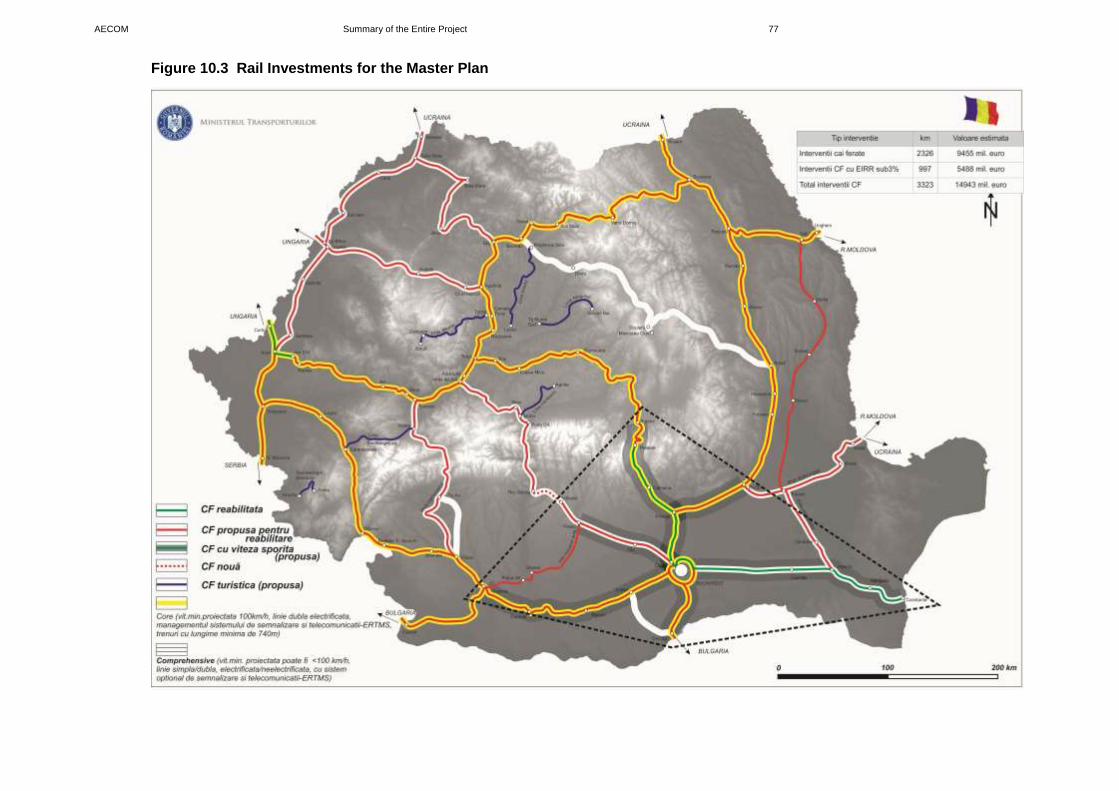
AECOM Summary of the Entire Project 77
Figure 10.3 Rail Investments for the Master Plan

AECOM Summary of the Entire Project 78
10.4 Ports and Waterways Implementation Programme
10.4.1 Table 10.7 Sets out the current status of the recommended projects for Ports and Waterways.
Table 10.7 Current Status of Master Plan Ports and Waterways Projects in the Master Plan
Type of Intervention
Code Project Implementing
Authority
MCA Score EES
Scenario
Cost Project Maturity
Maintenance W3 Invest in ice breaking facilities including replacing Perseus
MT / Port Authorities
n/a n/a n/a
Management & Operations
W4
Increase maintenance budgets to match consistently across borders and implementing Danube maintenance
MT / Port Authorities
n/a n/a n/a
Management & Operations
W5
Authorities to be flexible in
opening times/days so that
facilities such as customs,
booking offices and terminals
are available if demand exists.
MT / Port Authorities
n/a n/a n/a
Management & Operations
W6
Adopt a commercial attitude
and review port charges to
operators to ensure water
freight is competitive
MT / Port Authorities
n/a n/a n/a
Maintenance W7
Romania to work with Danube
countries to agree operational
plans
MT / Port Authorities
n/a n/a n/a
Maintenance W8
Review port and customs
administration procedures and
rationalise and improve
communication
MT / Port Authorities
n/a n/a n/a
Management & Operations
W9 Establish suitable training for
the needs of the naval sector MT / Port
Authorities n/a n/a n/a
Management & Operations
W10
Industry to use modern and
integrated systems for customs,
navigation, regulation and
administration
MT / Port Authorities
n/a n/a n/a
Management & Operations
W11 Develop a safety plan including
training to reduce accidents MT / Port
Authorities n/a n/a n/a
Management & Operations
W12
Enhance security to reduce
thefts from vessels and port
facilities at Ports on the Primary
Economic Network
MT / Port Authorities
n/a n/a n/a
Management & Operations
W13
Reduce emissions from naval
activity by adopting best
practice: enforce EU
regulations regarding emissions
by non-EU vessels
MT / Port Authorities
n/a n/a n/a
Safety & Security
W14 Safeguard land and facilities at
minor and underutilised ports MT / Port
Authorities n/a n/a n/a
Safety & Security
W15 Improve immediate local and
internal road/rail connections MT / Port
Authorities n/a n/a n/a
Management & Operations
W16
Transfer rail infrastructure
ownership within ports to port
authorities
CFR SA n/a n/a n/a
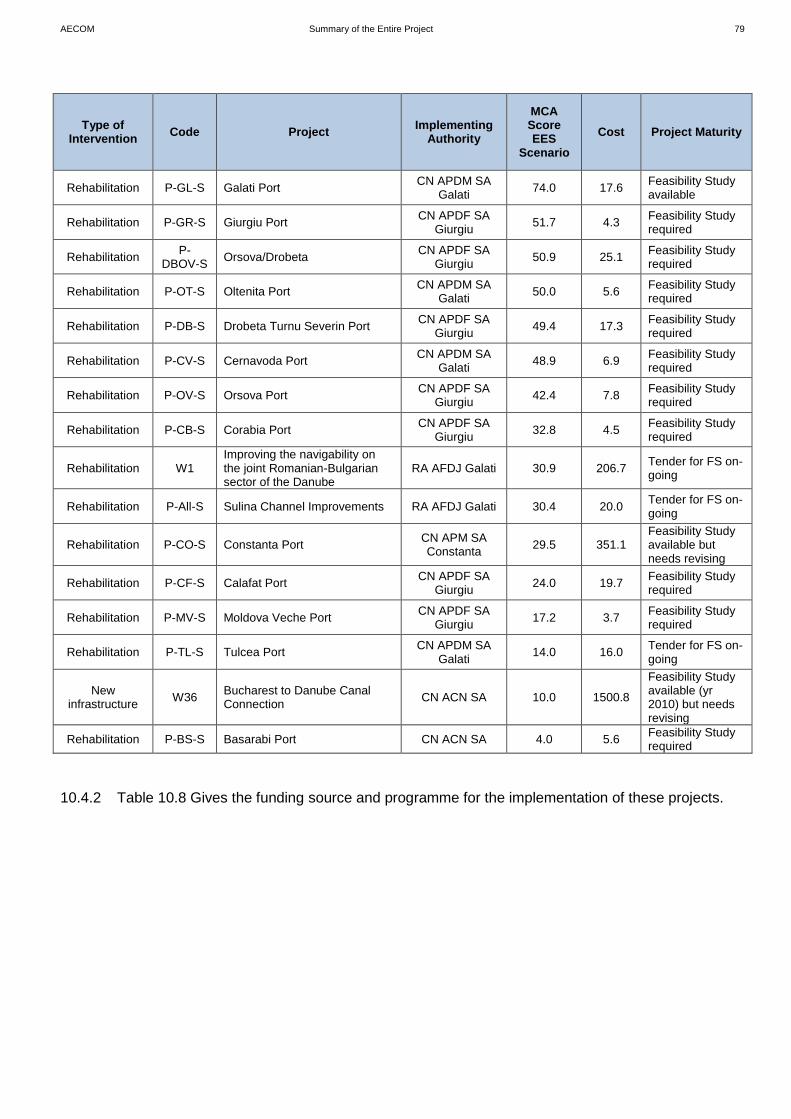
AECOM Summary of the Entire Project 79
Type of Intervention
Code Project Implementing
Authority
MCA Score EES
Scenario
Cost Project Maturity
Rehabilitation P-GL-S Galati Port CN APDM SA
Galati 74.0 17.6
Feasibility Study available
Rehabilitation P-GR-S Giurgiu Port CN APDF SA
Giurgiu 51.7 4.3
Feasibility Study required
Rehabilitation P-
DBOV-S Orsova/Drobeta
CN APDF SA Giurgiu
50.9 25.1 Feasibility Study required
Rehabilitation P-OT-S Oltenita Port CN APDM SA
Galati 50.0 5.6
Feasibility Study required
Rehabilitation P-DB-S Drobeta Turnu Severin Port CN APDF SA
Giurgiu 49.4 17.3
Feasibility Study required
Rehabilitation P-CV-S Cernavoda Port CN APDM SA
Galati 48.9 6.9
Feasibility Study required
Rehabilitation P-OV-S Orsova Port CN APDF SA
Giurgiu 42.4 7.8
Feasibility Study required
Rehabilitation P-CB-S Corabia Port CN APDF SA
Giurgiu 32.8 4.5
Feasibility Study required
Rehabilitation W1 Improving the navigability on the joint Romanian-Bulgarian sector of the Danube
RA AFDJ Galati 30.9 206.7 Tender for FS on-going
Rehabilitation P-All-S Sulina Channel Improvements RA AFDJ Galati 30.4 20.0 Tender for FS on-going
Rehabilitation P-CO-S Constanta Port CN APM SA Constanta
29.5 351.1 Feasibility Study available but needs revising
Rehabilitation P-CF-S Calafat Port CN APDF SA
Giurgiu 24.0 19.7
Feasibility Study required
Rehabilitation P-MV-S Moldova Veche Port CN APDF SA
Giurgiu 17.2 3.7
Feasibility Study required
Rehabilitation P-TL-S Tulcea Port CN APDM SA
Galati 14.0 16.0
Tender for FS on-going
New infrastructure
W36 Bucharest to Danube Canal Connection
CN ACN SA 10.0 1500.8
Feasibility Study available (yr 2010) but needs revising
Rehabilitation P-BS-S Basarabi Port CN ACN SA 4.0 5.6 Feasibility Study required
10.4.2 Table 10.8 Gives the funding source and programme for the implementation of these projects.
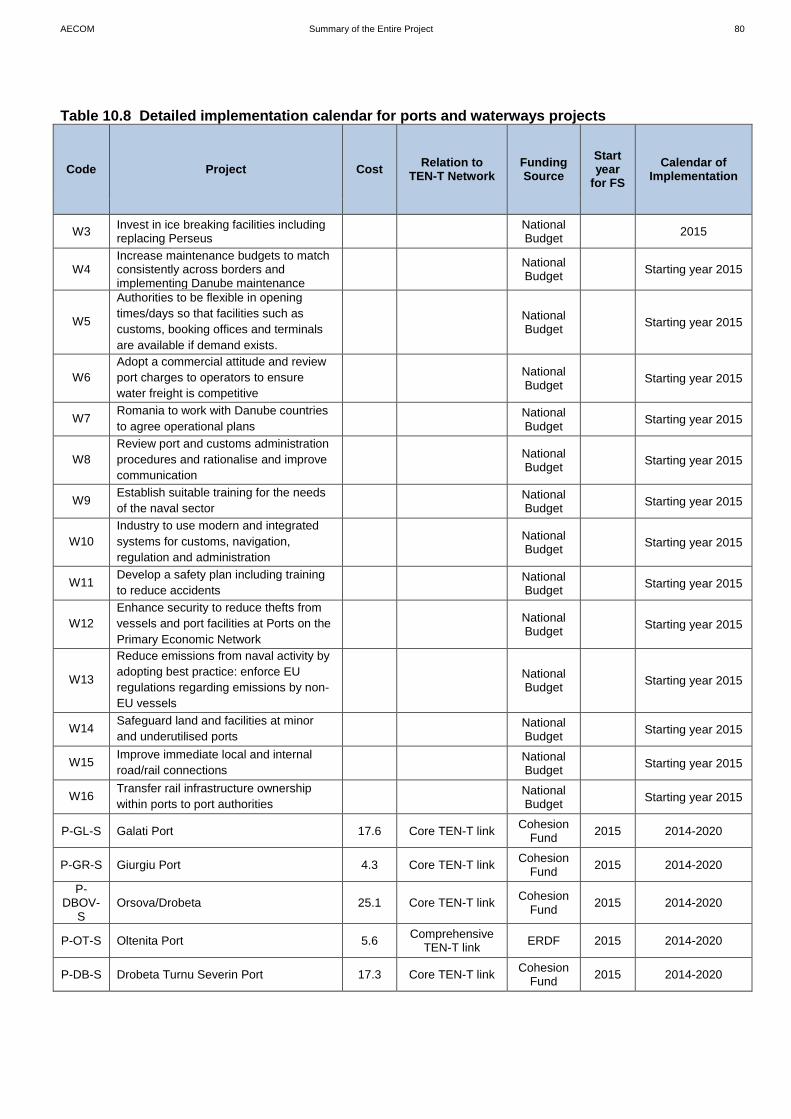
AECOM Summary of the Entire Project 80
Table 10.8 Detailed implementation calendar for ports and waterways projects
Code Project Cost Relation to
TEN-T Network Funding Source
Start year
for FS
Calendar of Implementation
W3 Invest in ice breaking facilities including replacing Perseus
National Budget
2015
W4 Increase maintenance budgets to match consistently across borders and implementing Danube maintenance
National Budget
Starting year 2015
W5
Authorities to be flexible in opening
times/days so that facilities such as
customs, booking offices and terminals
are available if demand exists.
National Budget
Starting year 2015
W6
Adopt a commercial attitude and review
port charges to operators to ensure
water freight is competitive
National Budget
Starting year 2015
W7 Romania to work with Danube countries
to agree operational plans
National Budget
Starting year 2015
W8
Review port and customs administration
procedures and rationalise and improve
communication
National Budget
Starting year 2015
W9 Establish suitable training for the needs
of the naval sector
National Budget
Starting year 2015
W10
Industry to use modern and integrated
systems for customs, navigation,
regulation and administration
National Budget
Starting year 2015
W11 Develop a safety plan including training
to reduce accidents
National Budget
Starting year 2015
W12
Enhance security to reduce thefts from
vessels and port facilities at Ports on the
Primary Economic Network
National Budget
Starting year 2015
W13
Reduce emissions from naval activity by
adopting best practice: enforce EU
regulations regarding emissions by non-
EU vessels
National Budget
Starting year 2015
W14 Safeguard land and facilities at minor
and underutilised ports
National Budget
Starting year 2015
W15 Improve immediate local and internal
road/rail connections
National Budget
Starting year 2015
W16 Transfer rail infrastructure ownership
within ports to port authorities
National Budget
Starting year 2015
P-GL-S Galati Port 17.6 Core TEN-T link Cohesion
Fund 2015 2014-2020
P-GR-S Giurgiu Port 4.3 Core TEN-T link Cohesion
Fund 2015 2014-2020
P-DBOV-
S Orsova/Drobeta 25.1 Core TEN-T link
Cohesion Fund
2015 2014-2020
P-OT-S Oltenita Port 5.6 Comprehensive
TEN-T link ERDF 2015 2014-2020
P-DB-S Drobeta Turnu Severin Port 17.3 Core TEN-T link Cohesion
Fund 2015 2014-2020

AECOM Summary of the Entire Project 81
Code Project Cost Relation to
TEN-T Network Funding Source
Start year
for FS
Calendar of Implementation
P-CV-S Cernavoda Port 6.9 Core TEN-T link Cohesion
Fund 2015 2014-2020
P-OV-S Orsova Port 7.8 Comprehensive
TEN-T link ERDF 2015 2014-2020
P-CB-S Corabia Port 4.5 Other links National Budget
2015 2014-2020
W1 Improving the navigability on the joint Romanian-Bulgarian sector of the Danube
206.7 Core TEN-T link Cohesion
Fund 2015 2014-2020
P-All-S Sulina Channel Improvements 20.0 Core TEN-T link Cohesion
Fund 2015 2014-2020
P-CO-S Constanta Port 351.1 Core TEN-T link Cohesion
Fund 2018 2021-2030
P-CF-S Calafat Port 19.7 Core TEN-T link Cohesion
Fund 2018 2021-2030
P-MV-S Moldova Veche Port 3.7 Comprehensive
TEN-T link ERDF 2018 2021-2030
P-TL-S Tulcea Port 16.0 Comprehensive
TEN-T link ERDF 2015 2014-2020
P-BS-S Basarabi Port 5.6 Other links ERDF 2018 2021-2030
W36 Bucharest to Danube Canal Connection 1,500.8 Core TEN-T link CEF 2020 After 2025
10.4.3 A summary of the sources of funding for the naval investments is given below.
Table 10.9 Distribution of total naval investments by funding source and period (mill EUR)
Funding Source
Period Investment
Cohesion Fund
2014-2020 298.1
2021-2030 1,871.6
ERDF 2014-2020 29.4
2021-2030 9.2
National Budget
2014-2020 4.5
2021-2030
Private Funds
2014-2020
2021-2030
Total 2014-2020 331.9
Total 2021-2030 1,880.9
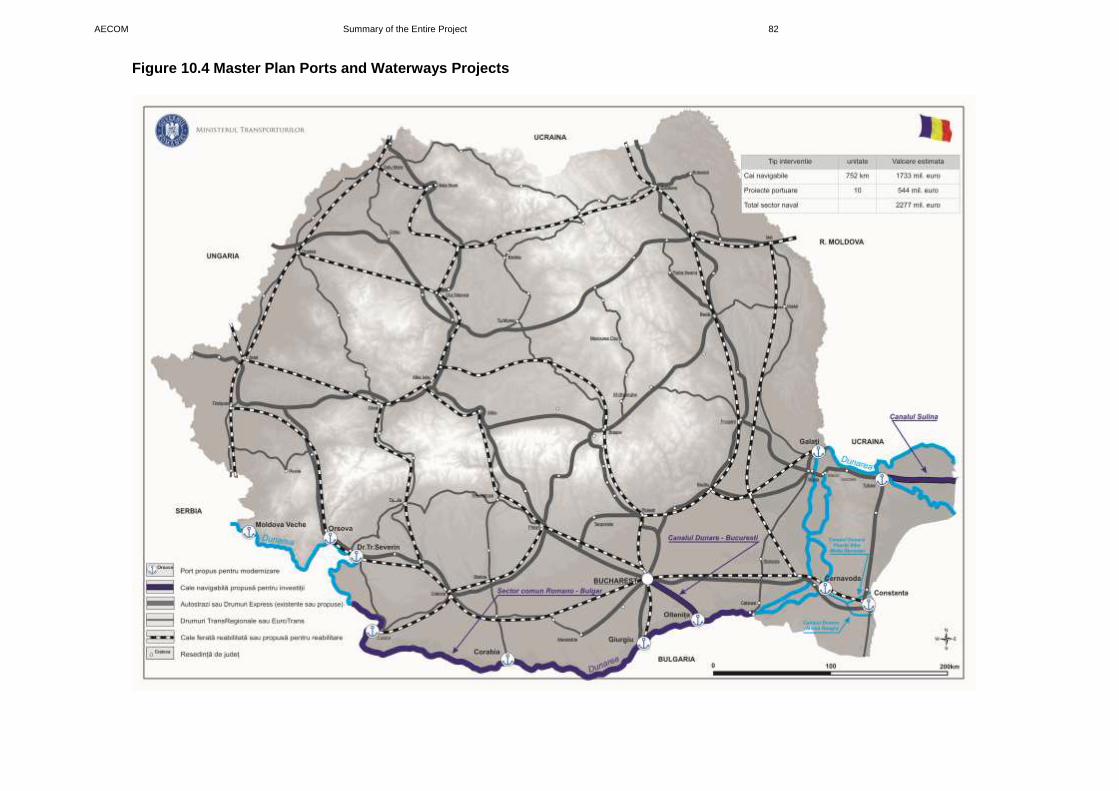
AECOM Summary of the Entire Project 82
Figure 10.4 Master Plan Ports and Waterways Projects
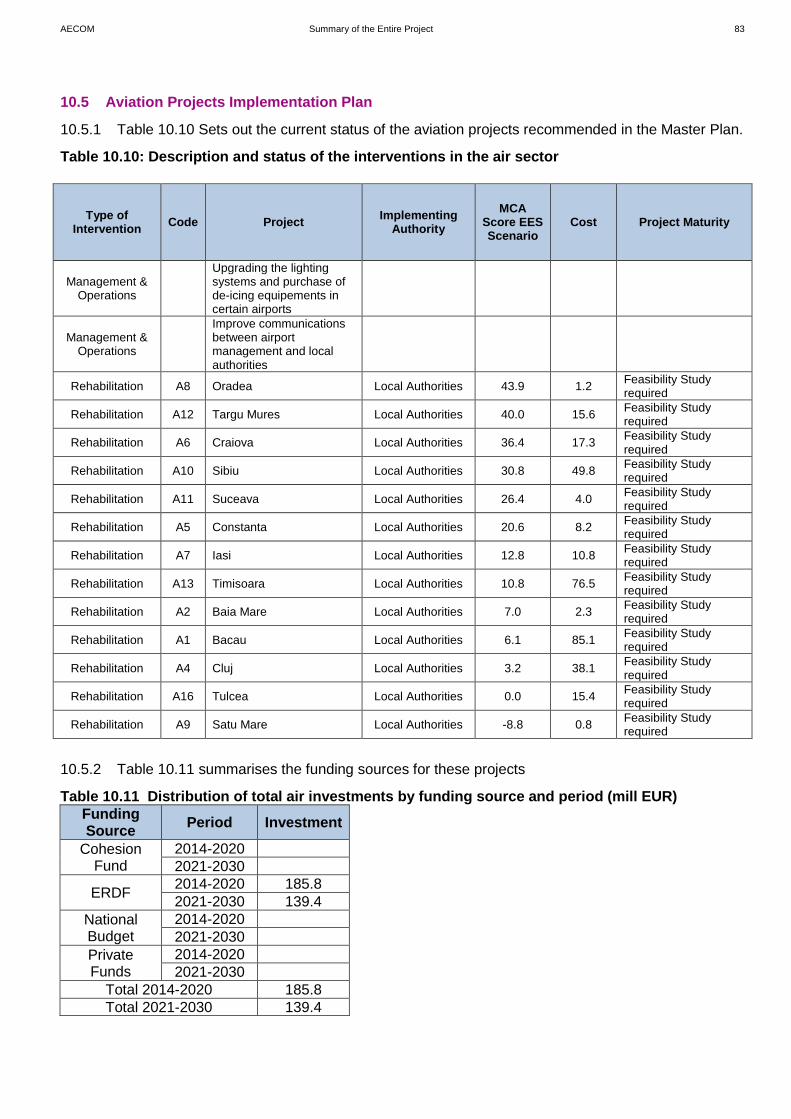
AECOM Summary of the Entire Project 83
10.5 Aviation Projects Implementation Plan
10.5.1 Table 10.10 Sets out the current status of the aviation projects recommended in the Master Plan.
Table 10.10: Description and status of the interventions in the air sector
Type of Intervention
Code Project Implementing
Authority
MCA Score EES Scenario
Cost Project Maturity
Management & Operations
Upgrading the lighting systems and purchase of de-icing equipements in certain airports
Management & Operations
Improve communications between airport management and local authorities
Rehabilitation A8 Oradea Local Authorities 43.9 1.2 Feasibility Study required
Rehabilitation A12 Targu Mures Local Authorities 40.0 15.6 Feasibility Study required
Rehabilitation A6 Craiova Local Authorities 36.4 17.3 Feasibility Study required
Rehabilitation A10 Sibiu Local Authorities 30.8 49.8 Feasibility Study required
Rehabilitation A11 Suceava Local Authorities 26.4 4.0 Feasibility Study required
Rehabilitation A5 Constanta Local Authorities 20.6 8.2 Feasibility Study required
Rehabilitation A7 Iasi Local Authorities 12.8 10.8 Feasibility Study required
Rehabilitation A13 Timisoara Local Authorities 10.8 76.5 Feasibility Study required
Rehabilitation A2 Baia Mare Local Authorities 7.0 2.3 Feasibility Study required
Rehabilitation A1 Bacau Local Authorities 6.1 85.1 Feasibility Study required
Rehabilitation A4 Cluj Local Authorities 3.2 38.1 Feasibility Study required
Rehabilitation A16 Tulcea Local Authorities 0.0 15.4 Feasibility Study required
Rehabilitation A9 Satu Mare Local Authorities -8.8 0.8 Feasibility Study required
10.5.2 Table 10.11 summarises the funding sources for these projects
Table 10.11 Distribution of total air investments by funding source and period (mill EUR)
Funding Source
Period Investment
Cohesion Fund
2014-2020
2021-2030
ERDF 2014-2020 185.8
2021-2030 139.4
National Budget
2014-2020
2021-2030
Private Funds
2014-2020
2021-2030
Total 2014-2020 185.8
Total 2021-2030 139.4
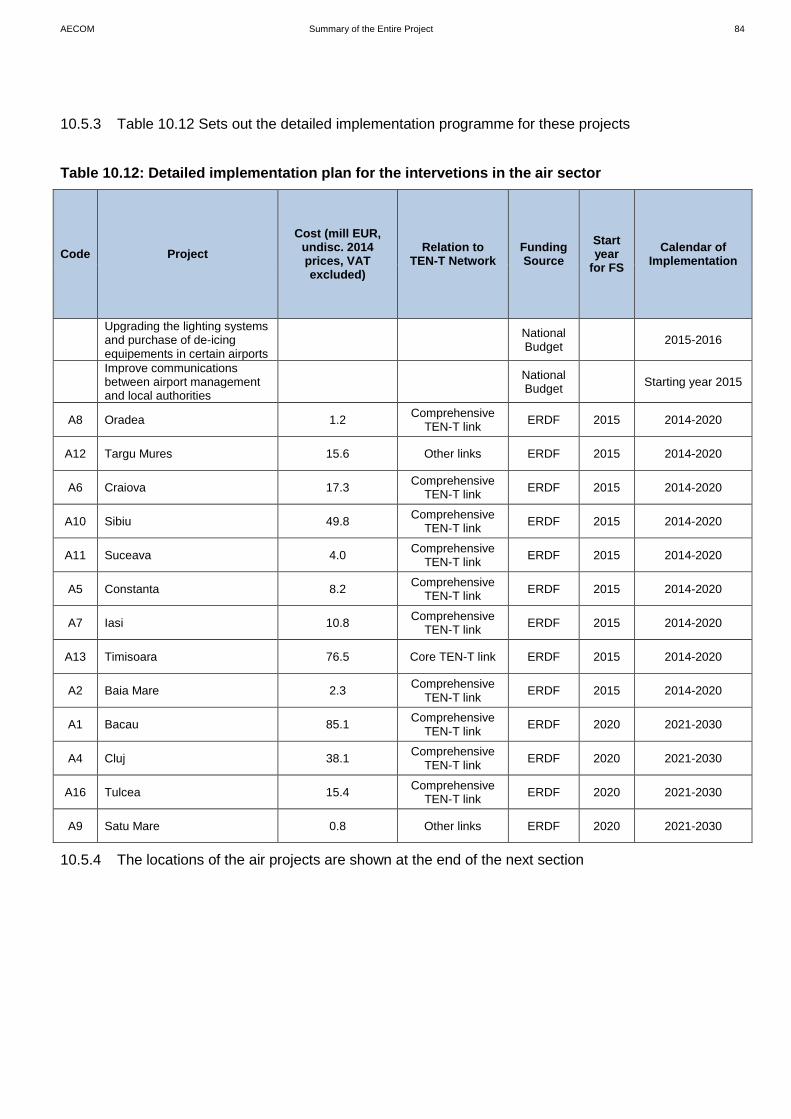
AECOM Summary of the Entire Project 84
10.5.3 Table 10.12 Sets out the detailed implementation programme for these projects
Table 10.12: Detailed implementation plan for the intervetions in the air sector
Code Project
Cost (mill EUR, undisc. 2014 prices, VAT excluded)
Relation to TEN-T Network
Funding Source
Start year
for FS
Calendar of Implementation
Upgrading the lighting systems and purchase of de-icing equipements in certain airports
National Budget
2015-2016
Improve communications between airport management and local authorities
National Budget
Starting year 2015
A8 Oradea 1.2 Comprehensive
TEN-T link ERDF 2015 2014-2020
A12 Targu Mures 15.6 Other links ERDF 2015 2014-2020
A6 Craiova 17.3 Comprehensive
TEN-T link ERDF 2015 2014-2020
A10 Sibiu 49.8 Comprehensive
TEN-T link ERDF 2015 2014-2020
A11 Suceava 4.0 Comprehensive
TEN-T link ERDF 2015 2014-2020
A5 Constanta 8.2 Comprehensive
TEN-T link ERDF 2015 2014-2020
A7 Iasi 10.8 Comprehensive
TEN-T link ERDF 2015 2014-2020
A13 Timisoara 76.5 Core TEN-T link ERDF 2015 2014-2020
A2 Baia Mare 2.3 Comprehensive
TEN-T link ERDF 2015 2014-2020
A1 Bacau 85.1 Comprehensive
TEN-T link ERDF 2020 2021-2030
A4 Cluj 38.1 Comprehensive
TEN-T link ERDF 2020 2021-2030
A16 Tulcea 15.4 Comprehensive
TEN-T link ERDF 2020 2021-2030
A9 Satu Mare 0.8 Other links ERDF 2020 2021-2030
10.5.4 The locations of the air projects are shown at the end of the next section

AECOM Summary of the Entire Project 85
10.6 Intermodal Transport Projects
10.6.1 Table 10.13 shows the status of the aviation projects.
Table 10.13 Description and status of the intermodal proposed interventions
Type of Intervention
Code Project Implementing
Authority
MCA Score EES
Scenario Cost Project Maturity
Establish a contract between infrastructure provider and train operators which requires compensation for delays and dedicated measures implemented by CFR Infrastructure
MT / CFR SA / CFR Marfa
n/a n/a n/a
Increase efficiency of operations by adopting best practices and privatization of facilities
MT / CFR SA / CFR Marfa
n/a n/a n/a
Remove uncertainty over the future of CFR Marfa and privatize as soon as possible
MT n/a n/a n/a
New infrastructure
I-BU-S Bucuresti IMT Private
Companies 80.0 18.0
Feasibility Study required
New infrastructure
I-TM-S Timisoara IMT Private
Companies 39.1 18.0
Feasibility Study required
New infrastructure
I-CR-S Craiova IMT Private
Companies 39.1 18.0
Feasibility Study required
New infrastructure
I-SU-S Suceava IMT Private
Companies 37.9 18.0
Feasibility Study required
New infrastructure
I-BC-S Bacau IMT Private
Companies 37.9 18.0
Feasibility Study required
New infrastructure
I-CJ-S Cluj-Napoca IMT Private
Companies 37.4 18.0
Feasibility Study required
New infrastructure
I-DB-S Drobeta Turnu Severin IMT Private
Companies 33.5 8.0
Feasibility Study required
New infrastructure
I-GL-S Galati IMT Private
Companies 30.0 23.0
Feasibility Study required
New infrastructure
I-GR-S Giurgiu IMT Private
Companies 30.0 10.0
Feasibility Study required
New infrastructure
I-TU-S Turda IMT Private
Companies 30.0 18.0
Feasibility Study required
New infrastructure
I-IS-S Iasi IMT Private
Companies 24.0 18.0
Feasibility Study required
New infrastructure
I-OR-S Oradea IMT Private
Companies 20.0 18.0
Feasibility Study required
10.6.2 Table 10.14 sets out the implementation programme for the aviation projects.
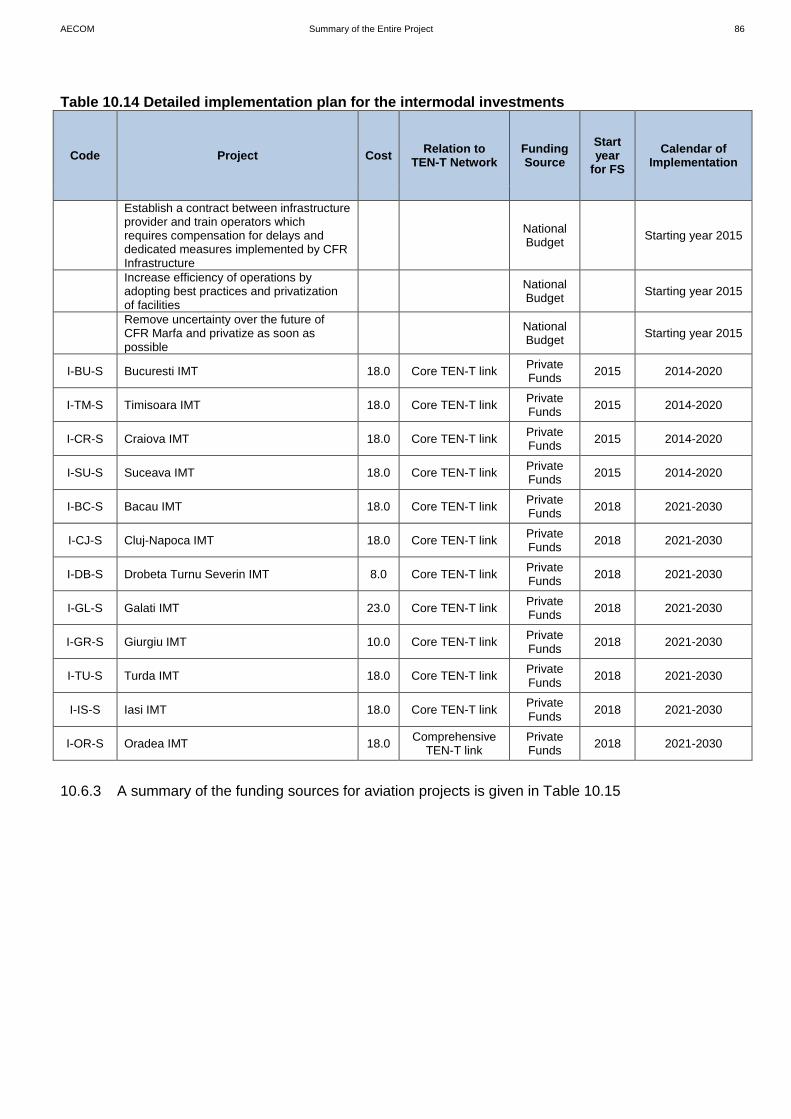
AECOM Summary of the Entire Project 86
Table 10.14 Detailed implementation plan for the intermodal investments
Code Project Cost Relation to
TEN-T Network Funding Source
Start year
for FS
Calendar of Implementation
Establish a contract between infrastructure provider and train operators which requires compensation for delays and dedicated measures implemented by CFR Infrastructure
National Budget
Starting year 2015
Increase efficiency of operations by adopting best practices and privatization of facilities
National Budget
Starting year 2015
Remove uncertainty over the future of CFR Marfa and privatize as soon as possible
National Budget
Starting year 2015
I-BU-S Bucuresti IMT 18.0 Core TEN-T link Private Funds
2015 2014-2020
I-TM-S Timisoara IMT 18.0 Core TEN-T link Private Funds
2015 2014-2020
I-CR-S Craiova IMT 18.0 Core TEN-T link Private Funds
2015 2014-2020
I-SU-S Suceava IMT 18.0 Core TEN-T link Private Funds
2015 2014-2020
I-BC-S Bacau IMT 18.0 Core TEN-T link Private Funds
2018 2021-2030
I-CJ-S Cluj-Napoca IMT 18.0 Core TEN-T link Private Funds
2018 2021-2030
I-DB-S Drobeta Turnu Severin IMT 8.0 Core TEN-T link Private Funds
2018 2021-2030
I-GL-S Galati IMT 23.0 Core TEN-T link Private Funds
2018 2021-2030
I-GR-S Giurgiu IMT 10.0 Core TEN-T link Private Funds
2018 2021-2030
I-TU-S Turda IMT 18.0 Core TEN-T link Private Funds
2018 2021-2030
I-IS-S Iasi IMT 18.0 Core TEN-T link Private Funds
2018 2021-2030
I-OR-S Oradea IMT 18.0 Comprehensive
TEN-T link Private Funds
2018 2021-2030
10.6.3 A summary of the funding sources for aviation projects is given in Table 10.15
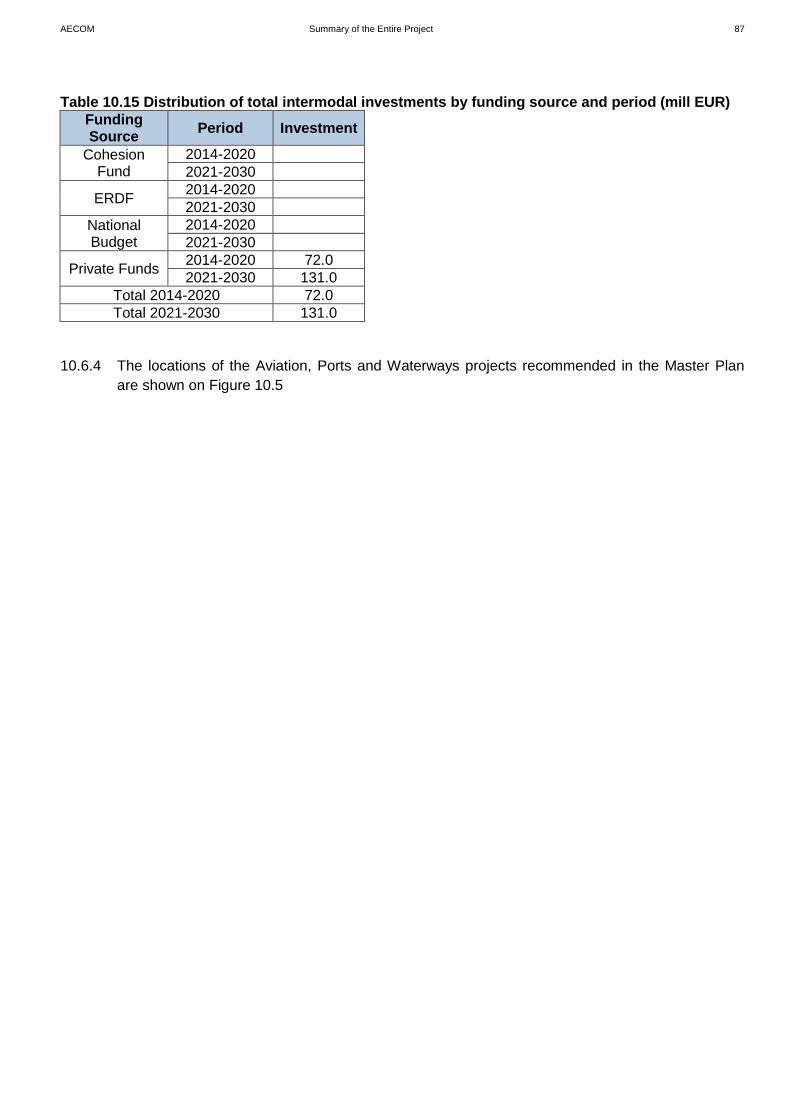
AECOM Summary of the Entire Project 87
Table 10.15 Distribution of total intermodal investments by funding source and period (mill EUR)
Funding Source
Period Investment
Cohesion Fund
2014-2020
2021-2030
ERDF 2014-2020
2021-2030
National Budget
2014-2020
2021-2030
Private Funds 2014-2020 72.0
2021-2030 131.0
Total 2014-2020 72.0
Total 2021-2030 131.0
10.6.4 The locations of the Aviation, Ports and Waterways projects recommended in the Master Plan
are shown on Figure 10.5

AECOM Summary of the Entire Project 88
Figure 10.5 Aviation, Ports and Waterways Projects Recommended in the Master Plan