rolling harvest business plan
TRANSCRIPT

Rolling Harvest, LLC Fast, Fresh, Healthy
Farm to Truck Wraps
Greg Farrenkopf
Drew Farris
Kwamena Sankah
Jason Valmoja

Core Product Definition
Fresh, healthy, organic, locally sourced,
and homemade wraps
Key attributes
Healthy
Fresh
Locally sourced
Organic
Gluten-free
2
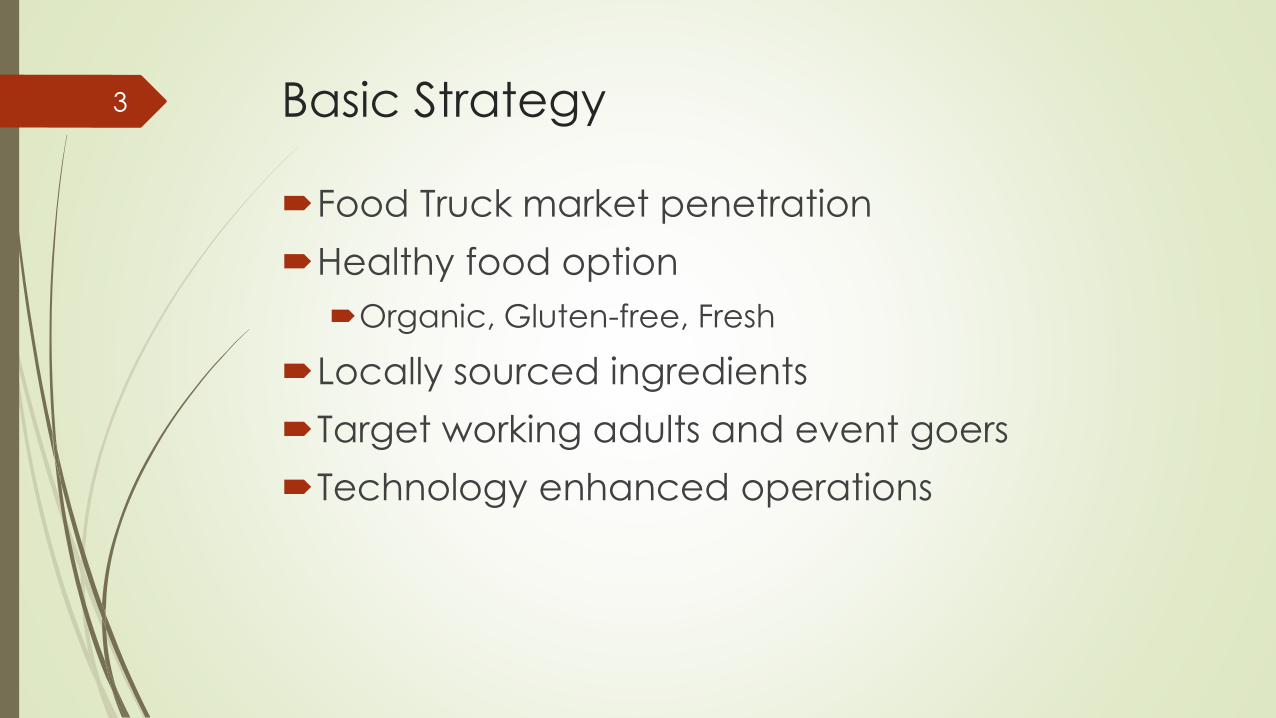
Basic Strategy
Food Truck market penetration
Healthy food option
Organic, Gluten-free, Fresh
Locally sourced ingredients
Target working adults and event goers
Technology enhanced operations
3

Environmental Analysis
Economics
Strengthening U.S., Sarasota, and Manatee County economies
characterized by growing consumer spending, higher wages, and
lowering unemployment
Consumer social and food trends
Growing consumer preference for healthy, fresh, locally sourced
food (Appendix 2, 3, 6)
Convenience required by busy lifestyles
Case study: Chipotle
Food truck technology
Heavy use of digital and social media for informing customers about
menu and locations
Consumer demand for streamlined ordering and mobile payments
4

Environmental Analysis
Natural environment implications for food supply
Local, organic produce and protein supply will vary by
season and availability
Supply subject to weather and other natural environment
phenomenon
Regulations
Business registration
Heavy regulatory burden in Sarasota County
Political considerations
Special interest groups
Sarasota Originals vs. SRQ Food Truck Alliance
5

Top Lessons Learned from Food Truck
Owners1
Rules and Regulations most consistent external source of
frustration
Requires serious business planning
Requires hands on ownership
Most successful food truck owners have “passion for the
food” and “love interacting with people”
Events generally do better than daily sales
Make sure to purchase a reliable truck
1FoodTruckr.com
6

What makes a successful food truck?From the Experts at FoodTruckr.com:
Focus on Execution
Limit the number of food items
Find a specialty/niche
Create Demand - Scarcity built into business model
Limited Serving Time
Limited Supply
Location Mobility
Use Social Media Right
Stimulate an immediate response
Makes consumers feel closer to the people serving the food
(augmenting the food truck experience)
7

Direct Competition8

Healthiest menu with relatively high
price point.
9

Alone with the
healthiest and
most convenient
menu
10

Freshest and most
convenient menu11

Most high
tech and
highest quality
customer
service
12

Most locally
sourced menu
and close second
for most gluten-
free options
13
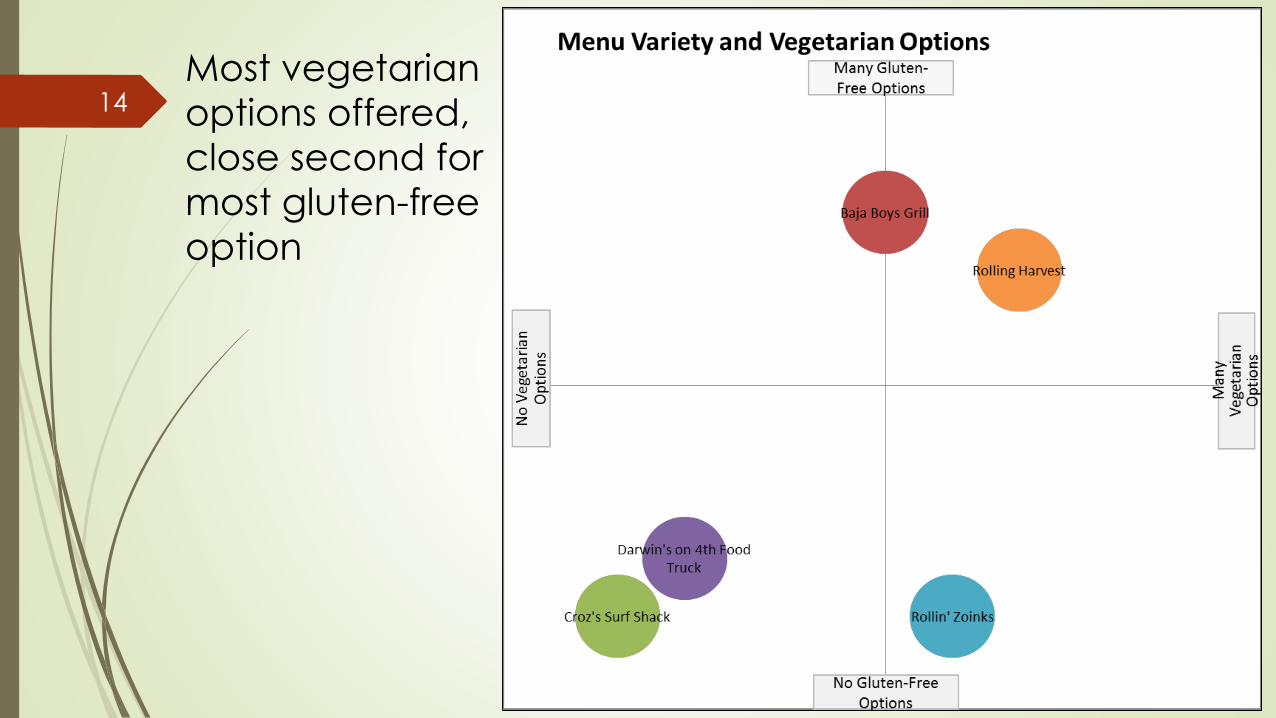
Most vegetarian
options offered,
close second for
most gluten-free
option
14

Indirect Competition15

SWOT
Strengths Weaknesses
• Rare combination of fresh, fast, and
healthy cuisine
• Most locally sourced menu
• Mobile payment and online
ordering
• Emphasis on customer service and
building loyalty
• Flexibility to alter menu and service
locations
• Lack of brand recognition and
awareness
• Limited menu size
• High price point
• Inability to quickly restock products
that run out
• Relatively little experience as
compared to competitors
Opportunities Threats
• Growing consumer preferences for
local, organic, and healthy cuisine
• Growing demand for gluten-free
options
• Recovering U.S. economy and
strong, growing local economies
• Few food trucks in the area have
the advanced technology
capabilities demanded by
consumers
• Heavy regulation in Sarasota
County
• Competitor price reduction
• Poor weather conditions either rain
or heat induced
• Decreased volume during summer
months
• Heavy traffic when traveling
between locations
• Increasing gas prices
• Unavailability of locally sourced
products
16
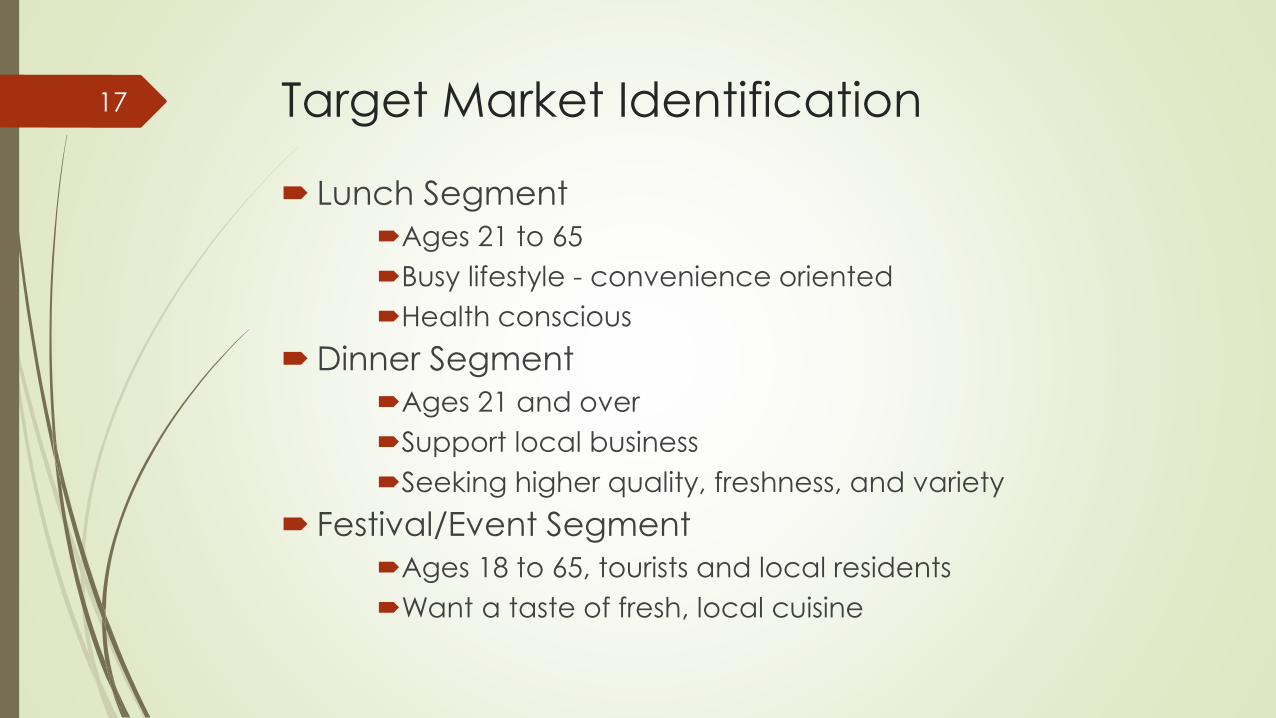
Target Market Identification
Lunch Segment
Ages 21 to 65
Busy lifestyle - convenience oriented
Health conscious
Dinner Segment
Ages 21 and over
Support local business
Seeking higher quality, freshness, and variety
Festival/Event Segment
Ages 18 to 65, tourists and local residents
Want a taste of fresh, local cuisine
17

Sarasota Trade Fair Center
18

Comments from the Lunch Customers
“I was often tempted by the food trucks with their innovative options such as mac-n-cheese phillycheesesteaks. But I would be far more likely to purchase from a food truck on a regular basis if they provided me with healthy, yet delicious options.”
Jillian (female, age 26), Bealls, Inc.
“I made an attempt to buy my lunch from the food trucks that came to my offices, but the options were fried or BBQ and just too unhealthy. Would have loved a fresh, healthy alternative!”
Eva (female, age 34), Bealls, Inc.
19
20

Local Festivals with Food Trucks21

Goal Setting
Short Term Goals
Customer satisfaction of 6 (Scale 1-7) in 3 years
Break even in 30 months
Long Term Goals
Payoff loan in 5 years
Increase Sales by 160% in 5 years
Savings of $100,000 in 5 years
Open a restaurant in Sarasota by Year 10
22
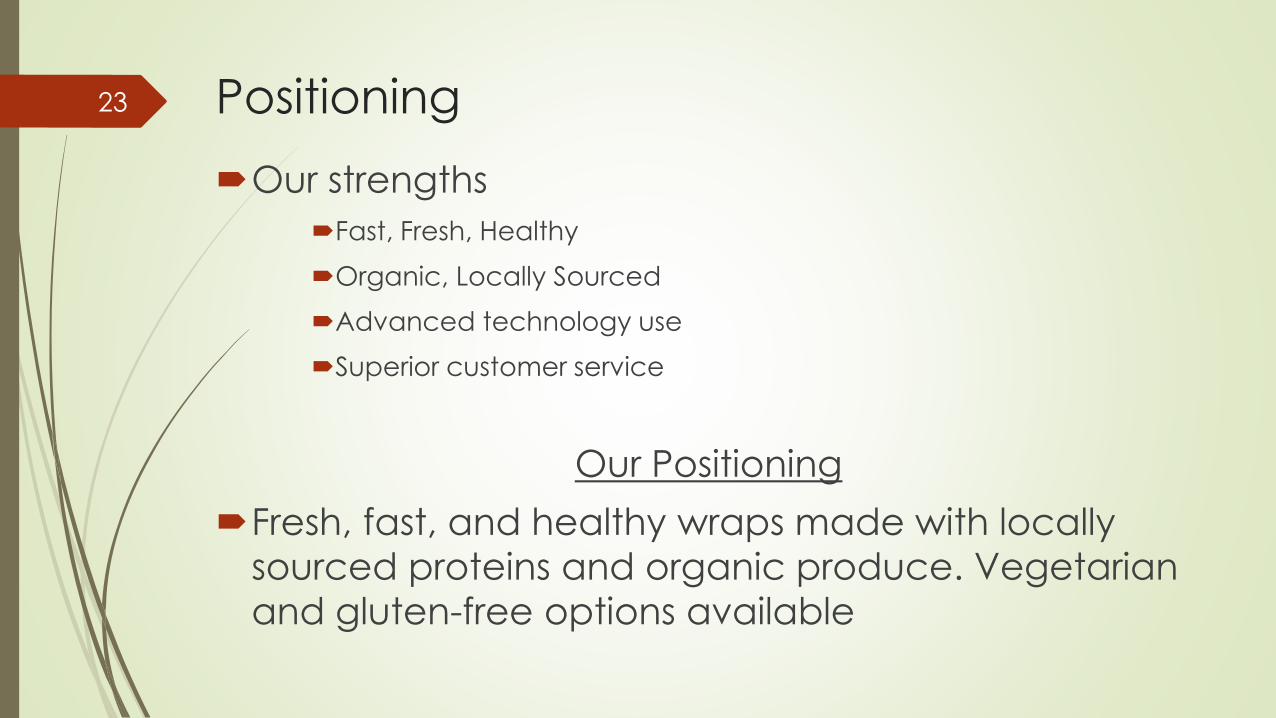
Positioning
Our strengths
Fast, Fresh, Healthy
Organic, Locally Sourced
Advanced technology use
Superior customer service
Our Positioning
Fresh, fast, and healthy wraps made with locally
sourced proteins and organic produce. Vegetarian
and gluten-free options available
23

The Thai Steak Wrap
Locally raised grass fed flank steak with locally grown
organic Asian style cabbage slaw
24

The Veggie & Hummus Wrap
Organic fresh made hummus and feta with locally grown
organic sautéed zucchini, squash, onions, tomatoes, and
spinach
25

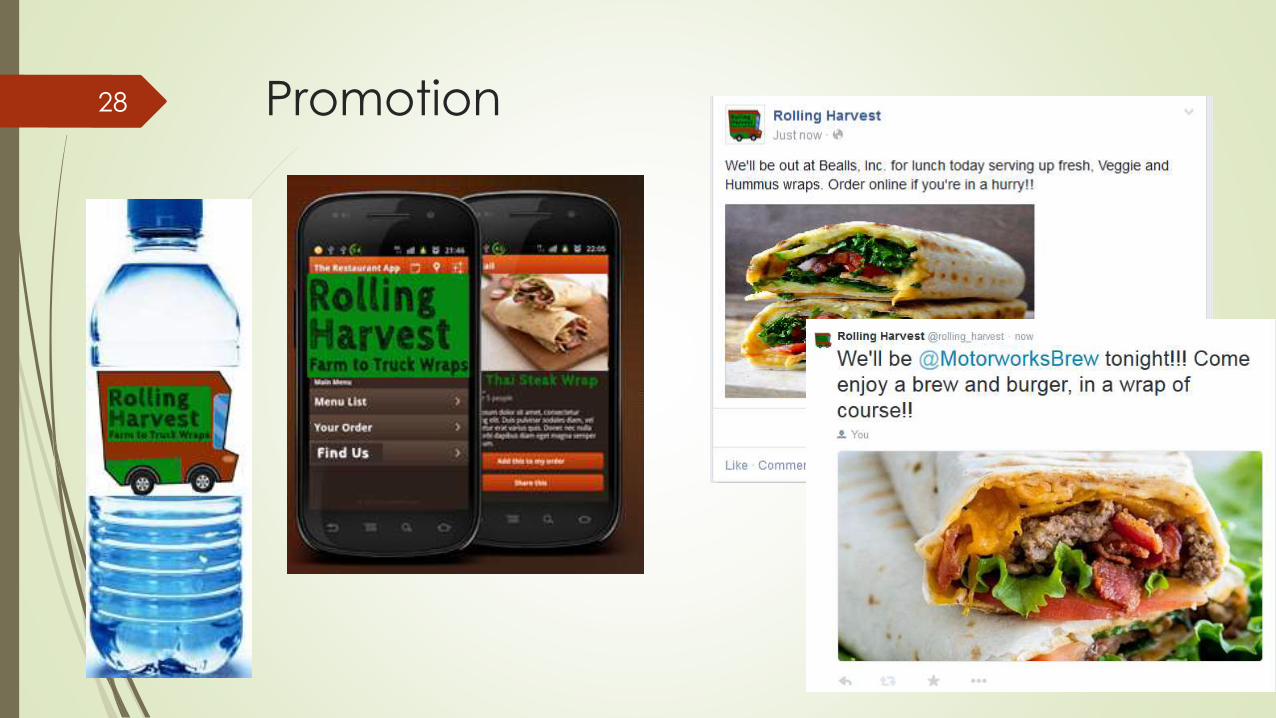
Promotion
Website, social media, and mobile application
User-friendly and easy to navigate
Menu and location information
Core brand story
Online ordering enabled
Pay-per-click advertising
Google and Facebook
Target those w/in 5 miles of each location’s address and interest in
“food trucks”
Branding
Brand logo on water bottles
Creative truck decoration displaying benefits of healthy, fresh, local
cuisine
26

Mobile Website27
• Locations and Menu
updated daily
• Accepts online orders
and payments
• Allows selection of
available pickup times
• Orders automatically
entered in POS in real
time
Promotion28

Promotion
Sampling
Deliver samples of each wrap to proposed locations
Marketing collateral
Printed menus to drop off with samples
29
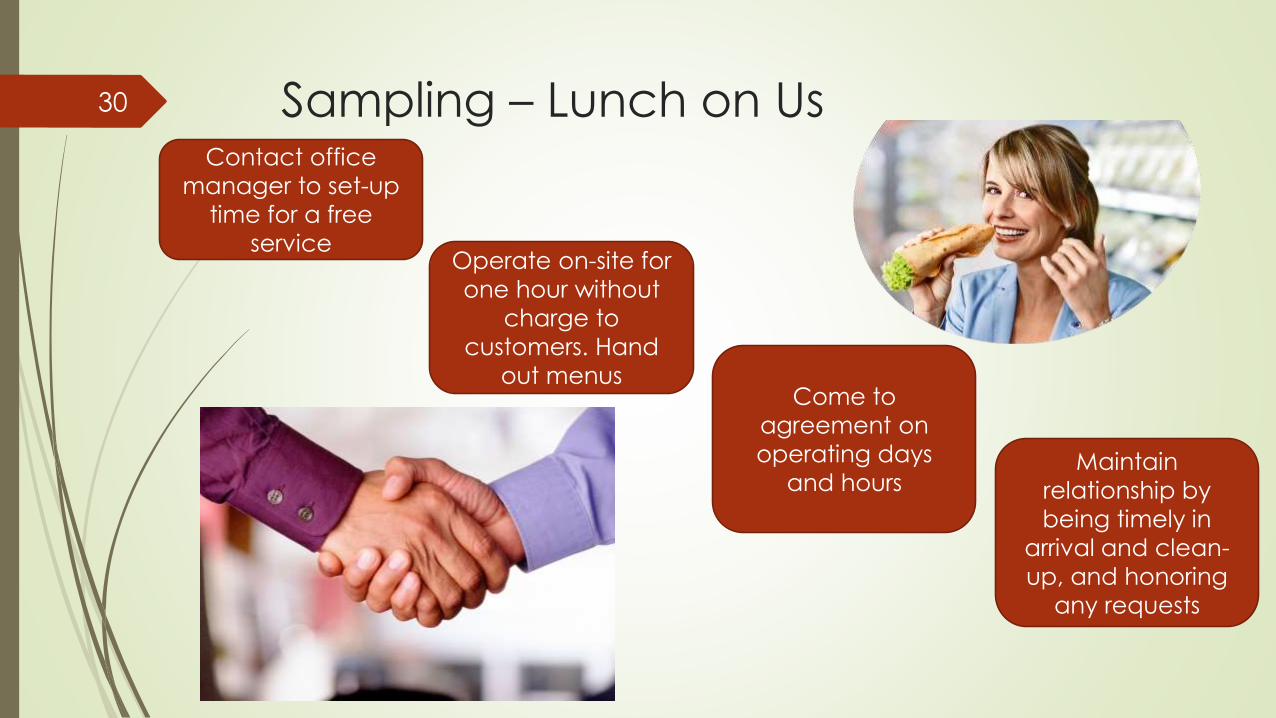
Sampling – Lunch on Us
Operate on-site for
one hour without
charge to
customers. Hand
out menus
Contact office
manager to set-up
time for a free
service
Come to
agreement on
operating days
and hoursMaintain
relationship by
being timely in
arrival and clean-
up, and honoring
any requests
30

Customer Experience Attraction points
Website/Social media
Mobile app
PPC advertising
Sampling
Engagement points
Truck decoration and friendly atmosphere with entertainment to occupy customers during waiting periods
Emphasis on streamlined ordering and pick-up (on and offline)
Picnic area with tables and chairs for customers
Exit/Extension points
Food consumption
Word of mouth
31

PPC Adverts
Visit website/Review menu
Ph
ysi
ca
l
Ev
ide
nc
e
Cu
sto
me
rC
on
tac
t P
ers
on
On
Sta
ge
Ba
ck
Sta
ge
Su
pp
ort
Pro
ce
sse
s
Ad creation
Samples/Menu
Owners deliver samples/menus
Owners prepare samples/Obtain printed menus
Taste samples/Review menu
Website/App
Visit website/ Download application.
Menu and location info provided
Website/App
Order online
Online ordering enabled
Appearance of truck/Outside seating areas/Atmosphere music
Arrive at truck/Wait in line
Entertainment with music /Truck with story and facts on it
Customer
Experience
Blueprint
32

Truck window/Truck kitchen appearance.
Give order to cashier
Ph
ysi
ca
l Ev
ide
nc
eC
ust
om
er
Co
nta
ct
Pe
rso
nO
n
Sta
ge
Ba
ck
Sta
ge
Su
pp
ort
P
roc
ess
es
Owners obtain proper inventory levels
Card payment screen/Counter
Pay for order/ Swipe card and sign.
Give customer water bottle. Take cash, return change, and give receipt if necessary
POS System
Wait for order
Order screen/Pick up window.
Pick up order
Consume order
Order menu displays order name and contents
Take order. Recommend if necessary
Input order into computer
Input cash into drawer/Send order to kitchen/Kitchen prepare order
Chef 2 prepares wraps/Chef 1 prepares "to go" bag with fork, knife, napkins and inserts wrap in bag
Appearance of truck/Outside seating areas/Atmosphere music
Food
Chef 1 brings prepared item to pick up counter/Fulfills any extra requests. Give
water bottle if online order
Customer
Experience
Blueprint
33
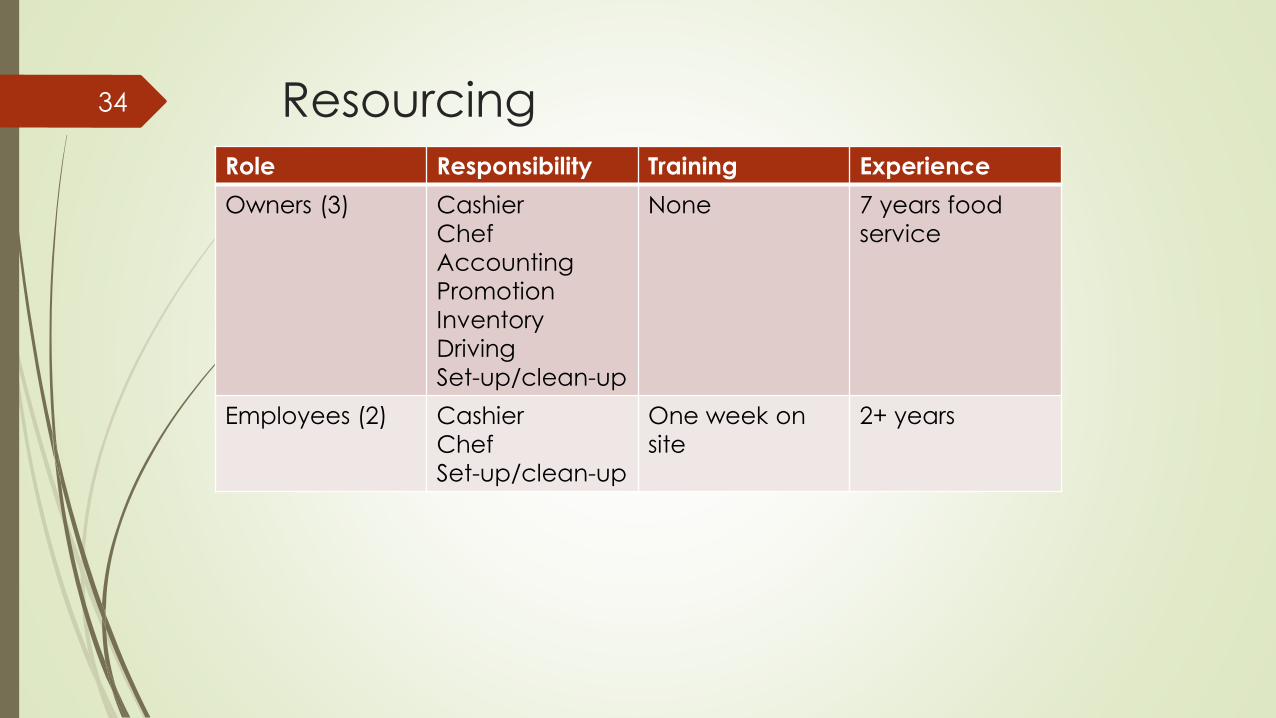
Resourcing
Role Responsibility Training Experience
Owners (3) Cashier
Chef
Accounting
Promotion
Inventory
Driving
Set-up/clean-up
None 7 years food
service
Employees (2) Cashier
Chef
Set-up/clean-up
One week on
site
2+ years
34

Preparation Location
Woody’s River Roo Pub & Grill - Ellenton, FL
Quick access to I-75
Includes Food Storage
Deliveries accepted
35

Scheduling36 Start Time End Time Owner 1 Owner 2 Owner 3 Employee 1 Employee 2 Truck Location
6:30 7:00 Promotion Woody’s
7:00 10:00
Food
Preparation
Food
Preparation Woody’s
10:00 10:30 Travel Travel
10:30 10:45 Site Setup Site Setup Site Setup
Lunch Location
#1
10:45 11:45 Food Service Food Service Food Service
Lunch Location
#1
11:45 12:00 Travel Site Cleanup Travel
12:00 12:15 Travel Travel Travel
12:15 12:30 Site Setup Travel Site Setup
Lunch Location
#2
12:30 1:30 Food Service Food Service Food Service
Lunch Location
#2
1:30 1:45 Site Cleanup Site Cleanup Site Cleanup
Lunch Location
#2
1:45 2:15 Travel Inventory Travel
2:15 2:45 Truck Cleanup Inventory Truck Cleanup Woody’s
2:45 5:45 Inventory
Food
Preparation
Food
Preparation Woody’s
5:45 6:15 Travel Travel Travel
6:15 6:30 Site Setup Site Setup Site Setup Dinner Location
6:30 9:00 Food Service Food Service Food Service Dinner Location
9:00 9:30 Site Cleanup Site Cleanup Site Cleanup Dinner Location
9:30 10:00 Travel Travel
10:00 10:45 Truck Cleanup Truck Cleanup Woody’s
10:45 11:15 Accounting Woody’s

Lakewood Ranch Medical Center
Est. Employees: 400
Pop. w/in 5m: 112,000
Sarasota Trade Fair Center
Est. Employees: 347
Pop. w/in 5m: 36,000
Tervis Tumbler
Est. Employees: 250
Pop. w/in 5m: 32,000
Sun Hydraulics
Est. Employees: 200
Pop. w/in 5m: 116,000
Bealls, Inc.
Est. Employees: 500
Pop. w/in 5m: 122,000State College of Florida
Est. Employees: 472
Pop. w/in 5m: 112,000
Tropicana Products, Inc.
Est. Employees: 600
Pop. w/in 5m: 122,000Blake Medical Center
Est. Employees: 200
Pop. w/in 5m: 122,000
Manatee Memorial Hospital
Est. Employees: 402
Pop. w/in 5m: 122,000
USFSM
Students & Faculty: 700
Pop. w/in 5m: 112,000
PGT Industries, Inc.
Est. Employees: 200
Pop. w/in 5m: 32,000
Monday
10:45am – 1:30pm
Tuesday
10:45am –
1:30pm
Wednesday
10:45am – 1:30pm
Thursday
10:45am –
1:30pm
Friday
10:45am –
1:30pm
37

Quality Plan
Local sources
Naturally raised proteins - Dam Ranch, Bradenton, FL
Organic produce - Geraldson Farms, Bradenton, FL
Seafood - Star Fish Company, Bradenton, FL
Wastage
Chefs 1 and 2 will inspect quality of product during assembly
and not serve any defective product to customers
Owner 2 will record the amount of left over food as a
percentage of sales each morning during inventory
Wastage years 1-5: 10%, 9%, 8%, 7%, 6%, respectively
38
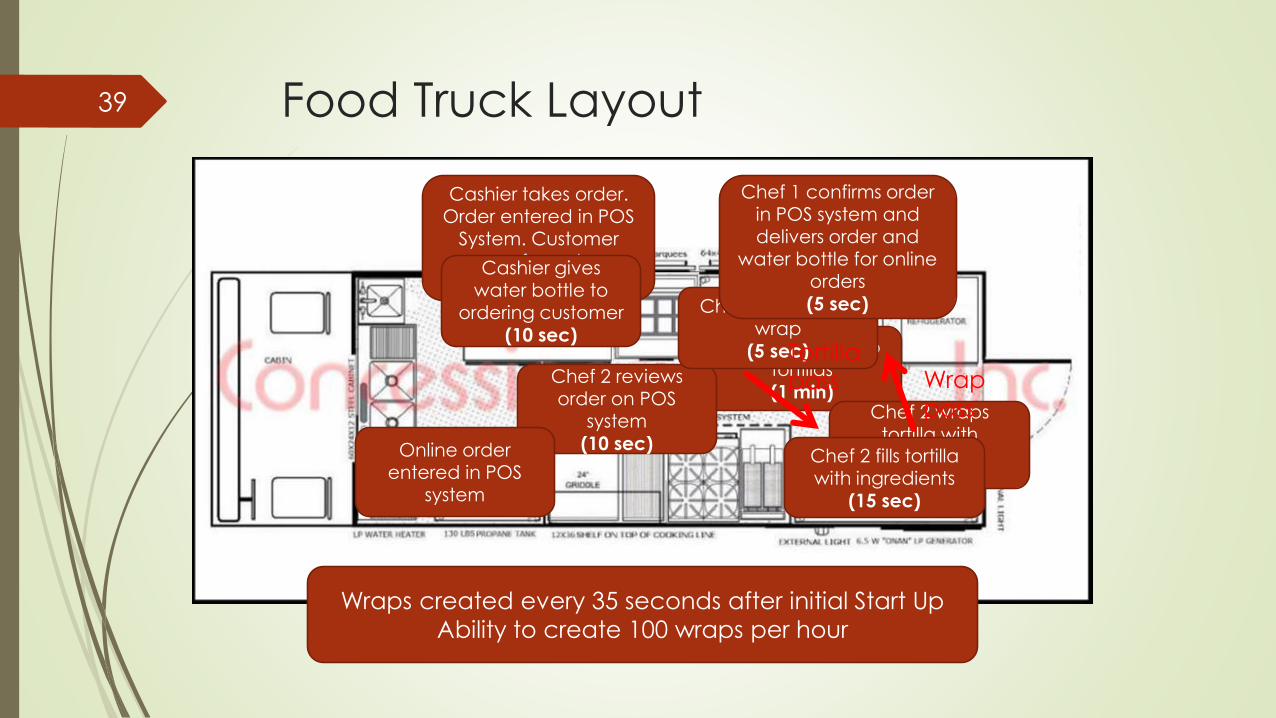
Food Truck Layout
Cashier takes order. Order entered in POS
System. Customer pays for order.
(10 sec)
Chef 1 cooks two tortillas
(1 min)Chef 2 reviews order on POS
system
(10 sec)
Chef 2 wraps tortilla with ingredients
(10 sec)
Chef 2 fills tortilla with ingredients
(15 sec)
Chef 1 packages wrap
(5 sec)
Chef 1 confirms order in POS system and delivers order and
water bottle for online orders
(5 sec)
Cashier gives water bottle to
ordering customer
(10 sec)Tortilla
pass Wrap
pass
Wraps created every 35 seconds after initial Start Up
Ability to create 100 wraps per hour
39
Online order entered in POS
system

Start Up Costs40
$77,698
$2,321
$1,788
$7,723
$5,225
$5,715
$80,000
Food Truck
Business Licensing
Liability Insurance
Equipment
Promotion
POS System
Operating Reserves
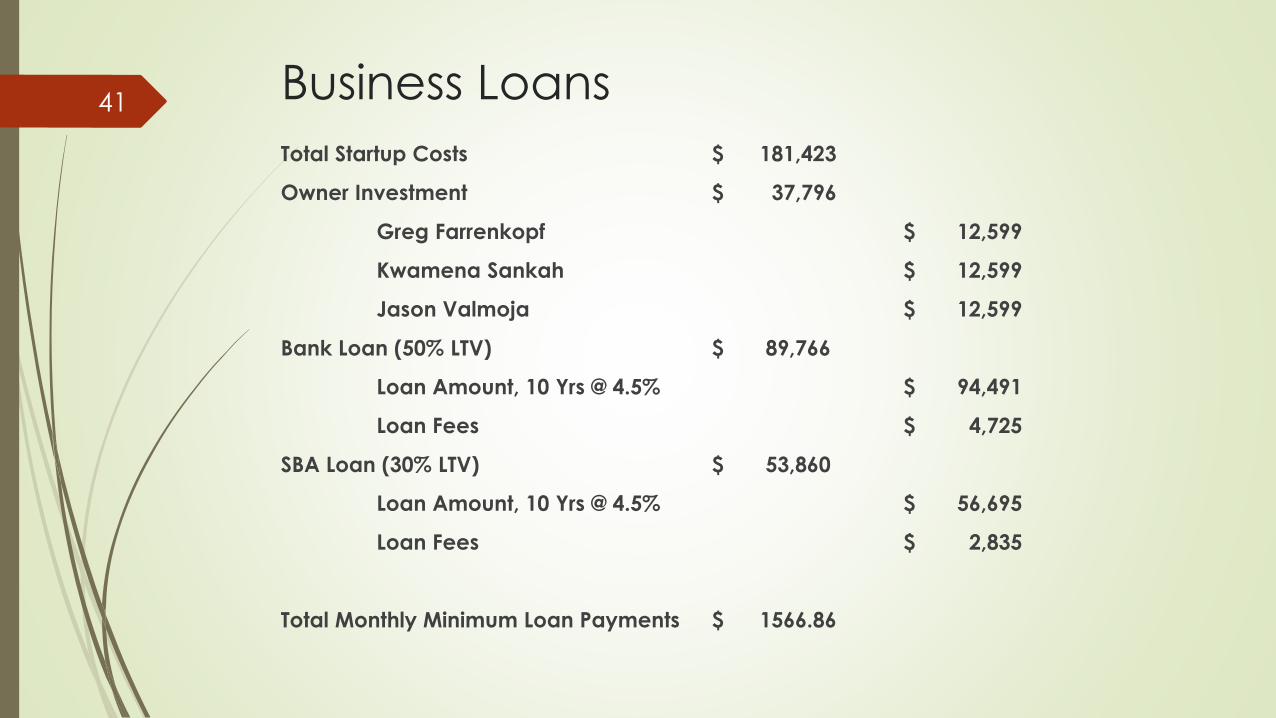
Business Loans41
Total Startup Costs $ 181,423
Owner Investment $ 37,796
Greg Farrenkopf $ 12,599
Kwamena Sankah $ 12,599
Jason Valmoja $ 12,599
Bank Loan (50% LTV) $ 89,766
Loan Amount, 10 Yrs @ 4.5% $ 94,491
Loan Fees $ 4,725
SBA Loan (30% LTV) $ 53,860
Loan Amount, 10 Yrs @ 4.5% $ 56,695
Loan Fees $ 2,835
Total Monthly Minimum Loan Payments $ 1566.86

Beginning Balance Sheet – Oct 1, 2015 42
Current Assets Current Liabilities
Cash 80,001$ Accounts Payable 4,875$
Inventory 4,875$
Supplies 953$ Long-term Liabilities
Prepaids 16,893$ Business Loan 94,491$
Total Current Assets 102,721$ SBA Loan 56,695$
Total Long-term Liabilities 151,186$
Property & Equipment
Truck 77,698$ TOTAL LIABILITIES 156,061$
Equipment 7,723$
POS System 5,715$
Total Property & Equipment 91,136$ Common stock 37,796$
TOTAL ASSETS 193,857$ TOTAL LIABILITIES + OWNER'S EQUITY 193,857$
ASSETS LIABILITIES
OWNER'S EQUITY

Salaries and Wages43
$11.00
$11.50
$12.00
$12.50
$13.00
$13.50
$14.00
$14.50
$-
$10,000
$20,000
$30,000
$40,000
$50,000
$60,000
$70,000
FY 2016 FY 2017 FY 2018 FY 2019 FY 2020
Owner Bonus
Owner Salary
Employee Hourly
Wage

Pricing
Wraps will be sold for $9 in Years 1 and 2
Lunch & Event serving includes wrap with Rolling
Harvest labeled bottled water
Dinner serving includes only wrap
Price increase to $9.25 in Year 3 and $9.50 in Year 5
Average cost of raw materials per wrap is $3.25
Customers willing to pay more
62% for organic foods (Mintel, 2010)
70% for locally sourced foods (A.T. Kearney, 2013)
88% for healthy foods (Gagliardi, 2015)
44

Sales Forecast45
138
90
198
142
238
174
273
200
299
218
0
50
100
150
200
250
300
350
Oc
t-15
De
c-1
5
Fe
b-1
6
Ap
r-1
6
Ju
n-1
6
Au
g-1
6
Oc
t-16
De
c-1
6
Fe
b-1
7
Ap
r-1
7
Ju
n-1
7
Au
g-1
7
Oc
t-17
De
c-1
7
Fe
b-1
8
Ap
r-1
8
Ju
n-1
8
Au
g-1
8
Oc
t-18
De
c-1
8
Fe
b-1
9
Ap
r-1
9
Ju
n-1
9
Au
g-1
9
Oc
t-19
De
c-1
9
Fe
b-2
0
Ap
r-2
0
Ju
n-2
0
Au
g-2
0
Average Unit Per Day Sales By Month

Break Even Analysis46
$-
$10,000
$20,000
$30,000
$40,000
$50,000
$60,000
0 1000 2000 3000 4000 5000 6000
Monthly Unit Sales for Break Even
Total Revenue
Fixed Costs
Total Costs
Break Even
Monthly Unit
Sales = 3255

Expected Daily Sales47
Lunch Location Site Lunch PopulationPopulation Within
Five Miles
Bealls, Inc. 500 122,000
State College of Florida 472 112,000
University of South Florida - Manatee/Sarasota 700 112,000
Sun Hydraulics 200 116,000
Tervis Tumbler 250 32,000
Lakewood Ranch Medical Center 400 112,000
PGT Industries, Inc. 200 32,000
Tropicana Product Inc. 600 122,000
Sarasota Fair Trade Center 347 36,000
Manatee Memorial Hospital 402 122,000
Average 407 91,800
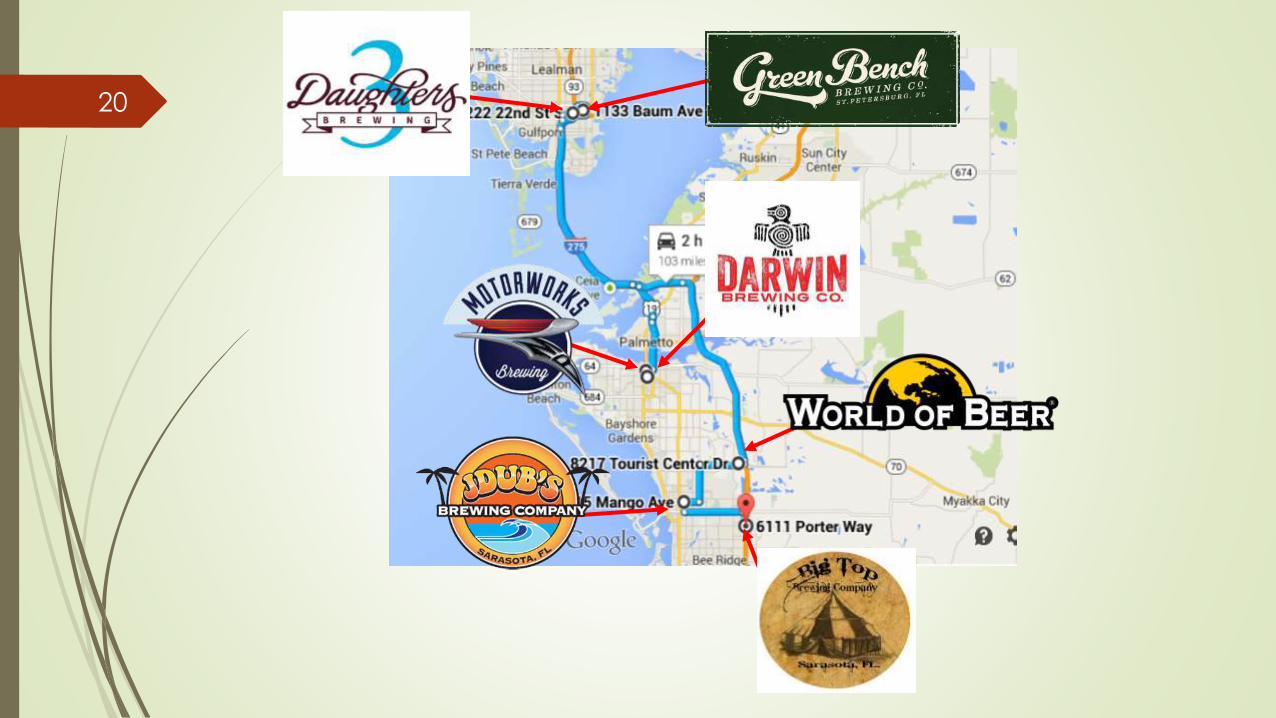
Dinner LocationsPopulation Within
Five Miles
3 Daughters Brewing 184,000
Motorworks Brewing 118,000
Jdubs Brewing Company 108,000
Green Bench Brewing Company 180,000
Darwin's Brewing Company 120,000
World of Beer Sarasota 76,000
Big Top Brewing Company 82,000
Average 124,000
Days Sales Per Month Projected Unit Sales Sales Rate
Lunch Site #1 18 30 7.37%
Lunch Site #2 18 30 7.37%
Lunch Site Local Population 18 15 0.02%
Dinner Site 18 52 0.04%
Festival/Event (est. pop 2,500) 7 138 5.52%

Statement of Cash Flows48
Year 0 Year 1 Year 2 Year 3 Year 4 Year 5
FY 2015 FY 2016 FY 2017 FY 2018 FY 2019 FY 2020
Opening Cash Balance -$ 80,001$ 41,166$ 69,252$ 80,679$ 81,867$
Total Cash In 181,423$ 271,395$ 423,691$ 539,894$ 626,426$ 712,374$
CASH OUT
Truck 77,698$ -$ -$ -$ -$ -$
Equipment 7,723$ -$ -$ -$ -$ -$
Wages & Benefits -$ 128,909$ 142,374$ 155,551$ 168,728$ 181,905$
Liability Insurance 1,788$ 1,788$ 1,824$ 1,860$ 1,897$ 1,935$
Preparation Area Rental -$ 24,000$ 24,480$ 24,970$ 25,469$ 25,978$
Gas 553$ 9,000$ 9,180$ 9,364$ 9,551$ 9,742$
Propane 150$ 1,800$ 1,836$ 1,873$ 1,910$ 1,948$
Promotion 5,225$ 8,072$ 8,233$ 8,398$ 8,566$ 8,737$
Ingredients -$ 98,893$ 165,163$ 205,885$ 237,609$ 261,478$
Business Loan Payment -$ 18,804$ 18,804$ 18,804$ 18,804$ 18,804$
POS Fee 5,715$ 888$ 906$ 924$ 942$ 961$
Business License Renewal Fees 2,321$ 1,131$ 1,154$ 1,177$ 1,200$ 1,224$
Cooking Supplies 100$ 1,200$ 1,224$ 1,248$ 1,273$ 1,299$
Cleaning Supplies 150$ 1,800$ 1,836$ 1,873$ 1,910$ 1,948$
Credit Card Processing -$ 7,945$ 12,471$ 16,298$ 19,010$ 21,493$
Miscellaneous -$ 6,000$ 6,120$ 6,242$ 6,367$ 6,495$
Owner Bonus -$ -$ -$ 37,000$ 61,000$ 85,000$
Company Savings -$ -$ -$ 37,000$ 61,000$ 85,000$
Total Cash Disbursement 101,423$ 310,230$ 395,605$ 528,467$ 625,238$ 713,949$
Net Cash 80,001$ (38,835)$ 28,086$ 11,427$ 1,188$ (1,574)$
Closing Cash Balance 80,001$ 41,166$ 69,252$ 80,679$ 81,867$ 80,293$

Cash Balance By Month49
$20,000
$30,000
$40,000
$50,000
$60,000
$70,000
$80,000
$90,000
0 2 4 6 8 10 12 14 16 18 20 22 24 26 28 30 32 34 36
Ca
sh o
n H
an
d
Month
Cash Balance
Two Months Operating Reserves

Income Statement50
Year 1 Year 2 Year 3 Year 4 Year 5
FY 2016 FY 2017 FY 2018 FY 2019 FY 2020
Sales 271,395$ 423,691$ 539,894$ 626,426$ 712,374$
COGS 98,893$ 165,163$ 205,885$ 237,609$ 261,478$
Gross Profit ($) 172,502$ 258,528$ 334,009$ 388,817$ 450,896$
Gross Profit (%) 63.56% 61.02% 61.87% 62.07% 63.29%
Salaries & Benefits 129,197$ 142,374$ 155,551$ 168,728$ 181,905$
Preparation Area Rental 24,000$ 24,480$ 24,970$ 25,469$ 25,978$
Business Loan Interest 6,553$ 5,990$ 5,401$ 4,786$ 4,142$
Liability Insurance 1,788$ 1,824$ 1,860$ 1,897$ 1,935$
Promotion 8,072$ 8,233$ 8,398$ 8,566$ 8,737$
Business License Fees 1,131$ 1,154$ 1,177$ 1,200$ 1,224$
Credit Card Processing 7,945$ 12,471$ 16,298$ 19,010$ 21,493$
POS System 888$ 906$ 924$ 942$ 961$
Depreciation 9,636$ 9,636$ 9,636$ 9,636$ 9,636$
Supplies 10,800$ 10,896$ 10,994$ 11,094$ 11,196$
Travel (Gas) 9,000$ 9,180$ 9,364$ 9,551$ 9,742$
Total SG&A 209,009$ 227,144$ 244,573$ 260,880$ 276,950$
Net Income (36,508)$ 31,384$ 89,436$ 127,937$ 173,946$
Net Income Percentage (13.45%) 7.41% 16.57% 20.42% 24.42%
Cumulative Net Income (36,508)$ (5,124)$ 84,312$ 212,250$ 386,196$

Important Financial Ratios51
Year 1 Year 2 Year 3 Year 4 Year 5
Gross Margin 63.56% 61.02% 61.87% 62.07% 63.29%
Net Margin -13.45% 7.41% 16.57% 20.42% 24.42%
Year 1 Year 2 Year 3 Year 4 Year 5
Days Inventory 6.56 4.20 3.30 2.84 2.50
Fixed Asset T/O 3.33 5.90 8.68 11.91 16.58
Year 1 Year 2 Year 3 Year 4 Year 5
Quick Ratio 8.44 14.21 16.55 16.79 16.47
Year 1 Year 2 Year 3 Year 4 Year 5
Times Interest Earned -4.57 6.24 17.56 27.73 43.00
Profitability
Asset Management
Liquidity
Solvency

Valuation 52
Year 1 Year 2 Year 3 Year 4 Year 5
Free Cash Flow (79,330.28)$ 18,924.00$ 93,046.40$ 141,171.25$ 189,298.59$
No Growth Growth 2.5%
Enterprise value (NPV) 262,882.89$ Enterprise value (NPV) 282,967.34$
Debt 151,186$ Debt 151,186$
Equity value 111,697.29$ Equity value 131,781.74$
Rolling Harvest
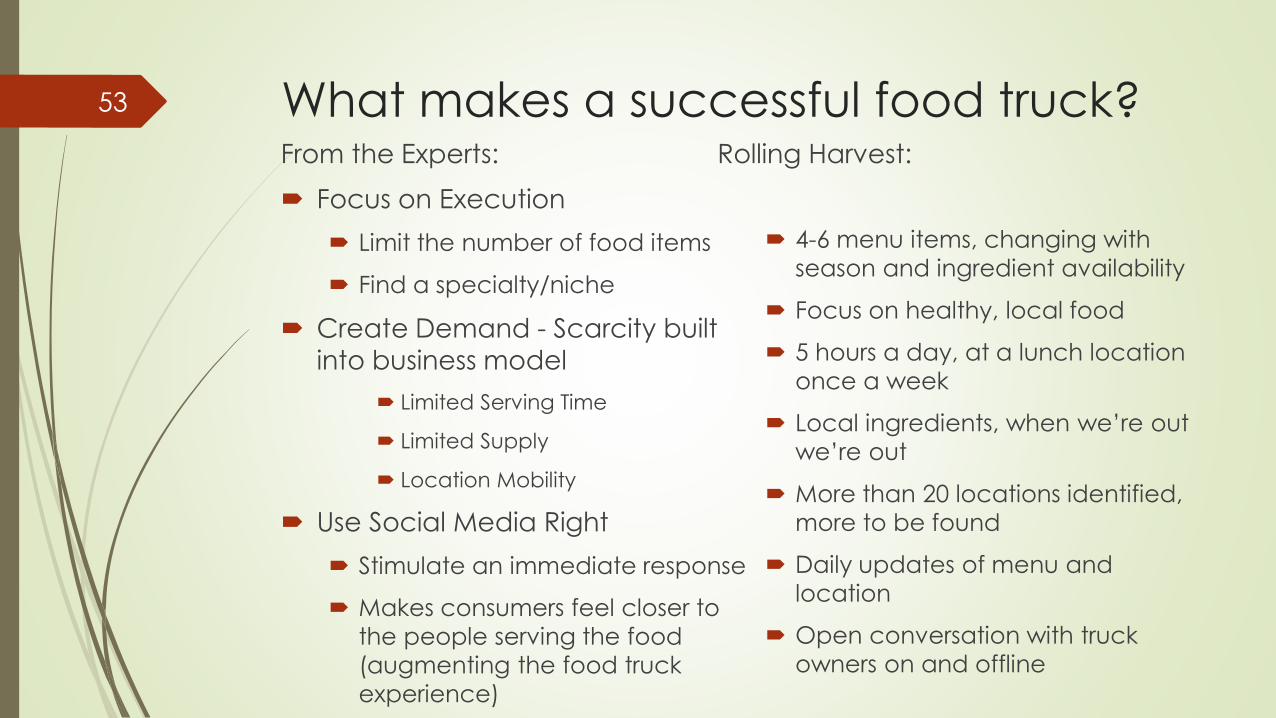
What makes a successful food truck?From the Experts:
Focus on Execution
Limit the number of food items
Find a specialty/niche
Create Demand - Scarcity built
into business model
Limited Serving Time
Limited Supply
Location Mobility
Use Social Media Right
Stimulate an immediate response
Makes consumers feel closer to
the people serving the food
(augmenting the food truck
experience)
53
Rolling Harvest:
4-6 menu items, changing with
season and ingredient availability
Focus on healthy, local food
5 hours a day, at a lunch location
once a week
Local ingredients, when we’re out
we’re out
More than 20 locations identified,
more to be found
Daily updates of menu and
location
Open conversation with truck
owners on and offline

Questions?54

Appendix 1: The success of Chipotle
1600 stores with $3.2B in sales in 2014 (Mathews,
2014)
Stock has grown 1080% since inception
Compared with 46% S&P growth during same time
High quality, locally sourced foods
Served 140m pounds of naturally raised meat in 2013
Bought more than 20m pounds of local produce for its
US restaurants an increase of more than 20% from
2012
55

Appendix 1: The success of Chipotle
(contd.)Currently, 40% of the company's beans are organically
grown, which has helped it to reduce more than 140,000
pounds of chemical pesticide since 2005.
Raised prices and saw 17% sales increase
56
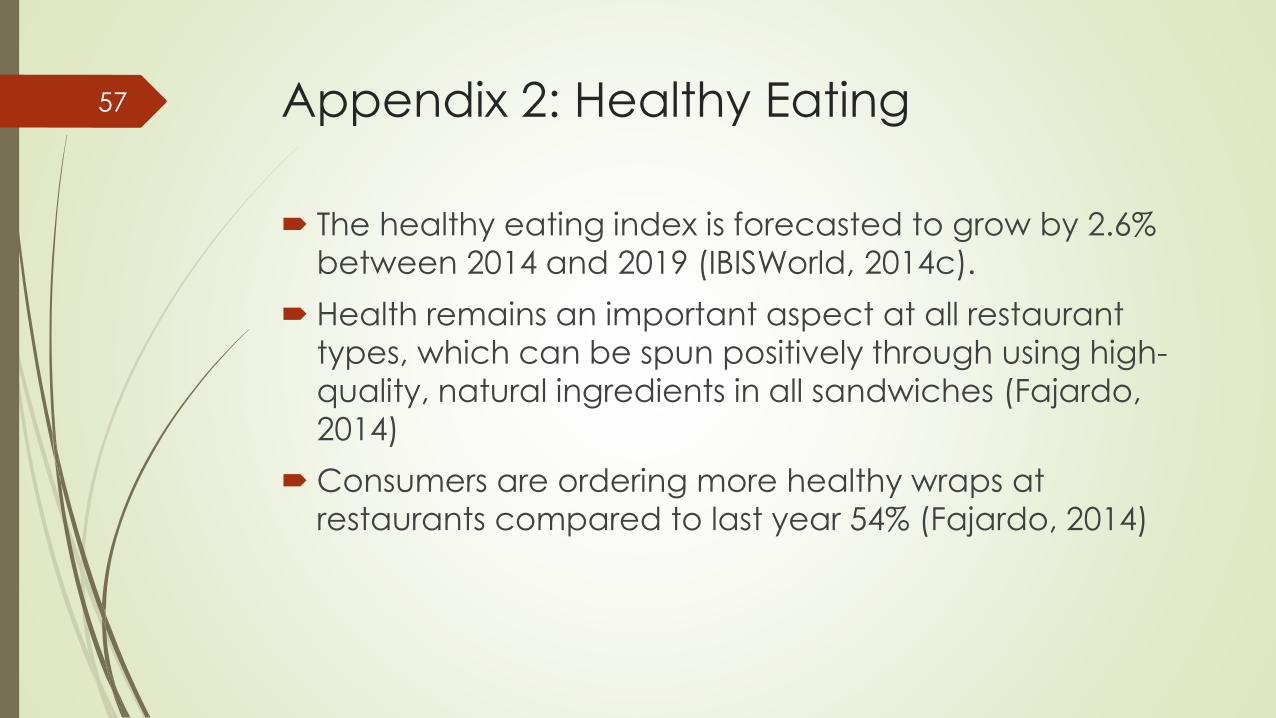
Appendix 2: Healthy Eating
The healthy eating index is forecasted to grow by 2.6%
between 2014 and 2019 (IBISWorld, 2014c).
Health remains an important aspect at all restaurant
types, which can be spun positively through using high-
quality, natural ingredients in all sandwiches (Fajardo,
2014)
Consumers are ordering more healthy wraps at
restaurants compared to last year 54% (Fajardo, 2014)
57

Appendix 3: Locally Sourced
64% of consumers indicate locally sourced
ingredients are important in their food choice
(Mintel, 2013a)
Increased 8% since 2009
96% of consumers have purchased a locally
sourced food (Mintel, 2014a)
53% in the last week
71% in the last month
34% every week
Locally sourced food purchases relatively equal
amongst all household incomes and ethnicities
58

Appendix 4: Fast and Convenient
92% of consumers agree that they eat at
fast food restaurants because “They’re
quick” vs. 63% that choose fast food
restaurants because “They’re inexpensive”
(Fajardo, 2014)
“Those employed are more likely to
purchase fast food” (U.S. Department of
Agriculture, 2014)
48% of consumers said that fast food is “not
too good” for you. 28% said it was “not
good at all” for you (Dugan, 2013)
59

Appendix 5: Organic
Organic food sales in US topped $35B US in
2013, an increase of 11.5% from the previous
year (The Shelby Report, 2014)
65% consumers interested in organic
products (Mintel, 2010)
Largest interest among 18-44 year olds
Above 60% for all household income levels; interest level
increases with income
45% consumers actively seek organic foods
60

Appendix 6: Freshness
“Freshness” traits: (Mintel, 2013a)
Made by the seller from raw ingredients – “made from scratch”
Locally sourced
41% of consumers list fresh ingredients in their top
three most important factors when considering
where to eat
Most important concern when buying fresh fruits
and vegetables, 82% said quality/freshness
How does produce quality at farmers' market
compare to supermarket? 73% say quality is higher
61
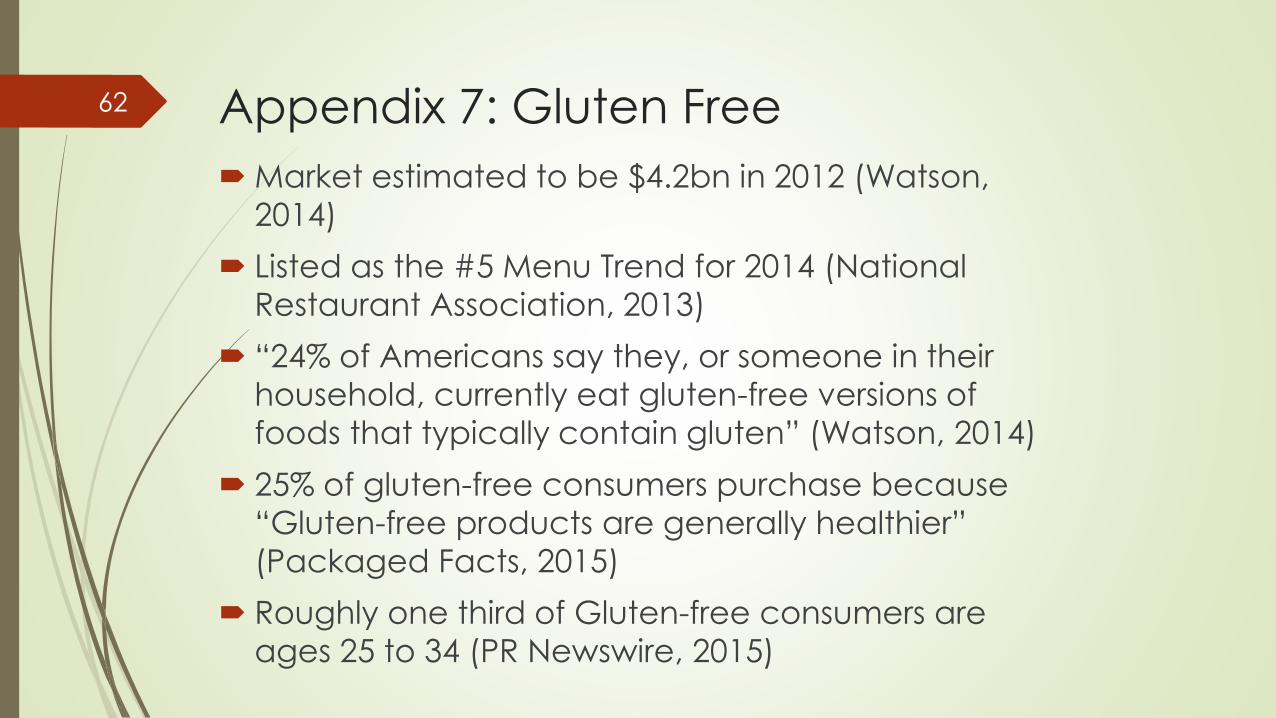
Appendix 7: Gluten Free
Market estimated to be $4.2bn in 2012 (Watson,
2014)
Listed as the #5 Menu Trend for 2014 (National
Restaurant Association, 2013)
“24% of Americans say they, or someone in their
household, currently eat gluten-free versions of
foods that typically contain gluten” (Watson, 2014)
25% of gluten-free consumers purchase because
“Gluten-free products are generally healthier”
(Packaged Facts, 2015)
Roughly one third of Gluten-free consumers are
ages 25 to 34 (PR Newswire, 2015)
62

Appendix 8: Festivals and Events
Food and beverage establishments accounted for
15.9% ($152bn) of the $960.2bn tourism market for
2014 (IBISWorld, 2015b; IBISWorld, 2015c)
Nearly 60% of tourist consumers say “locally-
produced food/drinks that you can’t get anywhere
else” are important when choosing a vacation
destination (Mintel, 2013)
73% say “unique restaurant/dining experiences” are
important (Mintel, 2013)
“More than 2.8 million visitors came through
Bradenton in 2013” (Vargas, 2014)
“Tourist season records hitting new highs” (Griffin,
2013)
63

Appendix 9: Breweries
$5.1 billion market with projected annual growth of
5.5% from 2015-2020 (IBISWorld, 2015a)
47% of consumers “enjoy drinking craft beer with a
meal” (Mintel, 2014b)
53% drink craft beer “to relax” (Mintel, 2014b)
Craft beer appeals to 49% of Millennials and 40% of
Gen Xers (Crowell, 2013)
28% of consumers ages 25-34 drink craft beer “once
a week or more often” (Statista, 2012)
23% of ages 35-44 and 21% 45-54 agree.
64

Appendix 10: Food Truck Tech
Heavy reliance on digital and social media (e.g.,
Facebook and Twitter) for providing menu and locations
“Food trucks are increasingly launching branded apps
to increase customer engagement.” (Hotard, 2014)
“In 2015, food trucks will start adopting alternative
methods such as Apple Pay, QR payments and more.”
(Hotard, 2014)
“In 2015, customers will increasingly order via their
phones” (Hotard, 2014)
65
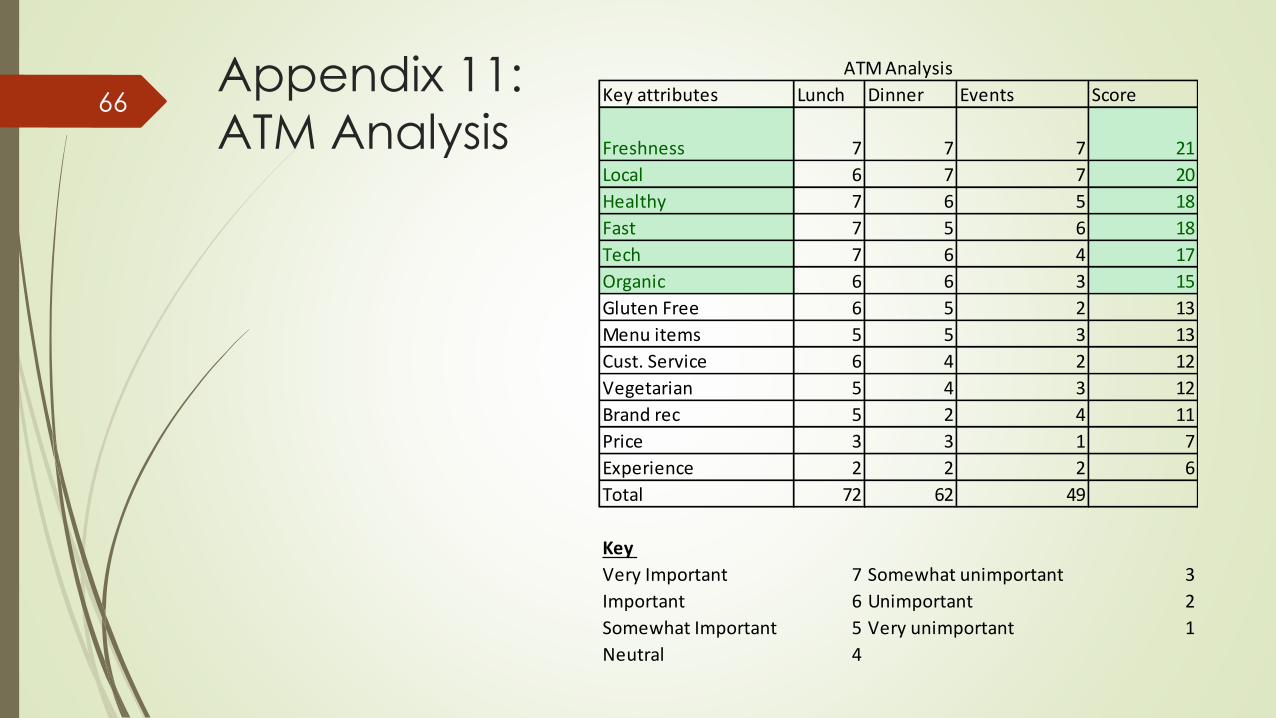
Appendix 11:
ATM AnalysisKey attributes Lunch Dinner Events Score
Freshness 7 7 7 21
Local 6 7 7 20
Healthy 7 6 5 18
Fast 7 5 6 18
Tech 7 6 4 17
Organic 6 6 3 15
Gluten Free 6 5 2 13
Menu items 5 5 3 13
Cust. Service 6 4 2 12
Vegetarian 5 4 3 12
Brand rec 5 2 4 11
Price 3 3 1 7
Experience 2 2 2 6
Total 72 62 49
Key
Very Important 7 Somewhat unimportant 3
Important 6 Unimportant 2
Somewhat Important 5 Very unimportant 1
Neutral 4
ATM Analysis
66

Appendix 12: Competition
Analysis
Us
Baja Boys
Grill
Croz's
Surf
Shack
Darwin's
on 4th
Truck
Rollin'
Zoinks
Attribute rating rating comp rating comp rating comp rating comp
Menu items 6 8 -2 8 -2 9 -3 7 -1
Healthy 8 7 1 3 5 4 4 4 4
Fast 9 3 6 1 8 1 8 7 2
Local 9 7 2 6 3 7 2 5 4
Organic 7 6 1 1 6 5 2 4 3
Freshness 9 7 2 6 3 6 3 7 2
Gluten Free 7 8 -1 1 6 2 5 1 6
Vegetarian 7 5 2 1 6 2 5 6 1
Price 9 8 1 8 1 7 2 9 0
Tech 9 6 3 4 5 3 6 4 5
Cust. Service 8 7 1 5 3 6 2 4 4
Brand rec 1 9 -8 5 -4 9 -8 4 -3
Experience 3 9 -6 6 -3 9 -6 6 -3
Total 2 37 22 24
Competition Analysis
67

Appendix
13: SWOTInternal Strengths Low High Low High
1 2 3 4 5 1 2 3 4 5 Score
Freshness X X 25
Healthy X X 16
Covenient X X 20
Local X X 25
Tech use X X 20
Customer Service X X 15
Perform Importance
Strengths
Internal Weaknesses Low High Low High
1 2 3 4 5 1 2 3 4 5 Score
Brand Recognition X X 3
Menu Size X X 8
Price X X 4
Experience X X 2
Inventory replenishment X X 4
Perform Importance
Weaknesses
68
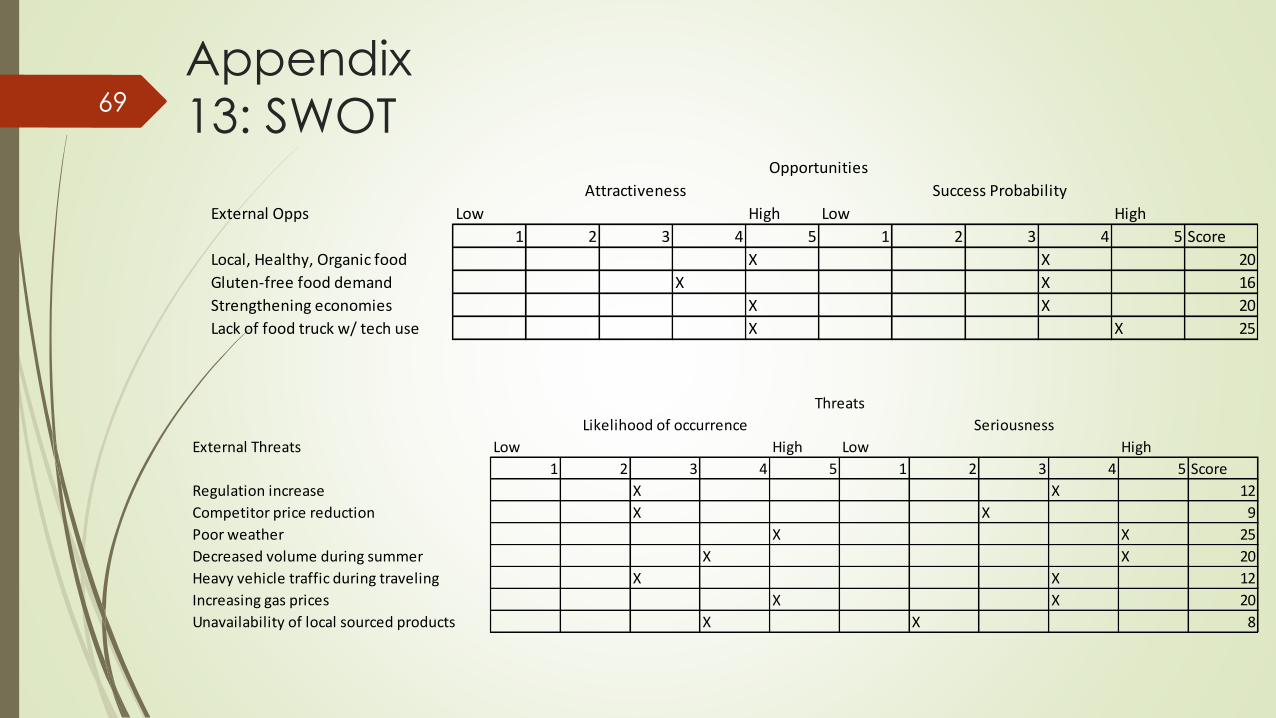
Appendix
13: SWOT
External Opps Low High Low High
1 2 3 4 5 1 2 3 4 5 Score
X X 20
Gluten-free food demand X X 16
Strengthening economies X X 20
Lack of food truck w/ tech use X X 25
Local, Healthy, Organic food
Opportunities
Attractiveness Success Probability
External Threats Low High Low High
1 2 3 4 5 1 2 3 4 5 Score
Regulation increase X X 12
Competitor price reduction X X 9
Poor weather X X 25
Decreased volume during summer X X 20
Heavy vehicle traffic during traveling X X 12
Increasing gas prices X X 20
Unavailability of local sourced products X X 8
Likelihood of occurrence Seriousness
Threats
69
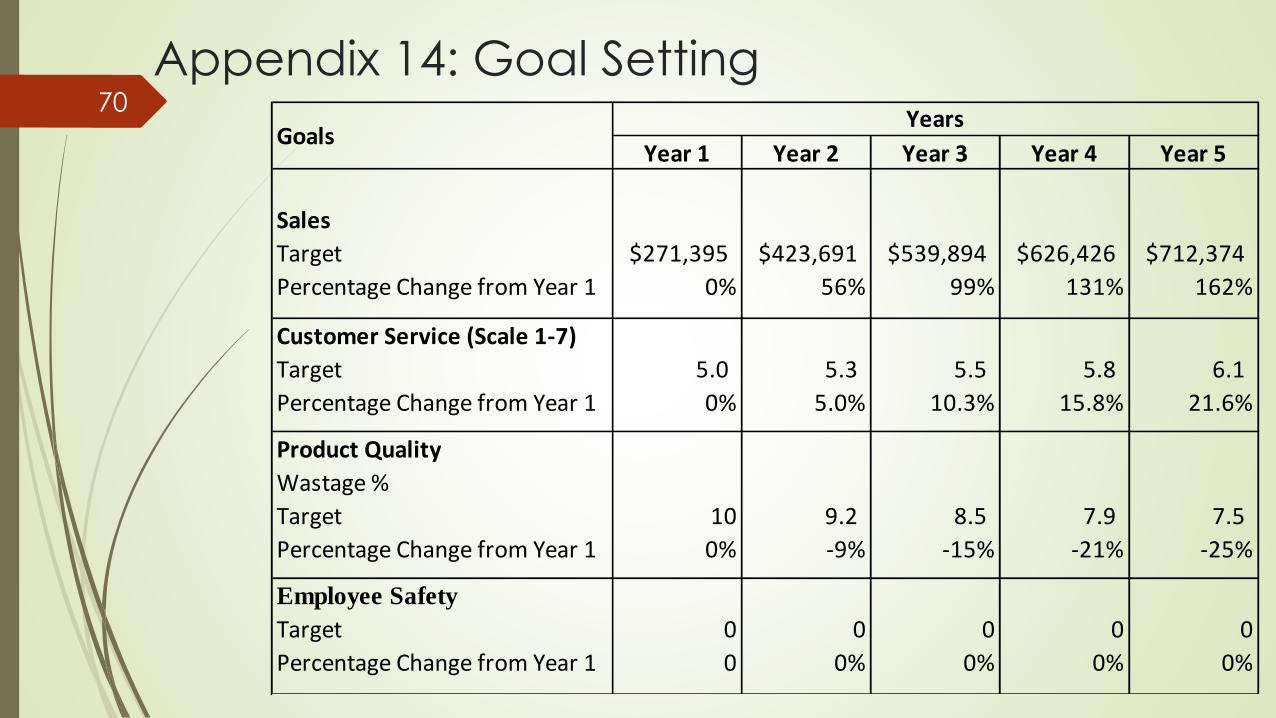
Appendix 14: Goal Setting70
Year 1 Year 2 Year 3 Year 4 Year 5
Sales
Target 271,395$ 423,691$ 539,894$ 626,426$ 712,374$
Percentage Change from Year 1 0% 56% 99% 131% 162%
Customer Service (Scale 1-7)
Target 5.0 5.3 5.5 5.8 6.1
Percentage Change from Year 1 0% 5.0% 10.3% 15.8% 21.6%
Product Quality
Wastage %
Target 10 9.2 8.5 7.9 7.5
Percentage Change from Year 1 0% -9% -15% -21% -25%
Employee Safety
Target 0 0 0 0 0
Percentage Change from Year 1 0 0% 0% 0% 0%
GoalsYears

Sarasota Trade Fair Center
Est. Employees: 347
Pop. w/in 5m: 36,000
Sarasota County
Zone: PID
Tervis Tumbler
Est. Employees: 250
Pop. w/in 5m: 32,000
City of Venice
Zone: PID
Sun Hydraulics
Est. Employees: 200
Pop. w/in 5m: 116,000
Sarasota County
Zone: ILW
State College of Florida
Est. Employees: 472
Pop. w/in 5m: 112,000
Manatee County
Tropicana Products, Inc.
Est. Employees: 600
Pop. w/in 5m: 122,000
City of Bradenton
Zone: PD-UI, LM, CITY, RSF-6
Blake Medical Center
Est. Employees: 200
Pop. w/in 5m: 122,000
City of Bradenton
Manatee Memorial Hospital
Est. Employees: 402
Pop. w/in 5m: 122,000
City of Bradenton
Zone: PD-UI, LM, CITY, RSF-6
USFSM
Students & Faculty: 700
Pop. w/in 5m: 112,000
Manatee County
PGT Industries, Inc.
Est. Employees: 200
Pop. w/in 5m: 32,000
City of Venice
Zone: PID
Lunch Map
71
Lakewood Ranch Medical Center
Est. Employees: 400
Pop. w/in 5m: 112,000
Manatee County
Bealls, Inc.
Est. Employees: 500
Pop. w/in 5m: 122,000
Manatee County
Zone: BR_SD1
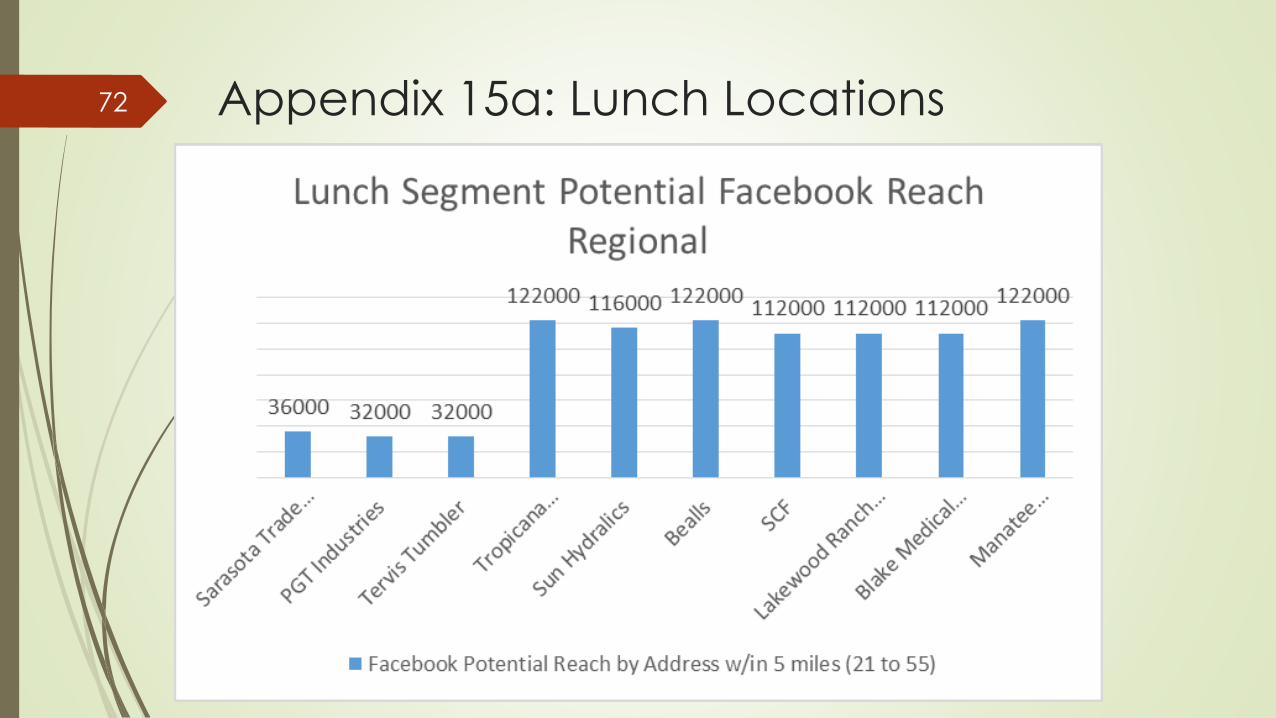
Appendix 15a: Lunch Locations72

Appendix 15b: Lunch Locations73

Big Top Brewing, Co.
Pop. w/in 5m: 82,000
Sarasota County
Zone: ILW
Darwin’s Brewing, Co.
Pop. w/in 5m: 120,000
Manatee County
Green Bench Brewing, Co.
Pop. w/in 5m: 180,000
St. Petersburg, FL
3 Daughters Brewing
Pop. w/in 5m: 184,000
St. Petersburg, FL
Motorworks Brewing
Pop. w/in 5m: 118,000
Manatee County
Jdubs Brewing, Co.
Pop. w/in 5m: 108,000
Sarasota County
Zone: IHD
World of Beer Sarasota
Pop. w/in 5m: 76,000
Manatee County
Dinner Map
74

Appendix 16a:
Dinner Locations: The Breweries75

Appendix 16b: Dinner Locations: The
Breweries
76

Appendix 17:
Food Preparation Chef Schedule Lunch77
Start Time End Time Action Time Ingredient Recipe Equipment Active
7:00 7:05 Clean cauliflower 5 min Cauliflower Mash Comfort Food Sink x
7:05 7:10 Clean veggies 5 min Marinara Sauce Baked Eggplant Sink x
7:10 7:15 Clean eggplant 5 min Eggplant Baked Eggplant Sink x
7:15 7:20 Clean veggies 5 min Veggies Veggie Sink x
7:20 7:25 Clean broccoli 5 min Broccoli Rabe Comfort Food Sink x
7:25 7:30 Clean veggies 5 min Asian Cabbage Thai Steak Sink x
7:30 7:40 Cut veggies 10 min Veggies Veggie Countertop x
7:40 7:50 Cut veggies 10 min Marinara Sauce Baked Eggplant Countertop x
7:50 8:30 Mix ingredients 40 min Dough Tortillas Mixer x
9:30 9:10 Divide dough 40 min Dough Tortillas Countertop x
9:10 9:50 Form dough 40 min Dough Tortillas Countertop x
9:50 10:00 Overall Cleanup 10 min All All None x

Appendix 18: Food Preparation
Equipment Schedule Lunch78
Start Time End Time Action Sink Countertop 1 Countertop 2 Mixer Food processor Stovetop Flattop Grill Oven
7:00 7:05 Clean cauliflower X
7:05 7:10 Clean veggies X
7:10 7:15 Clean eggplant X
7:15 7:20 Clean veggies X
7:20 7:25 Clean broccoli X
7:25 7:30 Clean veggies X
7:25 7:30 Cut cauliflower X
7:30 7:40 Cut veggies X
7:40 7:50 Cut veggies X
8:30 9:10 Divide dough X
9:10 9:50 Form dough X
7:40 7:45 Dry Cauliflower X
8:15 8:20 Mix ingredients X
8:45 8:50 Cool broccoli X
9:40 9:50 Rest steak X
7:50 8:30 Mix ingredients X
7:20 7:25 Mix ingredients X
7:45 7:55 Mix ingredients X
7:30 7:45 Boil cauliflower X
7:55 8:15 Cook veggies X
8:15 9:15 Simmer X
8:20 8:25 Cook ingredients X
8:25 8:35 Cook veggies X
8:35 8:45 Cook ingredients X
8:45 9:00 Cook eggplant X
9:00 9:30 Grill chicken X
9:30 9:40 Grill steak X
9:00 9:30 Bake eggplant X

Appendix 19: Typical Work Week
Open four weekdays plus two weekend Events
Hours worked per Resource
79

Appendix 20:
Thai Steak Wrap
Cost
80

Appendix 21: Depreciation
Five year depreciation of all Equipment
81
Initial Cost Year 1 Year 2 Year 3 Year 4 Year 5
Food Truck 77,698 7,770 7,770 7,770 7,770 7,770
Equipment 7,723 772 772 772 772 772
Promotion 5,225 523 523 523 523 523
POS System 5,715 572 572 572 572 572
Total Depreciation 9,636 9,636 9,636 9,636 9,636

Appendix 22: Cost of Goods Sold82
Year 1 Year 2 Year 3 Year 4 Year 5
Ingredients 98,893 165,163 205,885 237,609 261,478
Propane 1,800 1,836 1,873 1,910 1,948
Cooking Supplies 1,200 1,224 1,248 1,273 1,299
Credit Card Processing 7,945 12,471 16,298 19,010 21,493
50% Miscellaneous 3,000 3,060 3,121 3,184 3,247
Cleaning Supplies 1,800 1,836 1,873 1,910 1,948
Payroll System 288 294 300 306 312
POS System 888 906 924 942 961
Depreciation 9,636 9,636 9,636 9,636 9,636
Total Cost of Goods Sold 98,893 165,163 205,885 237,609 261,478

References A.T. Kearney. (2013). Buying into the Local Food Movement. Retrieved from
http://www.atkearney.com/paper/-/asset_publisher/dVxv4Hz2h8bS/content/buying-
into-the-local-food-movement/10192
Crowell, C. (2013). Craft beer consumer stats: How will they affect your business plan? Craft Brewing Business. Retrieved from http://www.craftbrewingbusiness.com/business-marketing/craft-beer-consumer-stats-how-will-affect-your-business-plan/
Fajardo, K. (2014). LSR: Sandwiches, subs and wraps concepts - US - October 2014. Retrieved from http://academic.mintel.com.ezproxy.lib.usf.edu/display/679795/
Gagliardi, Nancy. (2015). Consumers Want Healthy Foods – And Will Pay More For
Them. Retrieved from
http://www.forbes.com/sites/nancygagliardi/2015/02/18/consumers-want-healthy-
foods-and-will-pay-more-for-them/
Griffin, J. (2013). Tourist season records hitting new highs. SHT. Retrieved from http://www.heraldtribune.com/article/20130310/ARTICLE/130319977?p=1&tc=pg
83

References Hotard, J. (2014). What tech-savvy food trucks will look like in 2015. InnovationInsights.
Retrieved from http://insights.wired.com/profiles/blogs/what-tech-savvy-food-trucks-
will-look-like-in-2015#ixzz3V275BmVe
IBISWorld. (2015a). Craft beer production industry at a glance. Retrieved from
http://clients1.ibisworld.com.ezproxy.lib.usf.edu/reports/us/industry/ataglance.aspx?e
ntid=4302
IBISWorld. (2015b). Tourism industry at a glance. Retrieved from
http://clients1.ibisworld.com.ezproxy.lib.usf.edu/reports/us/industry/ataglance.aspx?e
ntid=2002
IBISWorld. (2015c). [Graph illustration tourism industry products and services
segmentation 2014]. Retrieved from
http://clients1.ibisworld.com.ezproxy.lib.usf.edu/reports/us/industry/
Mathews, B. (2014). Chipotle’s Recipe for Success. The Motley Fool. Retrieved from
http://www.fool.com/investing/general/2014/04/21/chipotles-recipe-for-success.aspx
84
References Mintel. (2013). State tourism - US - August 2013. Retrieved from
http://academic.mintel.com.ezproxy.lib.usf.edu/display/675315/
Mintel. (2014a). The Locavore: Attitudes toward Locally-sourced Foods – US –February 2014. Retrieved from http://academic.mintel.com.ezproxy.lib.usf.edu/display/696804/#figure1
Mintel. (2014b). Craft beer - US - June 2014. Retrieved from http://store.mintel.com/craft-beer-us-june-2014en 2005 and 2010. Retrieved from http://www.usda.gov/wps/portal/usda/usdahome
Statista. (2012). [Graph illustration frequency of craft beer consumption in the United States by age group 2012. Retrieved from http://www.statista.com/statistics/289590/us-frequency-of-craft-beer-consumption-by-age-group/
U.S. Department of Agriculture. (2014). American adults are choosing healthier foods, consuming healthier diets: USDA research shows improvements in diet quality betwecontentidonly=true&contentid=2014/01/0008.xmlDugan, A. (2013). Fast food still major part of U.S. diet: Most Americans believe fast food is not “good for you”. Gallup. Retrieved from http://www.gallup.com/poll/163868/fast-food-major-part-diet.aspx
85

References Vargas, M. (2014). Bradenton tourism enjoys record-breaking growth. ABC
7. Retrieved from http://www.mysuncoast.com/news/local/bradenton-
tourism-enjoys-record-breaking-growth/article_35991de4-d632-11e3-b21c-
001a4bcf6878.html
Watson, Elaine. (2014). What’s the size of the US gluten-free prize? $490m,
$5bn, or $10bn? FoodNavigator. Retrieved from http://www.foodnavigator-
usa.com/Markets/What-s-the-size-of-the-US-gluten-free-prize-490m-5bn-or-
10bnataglance.aspx?entid=2002
86